baby boomers hotspots report 2019 - aegon uk · baby boomer hotspots report identifying the areas...
TRANSCRIPT
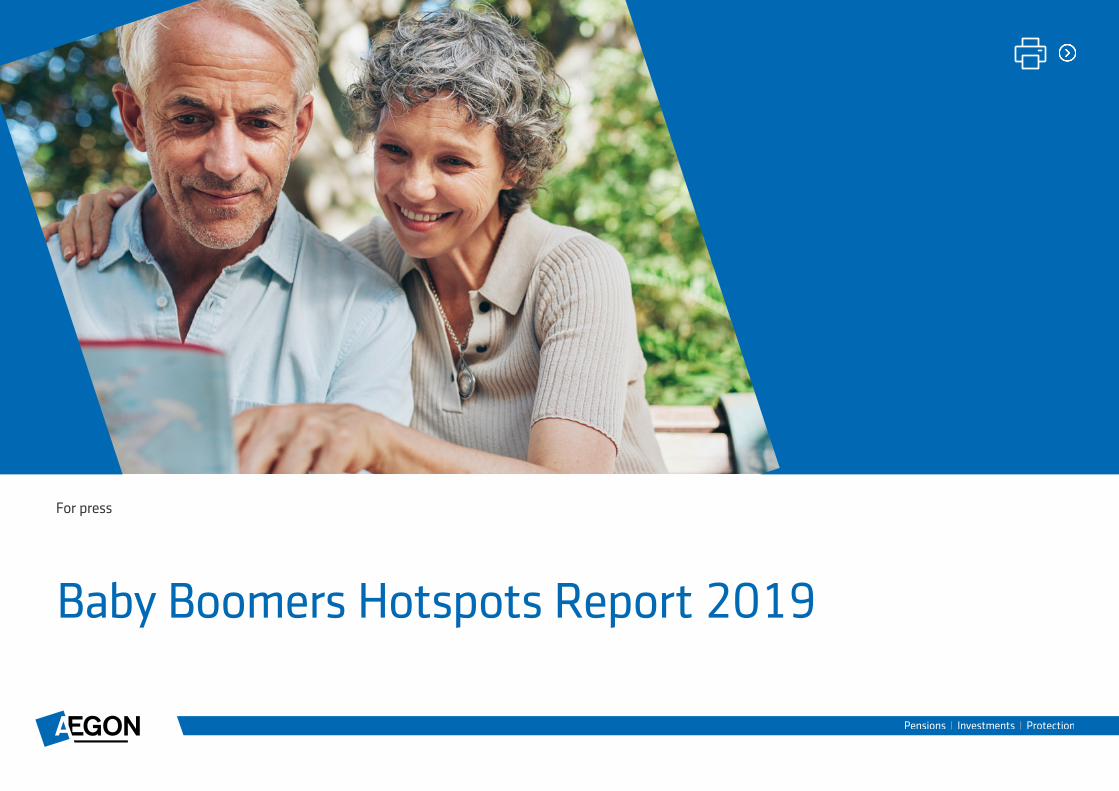
Baby Boomers Hotspots Report 2019
For press
Page 2 of 22
Contents
Introduction 3
What the Baby Boomers mean for the retirement industry 4
Methodology 5
Where are the new pension freedoms beneficiaries? 6
Top 10 Baby Boomer Hotspots in the UK 8
Pen portraits of top 10 Baby Boomer Hotspots 10
Lowest proportion of Baby Boomers 14
Baby Boomer Hotspots - Regional Findings 15

Page 3 of 22
Since the Pension Freedoms were introduced in 2015, people can now access their Defined Contribution (DC) pension savings flexibly from the age of 55. This means that in 2019 nearly a third (31%) of the UK’s population will be above 55 and can decide to release money from their DC pensions if they choose.
To mark this occasion, we have published our latest Baby Boomer Hotspots report identifying the areas of the UK where the greatest proportion of this generation live. We also look at the life expectancies at age 65 in these regions to see how many years this generation will expect to fund in their lives after work.
Baby Boomers are the post-war generation defined more formally as those born between 1946 and 1964. In 2019, they will be aged between 55 and 73 and account for nearly 14.3 million (21.3%) of the UK’s population.
The impact of Baby Boomers on economic and social affairs is significant for a number of reasons. The first is that people over 55 hold the majority of the UK’s wealth, accumulated through factors such as generous Defined Benefit (DB) pensions, the long-term rise in the stock market and the boom in house prices. With the introduction of the pension freedoms, the personal wealth of this generation has become much more flexible giving them significantly more choice about how they spend their money in retirement.
Introduction
Baby Boomers are the post-war generation defined more formally as those born between 1946 and 1964. In 2019, they will be aged between 55 and 73 and account for nearly 14.3 million (21.3%) of the UK’s population.
In 2019, official projections show that nearly 1 million people will reach their 55th birthday and with it the final members of the Baby Boomer generation will be reaching the age they can access their pensions.
Page 4 of 22
What the Baby Boomers mean for the retirement industry
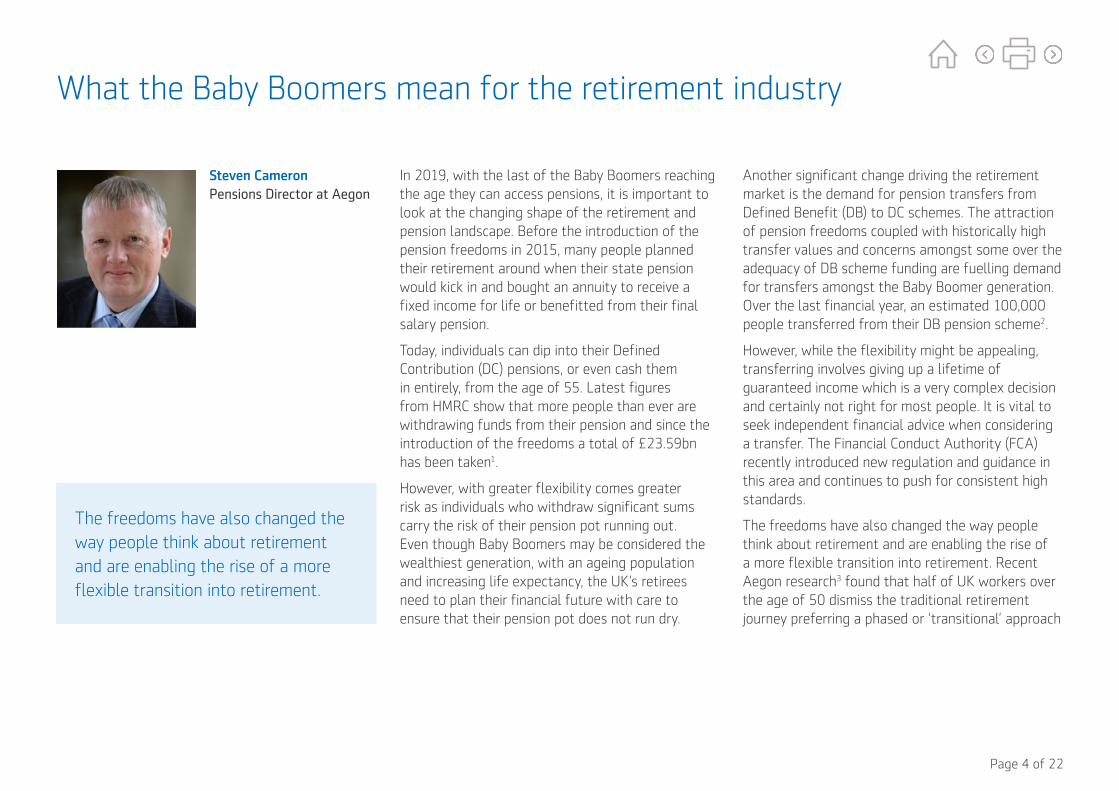
Steven Cameron Pensions Director at Aegon
In 2019, with the last of the Baby Boomers reaching the age they can access pensions, it is important to look at the changing shape of the retirement and pension landscape. Before the introduction of the pension freedoms in 2015, many people planned their retirement around when their state pension would kick in and bought an annuity to receive a fixed income for life or benefitted from their final salary pension.
Today, individuals can dip into their Defined Contribution (DC) pensions, or even cash them in entirely, from the age of 55. Latest figures from HMRC show that more people than ever are withdrawing funds from their pension and since the introduction of the freedoms a total of £23.59bn has been taken1.
However, with greater flexibility comes greater risk as individuals who withdraw significant sums carry the risk of their pension pot running out. Even though Baby Boomers may be considered the wealthiest generation, with an ageing population and increasing life expectancy, the UK’s retirees need to plan their financial future with care to ensure that their pension pot does not run dry.
Another significant change driving the retirement market is the demand for pension transfers from Defined Benefit (DB) to DC schemes. The attraction of pension freedoms coupled with historically high transfer values and concerns amongst some over the adequacy of DB scheme funding are fuelling demand for transfers amongst the Baby Boomer generation. Over the last financial year, an estimated 100,000 people transferred from their DB pension scheme2.
However, while the flexibility might be appealing, transferring involves giving up a lifetime of guaranteed income which is a very complex decision and certainly not right for most people. It is vital to seek independent financial advice when considering a transfer. The Financial Conduct Authority (FCA) recently introduced new regulation and guidance in this area and continues to push for consistent high standards.
The freedoms have also changed the way people think about retirement and are enabling the rise of a more flexible transition into retirement. Recent Aegon research3 found that half of UK workers over the age of 50 dismiss the traditional retirement journey preferring a phased or ‘transitional’ approach
The freedoms have also changed the way people think about retirement and are enabling the rise of a more flexible transition into retirement.
Page 5 of 22
whereby they continue to work later on in life but in a reduced capacity. The pension freedoms cater for this as people can start to access some of their retirement savings to support their reduced earnings from working.
It is clear, therefore, that the pensions industry finds itself in a period of significant change not only as a result of the pension freedoms, but also by the evolving demographics in the UK, which come alongside increases to the state pension age. Baby Boomers are growing older and people are living longer than ever before. Many have accumulated significant wealth from their pension savings alongside property and other savings vehicles such as ISAs. Seeking independent financial advice will be important to understand the best way to release income in a tax efficient manner across all forms of pension, savings and property wealth.
We are focused on supporting advisers and consumers through these changes, to meet evolving needs not only as individuals save for retirement but also as they begin to take income to reap the benefits of their hard earned savings.
Methodology
Through gathering official population projections by gender, local authority (LA) and single year of age for England, Scotland, Northern Ireland and Wales, we identified the number of people in each LA who will be aged 55-73 in 20194. Dividing this number by the projected total population in each LA allowed us to see the proportion of Baby Boomers and rank these from highest to lowest throughout the UK.
Additional information on the latest life expectancy figures at age 655 released by the Office for National Statistics (ONS) supplemented the research and allowed us to provide further analysis on each region.

Page 6 of 22
Largest number of people aged 55
Local Authority Total number of 55 year olds
Total number of people
55 year olds % of overall population
London* 108,125 9,056,740 1.19%
Birmingham 12,720 1,156,186 1.10%
Leeds 9,662 795,641 1.21%
Cornwall 8,610 566,610 1.52%
Glasgow City 8,372 626,791 1.34%
County Durham 8,056 526,898 1.53%
Wiltshire 7,652 503,652 1.52%
Sheffield 6,865 585,240 1.17%
Bradford 6,645 536,794 1.24%
City of Edinburgh 6,359 522,472 1.22%
*London is made up of 33 Local Authorities
Where are the new pension freedoms beneficiaries?
The introduction of the pension freedoms in 2015 means that people can now access their Defined Contribution pensions from the age of 55. Initial evidence suggests this has led to a dramatic shift in behaviour with numbers buying annuities falling and many more consumers favouring drawdown products. Figures from the Financial Conduct Authority (FCA), show that twice as many pension pots are being moved into drawdown as are into annuities6. However, whilst there was a spike in people accessing their cash after the freedoms were introduced, the FCA suggest there is little evidence that people are being rash with their retirement funds.
The volume of transfers from Defined Benefit pensions has also soared since the introduction of the pension freedoms as savers have been looking to move their DB pots into DC schemes in order to access their money flexibly. A freedom of information request to the FCA showed that in the six months to March 2018, DB transfers were 587% higher than same period to March 20167.
Our analysis found that nationwide there will be nearly 1 million people at age 55 in 2019 accounting for 1.39% of the total UK population. The two Local Authorities with the smallest population size, the City of London and the Isles of Scilly, are projected to have the highest proportion of people aged 55 in 2019.

Page 7 of 22
Highest percentage of people aged 55
Local Authority Total number of 55 year olds
Total number of people
55 year olds % of overall population
City of London 136 6,513 2.09%
Isles of Scilly 42 2,276 1.85%
Melton 903 51,162 1.76%
West Devon 965 55,249 1.75%
Daventry 1,424 82,521 1.73%
Ribble Valley 1,018 59,324 1.72%
Monmouthshire 1,590 93,070 1.71%
Ryedale 935 54,764 1.71%
High Peak 1,569 92,069 1.70%
South Northamptonshire 1,562 92,033 1.70%
Regional breakdown of people aged 55
Local Authority Total number of 55 year olds
Total number of people
55 year olds % of overall population
Scotland 81,408 5,470,324 1.49%
North East 38,671 2,655,389 1.46%
South West 81,654 5,631,868 1.45%
South East 132,072 9,214,203 1.43%
Wales 44,795 3,133,336 1.43%
East Midlands 68,835 4,816,807 1.43%
North West 103,340 7,306,975 1.41%
Eastern England 88,220 6,269,281 1.41%
N. Ireland 26,269 1,888,062 1.39%
Yorkshire 76,033 5,491,745 1.38%
West Midlands 79,925 5,914,310 1.35%
Outer London 68,704 5,414,033 1.27%
Inner London 39,421 3,642,707 1.08%

Page 8 of 22
Top 10 Baby Boomer Hotspots in the UK
Rank Local Authority County/RegionTotal number of Baby Boomers
Baby Boomers as % of overall population
Average Life Expectancy at age 65
1 West Somerset Somerset, South West 11,513 33.39% 21.1
2 North Norfolk Norfolk, East 32,817 31.34% 21.1
3 East Lindsey Lincolnshire, East Midlands 43,307 30.98% 19.5
4 Rother East Sussex, South East 29,239 30.46% 21.0
5 South Hams Devon, South West 26,055 30.43% 21.2
6 West Dorset Dorset, South West 31,052 30.22% 20.9
7 West Devon Devon, South West 16,599 30.04% 20.9
8 Torridge Devon, South West 20,483 29.83% 20.1
9Derbyshire Dales
Derbyshire, East Midlands 21,242 29.70% 20.1
10 South Lakeland Cumbria, North West 30,485 29.45% 21.2
West Somerset is projected to have the highest number of Baby Boomers in the UK in 2019. Over one third (33.39%) of the population will be aged between 55-73 years, a total of 11,513 people from the population of 34,476. The coastal region has an average life expectancy of 21.1 years at 65. With an average life expectancy of 21.1 at age 65, South Lakeland has the highest average life expectancy out of the top 10 baby boomer hotspots.
ENGLAND
WALES
SCOTLAND
REPUBLIC OFIRELAND
NORTHERN IRELAND 10
78
51
3
2
9
4

Page 9 of 22
19% 20% 20% 21% 21% 22% 22% 23% 23% 24% 24%
England
N.Ireland
Scotland
Wales
% Baby Boomers of total population (2019)
5 out of the top 10 Baby Boomer hotspots are projected to be in South West of England and over the coming years this region will see a significant demographic change as the population grows older.
Despite the high concentration in these regions, at ‘country’ level, Wales and Scotland are forecast to have a higher proportion of Baby Boomers than England. 23.4% of the Welsh population will be aged 55-73 in 2019 and Scotland will have 23.2% in this age bracket. Northern Ireland will have the smallest proportion of 20.5%.
Page 10 of 22
Pen portraits of top 10 Baby Boomer Hotspots
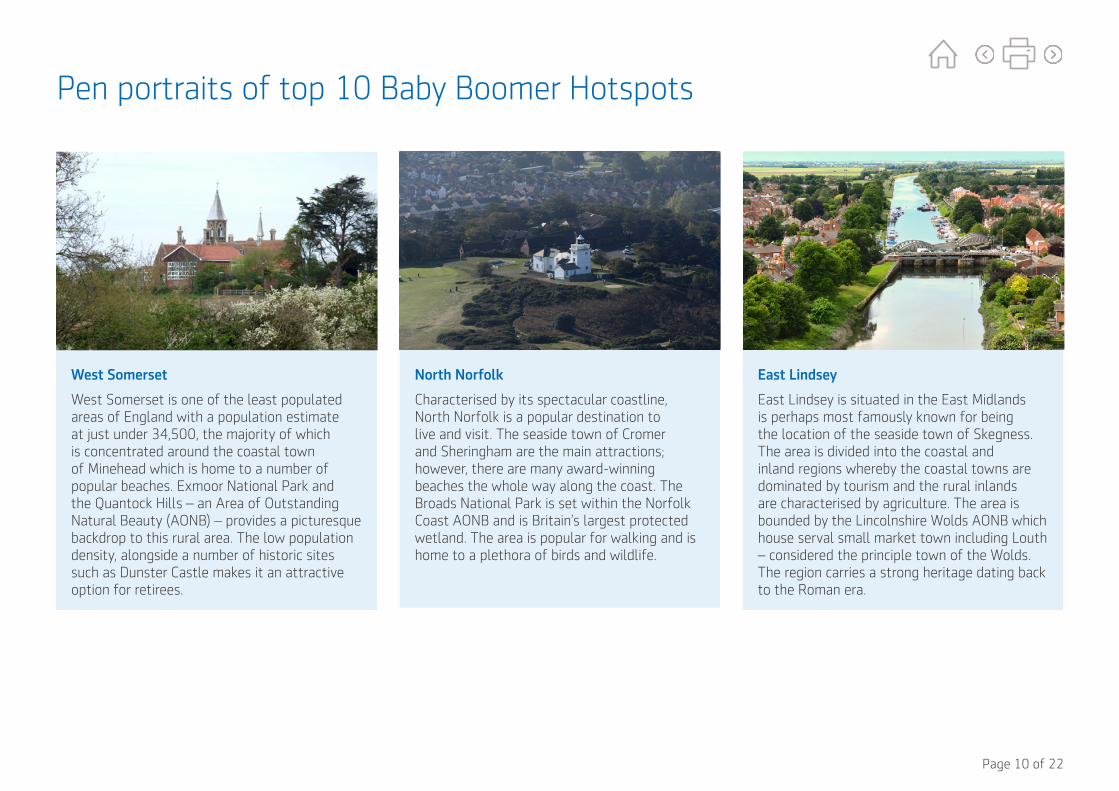
West Somerset
West Somerset is one of the least populated areas of England with a population estimate at just under 34,500, the majority of which is concentrated around the coastal town of Minehead which is home to a number of popular beaches. Exmoor National Park and the Quantock Hills – an Area of Outstanding Natural Beauty (AONB) – provides a picturesque backdrop to this rural area. The low population density, alongside a number of historic sites such as Dunster Castle makes it an attractive option for retirees.
East Lindsey
East Lindsey is situated in the East Midlands is perhaps most famously known for being the location of the seaside town of Skegness. The area is divided into the coastal and inland regions whereby the coastal towns are dominated by tourism and the rural inlands are characterised by agriculture. The area is bounded by the Lincolnshire Wolds AONB which house serval small market town including Louth – considered the principle town of the Wolds. The region carries a strong heritage dating back to the Roman era.
North Norfolk
Characterised by its spectacular coastline, North Norfolk is a popular destination to live and visit. The seaside town of Cromer and Sheringham are the main attractions; however, there are many award-winning beaches the whole way along the coast. The Broads National Park is set within the Norfolk Coast AONB and is Britain’s largest protected wetland. The area is popular for walking and is home to a plethora of birds and wildlife.
Page 11 of 22
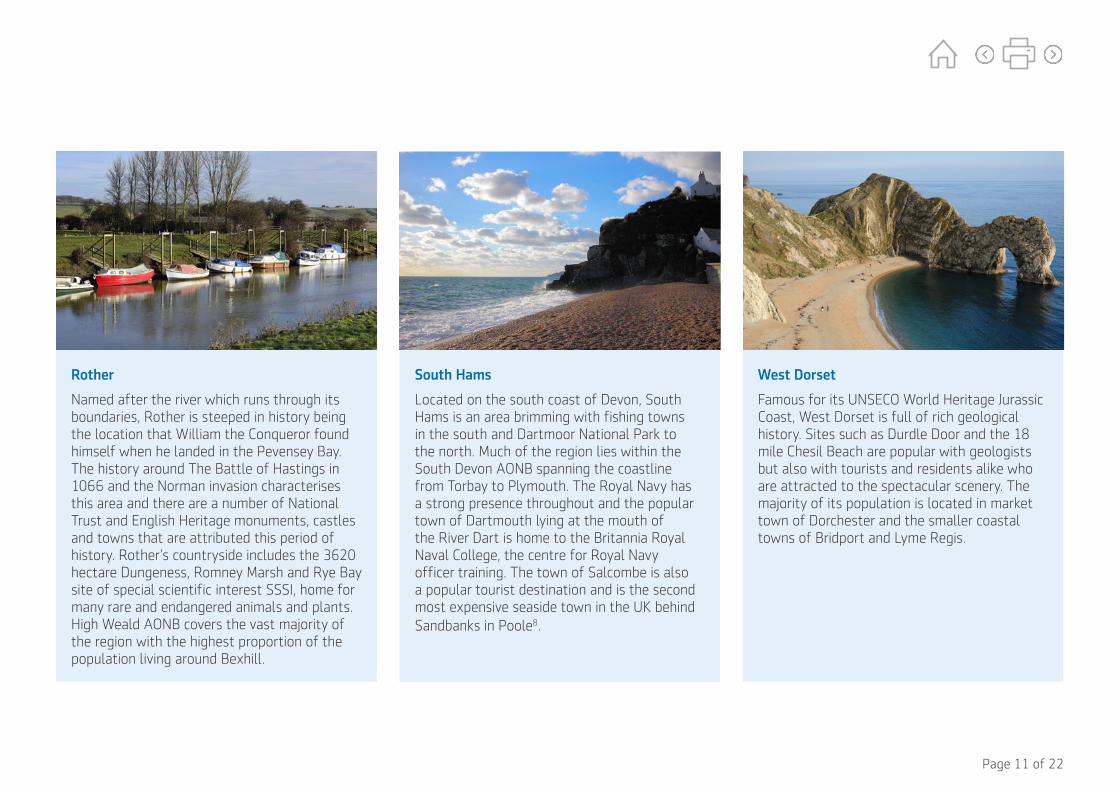
Rother
Named after the river which runs through its boundaries, Rother is steeped in history being the location that William the Conqueror found himself when he landed in the Pevensey Bay. The history around The Battle of Hastings in 1066 and the Norman invasion characterises this area and there are a number of National Trust and English Heritage monuments, castles and towns that are attributed this period of history. Rother’s countryside includes the 3620 hectare Dungeness, Romney Marsh and Rye Bay site of special scientific interest SSSI, home for many rare and endangered animals and plants. High Weald AONB covers the vast majority of the region with the highest proportion of the population living around Bexhill.
West Dorset
Famous for its UNSECO World Heritage Jurassic Coast, West Dorset is full of rich geological history. Sites such as Durdle Door and the 18 mile Chesil Beach are popular with geologists but also with tourists and residents alike who are attracted to the spectacular scenery. The majority of its population is located in market town of Dorchester and the smaller coastal towns of Bridport and Lyme Regis.
South Hams
Located on the south coast of Devon, South Hams is an area brimming with fishing towns in the south and Dartmoor National Park to the north. Much of the region lies within the South Devon AONB spanning the coastline from Torbay to Plymouth. The Royal Navy has a strong presence throughout and the popular town of Dartmouth lying at the mouth of the River Dart is home to the Britannia Royal Naval College, the centre for Royal Navy officer training. The town of Salcombe is also a popular tourist destination and is the second most expensive seaside town in the UK behind Sandbanks in Poole8.

Page 12 of 22
West Devon
West Devon is dominated by Dartmoor National Park and the Tamar Valley AONB, an area famous for its mining heritage landscape. This is part of the reason that aside from West Somerset, the region has the smallest population in the top 10 Baby Boomer hotspots – estimated at just over 55,000 people. The majority of its population are cluster around the market towns of Tavistock, birthplace of Sir Francis Drake, and Oakhampton which is situated at the northern edge of Dartmoor.
Derbyshire Dales
A Large part of Derbyshire Dales is situated in the Peak District National Park with the majority of its population living along the River Derwent. The area is characterised by picturesque villages and market towns with unique Georgian streets. There is also a wealth of historic houses, including one of the UK’s favourite country houses, Chatsworth House. The Derwent Valley, within the region, has been named a UNSECO World heritage Site as it contains a number of 18th century cotton mills which paved the way for industrial factories around the world.
Torridge
Torridge is the final local authority in the top 10 Baby Boomer hotspots located in the South West of England. Named after the River Torridge that runs through it, the region covers a large part of North Devon. Although the area does not attracting as many tourists or residents than the hotspots in South Devon, there are still some spectacular landscapes such as the Hartland Peninsula AONB and the island of Lundy, England’s first Martine Nature Reverse.

Page 13 of 22
South Lakeland
South Lakeland is the local authority in Cumbria, it includes much of the Lake District National Park as well as the North West corner of the Yorkshire Dales National Park. The Lake District is a tourist hotspot with people flocking to the mountainous region which was designated a UNESCO World Heritage Site in 2017. The market town of Kendal is home to a significant proportion of its population; however, other areas such as Windermere and Ambleside are also popular destinations with residents located near to the largest natural lake in England.
Page 14 of 22
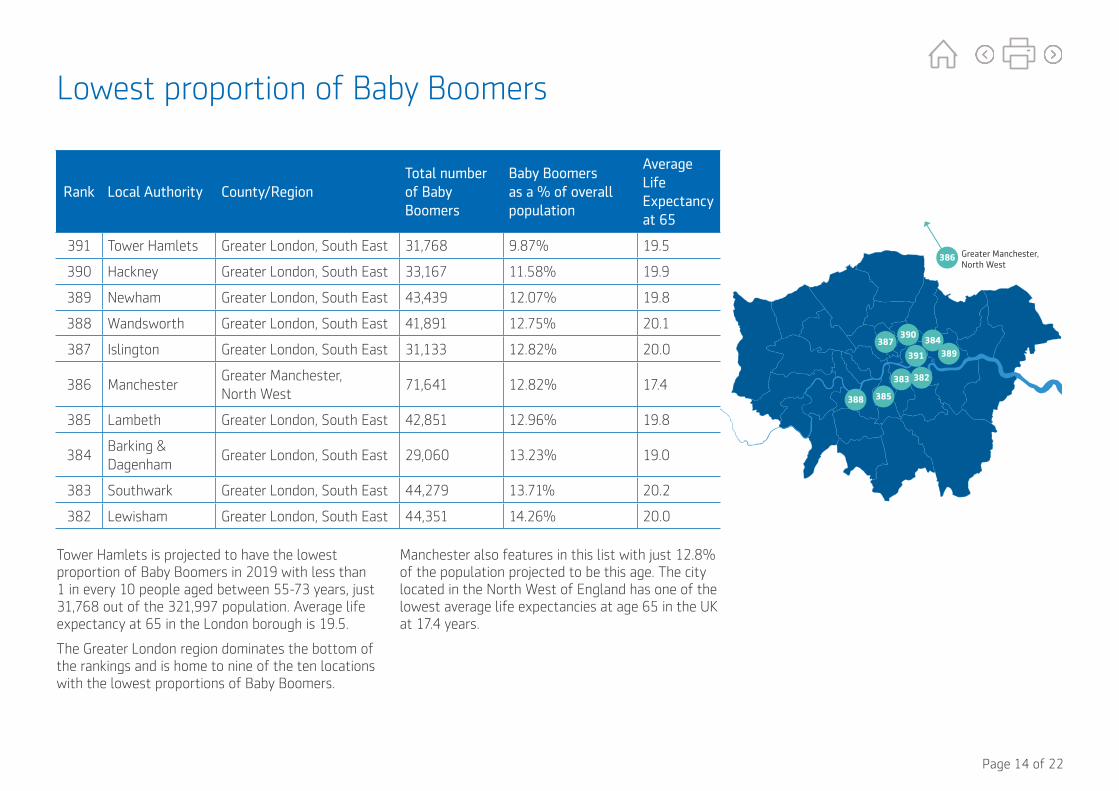
Tower Hamlets is projected to have the lowest proportion of Baby Boomers in 2019 with less than 1 in every 10 people aged between 55-73 years, just 31,768 out of the 321,997 population. Average life expectancy at 65 in the London borough is 19.5.
The Greater London region dominates the bottom of the rankings and is home to nine of the ten locations with the lowest proportions of Baby Boomers.
Manchester also features in this list with just 12.8% of the population projected to be this age. The city located in the North West of England has one of the lowest average life expectancies at age 65 in the UK at 17.4 years.
Lowest proportion of Baby Boomers
Rank Local Authority County/RegionTotal number of Baby Boomers
Baby Boomers as a % of overall population
Average Life Expectancy at 65
391 Tower Hamlets Greater London, South East 31,768 9.87% 19.5
390 Hackney Greater London, South East 33,167 11.58% 19.9
389 Newham Greater London, South East 43,439 12.07% 19.8
388 Wandsworth Greater London, South East 41,891 12.75% 20.1
387 Islington Greater London, South East 31,133 12.82% 20.0
386 ManchesterGreater Manchester, North West
71,641 12.82% 17.4
385 Lambeth Greater London, South East 42,851 12.96% 19.8
384Barking & Dagenham
Greater London, South East 29,060 13.23% 19.0
383 Southwark Greater London, South East 44,279 13.71% 20.2
382 Lewisham Greater London, South East 44,351 14.26% 20.0
401 Greater Manchester, North West
391
390
389
388
387
385
384
383 382
386
Page 15 of 22
Baby Boomer Hotspots - Regional FindingsThe following tables show the Baby Boomer Hotspots for each of the regions in England as well as detailed findings for Scotland, Wales and Northern Ireland.
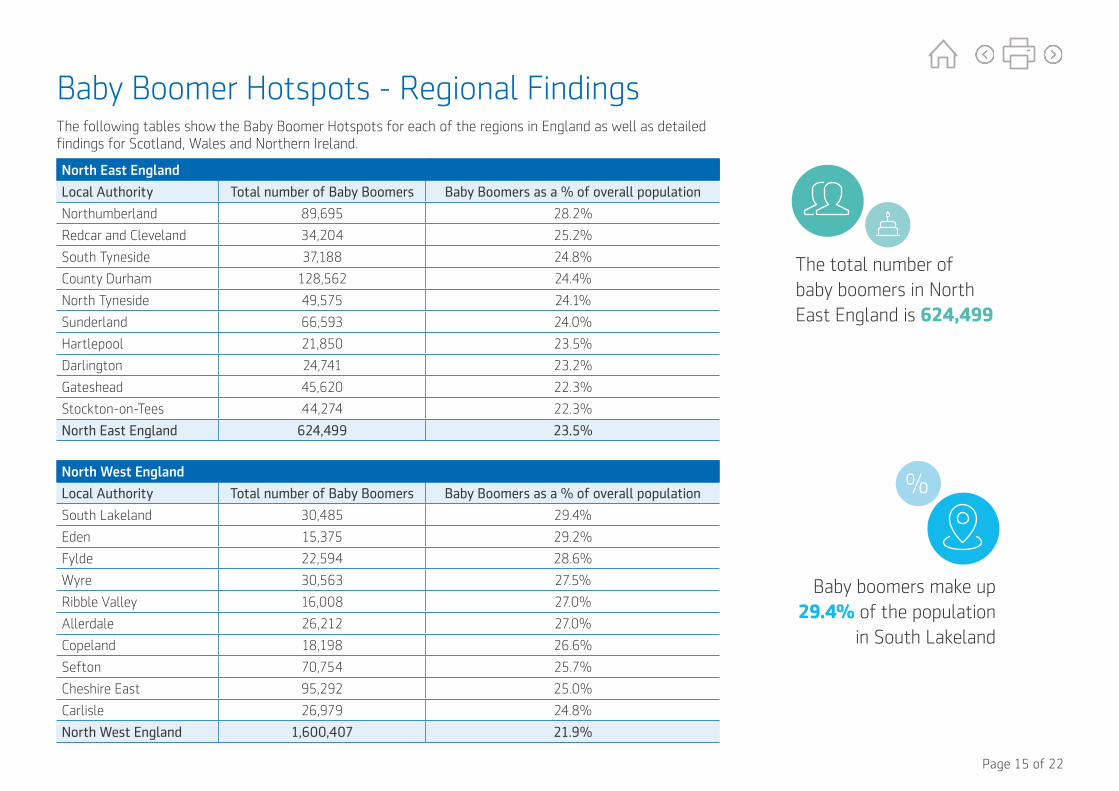
North East England
Local Authority Total number of Baby Boomers Baby Boomers as a % of overall population
Northumberland 89,695 28.2%
Redcar and Cleveland 34,204 25.2%
South Tyneside 37,188 24.8%
County Durham 128,562 24.4%
North Tyneside 49,575 24.1%
Sunderland 66,593 24.0%
Hartlepool 21,850 23.5%
Darlington 24,741 23.2%
Gateshead 45,620 22.3%
Stockton-on-Tees 44,274 22.3%
North East England 624,499 23.5%
North West England
Local Authority Total number of Baby Boomers Baby Boomers as a % of overall population
South Lakeland 30,485 29.4%
Eden 15,375 29.2%
Fylde 22,594 28.6%
Wyre 30,563 27.5%
Ribble Valley 16,008 27.0%
Allerdale 26,212 27.0%
Copeland 18,198 26.6%
Sefton 70,754 25.7%
Cheshire East 95,292 25.0%
Carlisle 26,979 24.8%
North West England 1,600,407 21.9%
The total number of baby boomers in North East England is 624,499
Baby boomers make up 29.4% of the population
in South Lakeland

Page 16 of 22
Yorkshire and the Humber
Local Authority Total number of Baby Boomers Baby Boomers as a % of overall population
Scarborough 31,307 29.0%
Ryedale 15,848 28.9%
Craven 16,351 28.9%
East Riding of Yorkshire 95,264 28.1%
Hambleton 25,433 28.0%
Harrogate 40,977 25.5%
Selby 22,185 25.0%
North Lincolnshire 42,575 24.7%
Richmondshire 13,076 24.6%
North East Lincolnshire 36,983 23.2%
Yorkshire & the Humber 1,193,349 21.7%
East Midlands
Local Authority Total number of Baby Boomers Baby Boomers as a % of overall population
East Lindsey 43,307 31.0%
Derbyshire Dales 21,242 29.7%
West Lindsey 26,264 27.3%
North East Derbyshire 26,799 26.5%
Melton 13,420 26.2%
High Peak 23,984 26.1%
Rutland 10,211 26.0%
Daventry 21,222 25.7%
Bassetlaw 29,830 25.7%
South Kesteven 37,003 25.7%
East Midlands 1,082,592 22.5%
The total number of baby boomers in Yorkshire and the Humber is 1,193,349
Baby boomers make up 31.0% of the population
in East Lindsey
Page 17 of 22
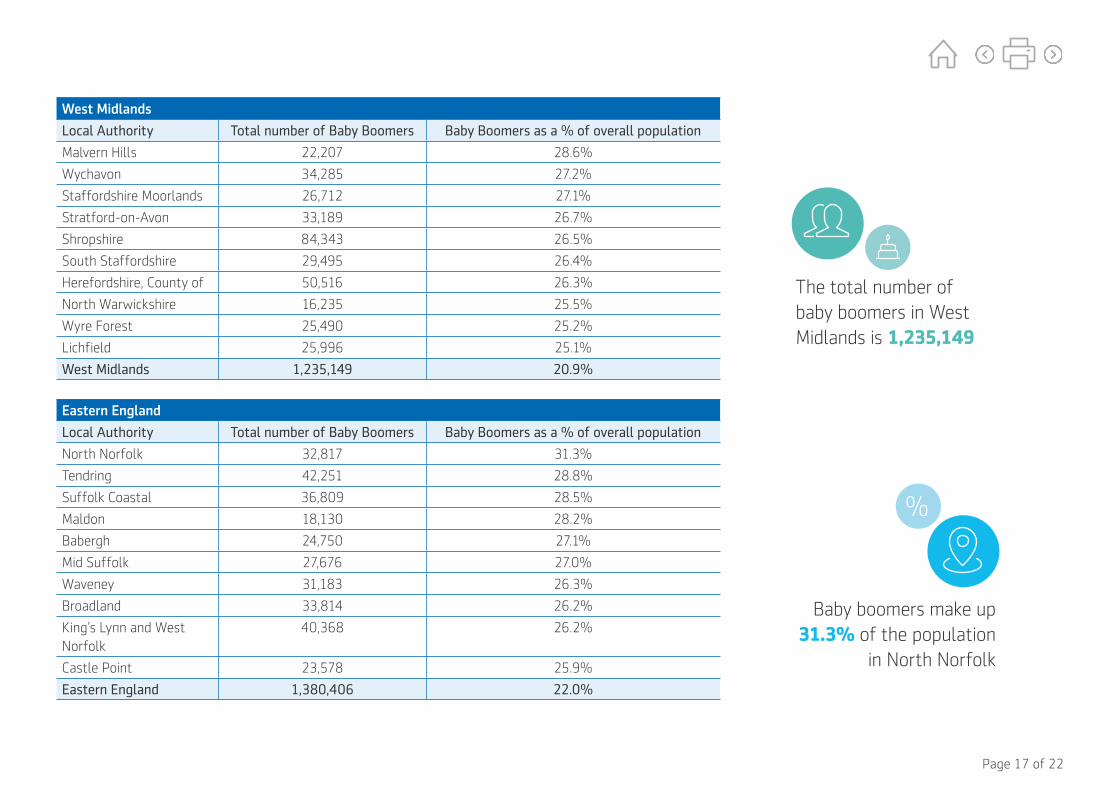
West Midlands
Local Authority Total number of Baby Boomers Baby Boomers as a % of overall population
Malvern Hills 22,207 28.6%
Wychavon 34,285 27.2%
Staffordshire Moorlands 26,712 27.1%
Stratford-on-Avon 33,189 26.7%
Shropshire 84,343 26.5%
South Staffordshire 29,495 26.4%
Herefordshire, County of 50,516 26.3%
North Warwickshire 16,235 25.5%
Wyre Forest 25,490 25.2%
Lichfield 25,996 25.1%
West Midlands 1,235,149 20.9%
Eastern England
Local Authority Total number of Baby Boomers Baby Boomers as a % of overall population
North Norfolk 32,817 31.3%
Tendring 42,251 28.8%
Suffolk Coastal 36,809 28.5%
Maldon 18,130 28.2%
Babergh 24,750 27.1%
Mid Suffolk 27,676 27.0%
Waveney 31,183 26.3%
Broadland 33,814 26.2%
King’s Lynn and West Norfolk
40,368 26.2%
Castle Point 23,578 25.9%
Eastern England 1,380,406 22.0%
The total number of baby boomers in West Midlands is 1,235,149
Baby boomers make up 31.3% of the population
in North Norfolk
Page 18 of 22
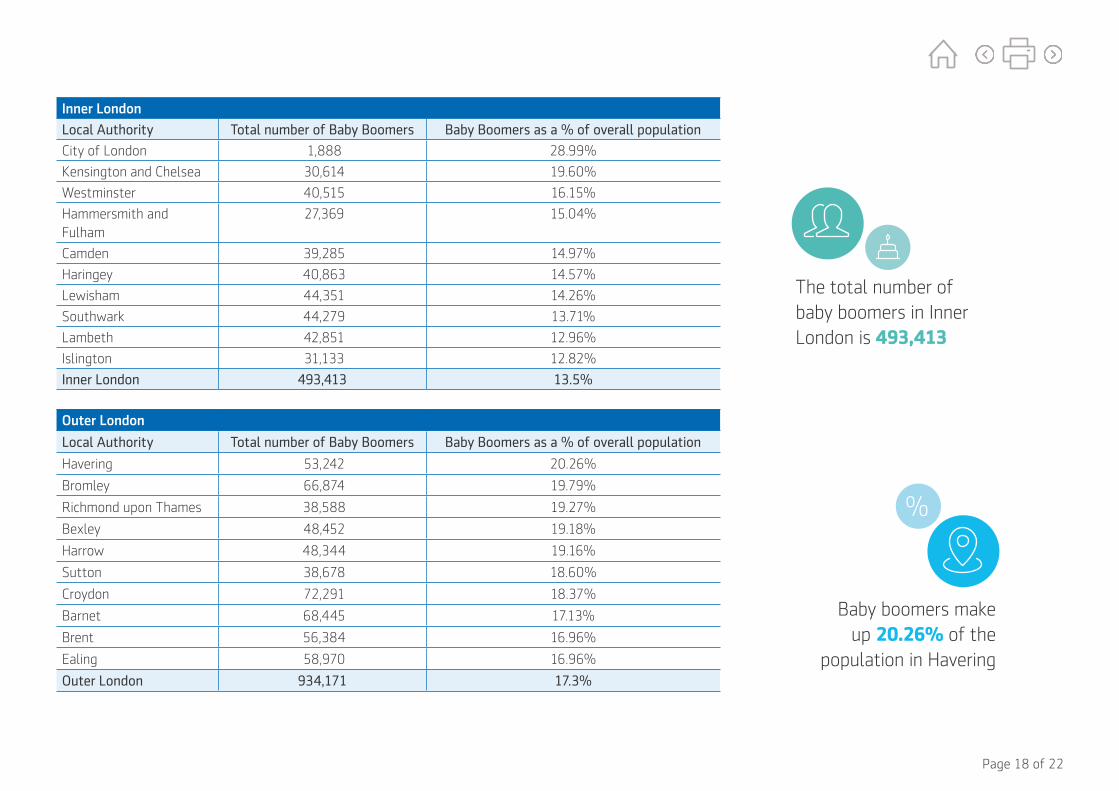
Inner London
Local Authority Total number of Baby Boomers Baby Boomers as a % of overall population
City of London 1,888 28.99%
Kensington and Chelsea 30,614 19.60%
Westminster 40,515 16.15%
Hammersmith and Fulham
27,369 15.04%
Camden 39,285 14.97%
Haringey 40,863 14.57%
Lewisham 44,351 14.26%
Southwark 44,279 13.71%
Lambeth 42,851 12.96%
Islington 31,133 12.82%
Inner London 493,413 13.5%
Outer London
Local Authority Total number of Baby Boomers Baby Boomers as a % of overall population
Havering 53,242 20.26%
Bromley 66,874 19.79%
Richmond upon Thames 38,588 19.27%
Bexley 48,452 19.18%
Harrow 48,344 19.16%
Sutton 38,678 18.60%
Croydon 72,291 18.37%
Barnet 68,445 17.13%
Brent 56,384 16.96%
Ealing 58,970 16.96%
Outer London 934,171 17.3%
The total number of baby boomers in Inner London is 493,413
Baby boomers make up 20.26% of the
population in Havering
Page 19 of 22
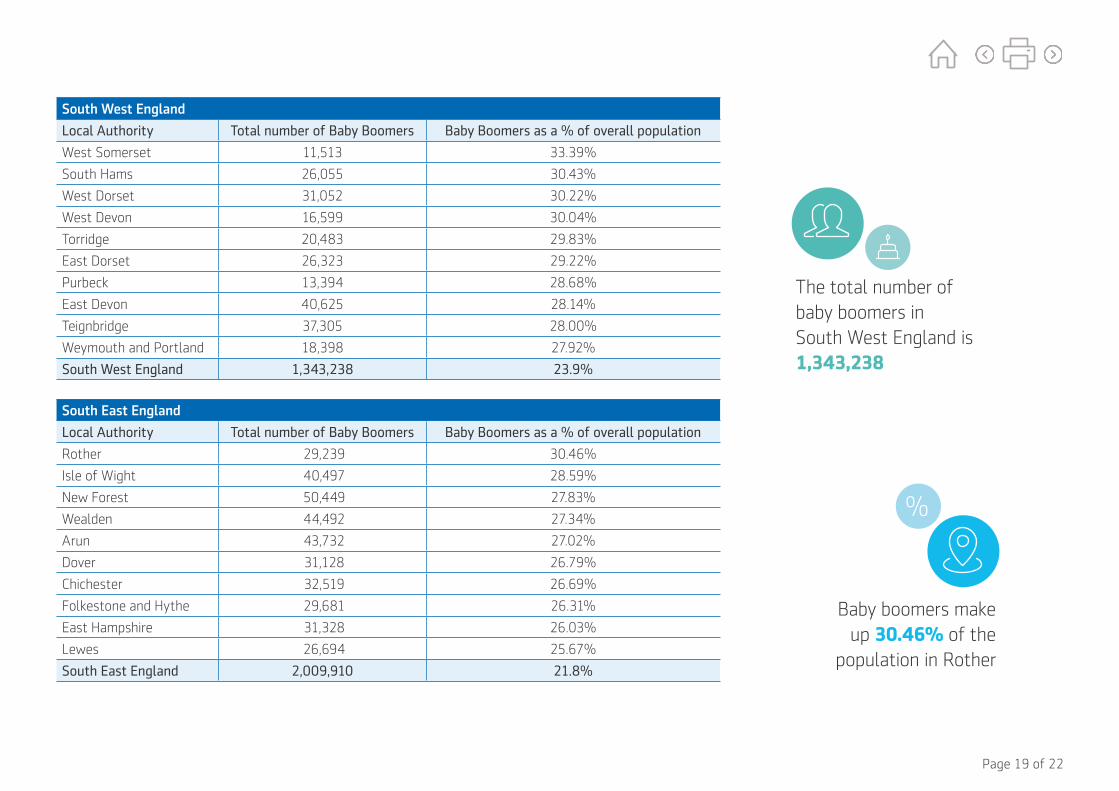
South West England
Local Authority Total number of Baby Boomers Baby Boomers as a % of overall population
West Somerset 11,513 33.39%
South Hams 26,055 30.43%
West Dorset 31,052 30.22%
West Devon 16,599 30.04%
Torridge 20,483 29.83%
East Dorset 26,323 29.22%
Purbeck 13,394 28.68%
East Devon 40,625 28.14%
Teignbridge 37,305 28.00%
Weymouth and Portland 18,398 27.92%
South West England 1,343,238 23.9%
South East England
Local Authority Total number of Baby Boomers Baby Boomers as a % of overall population
Rother 29,239 30.46%
Isle of Wight 40,497 28.59%
New Forest 50,449 27.83%
Wealden 44,492 27.34%
Arun 43,732 27.02%
Dover 31,128 26.79%
Chichester 32,519 26.69%
Folkestone and Hythe 29,681 26.31%
East Hampshire 31,328 26.03%
Lewes 26,694 25.67%
South East England 2,009,910 21.8%
The total number of baby boomers in South West England is 1,343,238
Baby boomers make up 30.46% of the
population in Rother

Page 20 of 22
Scotland
Local Authority Total number of Baby Boomers Baby Boomers as a % of overall population
Argyll & Bute 25,007 28.96%
Dumfries & Galloway 42,453 28.50%
Scottish Borders 32,752 28.43%
South Ayrshire 31,602 28.12%
Na h-Eileanan Siar 7,449 28.07%
Orkney Islands 5,963 27.20%
Highland 62,763 26.56%
North Ayrshire 35,787 26.48%
Angus 30,906 26.37%
Inverclyde 20,428 26.07%
Scotland 1,270,248 23.2%
Northern Ireland
Local Authority Total number of Baby Boomers Baby Boomers as a % of overall population
Ards & North Down 39,379 24.5%
Mid & East Antrim 31,367 22.6%
Causeway Coast & Glens 31,936 22.1%
Fermanagh & Omagh 25,225 21.5%
Lisburn & Castlereagh 30,657 21.1%
Antrim & Newtownabbey 29,367 20.6%
Newry Mourne & Down 36,439 20.1%
Derry & Strabane 30,160 20.1%
Armagh Banbridge & Craigavon
41,939 19.4%
Belfast 62,965 18.5%
Northern Ireland 386,717 20.5%
The total number of baby boomers in Scotland is 1,270,248
Baby boomers make up 24.5% of the population
in Ards & North Down

Page 21 of 22
Wales
Local Authority Total number of Baby Boomers Baby Boomers as a % of overall population
Powys 37,720 28.6%
Monmouthshire 25,626 27.5%
Conwy 31,944 27.3%
Isle of Anglesey 18,874 26.9%
Pembrokeshire 33,287 26.8%
Carmarthenshire 48,625 26.1%
Denbighshire 24,946 26.1%
Ceredigion 18,901 24.7%
Neath Port Talbot 34,926 24.7%
Vale of Glamorgan 31,429 24.5%
Wales 733,790 23.4%
The total number of baby boomers in Wales is 733,790
Endnotes
1 HMRC, Flexible Payments from Pensions, January 2019, https://assets.publishing.service.gov.uk/government/uploads/system/uploads/attachment_data/file/773230/Pensions_Flexibility_Jan_2019.pdf
2 TPR, Freedom of information request on DB transfers, May 2018, https://www.thepensionsregulator.gov.uk/en/about-us/freedom-of-information-(foi)/number-of-transfers-out-of-db-schemes-in-2017-18
3 Aegon transition to retirement research conducted in conjunction with Opinium, based on responses from 1007 UK workers aged 50+ earning £20k+ between 30 November and 6 December 2018.
4 Population projections for the UK are taken from the Office for National Statistics (ONS) and are based on the 2016-based population projections for 2019 split by Local Authorities. Local Authority population projections are published by the Welsh Government every three years so the latest projections are 2014-based.
5 Life Expectancy figures were taken from the most recent ONS release, Health state life expectancies, UK: 2015 to 2017. For this research average life expectancy at age 65 was weighted by the proportion of the male and female population in each Local Authority.
6 FCA, Retirement Outcome Review: Interim Report, p3, July 2017, https://www.fca.org.uk/publication/market-studies/retirement-outcomes-review-interim-report.pdf
7 FCA, Freedom of Information request on DB transfers, September 2018, https://www.fca.org.uk/publication/foi/foi5981-response.pdf
8 Halifax Seaside Town Review, June 2018, https://static.halifax.co.uk/assets/pdf/media-centre/press-releases/2018-06-23-All-you-need-is-bucket-spade-627k-britians-seaside-town-press-release.pdf

Aegon is a brand name of Scottish Equitable plc (No. SC144517) and Aegon Investment Solutions Ltd (No. SC394519) registered in Scotland, registered office: Edinburgh Park, Edinburgh, EH12 9SE. Both are Aegon companies. Scottish Equitable plc is authorised by the Prudential Regulation Authority and regulated by the Financial Conduct Authority and the Prudential Regulation Authority. Aegon Investment Solutions Ltd is authorised and regulated by the Financial Conduct Authority. Their Financial Services Register numbers are 165548 and 543123 respectively. © 2019 Aegon UK plc
RTL383112 03/19
aegon.co.uk @aegonuk Aegon UK Aegon UK