baby boomers envision what's next? · boomers have become more favorable towards medicare (69%...
TRANSCRIPT
Baby Boomers EnvisionWhat’s Next?
Research and Strategic Analysis
Integrated Value and Strategy
June, 2011
© Copyright AARP and GFK Custom Research North America 2011

Study Specifics
What? An in-depth look at how boomers are preparing for or experiencing their retirement years: attitudes, expectations, and behaviors. The third in a series-previous versions in 1997 and 2003.
How? A telephone survey, with field work, questionnaire consulting, and analytical contributions from Roper GFK.
Who? 1,200 boomers (Americans age 46-65), both retired (n=249) and non-retired (n= 954). Confidence interval +/- 3% at 95% confidence level for non-retired sample and +/- 6% for retired sample. 1997 n= 1,200, 2003 n= 2,000.
When? February 1 –March 15, 2011
Why? 76 million boomers are headed towards their “retirement years” – the oldest turn 65 this year!
2

Key FindingsGeneral Attitudes Toward Retirement: Declining Optimism
• Both the declining economy and personal aging have combined to lower boomer expectations.
• A majority (60%, down 10 points from 1998) are at least “fairly optimistic,” but 39% are not optimistic. One in four (26%) have become more pessimistic in the last five years, primarily due to the economy.
Personal Finance: Lowered Expectations and Heightened Challenges
About half of working boomers (55%) are at least “somewhat” satisfied with their retirement savings, and only 14% are completely satisfied. In 1998, two out of three were at least somewhat satisfied.
401Ks/retirement savings are most frequently cited as a retirement income source (61%, down eight pts. since 2003). Other declines include other savings and investments (55%, down nine pts.), and pensions (49%, down nine pts.). Those expecting to rely on Social Security have increased nine points to 59%., now placing it second in terms of frequency of mention as a source of retirement income.
44% of boomers feel they will not be able to afford to do the things they want to do in retirement (up 10 pts.), may not be able to afford to retire (36%, up 12 pts.), and may have to struggle to make ends meet (33%, up 10 pts.).
Life Experiences: Age is Catching Up with Baby Boomers
Three of four boomers have experienced the death of a parent, up from 51% in 1998. Almost half were now grandparents (46%) or empty nesters (47%). Four in ten (39%) had become responsible for caring for a parent (up 13 points from 1998) . One in three had suffered a major illness (34%, up 12 points) and almost half had experienced a job loss (43%, up from 35% in 2003).
3

Key Findings (con’t)Boomers and Work: Boomers Take Divergent Paths and Defy Generalization and Stereotyping
Working boomers are split between those who can’t wait to retire (43%) and those who won’t want to stop working (41%), percentages that have been stable over the last 13 years.
As in 1998, four of five boomers (81%) expect to gradually transition to retirement. More boomers expect to work part time for income (29%, up six points) rather than for interest or enjoyment (23%, down 12 pts.).
Boomer Health: As Boomers Age, Concern Increases
Only half of working boomers (50%) say they are in good or excellent health, compared to almost two of three in 1998 (64%).
Boomers have become more favorable towards Medicare (69% favorable, up eight points from 1998).
Only about half of boomers say they plan to exercise regularly in retirement, a proportion that has not changed over the last13 years.
Boomers and Their Families: A Preference For Emotional Connections But Financial Independence
Most boomers (67%) feel that a family’s emotional support is essential in retirement, and they expect to live near their children (58%), and with a spouse or partner (69%).
Only 12% feel they should depend on family financial support during retirement, and only 7% expect financial help from their children, with 17% expecting to provide financially for their own children.
4

Key Findings (con’t.)Anticipated Retirement Lifestyles: Less Aspirational, More Pragmatic
Seven in ten (71%) see retirement as a time to spend more time with their families, with 66% anticipating more time with hobbies and interests (down 8 points from 1998), and fewer seeing retirement as a time of leisure (57%, down 11 points), a time to indulge themselves (45%, down 10 points) or a time to do the travelling they couldn’t do when they were younger (49%, down 12 points).
Three of four boomers (77%) feel it is important to “prepare for the future by sacrificing and saving today” a proportion that has been stable since 1998. But only a little over half (53%) feel confident in their ability to prepare for the future (downeight points).
Retirement Preparation: A Tendency to “Go It Alone”
Less than one in four (23%) feel they need more information to help them prepare for retirement (down seven points since 1998), despite the fact that their knowledge of critical information may be limited, as evidenced by the fact that most do not know the age at which full Social Security benefits are available. Only one in three (34%) say they often discuss retirement with family or friends, a percentage that has remained stable since 1998 despite the fact that retirement and the need to plan for it and make decisions regarding it is drawing closer.
5

Key Findings: The Boomer Retirement Segments
Retirement Means Different Things to Different Boomers: The Boomer Retirement Segments
The Self Reliants (22%) – optimistic, affluent, plan to continue to work, especially for interest or enjoyment,
and rely on personal investments.
The Enthusiasts (10%) – also optimistic and affluent, they can’t wait to retire and are satisfied with their
retirement savings, most likely to be married.
Today’s Traditionalists (26%) – cautiously optimistic, they plan to continue to work for income but also are
favorable towards and intend to rely on Social Security and Medicare.
The Anxious (22%) – lower income and education, less favorable about retirement and their retirement
finances, but especially concerned about health issues.
The Strugglers (20%)- most pessimistic, lowest income and education, little if any retirement savings, most
likely to have suffered adverse life events (job loss, serious illness, death of spouse).
6
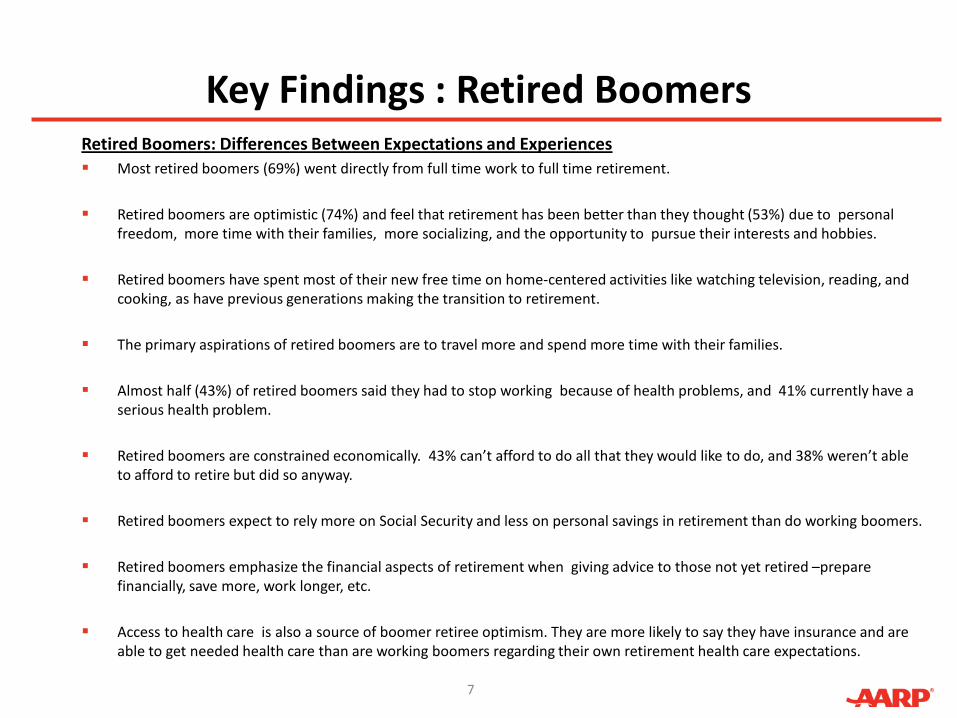
Key Findings : Retired BoomersRetired Boomers: Differences Between Expectations and Experiences Most retired boomers (69%) went directly from full time work to full time retirement.
Retired boomers are optimistic (74%) and feel that retirement has been better than they thought (53%) due to personal freedom, more time with their families, more socializing, and the opportunity to pursue their interests and hobbies.
Retired boomers have spent most of their new free time on home-centered activities like watching television, reading, and cooking, as have previous generations making the transition to retirement.
The primary aspirations of retired boomers are to travel more and spend more time with their families.
Almost half (43%) of retired boomers said they had to stop working because of health problems, and 41% currently have a serious health problem.
Retired boomers are constrained economically. 43% can’t afford to do all that they would like to do, and 38% weren’t able to afford to retire but did so anyway.
Retired boomers expect to rely more on Social Security and less on personal savings in retirement than do working boomers.
Retired boomers emphasize the financial aspects of retirement when giving advice to those not yet retired –prepare financially, save more, work longer, etc.
Access to health care is also a source of boomer retiree optimism. They are more likely to say they have insurance and are able to get needed health care than are working boomers regarding their own retirement health care expectations.
7
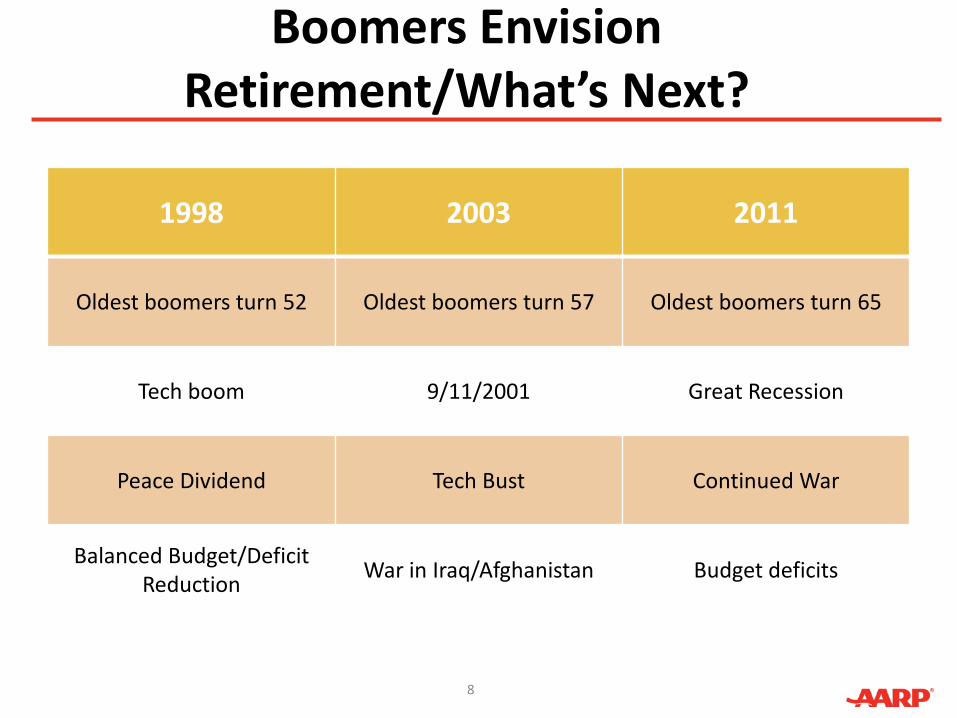
Boomers Envision Retirement/What’s Next?
1998 2003 2011
Oldest boomers turn 52 Oldest boomers turn 57 Oldest boomers turn 65
Tech boom 9/11/2001 Great Recession
Peace Dividend Tech Bust Continued War
Balanced Budget/DeficitReduction
War in Iraq/Afghanistan Budget deficits
8

General Attitudes of Boomers Towards Retirement:
Then and Now
ATTITUDES
9

Boomers are Divided and Less Optimistic About Retirement But The Majority Are Still Hopeful
Q2. As things stand today, which of these statements best describe your feelings as you think about your retirement years?
% of non-retired Baby Boomers who are…
28%
30%
24%
41%
38%
36%
70%
69%
60%
21%
22%
25%
8%
8%
14%
29%
30%
39%
1998 (n=2001)
2003 (n=1200)
2011 (n=954)
1998 (n=2001)
2003 (n=1200)
2011 (n=954)
Very optimistic Fairly optimistic
Very/fairly optimistic about retirement
Not too/not at all optimistic about
retirement
Not too optimistic Not at all optimistic
10

Boomers’ Outlook Towards Retirement Has Changed –But Not For The Better
Q26. Would you say that your personal outlook for your own retirement has changed for the better, changed for the worse, or has not changed at all over the past five years?
Change in Retirement Outlook Among Non-Retired Boomers over the Past Five Years
2003(n=1200)
2011(n=954)
Retirement outlook has changed for the better
Retirement outlook has changed for the better
Changed forthe worse
Nochange
Changed forthe worse
Nochange
11
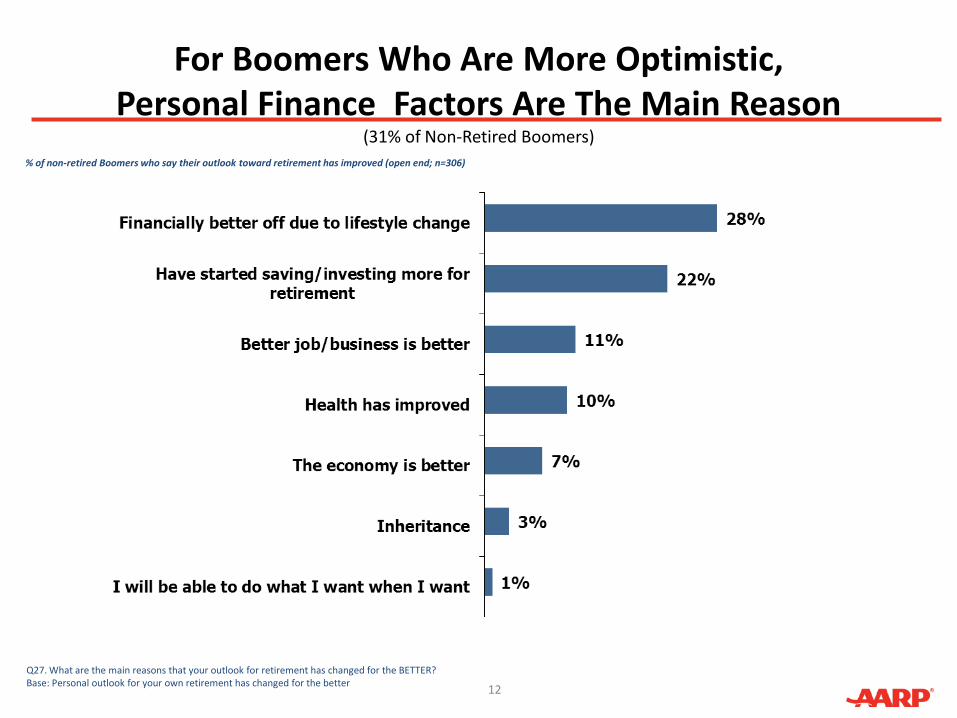
For Boomers Who Are More Optimistic, Personal Finance Factors Are The Main Reason
(31% of Non-Retired Boomers)
Q27. What are the main reasons that your outlook for retirement has changed for the BETTER?Base: Personal outlook for your own retirement has changed for the better
% of non-retired Boomers who say their outlook toward retirement has improved (open end; n=306)
12

The Economy and Personal Finances Are Why Retirement Outlook Has Changed For the Worse
(26% of Non-Retired Boomers)
Q28. What are the main reasons that your outlook for retirement has changed for the WORSE?Base: Personal outlook about retirement has changed for the worse* Caution: small base
-
% of non-retired Boomers who say their outlook toward retirement has changed for the worse (open end; n=249)
13

Boomers and Personal Finance:Lowered Expectations and
Heightened Challenges
PERSONAL
FINANCE
14

More Boomers “Not Satisfied” With What They Are Putting Away For Retirement
Q8. How satisfied are you with the amount of money you put aside for your retirement? Are you completely, somewhat, not very, or not at all satisfied?
% of non-retired Boomers saying each.
15
0%
18%
15%
50%
17%
1%
18%
12%
50%
19%
0%
28%
16%
41%
14%
Don't Know
Not at all satisfied
Not too satisfied
Somewhat satisfied
Completely satisfied
2011 (n=954) 2003 (n=1200) 1997 (n=2000)

Boomers See Themselves Relying Less on Personal Savings and Pensions, More On Social Security
% of non-retired Boomers who feel fairly sure that they can count on the following for income during their retirement years.
Q7. Which of these things do you feel fairly sure you can count on as a source of income during your retirement years?
16
2%
7%
28%
27%
57%
60%
48%
68%
3%
8%
28%
34%
58%
64%
63%
69%
6%
7%
21%
29%
49%
55%
59%
61%
None of these
Military service pension
Annuity policy from insurance company
Money I get from selling my house
Pension from place of employment
Income or money from savings and investments
Social Security
IRA, 401(k) , or other retirement savings
2011 2003 1998

Boomers Are More Likely To Anticipate Scaling Back Their Lifestyle When They Retire
I Expect…
Q6a, Q10a, Q23. Using a scale from 1 to 5, where 1 means it does not describe at all what retirement means to you personally and 5 means it very accurately describes what retirement means to you personally. I’d like you to consider each statement. (ONLY ITEMS RELATED TO FINANCE FROM EACH QUESTION ARE SHOWN)
% of non-retired Boomers agreeing w ith each (Top 2 Box 4,5 rating).
17
30%
17%
15%
38%
23%
24%
35%
34%
64%
27%
19%
17%
32%
25%
25%
36%
36%
59%
21%
22%
28%
31%
33%
36%
42%
44%
52%
To have plenty of money when I retire
To rely on the Social Security benefits of a spouse
To rely on Social Security for all or most of my income during retirement
To depend heavily on my 401(k)
To struggle to make ends meet
To not be able to afford to retire
To have to scale back my lifestyle during retirement
To not be able to afford to do all the things I want to do
To depend heavily on the personal investments I'm making today
2011 2003 1998

Boomers’ Perceived Knowledge Of Social Security Has Increased, and They are More Favorable Towards and Confident in Social Security-
But Their Knowledge May be More Limited Than They Believe
Q19. Just to get an idea, when discussions come up about Social Security, how knowledgeable do you feel you are about how the Social Security system works? Would you say you areQ20. Based on what you have heard, read or experienced with Social Security, what is you overall view of the program? Is itQ22. How confident are you that Social Security will still be available to you when you retire?
% of non-retired Boomers agreeing w ith each (Top 2 Box 4,5 rating).
Q: “At what age will you be eligible for full retirement benefits from Social Security?”(most frequent response) . . .
1998 (65) 2003 (65) 2011 (65)
18
2011 2003 1998

Personal Milestones and Life Events: As Boomers Age,
More Life Happens
MILESTONES
19

More MilestonesExperienced By Boomers
Q24a/b. People experience major changes at various stages of their lives. Have you ever experienced any of The following major life events or changes?
(n/a)
% of non-retired Baby Boomers who experienced each.
20
2011 2003 1998

Boomer Health: Another Challenge
HEALTH
21

As They Age, Boomers Are Less Likely to Describe Their Health as “Very Good” Or “Excellent”
Q15. In general, would you say your health is…Q24a. People experience major changes at various stages of their lives. Have you ever experienced any of the following major life events or changes?
% of non-retired Boomers say…
22
2011 2003 1998
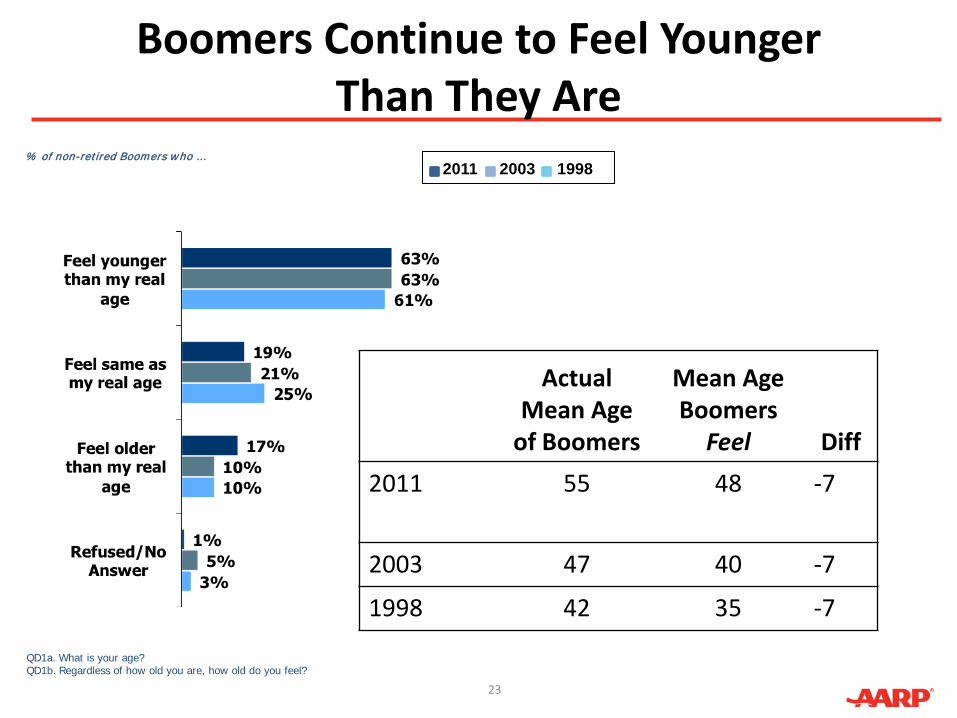
Boomers Continue to Feel Younger Than They Are
QD1a. What is your age?QD1b. Regardless of how old you are, how old do you feel?
% of non-retired Boomers who …
Actual Mean Age
of Boomers
Mean AgeBoomers
Feel Diff
2011 55 48 -7
2003 47 40 -7
1998 42 35 -7
23
2011 2003 1998

Boomers Are More Favorable Towards Medicare
Q11. Just to get an idea, when discussions come up about issues involving Medicare, how knowledgeable do you feel you are about how Medicare works? Would you say you areQ12. Based on what you have heard, read or experienced with Medicare, what is your overall view of the program? Is it Q14. How confident are you that Medicare will still be available for you when you reach age 65?
% of non-retired Boomers agreeing w ith each (Top 2 Box 4,5 rating).
24
2011 2003 1998

Boomers Plan to Exercise Regularly, But Increasingly Admit The Possibility of Failing Health
Q6a, Q10a, Q23. Using a scale from 1 to 5, where 1 means it does not describe at all what retirement means to you personally and 5 means it very accurately describes what retirement means to you personally. I’d like you to consider each statement. (ONLY ITEMS RELATED TO HEALTH FROM EACH QUESTION ARE SHOWN)
% of non-retired Boomers agreeing w ith each (Top 2 Box 4,5 rating).
25
12%
16%
27%
52%
52%
56%
18%
22%
28%
51%
48%
54%
20%
26%
26%
50%
52%
55%
I expect to have to stop working earlier than I would like because of poor health or a disability
I expect to have some serious health problems
I know I'm not doing enough now to maintain my health
I expect to be healthier than most people my age
I should give more thought to how I'll keep active when I retire
I'll exercise regularly
2011 (n=954) 2003 (n=1200) 1998 (n=2001)

Boomers and Work:A Diverse Generation
Has Diverse Expectations
WORK
26
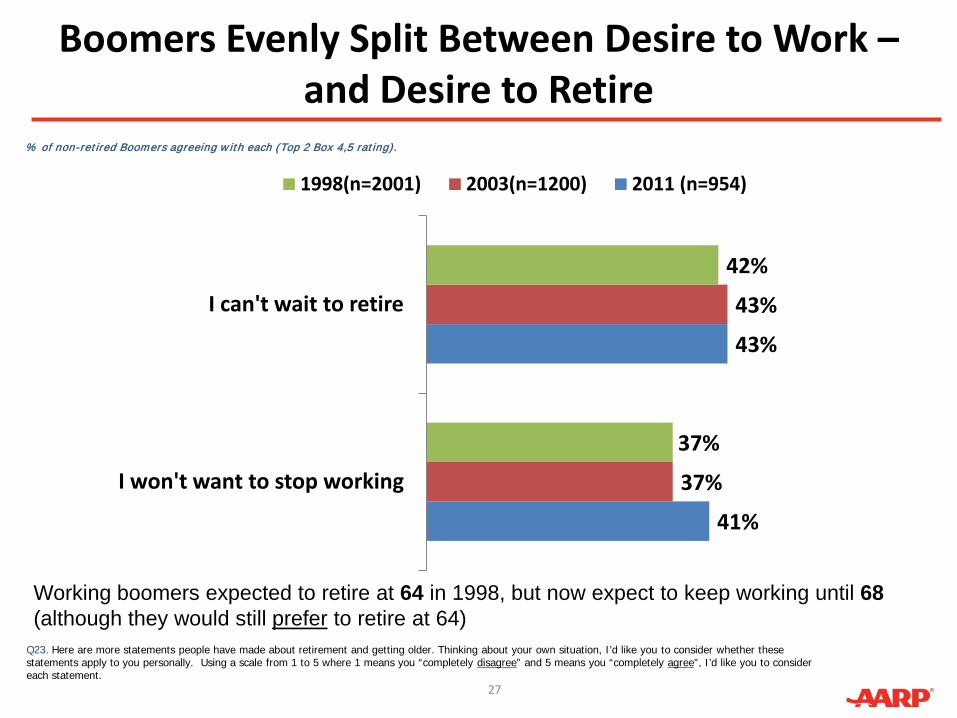
Boomers Evenly Split Between Desire to Work –and Desire to Retire
Q23. Here are more statements people have made about retirement and getting older. Thinking about your own situation, I’d like you to consider whether these statements apply to you personally. Using a scale from 1 to 5 where 1 means you “completely disagree” and 5 means you “completely agree”, I’d like you to consider each statement.
% of non-retired Boomers agreeing w ith each (Top 2 Box 4,5 rating).
27
41%
43%
37%
43%
37%
42%
I won't want to stop working
I can't wait to retire
1998(n=2001) 2003(n=1200) 2011 (n=954)
Working boomers expected to retire at 64 in 1998, but now expect to keep working until 68(although they would still prefer to retire at 64)

There Has Been A Shift Towards Working For Needed Income Versus Working For Enjoyment/Intent
Q3. Thinking about your employment status in later years, which of these best describes what you think you will be doing when you retire. Will you…
% of non-retired Baby Boomers who think they w ill be doing each when they retire.
28
2011 2003 1998

Boomers and Their Families:A Preference for Emotional
Connection but Financial Independence
29
FAMILY
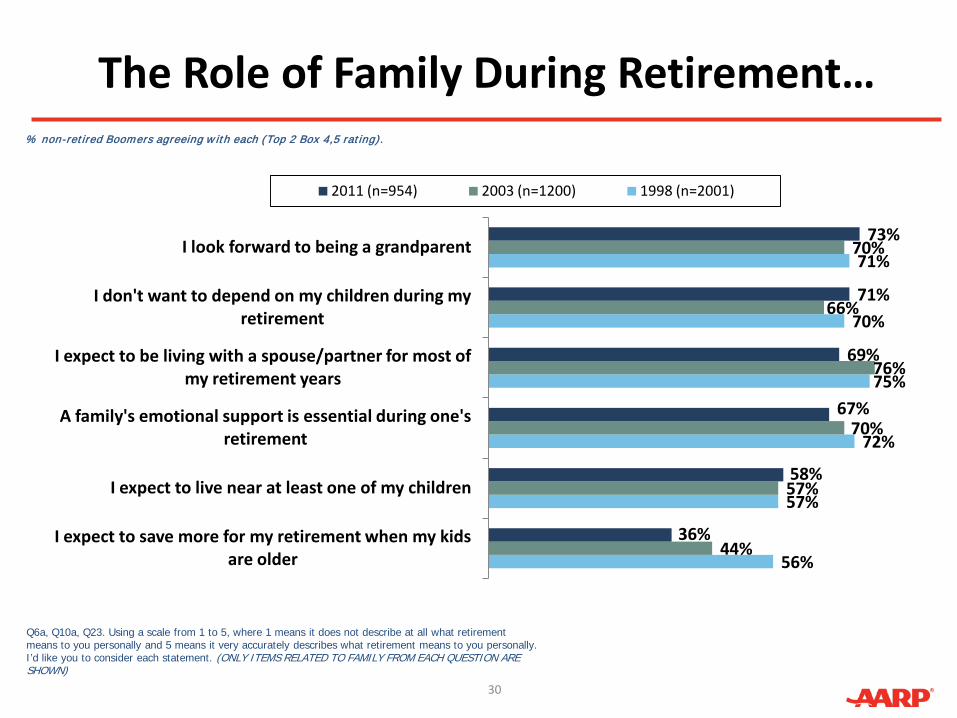
The Role of Family During Retirement…
Q6a, Q10a, Q23. Using a scale from 1 to 5, where 1 means it does not describe at all what retirement means to you personally and 5 means it very accurately describes what retirement means to you personally. I’d like you to consider each statement. (ONLY ITEMS RELATED TO FAMILY FROM EACH QUESTION ARE SHOWN)
% non-retired Boomers agreeing w ith each (Top 2 Box 4,5 rating).
30
56%
57%
72%
75%
70%
71%
44%
57%
70%
76%
66%
70%
36%
58%
67%
69%
71%
73%
I expect to save more for my retirement when my kids are older
I expect to live near at least one of my children
A family's emotional support is essential during one's retirement
I expect to be living with a spouse/partner for most of my retirement years
I don't want to depend on my children during my retirement
I look forward to being a grandparent
2011 (n=954) 2003 (n=1200) 1998 (n=2001)

The Role of Family During Retirement…(cont’d)
Q6a, Q10a, Q23. Using a scale from 1 to 5, where 1 means it does not describe at all what retirement means to you personally and 5 means it very accurately describes what retirement means to you personally. I’d like you to consider each statement. (ONLY ITEMS RELATED TO FAMILY FROM EACH QUESTION ARE SHOWN)
% non-retired Boomers agreeing w ith each (Top 2 Box 4,5 rating).
31
5%
9%
15%
17%
18
20%
5%
10%
18%
17%
19%
18%
7%
12%
14%
17%
17%
29%
I'll expect my children to help me out financially
I think people ought to be able to depend on their family financially during retirement
I expect to have to provide financially for my elderly parents/in-laws
I expect to have to provide financially for my children
I expect to have an aging parent/in-law living in my home at some time during my retirement
I expect to be living alone for most of my retirement years
2011 (n=954) 2003 (n=1200) 1998 (n=2001)
Anticipated Retirement Lifestyles: Less Aspirational, More Pragmatic
32
LIFESTYLE

Boomers’ Less Likely To See Retirement As A Time For Fulfilling Aspirations
Q4. Retirement is a stage that signifies different things to different people. Thinking about your own situation, I’d like you to consider whether these items accurately describe what retirement means to you. Using a scale from 1 to 5 - where 1 means it does not describe at all what retirement means to you personally and 5 means it very accurately describes what retirement means to you personally, I’d like you to consider each statement.
% non-retired Boomers agreeing w ith each (Top 2 Box 4,5 rating).
33
2011 2003 1998
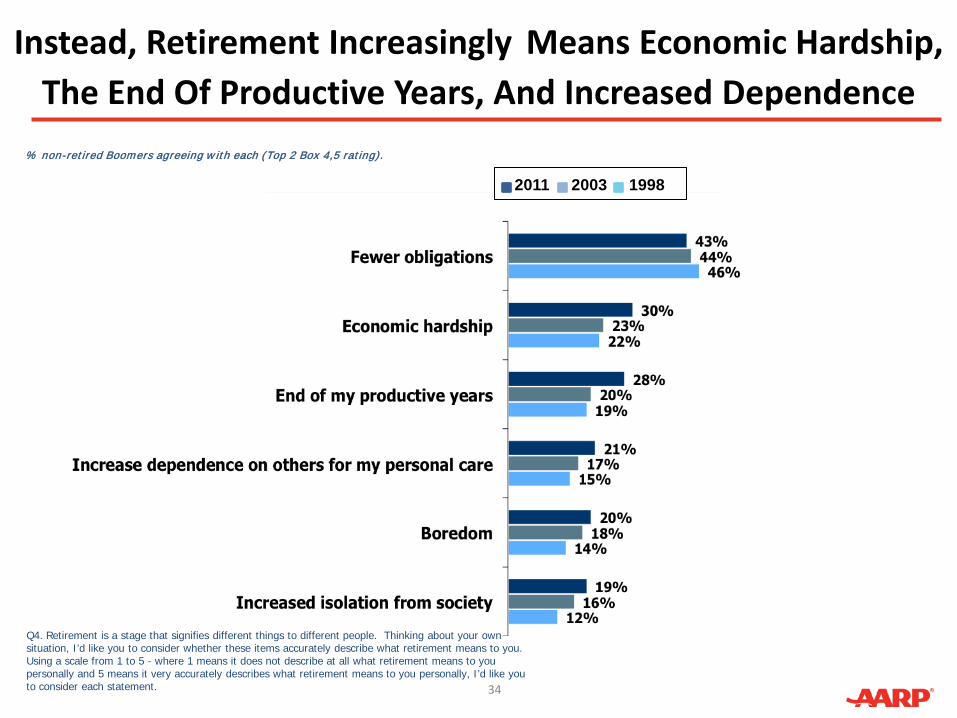
Instead, Retirement Increasingly Means Economic Hardship, The End Of Productive Years, And Increased Dependence
Q4. Retirement is a stage that signifies different things to different people. Thinking about your own situation, I’d like you to consider whether these items accurately describe what retirement means to you. Using a scale from 1 to 5 - where 1 means it does not describe at all what retirement means to you personally and 5 means it very accurately describes what retirement means to you personally, I’d like you to consider each statement.
% non-retired Boomers agreeing w ith each (Top 2 Box 4,5 rating).
34
2011 2003 1998

Boomers Are Less Confident In Their Ability To Prepare For The Future -But Not Because of a Lack of Information or Planning
Q6b. Now, how much do you agree or disagree with each of the following statements?Q10a. Here are more statements people have made about retirement and getting older. Thinking about your own situation, I’d like you to consider whether these statements apply to you personally. Using a scale from 1 to 5 where 1 means you “completely disagree” and 5 means you “completely agree”
% of non-retired Boomers agreeing w ith each (Top 2 Box 4,5 rating).
35
76%
22%
30%
36%
47%
61%
74%
22%
23%
35%
45%
61%
77%
23%
23%
34%
49%
53%
It is important to be prepared for the future by sacrificing and saving today
When I think about retirement, I have the attitude that the futre will take care of itself
I need more information to help me plan for my retirement
I often discuss retirement planning with my family, friends, and co-workers
I find it hard to save for retirement with so many other needs right now
I am confident in my ability to prepare adequately for the future
2011 (n=954) 2003 (n=1200) 1998 (n=2001)

From Generalizationsto Segments:Retirement Means Different Things to Different Boomers
36
SEGMENTS
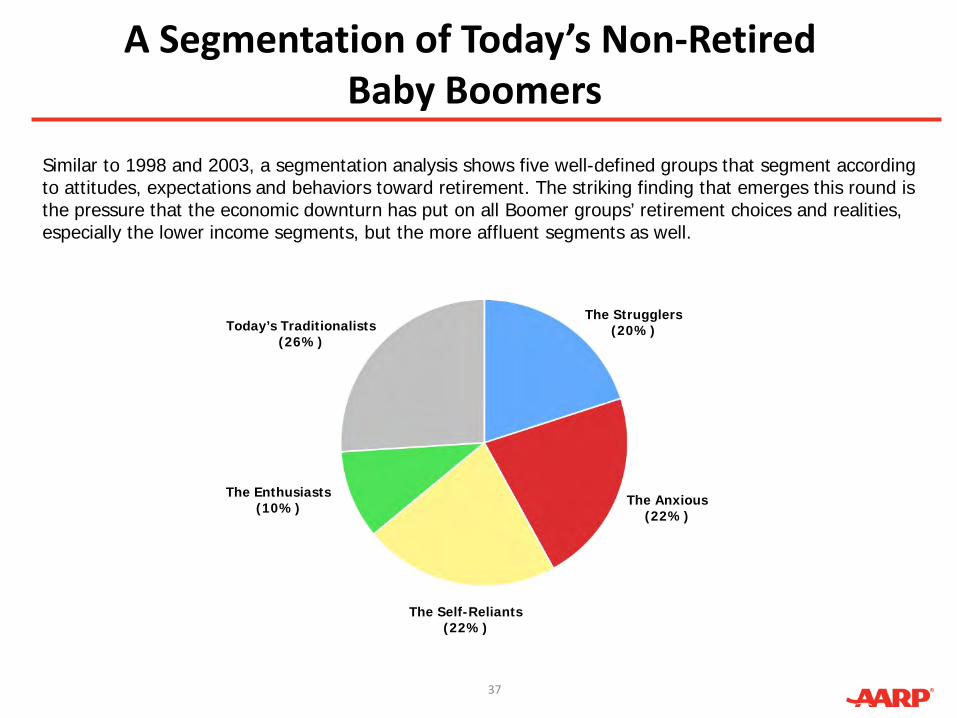
A Segmentation of Today’s Non-RetiredBaby Boomers
The Strugglers(20%)
The Anxious(22%)
The Self-Reliants(22%)
The Enthusiasts(10%)
Today’s Traditionalists(26%)
Similar to 1998 and 2003, a segmentation analysis shows five well-defined groups that segment according to attitudes, expectations and behaviors toward retirement. The striking finding that emerges this round is the pressure that the economic downturn has put on all Boomer groups’ retirement choices and realities, especially the lower income segments, but the more affluent segments as well.
37

The Self-Reliants (22% )
Down 10 points from 2003
Very optimistic, although their optimism has slipped 6 points (to 81%)
Have the resources to be active in the workforce and save aggressively—most affluent and best educated of the five segments
56% college graduates, 31% of all boomers
$106K median HH income, $67K for all non-retired boomers
54% executive/professional, 35% of all boomers
Expect to depend on personal savings in retirement (77%, compared to 52% total)
Continue to be satisfied with amount currently putting away for retirement (89%, compared to 55% for all boomers and basically unchanged from 91% in 2003), yet show a 10 point decline in feeling like they will have plenty of money when they retire (33%, compared to 21% for all boomers)
None plan to stop working when retired; a majority (55%) plan to work part-time mainly for interest or enjoyment’s sake (23% of total)
84% white non-Hispanic, compared to 78% of all boomers
72% married, compared to 59% of all boomers
38

The Enthusiasts (10%)
Down 4 points from 2003
Continue to look forward to their retirement years with pleasure
Enjoy second highest income among five the segments
$88.1 median HH, $67K all non-retired boomers
less likely to be blue collar (23%, 34% for all boomers)
Plan not to work at all when retired
Most optimistic about retirement years (91%, unchanged from 93% in 2003)
Two-thirds, the greatest number across all the groups, say they “can’t wait to retire” (66%, compared to 43% of all boomers)
Though most continue to be satisfied with amount putting away for retirement, this number has slipped (to 87% from 95% in 2003)
Most likely to expect to have “plenty of money” in retirement (47%) –unchanged since 2003 (total 21%, down 6 points since 2003)
72% married, compared to 59% of all boomers
39
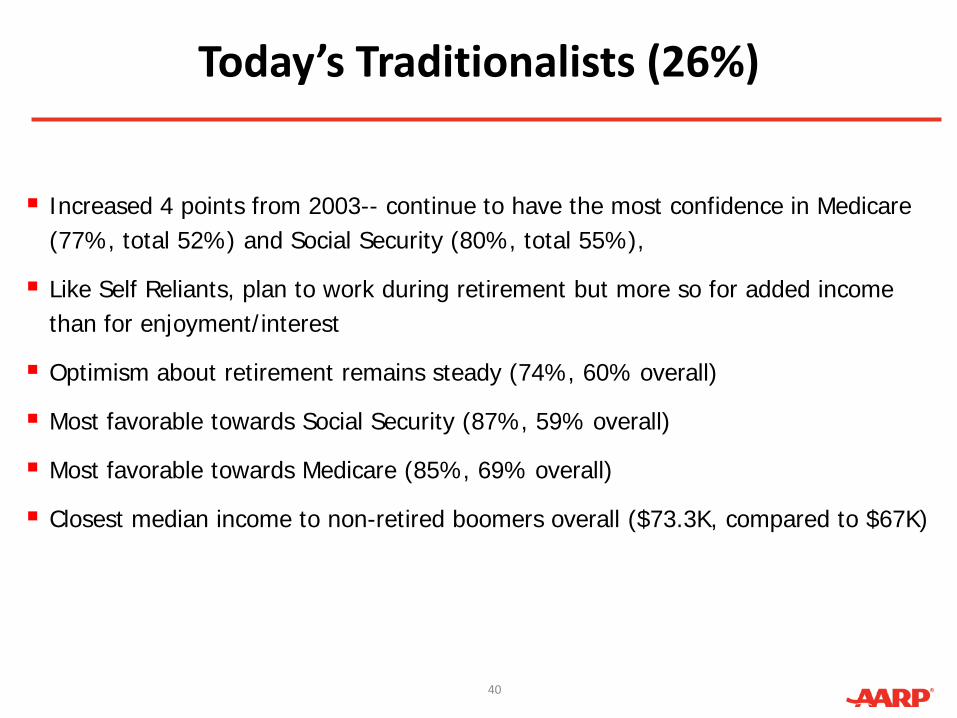
Today’s Traditionalists (26%)
Increased 4 points from 2003-- continue to have the most confidence in Medicare (77%, total 52%) and Social Security (80%, total 55%),
Like Self Reliants, plan to work during retirement but more so for added income than for enjoyment/interest
Optimism about retirement remains steady (74%, 60% overall)
Most favorable towards Social Security (87%, 59% overall)
Most favorable towards Medicare (85%, 69% overall)
Closest median income to non-retired boomers overall ($73.3K, compared to $67K)
40

The Anxious (22%)
Up 5 points from 2003
This group’s already low optimism toward retirement declined (37%, down 6 points, compared to 60%, -9 points for all non-retired boomers)
But the number who can’t wait to retire increases (43%, up 13 points and matching boomer average)
A majority (55%) report losing a job at some point (43% overall)
Almost half (48%) expect to work part-time during retirement for needed income compared to 29% of all boomers
Almost half expect to have to scale back during retirement
Just one third (down 20 points) satisfied with amount putting aside for retirement, compared to 55% of total, down 14 points
Greatly concerned about health care coverage during retirement
23% feel they will get needed care, down 23 points (all boomers =70%, -8)
13% confident in Medicare (52% overall)
41% favorable towards Medicare (69% overall)
61% feel not having Social Security would have a major impact on their retirement, up 9 points since 2003 ( all boomers 56%,+11 points), but only 16% are confident about it (55% overall) and only 35% are favorable (69% overall)
Median income is $52,900
Income declined from 2003 ($60K before inflation)
22% college graduates (31% boomer average)41

The Strugglers (20%) Increased 5 points from 2003
Just three in ten are optimistic (half the rate of all non-retired boomers)
The least educated and least affluent segment
median HH income $24K, $67K for all non-retired boomers
66% high school grad or less (40% overall)
62% blue collar (34% overall)
19% African American/Black, 72% white non-Hispanic (11%, 78%)
This segment has been heavily affected by life events
56% have experienced job loss (43% overall)
50% have survived a major illness (35% overall)
25% have had a spouse/partner die (14% overall)
34% married (59% overall)
Savings for retirement at half the rate of average Boomers, 41% versus 82%, a 17 point drop from 2003
Just one in ten (down 12 points) satisfied with amount putting aside for retirement; most find it hard to save for retirement with so many other needs right now (72%)
Their confidence in Social Security and Medicare systems has risen dramatically since 2003.
Four in five (81%) feel the absence of Social Security would have a major impact on their retirement (55% overall)
Increase of 9 points in the number who say they “can’t wait to retire” (41%, 43% overall)
42
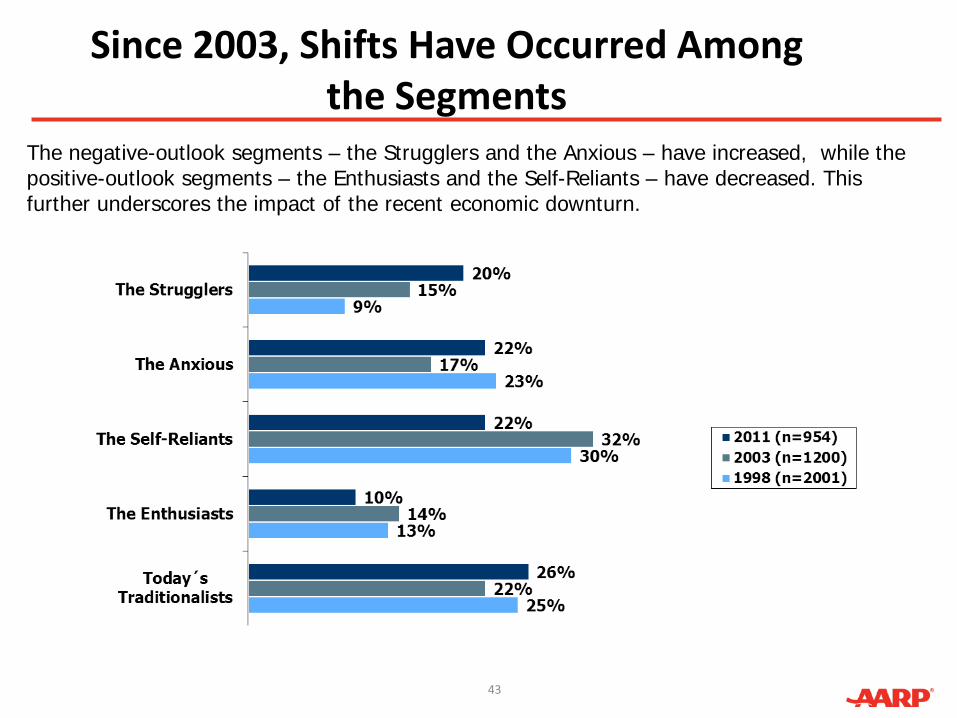
Since 2003, Shifts Have Occurred Among the Segments
The negative-outlook segments – the Strugglers and the Anxious – have increased, while the positive-outlook segments – the Enthusiasts and the Self-Reliants – have decreased. This further underscores the impact of the recent economic downturn.
43

The Anxious and the Self-Reliants Show the Biggest Declines in Optimism
Q2. As things stand today, which of these statements best describe your feelings as you think about your retirement years?
Very/Fairly optimistic about retirement years
44
2011 (n=954)2003 (n=1,200)

Retired Boomers: The Shape of Things to Come?
45
RETIRED
BOOMERS

Who are the Retired Boomers?Demographic and Life Stage Differences:
Retired boomers …. Not Retired% Retired%Are Older
Mean Age 54 60
Are Less Healthy
Excellent/very good health 50 35
Fair/Poor Health 22 43
Have Experienced Different Life Events
Widowed 4 14
Having a parent die 74 81
Losing your job 43 27
Becoming a grandparent 46 58
Getting a divorce 36 29
Surviving a major illness 34 45
Having a spouse/partner die 14 21
Were Less Likely to have executive/professional careersExecutive/ Professional 35 24
Have Lower Incomes
Median Income ($) 67,000 51,400(77%)46
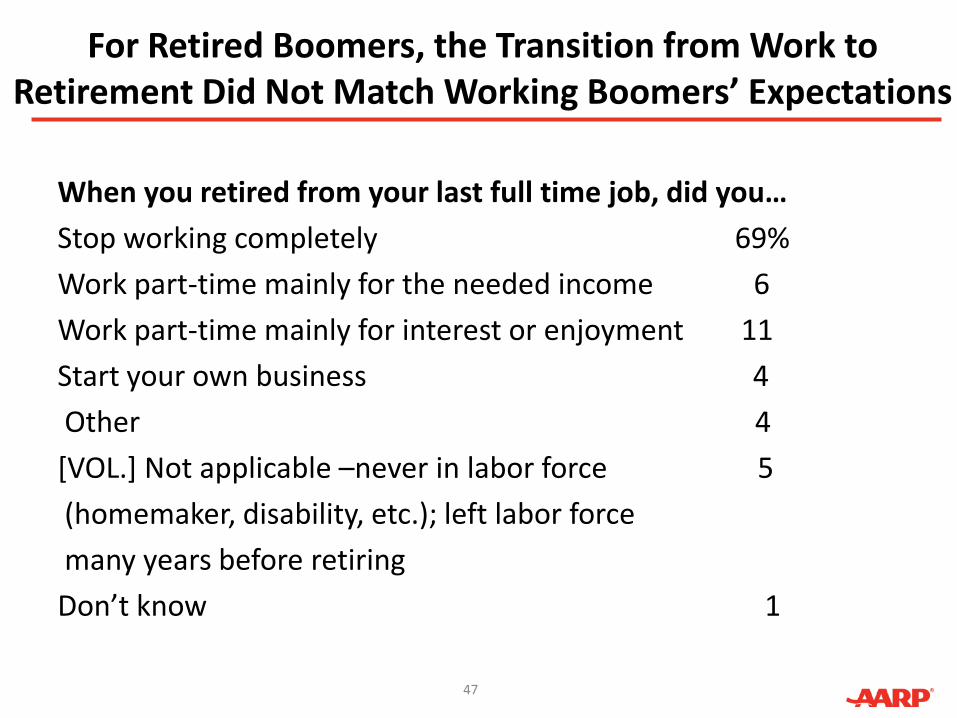
For Retired Boomers, the Transition from Work to Retirement Did Not Match Working Boomers’ Expectations
When you retired from your last full time job, did you…
Stop working completely 69%
Work part-time mainly for the needed income 6
Work part-time mainly for interest or enjoyment 11
Start your own business 4
Other 4
[VOL.] Not applicable –never in labor force 5
(homemaker, disability, etc.); left labor force
many years before retiring
Don’t know 1
47
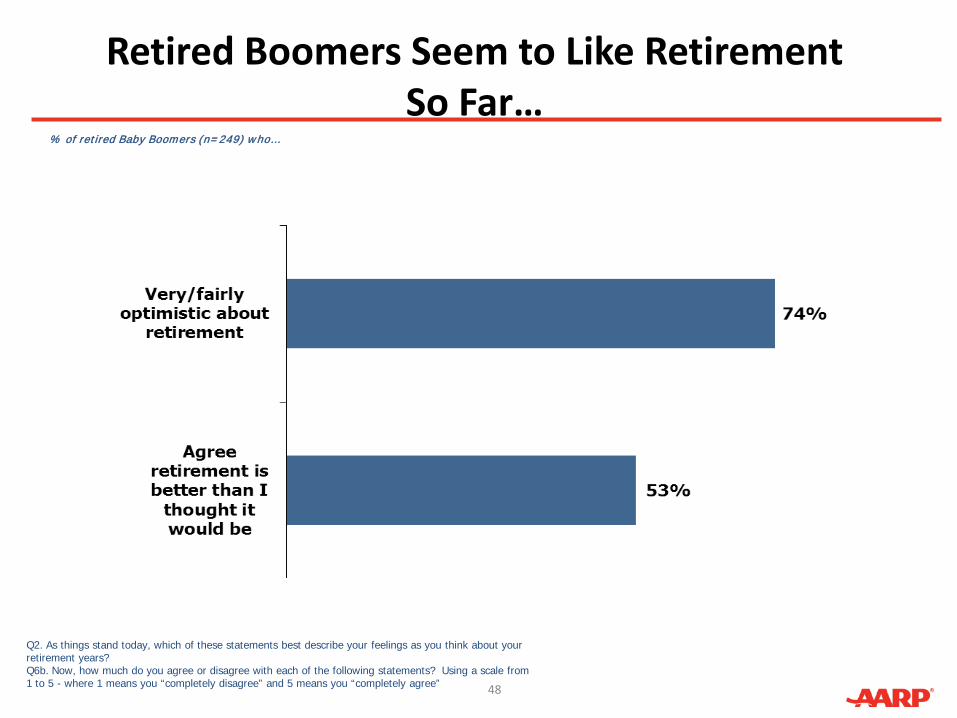
Retired Boomers Seem to Like Retirement So Far…
Q2. As things stand today, which of these statements best describe your feelings as you think about your retirement years?Q6b. Now, how much do you agree or disagree with each of the following statements? Using a scale from 1 to 5 - where 1 means you “completely disagree” and 5 means you “completely agree”
% of retired Baby Boomers (n=249) who…
48

Retired Boomers Are Three Times as Likely to Say Their Outlook Has Changed for the Better Than For The Worse Since Retiring
Q23. Would you say that your personal outlook about retirement has changed for the better, changed for the worse, or has not changed at all since you retired?
A
% of retired Baby Boomers (n=249) who say…
49
40%
12%
47%No change
Changed for the worse
Retirement outlook has changed for the better

Personal Freedom Is The Key Reason Retired Boomers are Feeling Better About Retirement
Q24/27. What are the main reasons that your outlook for retirement has changed for the BETTER?Base: Personal outlook for your own retirement has changed for the better
% of Boomers who say retirement outlook has changed for the better
50
1%
2%
11%
21%
31%
Inheritance
The economy is better
Health has improved
Financially better off due to lifestyle change
I am able to do what I want when I want
Retired (n=101)

Declining Health is the Key Reason Some Retired Boomers Say Their Outlook Has Changed for the Worse
Q25/28. What are the main reasons that your outlook for retirement has changed for the WORSE?Base: Personal outlook about retirement has changed for the worse
% of Boomers who say retirement outlook has changed for the worse
51
0%
2%
7%
7%
10%
10%
14%
22%
26%
67%
0 20 40 60 80
My current job pays me less than the job I had five years
There are not enough younger workers/Gen-Xers to pay into Social Security
Employer no longer offers retirees pension benefits benefits
Social security will not be around when I retire
My 401K /retirement accounts are worth less
I lost my job/I am unemployed
I am saving/investing less for my retirement
The economy is worse
Financially worse off due to lifestyle change
My health is worse than it was five years ago
Retired (n=28*)*Caution: small base

Since Retirement, Boomers Have Spent More Time With Family, Pursuing Interests, and Socializing
Q4. Please tell me whether each of the following describes your life since retirement or not, using a scale from 1 to 5 - where 1 means it does not describe you at all and 5 means it very accurately describes you since retirement.
Since Retirement…
% of retired Boomers (n=249) agreeing w ith each (Top 2 Box 4,5 rating)
52

Moretime Same
Lesstime
Netchange
% % % Pts.Watching television 68 25 7 +61Reading 64 19 16 +48Cooking 59 22 17 +42Surfing the Internet 58 24 17 +41Exercising 50 20 30 +20Listening to music at home 47 31 22 +25Donating time to charitable activities 46 22 31 +15Traveling 42 20 38 +4Getting involved with civic activities 41 25 34 +7Going out to eat 40 27 33 +7Going out to plays, theatre, movies, other kinds of entertainment 32 32 35 -3Playing competitive sports 21 16 62 -41
Retired Boomers Use Their New-Found Free Time Like Previous Generations of Retirees: Watching TV, Reading, and Cooking
Q19Y. Compared to before you were retired, please tell me if today you spend much more time, somewhat more time, about the same amount of time, somewhat less time, or much less time doing each of the following in an average month. First…
% of retired Boomers who have ever done activity (bases vary).
Since retiring, I spend…
53
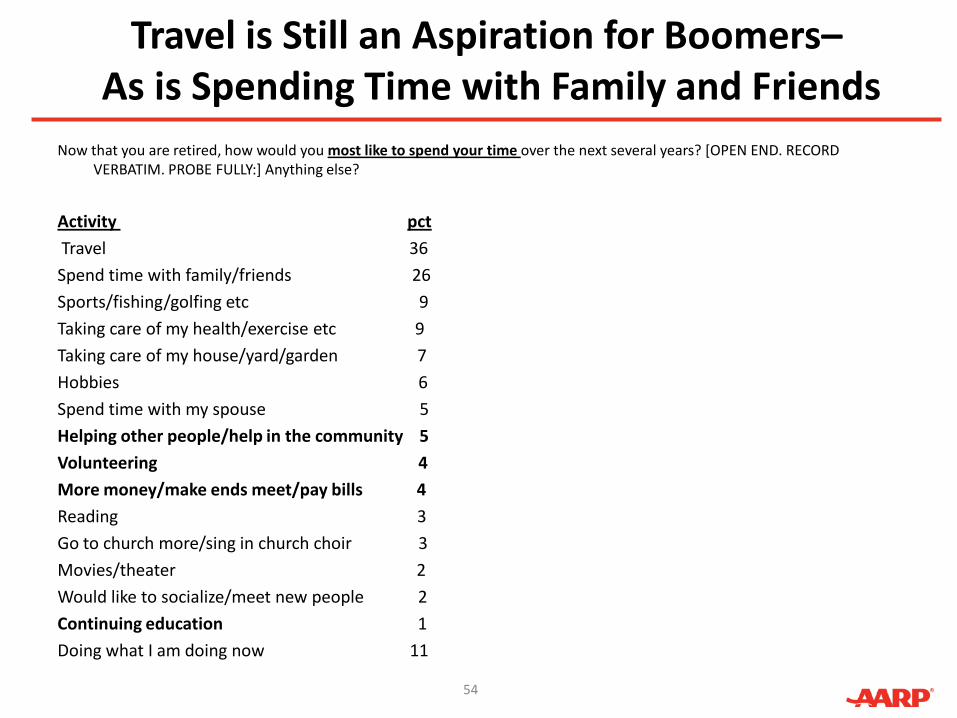
Travel is Still an Aspiration for Boomers–As is Spending Time with Family and Friends
Now that you are retired, how would you most like to spend your time over the next several years? [OPEN END. RECORD VERBATIM. PROBE FULLY:] Anything else?
Activity pct
Travel 36
Spend time with family/friends 26
Sports/fishing/golfing etc 9
Taking care of my health/exercise etc 9
Taking care of my house/yard/garden 7
Hobbies 6
Spend time with my spouse 5
Helping other people/help in the community 5
Volunteering 4
More money/make ends meet/pay bills 4
Reading 3
Go to church more/sing in church choir 3
Movies/theater 2
Would like to socialize/meet new people 2
Continuing education 1
Doing what I am doing now 11
54
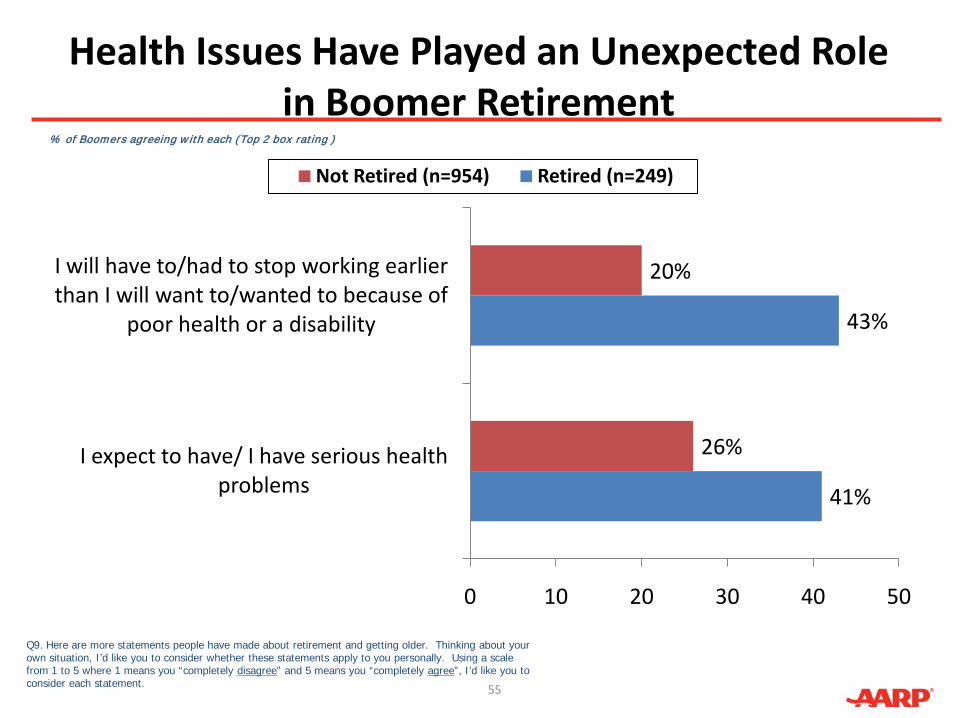
Health Issues Have Played an Unexpected Role in Boomer Retirement
Q9. Here are more statements people have made about retirement and getting older. Thinking about your own situation, I’d like you to consider whether these statements apply to you personally. Using a scale from 1 to 5 where 1 means you “completely disagree” and 5 means you “completely agree”, I’d like you to consider each statement.
% of Boomers agreeing w ith each (Top 2 box rating )
55
41%
43%
26%
20%
0 10 20 30 40 50
I expect to have/ I have serious health problems
I will have to/had to stop working earlier than I will want to/wanted to because of
poor health or a disability
Not Retired (n=954) Retired (n=249)

Many Boomers have Scaled Back in Retirement
Q6a, Q9, Q20. Using a scale from 1 to 5, where 1 means it does not describe at all what retirement means to you personally and 5 means it very accurately describes what retirement means to you personally. I’d like you to consider each statement.(ONLY ITEMS RELATED TO FINANCE FROM EACH QUESTION ARE SHOWN)Base: Retired (n=249)
% of retired Boomers (n=249) agreeing w ith each (Top 2 Box 4,5 rating)
56
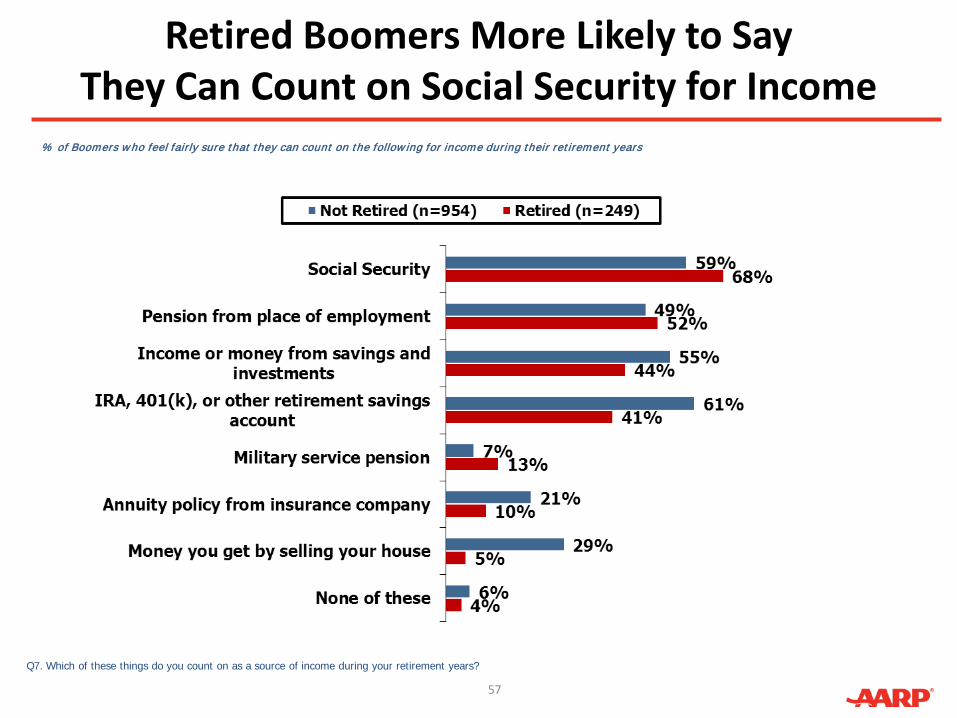
Retired Boomers More Likely to Say They Can Count on Social Security for Income
Q7. Which of these things do you count on as a source of income during your retirement years?
% of Boomers who feel fairly sure that they can count on the follow ing for income during their retirement years
57

Retirement Lesson One: What Retired Boomers Have Learned About Themselves
% of retired Boomers (n=249) who say…
4%
4%
4%
4%
4%
5%
7%
8%
Retirement can be boring
I'm more outgoing/I like to socialize
I'm independent/self-sufficient
I have learned the value of life
I am stronger than I thought
I am more patient/tolerant
I like being retired/having more time
I enjoy spending time with family
Q26. Now that you are retired, what interesting things have you learned about yourself since you haveretired? [OPEN END]
58
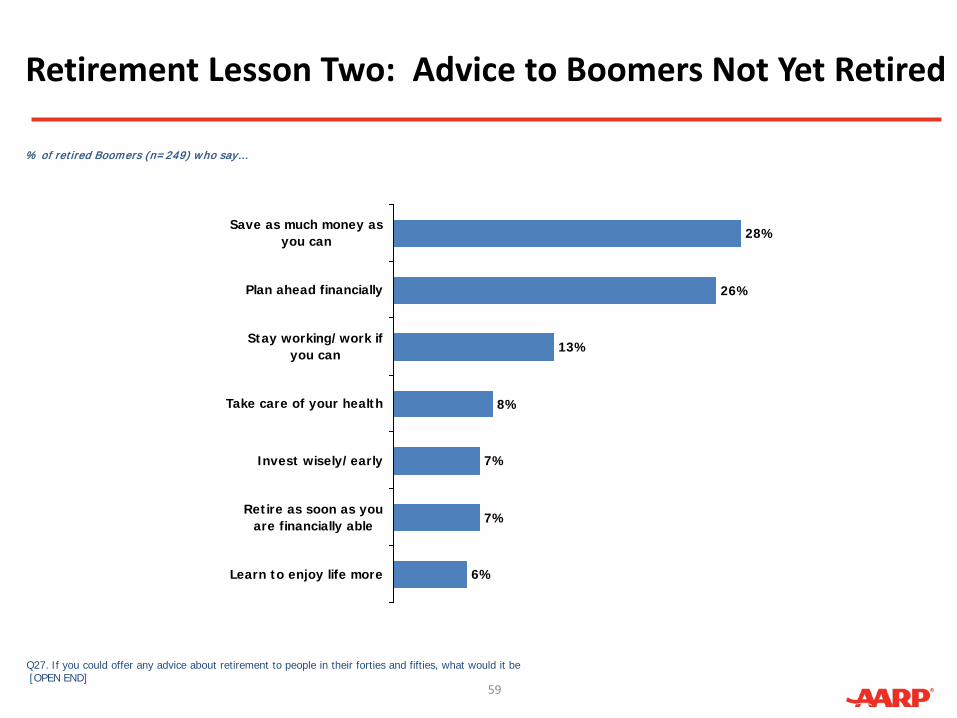
Retirement Lesson Two: Advice to Boomers Not Yet Retired
% of retired Boomers (n=249) who say…
6%
7%
7%
8%
13%
26%
28%
Learn to enjoy life more
Retire as soon as youare financially able
Invest wisely/early
Take care of your health
Stay working/work ifyou can
Plan ahead financially
Save as much money asyou can
Q27. If you could offer any advice about retirement to people in their forties and fifties, what would it be[OPEN END]
59
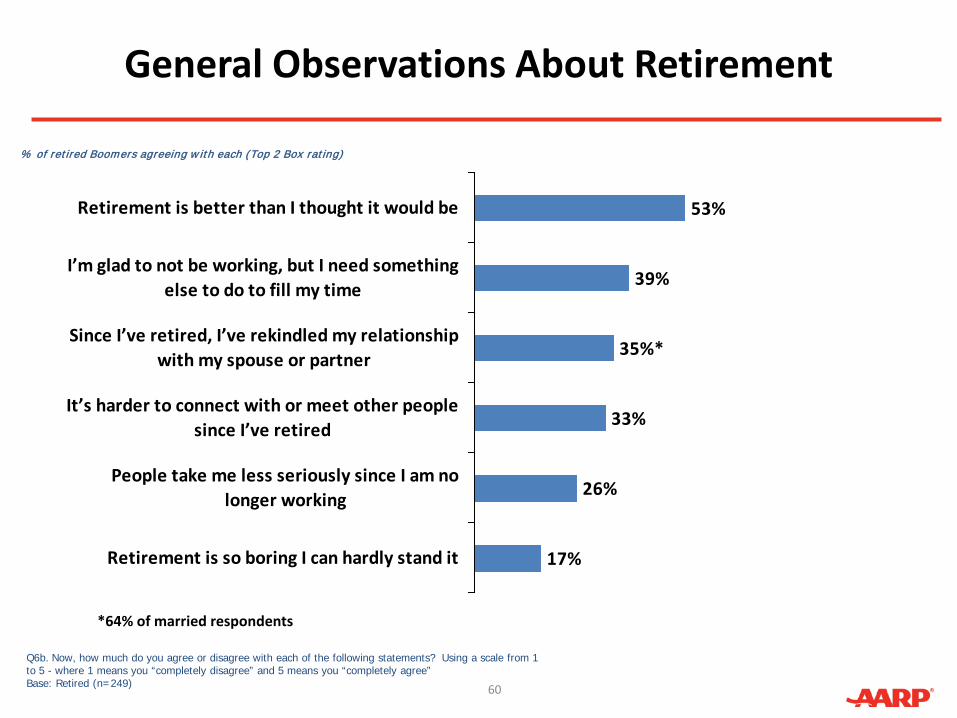
General Observations About Retirement
Q6b. Now, how much do you agree or disagree with each of the following statements? Using a scale from 1 to 5 - where 1 means you “completely disagree” and 5 means you “completely agree”Base: Retired (n=249)
17%
26%
33%
53%
35%*
39%
Retirement is so boring I can hardly stand it
People take me less seriously since I am nolonger working
It’s harder to connect with or meet other peoplesince I’ve retired
Since I’ve retired, I’ve rekindled my relationshipwith my spouse or partner
I’m glad to not be working, but I need somethingelse to do to fill my time
Retirement is better than I thought it would be
% of retired Boomers agreeing w ith each (Top 2 Box rating)
60
*64% of married respondents

Although Health Issues Are Prominent Among Retired Boomers, Insurance Coverage and Access to Health Care
Contribute to a More Positive Outlook
85% of retired boomers have health insurance, compared to 80% of non-retired boomers (down 9 points from 1997)
91% have been able to get the health care they need when they need it, compared to 70% of non-retired boomers who expect this when they retire
88% have been able to visit doctors of their own choosing, compared to
72% of non-retirees who expect to do so
86% have been able to see a specialist when they felt the need to,
compared to 71% of those who expect to do so
-
61

Key Take-Aways
62
TAKE
AWAYS
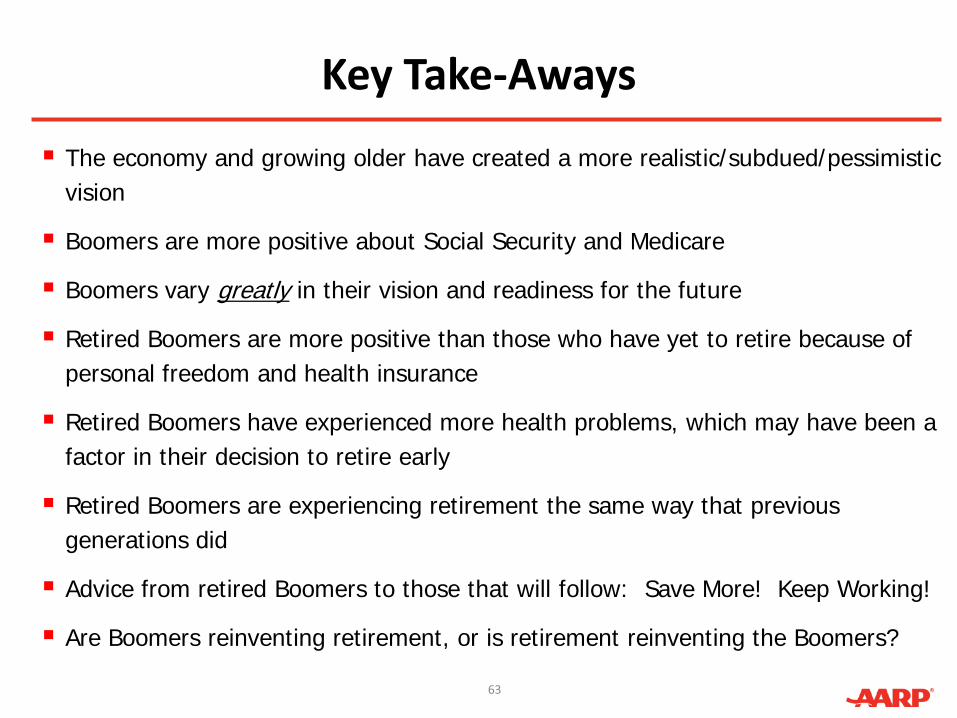
Key Take-Aways
The economy and growing older have created a more realistic/subdued/pessimistic vision
Boomers are more positive about Social Security and Medicare
Boomers vary greatly in their vision and readiness for the future
Retired Boomers are more positive than those who have yet to retire because of personal freedom and health insurance
Retired Boomers have experienced more health problems, which may have been a factor in their decision to retire early
Retired Boomers are experiencing retirement the same way that previous generations did
Advice from retired Boomers to those that will follow: Save More! Keep Working!
Are Boomers reinventing retirement, or is retirement reinventing the Boomers?
63

Baby Boomers EnvisionWhat’s Next?
Research and Strategic Analysis
Integrated Value and Strategy
June, 2011
© Copyright AARP and GFK Custom Research North America 2011