b2b sales winners and losers
TRANSCRIPT

COPYRIGHT © REVEGY, INC. // PROPRIETARY AND CONFIDENTIAL
WEBINAR
Sales Visibility
Why B2B Sales Teams Won & Lost in 2015
Hosted by

Janice Mars, Principal and Founder
Jennifer Earl, SVP, Customer Success
Today’s Presenters

Conducted in Q4 2015• Over 100 enterprise sales leaders
across industries
• 25% with average deal size over $100K
• Over 30% with sales cycles longer than 6 months
Survey Methodology

How’d your team do?
50%Missed Quota

Summary of Key Findings
33% 33%
61%
Administrative tasks
get in the way
% of opportunities
lost if deal slippage Lack of Visibility
#1 reason theylost deals

Winners
2015 Winners and Losers
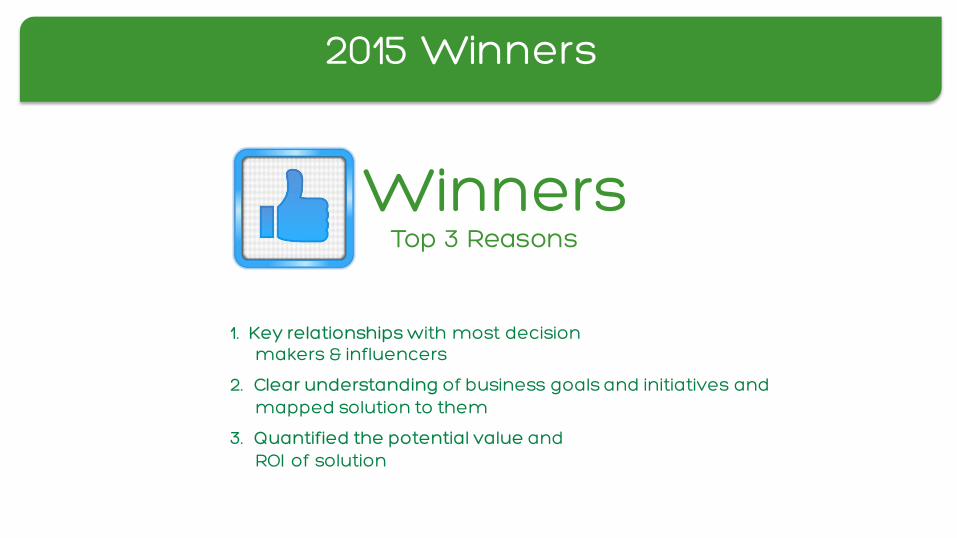
1. Key relationships with most decision makers & influencers
2. Clear understanding of business goals and initiatives and mapped solution to them
3. Quantified the potential value and ROI of solution
Top 3 Reasons
1. Lacked visibility of everything going on in account
2. Couldn’t prove value or create a senseof urgency
3. Competitive blind spots
LosersTop 3 Reasons

Case in Point: Relationships & Influencers
Lines of Business Relationships & Influencers
Priorities & Goals
Org Chart = Your Point of View Relationship Map = Customer’s Point of View
Financial services provider uses this more holistic view to reduce sales cycle length by understanding how decisions are influenced across buyer’s organization
Identifying Risk
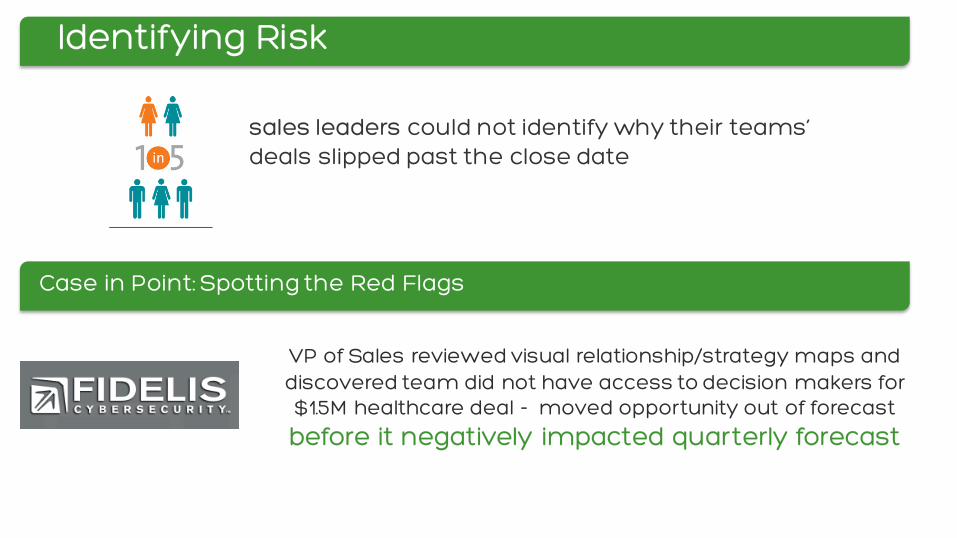
VP of Sales reviewed visual relationship/strategy maps and discovered team did not have access to decision makers for $1.5M healthcare deal - moved opportunity out of forecast
before it negatively impacted quarterly forecast
sales leaders could not identify why their teams’ deals slipped past the close date
Case in Point: Spotting the Red Flags

Winners
2015 Winners
1. Key relationships with most decision makers & influencers
2. Clear understanding of business goals and initiatives and mapped solution to them
3. Quantified the potential value and ROI of solution
Top 3 Reasons

Case in Point: Mapping Solutions to Goals
Leading analytics company closed $17M deal by mapping their solutions to top 3 goals of Fortune 100 healthcare/pharma organization

Case in Point: Aligning Value & Solutions
Leading real estate information company used a visual approach to understand
what was preventing their customers from achieving their goals and mapped solutions to how they could remove those barriers
Sales BI ToolsPredictive Analytics
Performance ManagementCurriculum Tools
Decision ManagementRevenue Data Model Analytics
Winners
2015 Winners
1. Key relationships with most decision makers & influencers
2. Clear understanding of business goals and initiatives and mapped solution to them
3. Quantified the potential value and ROI of solution
Top 3 Reasons

Case in Point: A Proven Path to Revenue Goals
• Historically focused on net new business and adding more logos
• In 2014, 15 – 20% of revenue was from existing customers, many of who are in the Fortune 1000
• Launched organic growth initiative by segmenting and prioritizing key accounts by value, penetration, relationship and future potential
• Built a blueprint using account planning to facilitate collaboration with customer and uncover immediate expansion opportunities
Within 3 quarters, revenue doubled within key accountsRevenues were up more than 50% in the first quarter of 2015

2016 Quotas
85%
Have higher quotas this year
Meeting Rising Expectations in 2016

How to Kickstart Your 2016
• Find a Path to Visibility
• Get Creative When it Comes to Coaching
• Put Your Resources into Improving: People, Process and Technology

Find a Path to Visibility

Get Creative with Coaching

Put Your Resources into Improvement
People Process
Technology

After today’s session, you’ll get a copy of the full 2016 Sales Visibility Index Survey Report
Email me at [email protected]
to get a copy of the slides from today’s presentation
Next Steps

If we don’t get to your question or if you want to learn more about the customer stories presented today, please reach
out to:
Q & A