b2. dealing with noise - university of oxfordgari/teaching/b18/lecture_slides/b18_lectureb... ·...
TRANSCRIPT

Biomedical Instrumentation B18/BME2
Biomedical
Instrumentation B2. Dealing with noise
B18/BME2
Dr Gari Clifford

Biomedical Instrumentation B18/BME2
Noise & artifact in biomedical signals
Ambient / power line interference: 50 ±0.2 Hz mains noise (or 60 Hz in many data sets) with an amplitude of up to 50% of full scale deflection (FSD), the peak-to-peak ECG amplitude. Also includes ambient light changes (for PPG)
Sensor pop or contact noise: Loss of contact between the sensor and the skin manifesting as sharp changes with saturation at FSD for periods of around 1 s on the ECG (usually due to an electrode being nearly or completely pulled off);
Patient–sensor motion artifacts: Movement of the electrode away from the contact area on the skin, leading to variations in the impedance between the electrode and skin causing potential variations in the ECG and usually manifesting themselves as rapid (but continuous) baseline jumps or complete saturation for up to 0.5 second;
Electromyographic (EMG) noise: Electrical activity due to muscle contractions lasting around 50 ms between dc and 10,000 Hz with an average amplitude of 10% FSD level;
Baseline drift: E.g. respiratory motion with an amplitude of ~15% FSD at frequencies drifting between 0.15-0.3 Hz;
Hardware electronics noise: Artifacts generated by the signal processing hardware, such as signal saturation;
Electrosurgical noise: Noise generated by other medical equipment present in the patient care environment a frequencies between 100 kHz and 1 MHz, lasting for approximately 1 and 10 seconds; - may include defibrillation artifact too.
Quantization noise: Steps introduced into data
Clock drift & missing data: Sampling frequency is not constant – always use a real-time OS
Aliasing: Spurious frequencies because sampling frequency is too low or data were resampled
Signal processing artifacts: (e.g., Gibbs oscillations, IIR filters, ).
Other biological sources & sinks :(e.g., non-conductive tissues, fetal/maternal mixture, observer pulse).

Biomedical Instrumentation B18/BME2
Quantisation Noise
Imagine a QRS complex
The R-peak is always cut-off
This leads to additional low
and high frequency
contributions to the signal
Biomedical Instrumentation B18/BME2
Quantisation Noise
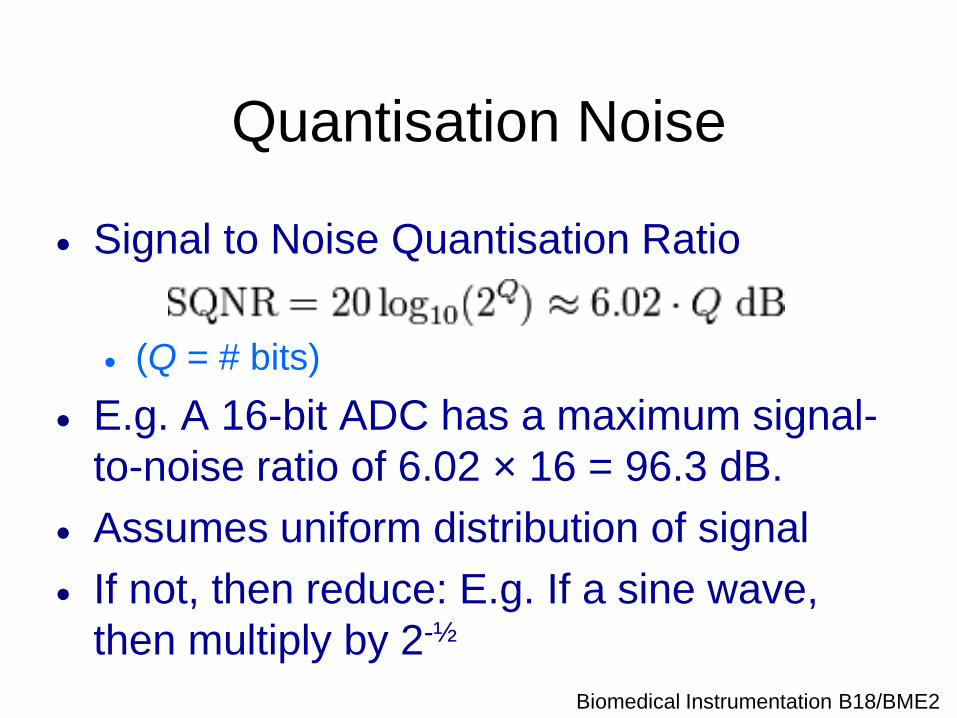
Signal to Noise Quantisation Ratio
(Q = # bits)
E.g. A 16-bit ADC has a maximum signal-
to-noise ratio of 6.02 × 16 = 96.3 dB.
Assumes uniform distribution of signal
If not, then reduce: E.g. If a sine wave,
then multiply by 2-½
Biomedical Instrumentation B18/BME2
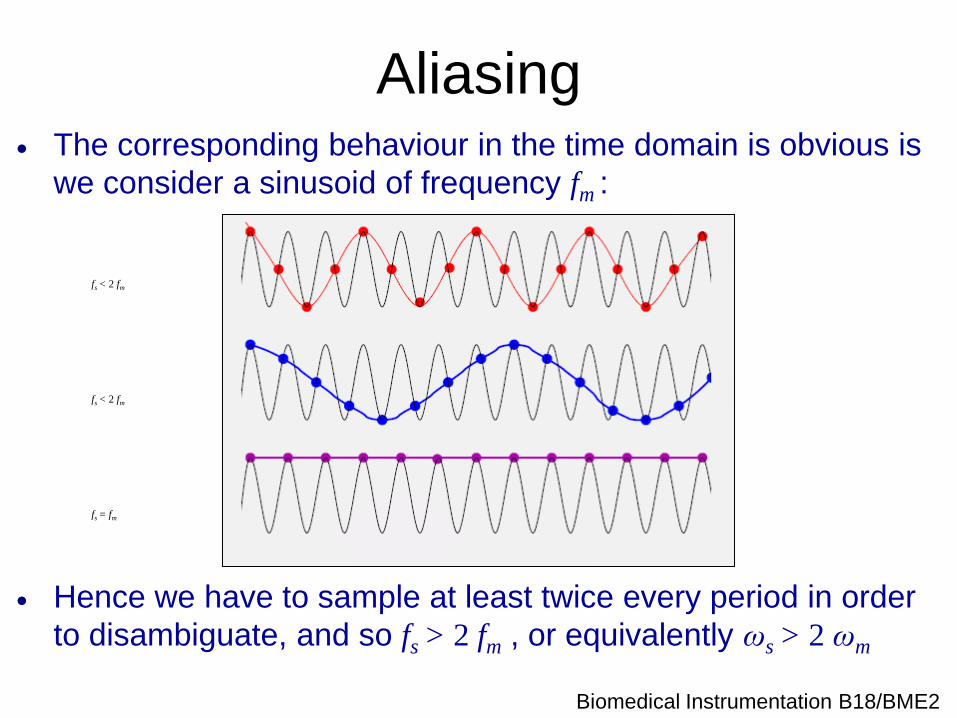
Aliasing The corresponding behaviour in the time domain is obvious is
we consider a sinusoid of frequency fm :
Hence we have to sample at least twice every period in order
to disambiguate, and so fs > 2 fm , or equivalently ωs > 2 ωm
fs < 2 fm
fs < 2 fm
fs = fm
Biomedical Instrumentation B18/BME2
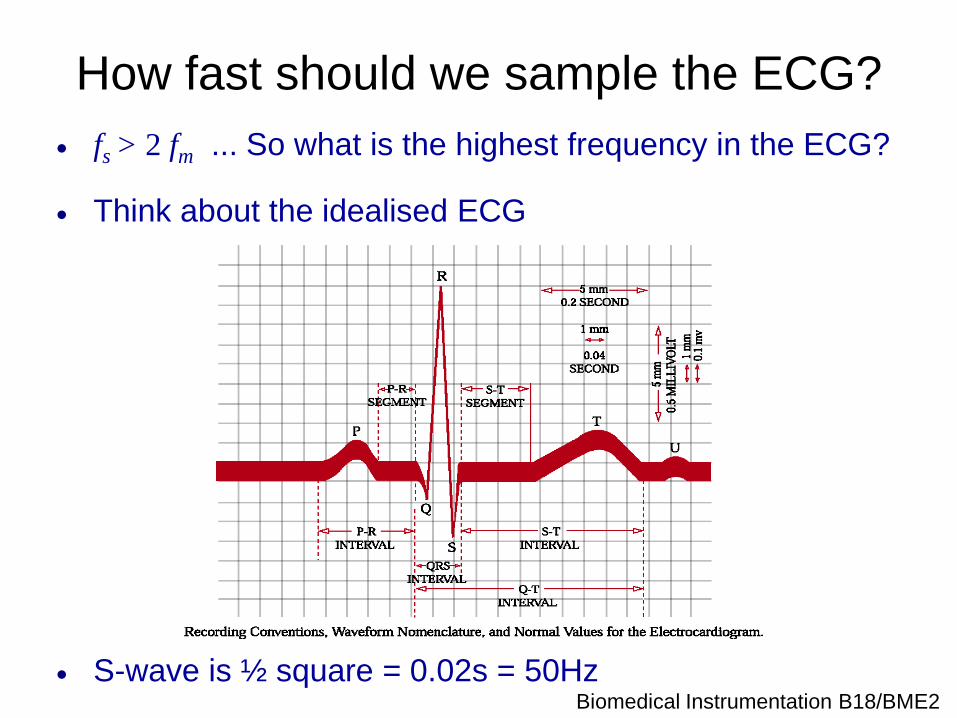
How fast should we sample the ECG?
fs > 2 fm ... So what is the highest frequency in the ECG?
Think about the idealised ECG
S-wave is ½ square = 0.02s = 50Hz

Biomedical Instrumentation B18/BME2
Signal Processing Artifacts
Spectral leakage
Windowing
Harmonics
Multiples of the
fundamental
frequency
E.g. ...

Biomedical Instrumentation B18/BME2
DFT recap: Sampling
Sample the time-signal by multiplication
with a train of pulses...
...which corresponds to convolution
in the frequency domain
Biomedical Instrumentation B18/BME2
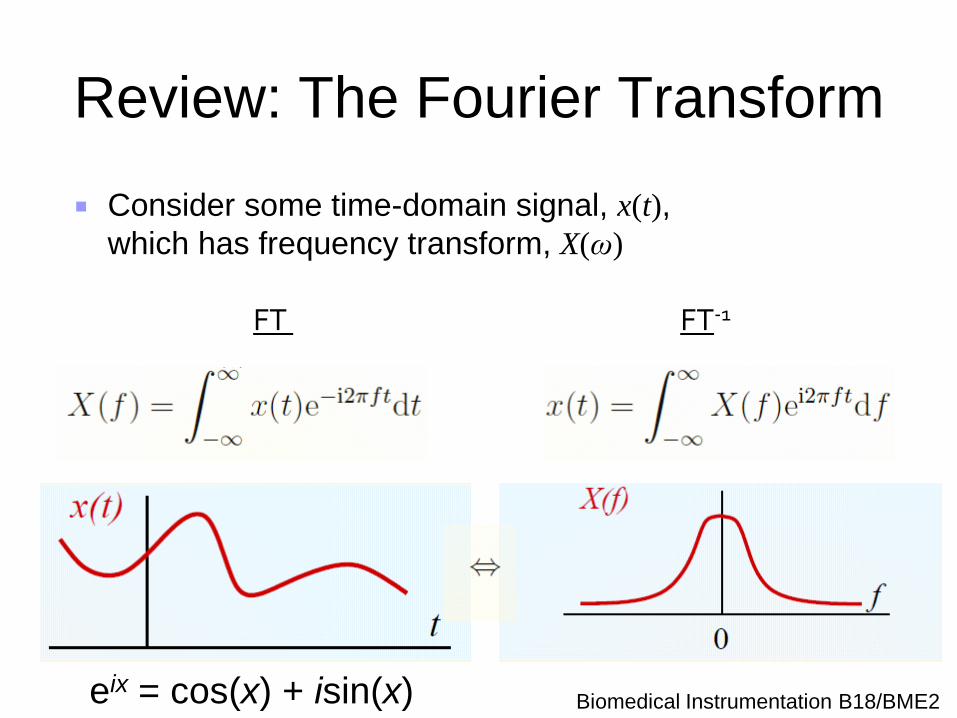
Consider some time-domain signal, x(t),
which has frequency transform, X(ω)
FT FT-1
Review: The Fourier Transform
eix = cos(x) + isin(x)

Biomedical Instrumentation B18/BME2
Sampling x(t) means multiplying it by a pulse train
This means convolving X(f) with the FT of the pulse train
Review: time-sampling
pulse train time signal Convolved freq. signal
Biomedical Instrumentation B18/BME2
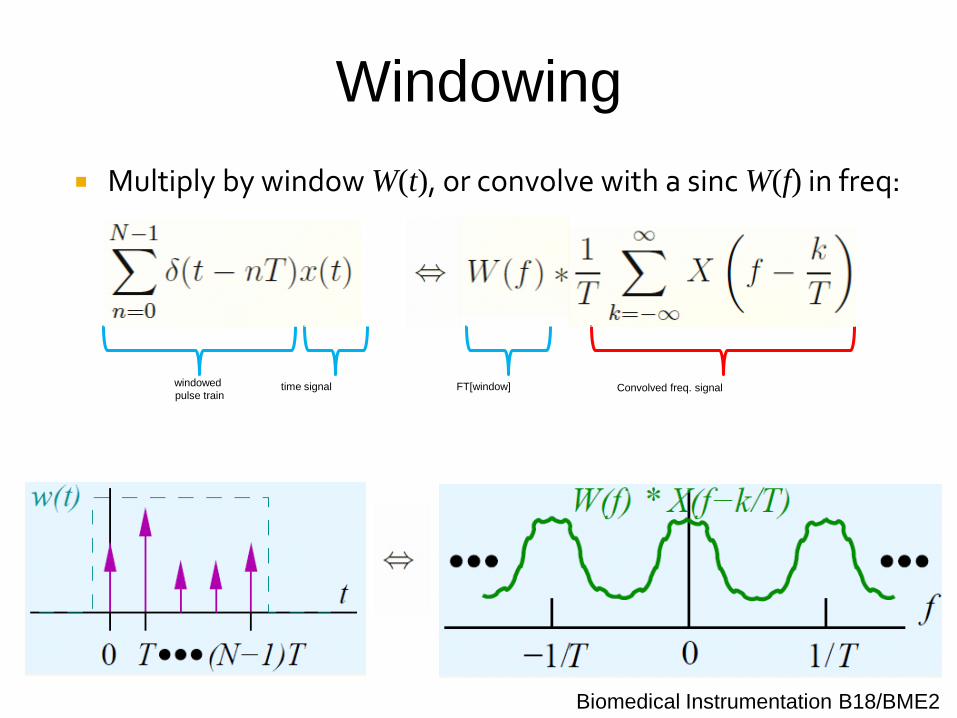
Multiply by window W(t), or convolve with a sinc W(f) in freq:
Windowing
windowed
pulse train time signal Convolved freq. signal FT[window]

Biomedical Instrumentation B18/BME2
The DFT
The DFT:
The DFT-1:
Biomedical Instrumentation B18/BME2
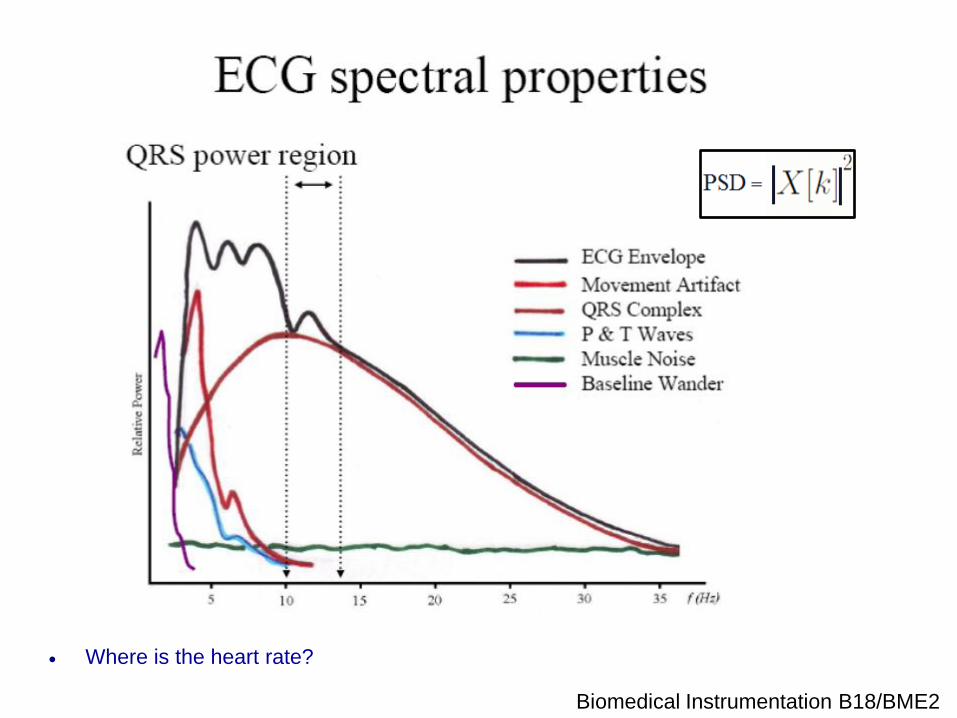
Where is the heart rate?

Biomedical Instrumentation B18/BME2
Signal Processing Artifacts
Filter distortion
Finite Impulse Response – pass band ripple, amplitude
attenuation
Infinite Impulse Filters – phase distortion
Biomedical Instrumentation B18/BME2
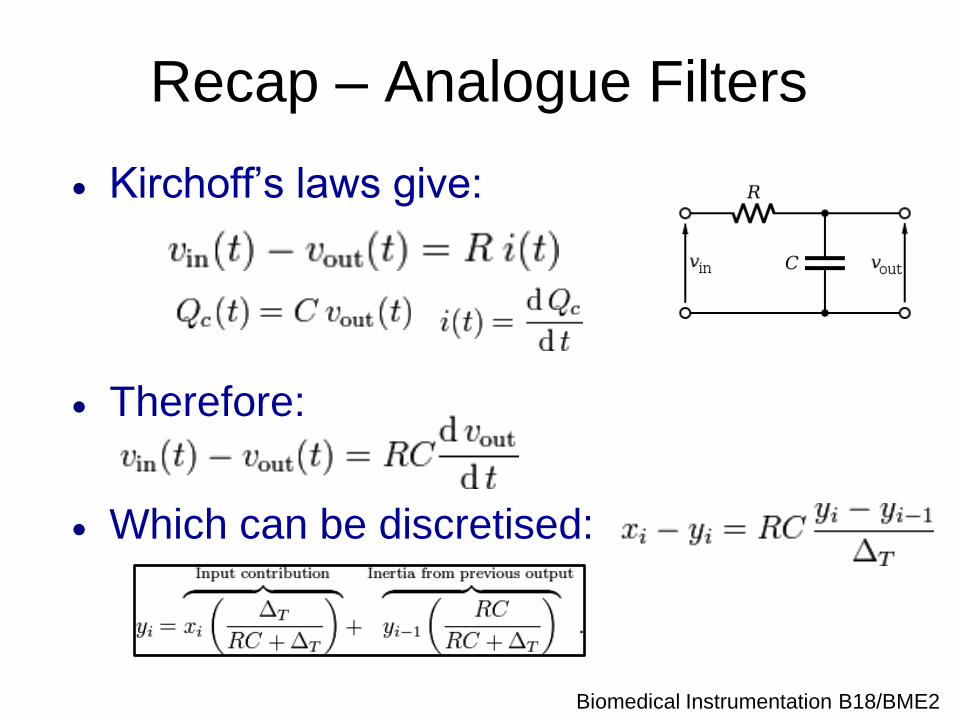
Recap – Analogue Filters
Kirchoff’s laws give:
Therefore:
Which can be discretised:

Biomedical Instrumentation B18/BME2
Recap – Analogue Filters
Magnitude of gains:
... and phases:
Impulse responses: (Inverse Laplace Transform of H ...
with =RC ... i.e. Response of
circuit to a Dirac delta (t).
Note u(t) is Heaviside function) and a three poles (origin, =1/RC)
Biomedical Instrumentation B18/BME2
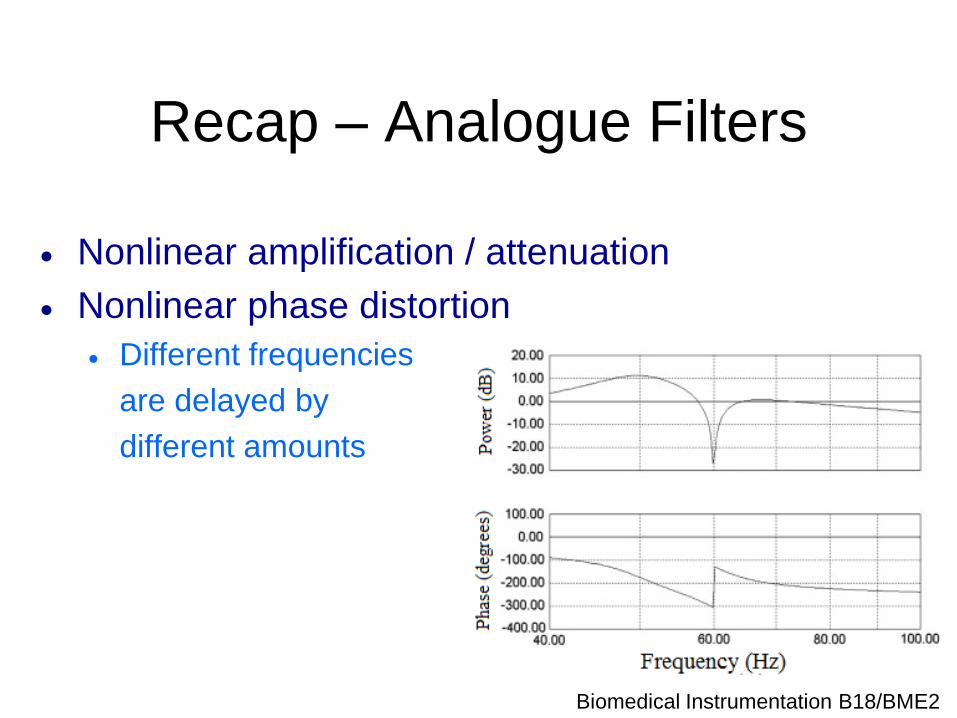
Recap – Analogue Filters
Nonlinear amplification / attenuation
Nonlinear phase distortion
Different frequencies
are delayed by
different amounts

Biomedical Instrumentation B18/BME2
Recap – Digital Filters
A filter transforms the input signal:
X is transformed into Y by multiplying by a transfer
function H
H is composed of two types of coefficients (a & b)
The a’s multiply the input signal (X) only
The b’s include the output in the calculation
P is the feedforward order and Q the feedback order
Poles of filter are found by setting denominator of H
equal to zero

Biomedical Instrumentation B18/BME2
Frequency & Phase Response
Convert an impulse
function to frequency and
phase response.
E.g. bk ={0.3, 0.7, 0, -0.3, -0.7}

Biomedical Instrumentation B18/BME2
Signal Processing Artifacts
Filter distortion
Finite Impulse Response – pass band ripple, amplitude
attenuation
Infinite Impulse Filters – phase distortion

Biomedical Instrumentation B18/BME2
Gibbs Oscillations / Ringing
Consequence of
convolving
impulse response
of window (sinc
function) with
signal
In electrical
circuits= oscillation
of V or I when
electrical pulse
causes the
parasitic C & L
(from other
materials on IC)

Biomedical Instrumentation B18/BME2
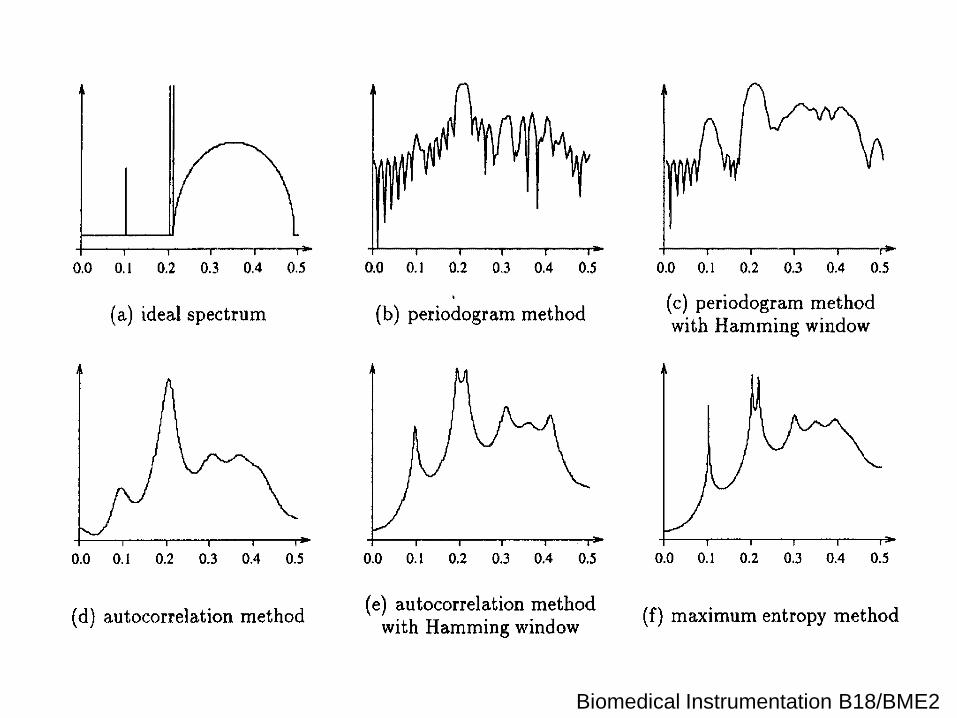
AR models for spectral estimation
The notation AR(p) refers to the autoregressive model of
order p. The AR(p) model is written as follows:
Y t = ai Y t-i + t (1 i p)
where the ai’s are the parameters of the model and εt is a white-noise process with zero mean.
An autoregressive model is essentially an infinite
impulse response filter which shapes the white-noise
input. The poles are the resonances of the filter and
correspond to the spectral peaks in the signal.

Biomedical Instrumentation B18/BME2
AR-model vs FFT spectra (for EEG)
AR model is
parametric
Requires only a
few coefficients
Useful for
estimation on
short time series
Biomedical Instrumentation B18/BME2

Biomedical Instrumentation B18/BME2
Credits
DFT slides – Dr David Clifton
PSD slide – Dr James Pardey