b io d iesel p ro d u ction fro m jatropha curcas o il · b io d iesel p ro d u ction fro m...
TRANSCRIPT
i
Biodiesel Production from Jatropha curcas O il
A Major Qualifying Project
submitted to the Faculty of
WORCESTER POLYTECHNIC INSTITUTE
in partial fulfilment of the requirements for the
degree of Bachelor of Science in Chemical Engineering
By:
_________________________________
Stephanie Kavrakis
__________________________________
Lindsay Wood
Approved:
__________________________________
Professor Robert W. Thompson, Major Advisor Department of Chemical Engineering
This report represents work of WPI undergraduate students submitted to the faculty as evidence of a degree requirement. WPI routinely publishes these reports on its web site without editorial or peer
review. For more information about the projects program at WPI, see http://www.wpi.edu/Academics/Projects.

ii
Abstract
The country of Haiti has the capability to use biodiesel for their transportation needs.
This would increase their fuel security, economy and environmental impact. Jatropha curcas is a
plant that will grow well in Haiti and produce a high yield of biodiesel. This report outlines
studies done to find the optimal method for converting J. curcas oil to usable biodiesel. The
amount of alkaline catalyst and ratio of methanol to fresh oil for the greatest conversion of fatty
acid methyl esters are reported. In addition, the optimal reaction was established. Finding the
most efficient way to convert J. curcas oil to biodiesel would allow for this biodiesel to be
produced as economically as possible.

iii
Acknowledgements
This project team would like to thank our advisor Professor Robert W. Thompson for his
continued guidance and support throughout the entirety of this project. Also, we would like to
thank alumnus, Andrew Stern, class of 1992, for sharing his interest for the topic of this report.
We would like to give special thanks to Professor Kumar, Department of Chemistry and
Professor Fishtik for answering our questions and pointing us in the right direction. In addition,
we would like to thank Jack Ferraro, for trouble shooting our equipment when needed.
We would like to thank the Worcester Polytechnic Institute, without which we would not
be able to participate in this project.

iv
Authorship
Introduction: Lindsay Wood with edits from Stephanie Kavrakis
Background: Lindsay Wood with edits from Stephanie Kavrakis
Methodology: Lindsay Wood and Stephanie Kavarkis
Results and Analysis: Lindsay Wood and Stephanie Kavrakis
Recommendations: Lindsay Wood and Stephanie Kavrakis
Conclusions: Stephanie Kavrakis with edits from Lindsay Wood
Appendix A Procedures: Lindsay Wood
Appendix B Recommended Procedures: Lindsay Wood
Appendix C Calculations and Data: Lindsay Wood and Stephanie Kavrakis
Appendix D Physical Description of Unwashed biodiesel: Stephanie Kavrakis
Appendix E Economic Analysis for Capital Cost Estimates: Stephanie Kavrakis
Formatting: Lindsay Wood

v
Table of Contents 1 Introduction ................................................................................................................................................... 1 2 Background Chapter ..................................................................................................................................... 4
2.1 Petroleum Diesel Description .................................................................................................................... 4 2.2 Biodiesel Description ................................................................................................................................ 5
2.2.1 Standards ........................................................................................................................................... 7 2.3 Petroleum Diesel and Biodiesel Comparison ............................................................................................ 7
2.3.1 Composition Comparison ................................................................................................................. 7 2.3.2 Environmental Comparison ............................................................................................................ 10
2.4 Chemistry of Biodiesel Production .......................................................................................................... 11 2.4.1 Basic Transesterification Reaction .................................................................................................. 11 2.4.2 Variations of Catalysts .................................................................................................................... 15 2.4.3 Two Step Reaction Process ............................................................................................................. 18 2.4.4 Post Reaction Processing ................................................................................................................ 19
2.5 Characteristics of Jatropha curcas............................................................................................................ 20 2.5.1 History of J. curcas Use .................................................................................................................. 21 2.5.2 Growing Conditions for J. curcas ................................................................................................... 22 2.5.3 Yield of Oil from J. curcas ............................................................................................................. 22 2.5.4 Programs in Haiti Involving J. curcas ............................................................................................ 22
3 M ethodology ................................................................................................................................................ 23 3.1 Materials .................................................................................................................................................. 23 3.2 Development of Procedures of Reactions with Edible Oils ..................................................................... 23 3.3 Development of Procedures for J. curcas Biodiesel Production ............................................................. 24
3.3.1 Development of Pretreatment ......................................................................................................... 24 3.3.2 Development of Transesterification Reaction ................................................................................. 25 3.3.3 Development of Separation of Biodiesel ........................................................................................ 27 3.3.4 Development for Purification of Biodiesel ..................................................................................... 28 3.3.5 Development of Analysis of Biodiesel ............................................................................................ 29
4 Results and Analysis of Soy and Coconut O il ........................................................................................... 30 4.1 Results of Experimentation...................................................................................................................... 30 4.2 Possible sources of error for soy and coconut oil .................................................................................... 31
4.2.1 Loss of methanol ............................................................................................................................. 31 4.2.2 Integrity of catalyst ......................................................................................................................... 32
4.3 Limitations Found During Experiments .................................................................................................. 32 5 Results for J. curcas Biodiesel Production ................................................................................................ 33
5.1 Determining physiochemical properties of J. curcas............................................................................... 33 5.1.1 Water Content ................................................................................................................................. 33 5.1.2 Density ............................................................................................................................................ 33 5.1.3 Acid Content ................................................................................................................................... 33
5.2 Pretreatment of J. curcas Oil ................................................................................................................... 34 5.3 Variation of Reaction time....................................................................................................................... 35 5.4 Variation of Methanol Amount ............................................................................................................... 36 5.5 Possible errors when processing J. curcas ............................................................................................... 37 5.6 Separation and Purification of Biodiesel Product .................................................................................... 37
5.6.1 Quality ............................................................................................................................................ 37 5.6.2 Removal of Methanol by distillation ............................................................................................... 37 5.6.3 Water Wash to Remove of Catalyst ................................................................................................ 38
6 Conclusions .................................................................................................................................................. 39

vi
7 Recommendations ....................................................................................................................................... 40 7.1 Recommendations for Laboratory Arrangement ..................................................................................... 40 7.2 Recommendations for Components ......................................................................................................... 40 7.3 Further Studies on Parameters ................................................................................................................. 40 7.4 Further Studies on Quality Analysis ........................................................................................................ 41 7.5 Further Studies on Recover of Components ............................................................................................ 41 7.6 Economic Analysis .................................................................................................................................. 42
8 Appendix A : Procedures for Exper iments .................................................................................................. a Contact information for Dawn Exports .................................................................................................................... a A-1 Procedure of Transesterification Reaction with Edible Oils ............................................................................. a A-2 Pretreatment of J. curcas Oil ............................................................................................................................ b
Water removal ................................................................................................................................................. b Density test ...................................................................................................................................................... b Acid Value test ................................................................................................................................................ b
A-2 Transesterification Reaction of J. curcas Oil.................................................................................................... b Acid catalyzed Transesterification .................................................................................................................. b Alkaline Catalyzed Transesterification ........................................................................................................... c
A-3 Separation and Purification of Biodiesel Product ............................................................................................. c Separation of Biodiesel form Glycerin ............................................................................................................ c Removal of Methanol ...................................................................................................................................... d Removal of Methanol by distillation ............................................................................................................... d Removal of Catalyst ........................................................................................................................................ d
9 Appendix B : Recommended Procedures ..................................................................................................... e B-1 Analysis by Gas Chromatography .................................................................................................................... e
10 Appendix C : Calculations and Data ............................................................................................................ f C-1 Density Determination ...................................................................................................................................... f C-2 Acid Value Calculations for J. curcas oil ......................................................................................................... f C-3 Time Variable ................................................................................................................................................... g C-4 Methanol Variable ............................................................................................................................................ h C-5 Distillation of Methanol .....................................................................................................................................i C-6 Recovery of Catalyst ..........................................................................................................................................j C-7 Final Biodiesel Product .................................................................................................................................... k
11 Appendix D: Descr iption of Samples ............................................................................................................l D-1 Physical Description of Unwashed biodiesel .....................................................................................................l
12 Appendix E : Economic Analysis ................................................................................................................ m E-1 Economic Analysis for Capital Cost Estimates ................................................................................................m
Purchased Equipment Cost .............................................................................................................................m Auxiliary facilities cost (land, utility systems, site preparation etc.) ..............................................................m Plant Land Cost ..............................................................................................................................................m Engineering ..................................................................................................................................................... n Utilities systems .............................................................................................................................................. n
12.1 E-2 Plant Performance Data- Crown Plant ................................................................................................ p 13 References ..................................................................................................................................................... q

vii
Table of Tables Table 2-1: Properties of Diesel Fuels based on ASTM D975-97 (Kemp, 2006) ........................................................... 5 Table 2-2: Some Properties of Biodiesel Fuels based on ASTM and EN (Mittelbach & Remshmidt, 2006) ............... 7 Table 2-3: Properties of Petroleum Diesel and Jatropha Oil (Tiwari et al., 2007) ......................................................... 8 Table 2-4: Free Fatty Acid Composition in Feedstocks (Ma & Hanna, 2009) ............................................................ 13 Table 3-1: Reaction Parameters for Testing Reaction Time ........................................................................................ 27 Table 3-2: Reaction Parameters for Testing Methanol Amount .................................................................................. 27 Table 8-1: Transesterification Variables ........................................................................................................................ c Table 10-1: Results of Time Variation for Single Step Process .................................................................................... g Table 10-2: Results for Time Variation for Two Step Process ...................................................................................... g Table 10-3: Methanol Variable Results Before Washing .............................................................................................. h Table 10-4: Results of Methanol Distillation..................................................................................................................i Table 10-5: Results of Washing .....................................................................................................................................j Table 10-6: Final Yield of Biodiesel ............................................................................................................................. k Table 13-1: Equipment Costs (Turton et al., 2003) ......................................................................................................m
Table of F igures
Figure 1-1: Petroleum Consumption in Haiti (Energy Information Administration, 2008)........................................... 1 Figure 2-1: Usage of Plants for Biodiesel Feedstock Worldwide (Mittelbach & Remshmidt, 2006) ............................ 6 Figure 2-2: Clean Cities Results of Emissions from Biodiesel Mixes (U. S. Department of Energy, 2008) ............... 11 Figure 2-3: Transesterification of Triglycerides (Meher et al., 2004) ......................................................................... 12 Figure 2-4: Mechanism for Alkaline Base Transesterification (Meher et al., 2004) ................................................... 16 Figure 2-5: Mechanism of Transesterification with Acid Catalyst (Meher et al., 2004) ............................................. 18 Figure 2-6: Map of World Colored by Climate (Centre for Jatropha Promotion) ....................................................... 21 Figure 3-1: Distillation Set up (Chromic, 2002) .......................................................................................................... 28 Figure 4-1: Lab sample after transesterification reaction, top layer is biodiesel and bottom layer is glycerol ............ 30 Figure 4-2: Percent of Separated Parts by Weight ....................................................................................................... 31 Figure 5-1: Results of Biodiesel Yield for Pretreated and Non-Pretreated Oil ............................................................ 34 Figure 5-2: Batches of both the pretreated oil and non-pretreated oil under the same conditions ............................... 35 Figure 5-4: Results of Methanol Variation .................................................................................................................. 36 Figure 5-3: Samples after transesterification and resting time..................................................................................... 36 Figure 5-5: Failed and Successful Samples after Water Washing ............................................................................... 38 Figure 8-1: Erlenmeyer flasks containing coconut oil (back two flasks) and soy oil (front two flasks) are being
reacted with methanol and catalyst .................................................................................................................. a Figure 8-2: Neutralized Oil ............................................................................................................................................ b

1
1 Introduction
Haiti is a small island country, approximately 27,560 square kilometers (Central
Intelligence Agency, 2009). This third world county has eighty percent of its population under
the poverty line and sixty six percent of population is employed by agriculture business (Central
Intelligence Agency, 2009). The socio-economic profile of the country has the potential to be
supported and improved by introducing a fuel source that is grown locally. Currently, the
majority of the fuel source for transportation in Haiti is based on petroleum diesel and is
imported from other countries (Rothkopt, 2008). Figure 1-1 depicts the amount of fuel used, in
thousand barrels per day, in Haiti between 1980 and 2006 (Energy Information Administration,
2008). The graph shows the overall increased consumption of petroleum and its likely continued
increasing trend. Plants grown for a biomass fuel source, such as biodiesel, have the possibility
of increasing the amount and quality of the workforce, while providing independence to the
country’s energy needs (Rothkopt, 2008). The United Nations has started biodiesel programs
with Haiti, because they believe biodiesel will be a strong developmental tool for the country
(Rothkopt, 2008). This program includes cooperation with Brazil and cultivation of the J. curcas
plant. Brazil is a strong leader in biodiesel development for developing countries.
F igure 1-1: Petroleum Consumption in Haiti (Energy Information Administration, 2008)
0.005.0010.0015.00
1975 1980 1985 1990 1995 2000 2005 2010
Thousand Barrels/day
Year 19802006
Petroleum Consumption in Haiti

2
Other benefits of bringing biodiesel to the country of Haiti are the environmental
benefits. As stated previously, the majority of transportation in Haiti is supported by petroleum
diesel. Petroleum diesel is finite and harmful to the environment due to emissions of particulate
matter, which according to the EPA is also known as particle pollution or PM, is a complex
mixture of extremely small particles and liquid droplets. Particle pollution is made up of a
number of components, including acids (such as nitrates and sulfates), organic chemicals, metals,
and soil or dust particles (Environmental Protection Agency). Biodiesel offers an alternative
energy source in place of petroleum diesel that is renewable and more environmentally
favorable.
Jatropha curcas (J. curcas) is a plant that is inedible to humans, but can be used to
produce biodiesel. Due to the ease of growing J. curcas and that it will not influence current
food markets; J. curcas is a viable choice as feedstock for biodiesel. The plant is drought
resistant and can grow in low nutrient soils. The plant can also produce up to forty percent yield
by weight of oil per seed (Jaffery, 2009).
This report discusses the fuel used now in Haiti, petroleum diesel, and the possible affects
when changing to biodiesel, specifically with J. curcas oil as the feedstock. The advantages and
disadvantages of J. curcas oil are compared. The chemistry involved in processing J. curcas oil
are outlined and the corresponding experimentation was carried out in order to find the process
most efficient biodiesel, with the highest concentration of fatty methyl esters.
This report also discusses the procedures needed to process J. curcas most efficiently.
The knowledge of the necessary steps to process vegetable oil to a biodiesel is known; however,
the specific parameters are not known for J. curcas oil. This project examines the chemical

3
properties of the oil and the effects they have on the reaction process. Information about the
reaction process was found through research and smallscale experimentation. Experimental
data concerning reaction conditions, process parameters, as well as the amounts and
concentrations of the chemicals were used to find the most efficient method of producing
biodiesel from J. curcas oil. The project considers the production of biodiesel on a largescale
system from the energy cycle of growing the plant through processing. The purpose of this
project was to create a model for efficient production of biodiesel from the J. curcas plant for the
conversion of the petroleum diesel based transportation system of Haiti to a biodiesel based
transportation system.

4
2 Background Chapter
2.1 Petroleum Diesel Description
The two most popular types of transportation fuels are diesel and gasoline. Gasoline uses
spark ignition engines that are used by over 90% of the small car industry in the United States
(Kemp, 2006). Petroleum diesel fuels are used in the compression ignition engine. These
engines are increasingly popular in Europe, being used 30% of the time (Kemp, 2006). Diesel
engines in the past were not as efficient as gasoline engines; increases in technology have made
diesel engines much more efficient. Diesel engines are quieter and emit less smoke than they
have in the past. For a certain amount of power, diesel engines require 30%-60% less fuel
(Kemp, 2006). Since diesel engines require less fuel, there are less greenhouse emissions
contributed to diesel engines per mile driven. Overall diesel engines produce more power and are
longer lasting then gasoline engines.
Petroleum diesel is processed from crude oil through refining (Sheehan, et al.1998). This
process distills crude oil through distillation to separate hydrocarbons by their boiling points.
The largest hydrocarbons that are the bottom of the distillation column are the least expensive
hydrocarbons used for asphalt. The top of the column is the more expensive hydrocarbons that
have gone through the most separation and refinement (Kemp, 2006). Liquefied petroleum gas
and gasoline are at the top of the column, diesel fuels are slightly less refined than gasoline
(Kemp, 2006). After the refining processes, the oil is treated before being sold as a fuel. Lower
grade hydrocarbons can be processed a second time in a crackling unit to increase their value and
some of those products can be used as diesel fuels. Diesel fuel is further processed and has five
different grades used by the ASTM: Grade Low Sulfur No. 1-D, Grade Low Sulfur No. 2-D,
Grade No. 1-D, Grade No. 2-D, and Grade No. 3-D. Grades 2-D and 3-D are the two out of the

5
five that are not used for automobile applications because they are less refined (Kemp, 2006).
Approximately 47% of petroleum processed is converted to gasoline and 24% is processed to be
diesel fuel. Table 2-1 (Kemp, 2006) shows the properties required by petroleum diesel fuels
based on ASTM standards.
Table 2-1: Properties of Diesel Fuels based on AST M D975-97 (K emp, 2006)
Property G rade Low Sulfur 1-D Low Sulfur 2-D
Flash point ◦C min. 38 52 Water and Sediment,
v% max. 0.05 0.05
Distillation Temp. ◦C for 90%
Min. Max.
-
288
282 338
Kinematic Viscosity mm2/s at 40◦C
Min. Max.
1.3 2.4
1.9 4.1
Cetane Number 40 40 Ramsbottom carbon
residue, on 10%, wt% 0.15 0.35
2.2 Biodiesel Description
Biodiesel is a renewable fuel source that can replace petroleum diesel in compression
ignition engines without any change to the engine (Kemp, 2006). Rudolf Diesel first used plant
oils in his diesel engine in 1900, when he displayed his diesel engine at the World’s Exhibition in
Paris with peanut oil (Mittelbach & Remshmidt, 2006). The low price of petroleum based fuels
increased interest in petroleum fuels over that of biofuels. Due to this, interest and research in
biofuels diminished (Mittelbach & Remshmidt, 2006).
To change agricultural oil to a biodiesel, the process of transesterification of the
feedstock is done. Biodiesel can be produced from a number of different feedstocks such as
corn, soy, palm, coconut, or sunflower oil. Additionally, it can be produced from other oil
bearing plants that are not consumed as a food source such as Jojoba, Karanja, and Jatropha

6
curcas (J. curcas) oil, or microorganisms, like Algae (Centre for Jatropha Promotion). The
process of transesterification of plant oils was done as far back as 1852. It was used in the fat
and soap industry in the 1930’s and 1940’s (Mittelbach & Remshmidt, 2006). Fatty acid methyl
ester production through transesterification of plant oils became popular in the 1980’s and has
increased to be the most common type of biofuel for transportation (Mittelbach & Remshmidt,
2006).
The biodiesel feedstock, a vegetable or plant, can be chosen based on the availability of
the plant and the plant oil’s ability to produce esters. In Europe, the majority of biodiesel is
produced from rapeseed oil, while in the United States soybeans are much more abundant so
soybean oil is used more frequently for biodiesel production (Sheehan, et al.1998). J. curcas
grows naturally in Haiti and is a candidate for biodiesel production. The most common biodiesel
feedstocks and their usage are shown in Figure 2-1 (Mittelbach & Remshmidt, 2006).
F igure 2-1: Usage of Plants for Biodiesel F eedstock Worldwide (M ittelbach & Remshmidt, 2006)
Soybean32%
Rapeseed13%Palm
28%
Sunflower9%
Peanut5%
Cotton seed4%
Palm kernal3%
Coconut3%
Other3%

7
2.2.1 Standards
Haiti does not have any biofuel laws and standards so the United States standards were
used in this project. The United States uses the American Society for Testing and Materials
(ASTM) standards for testing the quality of biodiesel (Mittelbach & Remshmidt, 2006). The
document containing all of the biodiesel standards for ASTM is called ASTM D 6751. The
European Committee for Standardization also has a set of standards that are used by the
European Union. These standards are in the document EN 14214. Table 2-2 (Mittelbach &
Remshmidt, 2006) shows the properties required for biodiesel by both American and European
standards.
Table 2-2: Some Properties of Biodiesel Fuels based on AST M and E N (M ittelbach & Remshmidt, 2006)
Standard Ester Content min wt%
Cetane min
cetane number
Car bon Residue max wt%
Acid value
max value
Total G lycerol max wt%
Water K inematic viscosity
mm2/s
Density g/mL at 15◦C
ASTM D67651
- 47.0 0.05 0.80 0.24 0.05 v% 1.9-6.0 -
EN 14214
96.5 51.0 0.30 0.50 0.25 500 mg/kg
3.5-5.0 860-900
2.3 Petroleum Diesel and Biodiesel Comparison
The switch from petroleum-based diesel compared to biodiesel has its advantages and
disadvantages. There are changes in energy efficiency based on composition, changes in
environmental impacts, and differences in cost between the two types of diesel.
2.3.1 Composition Comparison
Variables measured for diesel fuels that affect efficiency include viscosity, cetane
number, flash point, carbon residue, and lubricity. Table 2-3 shows that by processing J. curcas
oil the properties become closer to those of diesel fuels. This makes the biodiesel much more
compatible with diesel engines (Tiwari, Akhilesh, & Raheman, 2007).
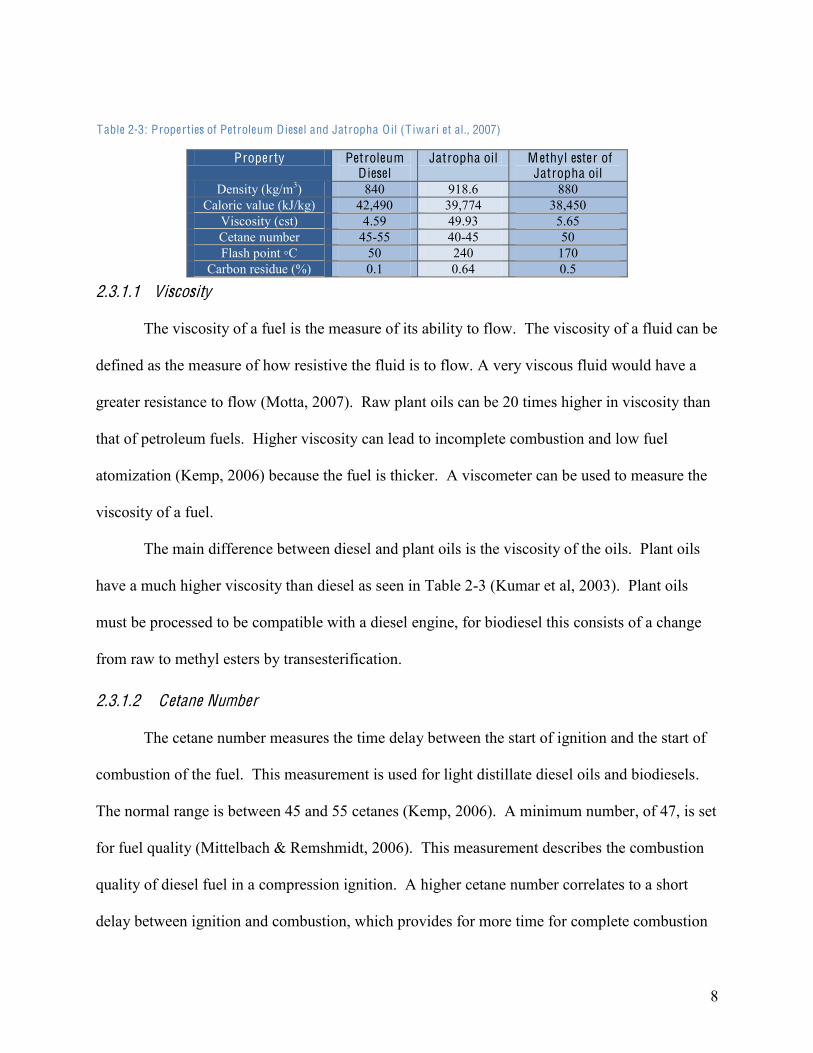
8
Table 2-3: Properties of Petroleum Diesel and Jatropha O il (T iwari et al., 2007)
Property Petroleum Diesel
Jatropha oil M ethyl ester of Jatropha oil
Density (kg/m3) 840 918.6 880 Caloric value (kJ/kg) 42,490 39,774 38,450
Viscosity (cst) 4.59 49.93 5.65 Cetane number 45-55 40-45 50 Flash point ◦C 50 240 170
Carbon residue (%) 0.1 0.64 0.5
2.3.1.1 Viscosity
The viscosity of a fuel is the measure of its ability to flow. The viscosity of a fluid can be
defined as the measure of how resistive the fluid is to flow. A very viscous fluid would have a
greater resistance to flow (Motta, 2007). Raw plant oils can be 20 times higher in viscosity than
that of petroleum fuels. Higher viscosity can lead to incomplete combustion and low fuel
atomization (Kemp, 2006) because the fuel is thicker. A viscometer can be used to measure the
viscosity of a fuel.
The main difference between diesel and plant oils is the viscosity of the oils. Plant oils
have a much higher viscosity than diesel as seen in Table 2-3 (Kumar et al, 2003). Plant oils
must be processed to be compatible with a diesel engine, for biodiesel this consists of a change
from raw to methyl esters by transesterification.
2.3.1.2 Cetane Number
The cetane number measures the time delay between the start of ignition and the start of
combustion of the fuel. This measurement is used for light distillate diesel oils and biodiesels.
The normal range is between 45 and 55 cetanes (Kemp, 2006). A minimum number, of 47, is set
for fuel quality (Mittelbach & Remshmidt, 2006). This measurement describes the combustion
quality of diesel fuel in a compression ignition. A higher cetane number correlates to a short
delay between ignition and combustion, which provides for more time for complete combustion
9
during the combustion process petroleum diesel, can have higher cetane numbers due to
additives in the diesel, such as lubricants and detergents; this is the difference between regular
and premium fuels. Petroleum diesels range between 38 and 45, biodiesels normally range from
46 to 52 making biodiesel engines more effect when comparing cetane numbers.
Cetane numbers are measured by combusting a fuel in a Cooperative Fuel Research
engine, under specific conditions (Kemp, 2006). The second method for measuring cetane
number is by injecting a sample into a constant volume container at a constant temperature. The
pressure will change when the fuel begins combustion, the time difference between injection and
combustion is measured (Kemp, 2006). Both of these methods are difficult to complete in a
standard laboratory because the equipment is expensive; so a cetane index is used more
frequently. The cetane index uses the density and distillation range of the fuel to calculate the
cetane number (Kemp, 2006).
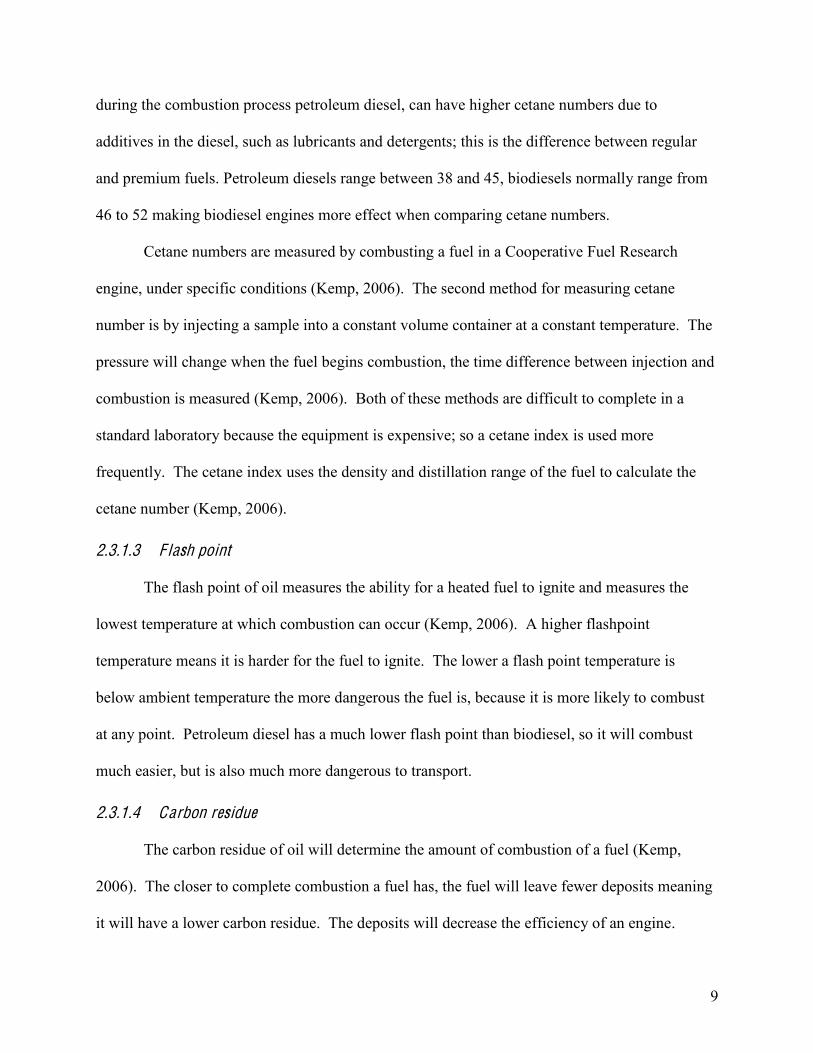
2.3.1.3 F lash point
The flash point of oil measures the ability for a heated fuel to ignite and measures the
lowest temperature at which combustion can occur (Kemp, 2006). A higher flashpoint
temperature means it is harder for the fuel to ignite. The lower a flash point temperature is
below ambient temperature the more dangerous the fuel is, because it is more likely to combust
at any point. Petroleum diesel has a much lower flash point than biodiesel, so it will combust
much easier, but is also much more dangerous to transport.
2.3.1.4 Carbon residue
The carbon residue of oil will determine the amount of combustion of a fuel (Kemp,
2006). The closer to complete combustion a fuel has, the fuel will leave fewer deposits meaning
it will have a lower carbon residue. The deposits will decrease the efficiency of an engine.

10
Biodiesel does have a higher percentage of carbon residue than petroleum diesel,
transesterification does decrease this compared to fresh oils but not as low as petroleum.
2.3.1.5 Lubricity
Petroleum diesel requires additives so that the fuel does not cause engine wear because of
its low lubricity properties. The emissions from the additives contain particulate matter made up
of acids (such as nitrates and sulfates), organic chemicals, metals, soil, and dust particles
(Environmental Protection Agency, 2009) which can cause health and environmental problems.
Biodiesel does not require any additives for lubrication when being used as the main source of
fuel. In addition, biodiesel can be added to petroleum diesel as an additive to increase its
lubricating properties without adding compounds that increase particulate matter.
2.3.1.6 O ther Comparisons
Storage can be a problem for fuels. Biodiesel can absorb water lowering the
efficiency (Kemp, 2006). Water can react to create soaps, which decrease the viscosity of the
oil. Biodiesel does not require additives, is nontoxic to the environment and biodegradable. In
addition, biodiesel has a higher combustion temperature and therefore is less ignitable so it safer
to transport then petroleum diesel fuels (Mittelbach & Remshmidt, 2006).
2.3.2 Environmental Comparison
There are many favorable environmental traits to biodiesel. As stated earlier, the first
trait is the absence of many harmful compounds that are normally found in petroleum diesel
products such as sulfur and aromatics. There is also a reduction of unburned hydrocarbons,
carbon monoxide, and particulate matter that is normal in a petroleum diesel fuel. Carbon
dioxide is a major emission concern because its effect on climate change and green house gases.
A U.S. Department of Energy (National Biodiesel Board) study in 2009 found that biodiesel
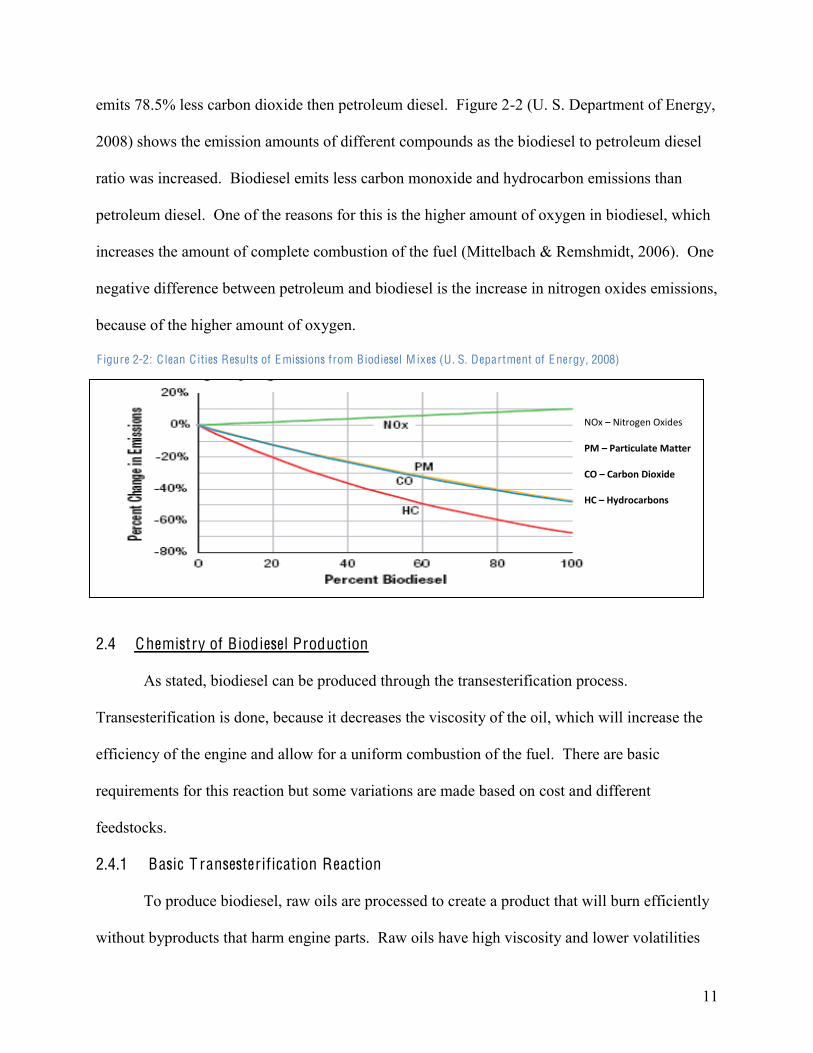
11
emits 78.5% less carbon dioxide then petroleum diesel. Figure 2-2 (U. S. Department of Energy,
2008) shows the emission amounts of different compounds as the biodiesel to petroleum diesel
ratio was increased. Biodiesel emits less carbon monoxide and hydrocarbon emissions than
petroleum diesel. One of the reasons for this is the higher amount of oxygen in biodiesel, which
increases the amount of complete combustion of the fuel (Mittelbach & Remshmidt, 2006). One
negative difference between petroleum and biodiesel is the increase in nitrogen oxides emissions,
because of the higher amount of oxygen.
F igure 2-2: C lean C ities Results of Emissions from Biodiesel M ixes (U . S. Department of Energy, 2008)
2.4 Chemistry of Biodiesel Production
As stated, biodiesel can be produced through the transesterification process.
Transesterification is done, because it decreases the viscosity of the oil, which will increase the
efficiency of the engine and allow for a uniform combustion of the fuel. There are basic
requirements for this reaction but some variations are made based on cost and different
feedstocks.
2.4.1 Basic T ransesterification Reaction
To produce biodiesel, raw oils are processed to create a product that will burn efficiently
without byproducts that harm engine parts. Raw oils have high viscosity and lower volatilities
NOx – Nitrogen Oxides PM – Particulate Matter CO – Carbon Dioxide HC – Hydrocarbons

12
and contain many impurities such as free fatty acids, because of these characteristics; deposits
can form in engines causing mechanical failures. To reduce the high viscosity of triglycerides
and free fatty acids in oil, transesterification is used (Meher, Sagar & Naik, 2004).
In this reaction, alcohol is reacted with the triglycerides that are in fats and oils.
Triglycerides are three chains of fatty acids joined by a glycerin molecule (Mittelbach &
Remshmidt, 2006). The reaction takes place in the presence of a catalyst; the catalyst can either
be a base catalyst or acid catalyst based on the percent of fatty acids in the oil (Meher et al.,
2004). The transesterification process removes the glycerin from the triglycerides with alcohol,
forming fatty acid methyl esters (FAME), the technical name for biodiesel. This reaction is
shown in Figure 2-3 where Rn refers to any fatty acid chain (Meher et al., 2004).
Transesterification of triglycerides is a three-step process where alcohol molecules react with one
fatty acid chain at a time (Meher et al., 2004). The first step is the rate limiting step in which the
triglyceride reacts with the alcohol, a diglyceride and ester is formed. The diglyceride then
reacts with another alcohol molecule to form a monoglyceride and second ester molecule.
Finally, a third molecule of alcohol is reacted with the monoglyceride to form glycerol and a
third ester (Meher et al., 2004). All three reactions are reversible, so in order for the reaction to
proceed forward, there is an excess of alcohol added to the reaction in more than three moles of
alcohol for every mole of triglycerides (Mittelbach & Remshmidt, 2006).
F igure 2-3: T ransesterification of T riglycerides (M eher et al., 2004)

13
There are two types of fatty acids in oil, fatty acids that form triglycerides and free fatty
acids (FFA) are unattached (Meher et al., 2004). Free fatty acids are chains of carbons, they can
be saturated or unsaturated and have many different lengths, and the most common free fatty
acids in biodiesel production, from plant oils, have lengths of 18-22 carbons with 0, 1, 2, or 3
double bonds (Patil & Deng, 2009). A high content of fatty acid in oil is the reason that
transesterification is done. Petroleum based diesel contains hydrocarbons with 6-8 carbons in a
chain. The longer carbon chains in plant oils cause the high viscosity in plant oils (Patil & Deng,
2009). In addition, free fatty acids determines the type of catalyst used and the whether a two-
step process is needed. The free fatty acid compositions for common feedstocks and J. curcas
oil are shown in Table 2-4 (Ma & Hanna, 2009). A high total percentage of free fatty acid
causes an increase in the acid value and can affect certain catalysts (Patil & Deng, 2009).
Table 2-4: F ree Fatty Acid Composition in F eedstocks (M a & Hanna, 2009)
Feedstock Fatty Acid Composition, Percent by W eight Acid Value1 16:0 18:0 20:0 22:0 24:0 18:1 18:2 18:3 18:3
Corn 11.67 1.85 0.24 - - 25.16 60.60 0.48 0.48 0.11 Cottonseed 28.33 0.89 - - - 13.27 57.51 - - 0.07
Peanut 11.38 2.39 1.32 2.52 1.23 48.28 31.95 0.93 0.93 0.20 Rapeseed 3.49 0.85 - - - 64.40 22.30 8.23 8.23 1.14 Soybean 11.75 3.15 - - - 23.26 55.53 6.31 6.31 0.20
Sunflower 6.08 3.26 - - - 16.93 73.73 - - 0.15 Jatropha2 14.50 7.00 0.20 0.30 - 34-45 31-43 0.20 0.,20 28.00
1 mg KOH needed to neutralize free fatty acids in 1 g of oil 2Information about J. curcas from Mittelbach & Reshmidt, 2009
There are three different parts to the transesterification reaction, which determine the
outcome. The first part is the parameters of the reaction, the second part is the amount of alcohol
and catalyst, and the third is the amount and type of free fatty acids in the oil (Ma & Hanna,
1999). The parameters for the reaction include reaction time and temperature. The
transesterification reaction is a reversible reaction, so an excess of alcohol is needed, but the
amount of this will be varied because of the byproducts of soaps that can be produced (Meher et
14
al., 2004). For the base reaction, a 3:1 molar ratio of alcohol to triglycerides is needed, but
because it is a reversible reaction, at least a molar ratio of 6:1 is needed so that the reaction
proceeds to completion. However, if there is too large an excess of the alcohol the increase in
solubility will cause less separation between the biodiesel and glycerol layers, decreasing the
effectiveness of the reaction (Meher et al., 2004). Methanol is chosen for this reaction, because
of its short chain, allowing for a quick transesterification reaction. The excess methanol is
recoverable and will be discussed later. The type of catalyst changes the type of
transesterification and the steps involved in the process. The decision for the catalyst can be
based on the free fatty acid composition.
After the reaction takes place, the glycerin and biodiesel separate into two distinct layers,
the glycerin is denser and will settle to the bottom and the biodiesel can be siphoned off the top
(Mittelbach & Remshmidt, 2006). For the most effective reaction the highest yield of esters is
needed, but also a reaction that will separate the easiest.
2.4.1.1 Considerations
For small production plants it is simpler to use a batch process system. In facilities on a
larger scale (30,000 tons/year and more of biodiesel) a continuous process system is more
economically feasible (Mittelbach & Remshmidt, 2006).
Methanol is not a solvent for plant oils, causing them to separate during the reaction.
There must be some way to homogenize the reaction, such as vigorous stirring. Stirring has been
used successfully for both batch processes and continuous processes (Mittelbach & Remshmidt,
2006). The addition of a solvent for both oil and methanol is possible, but increases production
cost because of added material and extra separation step.

15
2.4.2 Variations of Catalysts
The production processes for biodiesel are well known and each has advantages and
disadvantages. Major variations to the basic method of transesterification include type of
catalyst and pretreatment steps. There are two major types of catalyzed transesterification
(Mittelbach & Remshmidt, 2006).
2.4.2.1 Alkaline catalyzed transesterification
The use of an alkaline catalyst is the most common form of transesterification. The
alkaline catalyst reaction happens relatively fast under mild conditions of temperature and
pressure, compared to the second most common form, acid catalyst. Alkaline catalyst will run
4000 times fast at the same system conditions than the acid catalyst. Alkaline catalyzed reaction
requires less alcohol than acid catalyzed reaction, which means that the reactor size can also be
reduced (Mittelbach & Remshmidt, 2006). Temperature needed for the highest yield of a
reaction will vary based on the type of oil, but temperatures for alkaline catalyzed
transesterification of vegetable oils is normally around 60 oC. The mechanism for alkaline
catalyzed transesterification is shown in Figure 2-4 (Meher et al., 2004).

16
F igure 2-4: M echanism for A lkaline Base T ransesterification (M eher et al., 2004)
The alkaline catalyst can be added either in a pure metal form or in a hydroxide form
(Mittelbach & Remshmidt, 2006). Originally, it was thought that using hydroxides would result
in the formation of soaps by reacting with the ester products; more recent tests have shown that
in water free hydrolysis soap formation is minimal (Mittelbach & Remshmidt, 2006). The
possibility of production of soaps is even less when using potassium hydroxide because of the
increase in phase separation. The catalyst will stay in the glycerol layer when it separates,
because potassium has a higher molecular weight then sodium, it will also cause the glycerol
layer to be denser and settle faster (Mittelbach & Remshmidt, 2006). Finding the optimal
amount of alkaline catalyst is important, because if too much catalyst is added it will cause the
ester products will be miscible with the glycerol phase (Meher et al., 2004). This will cause a
loss of product and neutralize catalyst.

17
The main disadvantage to using alkaline catalysts is the effect on the miscibility of the
layers when excess is used. This will cause a loss of product and inefficiency to the reaction as
well as unnecessarily waste catalyst. Additionally, high amounts of free fatty acids will cause
low yields of esters when using a one-step alkaline catalyzed process. Approximately 3% by
weight or lower of free fatty acids are needed for alkaline catalyzed processes (Meher et al.,
2004). If the oil contains higher than three percent of free fatty acids using either an acid
catalyzed reaction or a pre-treating step must be done (Meher et al., 2004).
2.4.2.2 Acid catalyzed transesterification
Acid catalyst can be used to promote transesterification. Due to acid catalysts being able
to esterify free fatty acids in oils, one characteristic that alkaline catalysts cannot, the use of acid
catalysts are favorable for oils that have a very high percent of free fatty acids (Patil & Deng,
2009). A high percent of free fatty acids are more common in lower cost feedstocks, such as
inedible oils (Patil & Deng, 2009).
The major disadvantage to using an acid catalyst is the parameters required for the
reaction. Acid catalyzed reactions are more expensive than alkaline catalyzed reactions, because
these reactions occur much slower than alkaline catalyzed reactions; require higher temperatures
and pressures, and more alcohol. Temperatures of at least 100◦C are needed (Meher et al.,
2004). The high temperatures and pressures can also cause an increase in unwanted secondary
reactions to form. The mechanism for transesterification through acid catalyzed reaction is
shown in Figure 2-5 (Meher et al., 2004).

18
F igure 2-5: M echanism of T ransesterification with Acid Catalyst (M eher et al., 2004)
2.4.3 Two Step Reaction Process
This process incorporates two transesterification reactions, one with an acid and one with
an alkaline catalyst. In this process, an acid catalyzed pretreatment step is followed by the
alkaline catalyzed reaction already described in the one-step reaction process. This process is
most often used for plant oils with high free fatty acid content (Patil & Deng, 2006). The acid
catalyst is added to convert free fatty acids to fatty acid methyl esters. Tests have shown that oils
with free fatty acid contents of 20-40% after an acid pretreatment will be reduced below 1% of
free fatty acids (Meher et al., 2004). An acid catalyzed reaction for the conversion of solely the
free fatty acids occurs at a much faster speed and at a pressure and temperature, which is more
reasonable than converting both free fatty acids and triglycerides by an acid catalyzed reaction.
The conversion of free fatty acids can react at temperatures around 60 oC and atmospheric
pressure (Mittelbach & Remshmidt, 2006). The product from this reaction can then be used in
the alkaline catalyzed reaction for the highest yield of fatty acid methyl esters (Mittelbach &
Remshmidt, 2006).
OH

19
2.4.4 Post Reaction Processing
After the transesterification reaction is complete, there is still a need to purify the fatty
methyl esters. In the reactor container, there is excess alcohol, free fatty acids, catalyst, and the
byproduct glycerol.
2.4.4.1 Removal of Glycerol
Glycerol can be removed from the ester phase by washing or through a secondary
reaction. Washing can be done by either using water or mild acid. It is argued that by
introducing water some of the esters can be lost due to hydrolysis (Mittelbach & Remshmidt,
2006). Due to the possibility of ester lost the excess glycerol in the biodiesel layer can be
removed through a reaction with alkaline catalyst instead of water washing. Catalyst is added
after the methanol is removed so that the glycerol can be converted to triglycerides. Once the
triglycerides have been removed, they can be added to new raw oil and reenter the process.
After reentering, they can be converted to usable methyl esters (Mittelbach & Remshmidt, 2006).
2.4.4.2 Removal of Methanol
For purification of the ester phase, excess methanol must be removed. Heating of the
ester phase will remove the excess methanol. The step to recover methanol should be done prior
to any washing procedure, in order to avoid additional processing of methanol to be distilled
from water (Mittelbach & Remshmidt, 2006).
2.4.4.3 Removal of F ree fatty acids
Free fatty acids can be left in the oil. However, they will cause problems with the fuel’s
efficiency. Free fatty acids can be removed after transesterification by the addition of acid. As
described in acid catalyzed transesterification, a small amount of acid can be added to react with
20
excess fatty acids (Mittelbach & Remshmidt, 2006). The acid must then be washed out of the
solution.
2.4.4.4 Removal of Catalyst
Catalyst can be removed from the biodiesel by-product by washing with water. The
catalyst is more soluble in water than oil so when washed, the catalyst will be removed from the
oil and dissolve in the water, which is not soluble with oil (Meher et al., 2004). The mix can
then settle and the two layers separated.
2.5 Characteristics of Jatropha curcas
Jatropha curcas (J. curcas) is a small bush, from the Euphorbiaceae family, is grown in
warm tropical climates (Openshaw, 2000). Seeds of the J. curcas plant are pressed to release
plant oil that can be converted to biodiesel. J. curcas is being considered as a feasible feedstock
for large-scale biodiesel production in Haiti for many reasons, including: moderate growing
conditions, the low cost of production, effects on society, economy, and environment where it is
used, and its ester yield. Among the nonedible oil bearing plants, J. curcas has been said to
have a great potential as the next generation of commercial biofuel crops (Centre for Jatropha
Promotion). J. curcas grows readily in tropical areas in Figure 26 (Centre for Jatropha
Promotion) these are highlighted in pink. Additionally, J. curcas oil was estimated to have the
lowest relative cost amongst the various types of biodiesel feedstocks per barrel of fuel (Barta,
2007).

21
2.5.1 History of J. curcas Use
J. curcas has been used for fuel starting in the 1930’s in Mali. In 1939, the French
government that was ruling Mali ordered plant oils to be shipped to France for use as fuel
(Jatropha World). However, after World War II, the use of plant oils was used in the production
of soap (Mittelbach & Remshmidt, 2006). The use of J. curcas as a fuel source was researched
for a second time in the 1980’s at Cape Verde Islands as part of the Integrated Rural
Development Project (Openshaw, 2000). Petroleum based diesel fuel was still less expensive
than biodiesel, so the project was shut down for economic reasons. Since the 1980’s Jatropha
has been researched and used on a large scale in Nicaragua, and has been spreading in popularity
in India and parts of Africa (Openshaw, 2000). The use of J. curcas has been most popular in
developing countries, because it is inexpensive to grow and produce, and is able to give a stable
fuel source for countries not able to afford the growing price of importing petroleum diesel.
There is a major center for the research and development of J. curcas oil in Rajasthan,
India called the Centre for Jatropha Promotion and Biodiesel (Centre for Jatropha Promotion).
F igure 2-6: M ap of World Colored by C limate (Centre for Jatropha Promotion)
22
2.5.2 G rowing Conditions for J. curcas
J. curcas is a very viable candidate for biodiesel productions in subtropical areas such as
Haiti because of its ability to grow in a wide range of conditions. J. curcas will continue to grow
in areas with high and low rainfall; it is extremely drought resistant, and thus will be very
reliable as a source for fuel. J. curcas can be grown in poor soil environments as well. It is used
now to line railroad tracks in India to stop soil erosion (Openshaw, 2000).
2.5.3 Yield of O il f rom J. curcas
The J. curcas seeds can have an oil yield of 37 % from the seeds (Centre For Jatropha
Promotion). For a hectare of cropland, the J. curcas plant can produce 3,000 kg at $43 U.S. per
barrel (Barta, 2007). After the second year of growth, the J. curcas plant has viable seeds for the
production of oil. The plant will continue to give seeds for 40-50 years from a single plant
(Centre for Jatropha Promotion).
2.5.4 Programs in Haiti Involving J. curcas
The United Nations included biodiesel plans in its recent development package. By
receiving knowledge and help from Brazil, the United Nations believes that Haiti could have a
self-sufficient fuel economy. J. curcas is the main feedstock for this biodiesel plan because of its
ability to grow in soils that have been depleted (Rothkopt, 2008). Haiti had a very large
agricultural industry based on sugarcane farming, but the sugarcane crop depletes the soil as it
grows. Now sugarcane can only be grown in small sections of the country. J. curcas will grow
in these depleted soils, left by the sugarcane crop, providing a profitable crop and decrease the
amount of soil erosion (Rothkopt, 2008).

23
3 Methodology
3.1 Materials
Soy oil was obtained from Shaw’s Market. Coconut oil was obtained from Living Earth,
Worcester, MA. J. curcas oil was obtained from Dawn Exports, India (See Appendix A for
contact information). Potassium hydroxide flakes (85% pure), methanol (AR Grade), sulfuric
acid (98% pure), and phenolphthalein were procured from the stockroom in Goddard Hall.
Several 250mL and 50mL Erlenmeyer flasks were used as laboratory scale reactors for the
experimental studies in this work. Graduated cylinders were also used for measuring liquids.
All glassware in the lab was washed with Alconox and rinsed with acetone prior to use to avoid
contamination. A hot plate with magnetic stirrer arrangement was used for all heating and
mixing needs. For duration of experiments, the mixture was stirred at the same speed of 700 rpm
for all test runs.
3.2 Development of Procedures of Reactions with Edible O ils
When developing the methodology, preliminary experiments were run with soy and
coconut oil to produce biodiesel. This helped to create a laboratory procedure and avoid
mistakes when using J. curcas oil.
Initially, 50 mL each of fresh vegetable oil, 10 mL of methanol, and 0.29 g of 85% pure
potassium hydroxide (KOH) was used. The procedure for this reaction was found using methods
by Patil & Deng (2009). The characteristics of both oils were not considered because the
purpose of this experiment was to create a basic laboratory set up for the experiments using J.
curcas oil.
The procedures for the reaction with edible oils are in Appendix A-1.

24
3.3 Development of Procedures for J. curcas Biodiesel Production
To find the optimal parameters for producing biodiesel from J. curcas oil in a lab setting,
a base method was created. Through research, it was decided that an alkaline catalyzed
transesterification reaction was the most commonly used method for producing biodiesel, as well
as the most economically beneficial method. Information from Mittelbach (2006) was used for
general requirements for producing biodiesel from transesterification. Papers by Kumar, et al.
(2007) and Pital & Deng (2009) were used for finding the base parameters for testing J. curcas
oil; both papers discussed methods for optimizing the transesterification process with an alkaline
catalyst. The production of J. curcas oil for biodiesel is in three parts: the pretreatment of the
oil, the production of biodiesel, and the purification of the biodiesel. Then, there is the analysis
of the biodiesel.
3.3.1 Development of Pretreatment
The first step to producing J. curcas oil is the pretreatment of oil. Water content and
acidity must be tested because both could affect the production of biodiesel. These procedures
can be found in Appendix A-2.
3.3.1.1 Water Content Testing
Water can react with free fatty acids to form soap if left in oil so before any
experimentation is done, the oil must be pretreated to remove water.
To test for water in the J. curcas oil, 100 g sample of oil was heated in a double boil flask
connected to a reflux condenser for uniform heating at a temperature over 100oC. A recovery
flask was connected to the condenser and used to recover water. The weight of the oil was

25
recorded before and after processing in order to determine approximate percentage of water
contained in fresh J. curcas oil.
All J. curcas oil used for experimentation was heated for 1 hr at 100oC to evaporate any
water left in the oil.
3.3.1.2 Density Determination
5 mL of oil was added to a clean-tared 10 mL graduated cylinder and weighed.
3.3.1.3 Acid Value Testing
Kumar, et al., (2003) states that J. curcas oil has a free fatty acid percentage of 14%,
which corresponds to an acid value of 28 mg of KOH /1 g of oil. As explained in section 2.4.3,
oil with high free fatty acid content needs to be processed before an alkaline catalyzed
transesterification can be done. Titration is the most direct way to find the acid value of the J.
curcas oil acquired from Dawn Exports.
KOH was used for titration because acid values are measured in amount of KOH and
KOH was already acquired for the alkaline catalyst. Patil & Deng (2009) state that J. curcas oil
with an acid value of 2 ± 0.25 mg of KOH/1 g of oil is acceptable to be used directly in the
alkaline step with no pretreatment. To titrate the oil, a base solution was made by dissolving
KOH in distilled water. Methanol must be added so that the oil and base solution will mix but it
has a slight acidity and must be neutralized first. Fresh J. curcas oil was added to the neutralized
methanol solution. Then, base solution was added drop-wise to the oil until the phenolphthalein
turned magenta a second time.
3.3.2 Development of T ransesterification Reaction
The transesterification reaction was in 25 mL samples of J. curcas oil that had been
pretreated to remove water. This sample size would produce enough biodiesel for testing while

26
being small enough for simple measurements to be taken. Methanol and KOH were prepared by
measuring the amounts of methanol and catalyst for a reaction. They were then mixed until they
were a homogenous solution. These procedures can be found in Appendix A-3.
3.3.2.1 Step one: Acid Catalyzed Transesterification
Procedures for acid transesterification were used from an article by Patil and Deng
(2009). In this procedure 50 mL of heated oil, 16 mL of methanol, and 0.25 mL of sulfuric acid
was used. After the reaction of sulfuric acid and free fatty acids, the excess acid must be washed
out before the full transesterification of triglycerides. The procedure for the determination of the
oil acidity was repeated in order to find the new acid content after treatment with sulfuric acid.
3.3.2.2 Step Two: Alkaline Transesterification
Transesterification by an alkaline catalyst is a common procedure for the production of
biodiesel. For alkaline catalyzed transesterification, research shows that methanol and KOH are
the best additives to use based on cost and availability. Using known methods for producing
biodiesel from edible and non-edible oils a base procedure of mixing, amounts of additives and
reaction time was decided. With the laboratory equipment available and known procedures, four
reaction vessels of 50 mL Erlenmeyer flasks were used. The purpose of this project was to
determine the optimal parameters for this experiment.
3.3.2.3 Development of Process Parameters
The variation of process parameters was set for the second transesterification step. The
experiments had varying the parameters of the reaction to find the optimal production of
biodiesel. Previous research on transesterification and J. curcas oil was used to outline three
steps: making catalyst mixture, reaction of oil, and separation of products. 25 mL fresh oil was
used for each sample. The parameters to be varied were reaction time, methanol to oil ratio, and
27
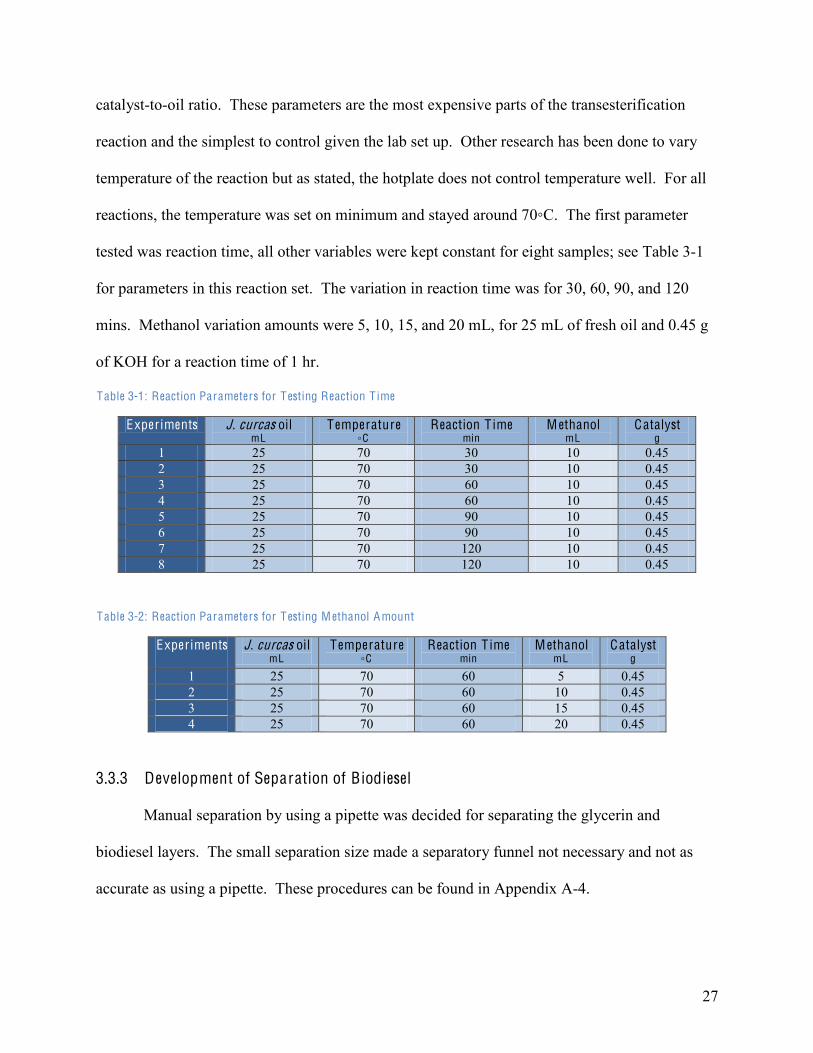
catalyst-to-oil ratio. These parameters are the most expensive parts of the transesterification
reaction and the simplest to control given the lab set up. Other research has been done to vary
temperature of the reaction but as stated, the hotplate does not control temperature well. For all
reactions, the temperature was set on minimum and stayed around 70◦C. The first parameter
tested was reaction time, all other variables were kept constant for eight samples; see Table 3-1
for parameters in this reaction set. The variation in reaction time was for 30, 60, 90, and 120
mins. Methanol variation amounts were 5, 10, 15, and 20 mL, for 25 mL of fresh oil and 0.45 g
of KOH for a reaction time of 1 hr.
Table 3-1: Reaction Parameters for T esting Reaction T ime
Exper iments J. curcas oil mL
Temperature ◦C
Reaction T ime min
M ethanol mL
Catalyst g
1 25 70 30 10 0.45 2 25 70 30 10 0.45 3 25 70 60 10 0.45 4 25 70 60 10 0.45 5 25 70 90 10 0.45 6 25 70 90 10 0.45 7 25 70 120 10 0.45 8 25 70 120 10 0.45
Table 3-2: Reaction Parameters for T esting M ethanol Amount
Exper iments J. curcas oil mL
Temperature ◦C
Reaction T ime min
M ethanol mL
Catalyst g
1 25 70 60 5 0.45 2 25 70 60 10 0.45 3 25 70 60 15 0.45 4 25 70 60 20 0.45
3.3.3 Development of Separation of Biodiesel
Manual separation by using a pipette was decided for separating the glycerin and
biodiesel layers. The small separation size made a separatory funnel not necessary and not as
accurate as using a pipette. These procedures can be found in Appendix A-4.

28
3.3.4 Development for Purification of Biodiesel
The biodiesel layer has traces of excess methanol and catalyst. There are a few different
methods for purification of biodiesel, including washing, heating, and the addition of catalyst.
Methanol can be removed by evaporation and catalyst can be removed by washing, so the two
processes were further developed. These procedures can be found in Appendix A-5.
3.3.4.1 Methanol Distillation
The biodiesel product was first distilled to remove the un-reacted methanol by heating.
The biodiesel sample was moved from an Erlenmeyer flask to a round bottom flask that was
connected to a simple distillation set up with a Liebig condenser show in Figure 3-1 (Chromic,
2002). The round bottom flask was immersed in a beaker of water that stood on a hot plate.
Methanol will evaporate at 65oC and water will evaporate at 100oC, so the dram vial was held in
a hot water bath of over 100oC for 20 minutes to evaporate excess methanol and potential water
in the mixture.
F igure 3-1: Distillation Set up (Chromic, 2002)

29
3.3.4.2 Washing Procedure
Water is a solvent that will dissolve catalyst and methanol and separate from the oil after
being mixed, so it was used as a washing element. The biodiesel layer was washed three times.
This procedure is a common one used by mixing and then separating the water.
3.3.4.3 Drying
The final step was to ensure that the biodiesel was dry. All that is needed for this is
heating to remove water left from the washing.
3.3.5 Development of Analysis of Biodiesel
To test for the optimal parameters for producing biodiesel a way of analyzing the samples
was created. The weight percent of biodiesel compared to the whole sample after
transesterification was compared. After transesterification, there are two products: the biodiesel
and glycerin. The sample with the highest percent of biodiesel layer would then be the most
efficient.

30
4 Results and Analysis of Soy and Coconut O il
4.1 Results of Experimentation
When developing the methodology, preliminary experiments were run with soy and
coconut oil. These, preliminary experiments, were used to collect information on problems that
may arise during experimentation before using the more expensive J. curcas oil.
The first set of batches produced a number of different results. In some of the
experiments two distinct layers formed, the top layer (translucent yellow) and the bottom layer
(translucent brown). From the literature, it was understood that the top layer was a mixture of
the fatty acid methyl esters and bottom layer was glycerin. The biodiesel layer varied in its
lucidity, appearing to be very cloudy in some of the batches and clear in others. Some of the
batches resulted in failure because there was no separation at all; in later experiments, additional
methanol was added to the reaction, because it was believed that sufficient methanol required for
esterification might have been lost via evaporation to poorly sealed environment. To check the
superficial quality of the biodiesel, a visual analysis was done on the product after the initial
transesterification reaction to see if two distinct layers have formed.
F igure 4-1: Lab sample after transesterification reaction, top layer is biodiesel and bottom layer is glycerol

31
The success of the transesterification reaction was determined by the conversion of the
initial reactants to the two different layers that formed as well as the lucidity of the biodiesel. As
we can see from Figure 4-2 over time the layers separate, a significant amount initially separates
at 30 minutes of reaction time to approximately 50% and again at 60 minutes to approximately
70%. There are no significant changes at 90 or 120 minutes of reaction.
F igure 4-2: Percent of Separated Parts by Weight
4.2 Possible sources of er ror for soy and coconut oil
Throughout the laboratory experimentation, several challenges arose that could have
decreased the ability of triglycerides to convert to fatty acid methyl esters. Methanol and the
catalyst (potassium hydroxide) play critical roles in transesterification; there were challenges
with both reactants. Methanol readily evaporates if left open to the atmosphere. Moreover, the
strength of the stock potassium hydroxide could not be verified.
4.2.1 Loss of methanol
As the reaction was heated to temperature, the pressure in the reactor vessel built up until
the stopcock was pushed out of the flask. Stopcocks were replaced immediately and refastened
0%
20%
40%
60%
80%
100%
30 60 90 120
Percent of Biodiesel and
Glycerol Layers
Reaction Time (min)
Biodiesel
Glycerol

32
with duct tape. However, there was a definitely loss of methanol. Sufficient methanol is
paramount for the maximum conversion to fatty acid methyl esters.
Additionally, there may have been loss of methanol to the atmosphere when pouring and
mixing methanol with catalyst and oil. Minimal time was spent with reactants sitting stagnant in
open containers to avoid this loss.
4.2.2 Integrity of catalyst
The potassium hydroxide catalyst was obtained from the chemistry stockroom in
Goddard Hall. The container of catalyst was previously used by others as well as sitting on the
self for an unknown amount of time. The purity of catalyst was originally 85% potassium
hydroxide; yet, its strength at the time of use could not be verified. Over time, there was the
possibility of the potassium hydroxide absorbing water from the atmosphere affecting its strength.
Water interferes with transesterification and unwanted emulsions can occur. There was no
process done to remove any water from the potassium hydroxide, because the catalyst would
melt when heated to 100oC.
4.3 L imitations Found During Experiments
The experiments required a set temperature of 60oC. The minimum setting on the hotplate
ran at a temperature of approximately 65◦C. For all experimentation, the hotplate was set on the
minimum setting but varied between 65oC and 70oC. In the literature, it was stated that poor
regulation of temperatures might result in the creation of additional free fatty acids.

33
5 Results for J. curcas Biodiesel Production
Experimentation continued with J. curcas oil using the information obtained from the
preliminary results of coconut and soy oil experiments. The laboratory setup and procedure was
created from prior experimentation and was implemented throughout each trial. The paramount
focus was finding the physiochemical properties of J. curcas oil and the optimal parameters to
produce the highest yield and purity of biodiesel.
5.1 Determining physiochemical properties of J. curcas
5.1.1 Water Content
Prior to any treatment, fresh J. curcas oil was placed in a simple distillation setup, no
vapor condensed in the recovery flask so there was not a significant amount of water in the oil.
For safe measure, it was determined that the oil heated over 100oC for 1 hour was sufficient time
to remove any water.
5.1.2 Density
The density of our specific sample was determined to be 902.3 g/L prior to any
processing. This value was comparable to the value found in the literature of 932.92 g/L
(Pramanik, 2003). For detailed calculations and raw data, refer to Appendix C-1.
5.1.3 Acid Content
From literature, the free fatty acid content present in J. curcas oil is approximately 14%
or 28 mg KOH/g (Mittelbach & Reshmidt, 2009). The free fatty acid content was the largest
determinant for type of experimentation. Due to the fact that oils that have more than 1% free
fatty acid content or an acid value of 3 mg KOH /1 g of oil, will have a significantly lower
conversion to fatty acid methyl esters using only alkaline catalyzed transesterification (Tiwari et
al., 2007). It was determined that the acid content was 2.7 mg KOH/ 1 g of J. curcas oil.

34
Therefore, acid pretreatment was deemed unnecessary by the acid value. See Appendix C-2 for
calculations and data.
5.2 Pretreatment of J. curcas O il
Pretreatment of J. curcas oil was done by acid catalyzed transesterification. As stated this
is normally done for oils with an acid value above 3mg KOH/ 1g oil, even though the acid value
test showed a value of 2.7mg KOH/ 1g oil a pretreatment batch of samples was done to see if it
would still increase production of biodiesel. It was deemed unnecessary to proceed with an acid
catalyzed transesterification step after comparing the non-pretreated J. curcas oil to the acid
pretreated J. curcas oil results after both went through the alkaline catalyzed transesterification
reaction. The non-pretreated oil was able to reach a higher biodiesel yield under a shorter period
than the pretreated oil as shown in Figure 5-1, (data is in Appendix C-3). In Figure 5-2, the four
flasks to the left were not treated with an acid step and the four flasks to the right were treated
with an acid step. The figure shows that the four not treated with the acid catalyzed
transesterification are clearer and have less soap formation than the pretreated samples.
F igure 5-1: Results of Biodiesel Y ield for Pretreated and Non-Pretreated Oil
0.5
0.55
0.6
0.65
0.7
0.75
0.8
30 60 90 120
Yeild of Biodiesel (wt %)
Reaction Time (mins)
Non Pretreat
Pretreat

35
F igure 5-2: Batches of both the pret reated oil and non-pretreated oil under the same conditions
5.3 Variation of Reaction time
The one-step alkaline catalyzed transesterification reaction was followed, running four
simultaneous experiments to determine the amount of conversion to ester product. The reactions
were removed from the reaction conditions at time intervals of 30, 60, 90, 120 minutes and left to
rest at room temperature. Figure 5-3 shows the first four samples in order of lowest to highest
reaction time from left to right. In analyzing the samples, it was found that there was not an
increase in conversion from the 60 minutes to 120 minutes time interval. Since, heating and
agitating are costly processes the lowest reaction time without affecting the yield of biodiesel
was chosen. Figure 5-3 (next page) shows the biodiesel yield for samples that used different
reaction time. Based on this information (all results can be seen in Appendix C-3) the best
reaction time was 60 mins because it gave the largest biodiesel yield for the shortest period of
time.

36
5.4 Variation of Methanol Amount
Methanol amounts were varied between 5 mL and 20 mL at 5 mL increments. Before
removing methanol through processing, 15 mL of methanol added to samples averaged to the
highest percent yield of 83.7% (full results in Appendix C-3 and C-4). After processing, the
same samples had the highest yield of biodiesel product with an average of 55.9%. These data
can be seen graphically in Figure 5-4.
F igure 5-4: Results of M ethanol Variation
0
0.2
0.4
0.6
0.8
1
5 10 15 20
Percent Yield of Biodiesel
mL of Methanol Added
Before Processing
After Processing
F igure 5-3: Samples after transesterification and resting time

37
5.5 Possible er rors when processing J. curcas
The stopcock that had been used to seal the reaction vessels was replaced with parafilm
for these experiments. There were a greater percentage of the successful batches when using
parafilm to seal rather than stopcocks. Parafilm was not pushed off the reaction vessel when
pressure built, but sometimes ripped. Multiply layers of parafilm were applied to eliminate
ripping.
5.6 Separation and Purification of Biodiesel Product
5.6.1 Quality
To check the quality of the biodiesel, a superficial analysis was done. Once samples were
quenched and given allotted time to settle, a simple test to determine if the reaction was complete
was performed by looking for a film or cloudy residue. In successful batches, two distinct layers
would form. In failed batches, no layers were formed and were not used for analysis. The
successful batches, the layers were then separated, the byproduct glycerol was set aside and the
unwashed biodiesel layer was further processed. Observations were made on the physical
appearance of the biodiesel layer and recorded, comments included details about the products
color, lucidity, viscosity, miscibility, and whether there were any precipitants. For full
observations, see Appendix D.
5.6.2 Removal of Methanol by distillation
Excess methanol that remained in the biodiesel layer was removed by a simple
distillation setup. On average 4.7% of the methanol in the biodiesel sample was recovered
during distillation. Generally, samples that lost the least amount of methanol were more
successful at forming two distinct layers. This is believed to be because the methanol, instead of
leaving the vessel, reacted with the triglycerides converting a higher percentage to biodiesel.
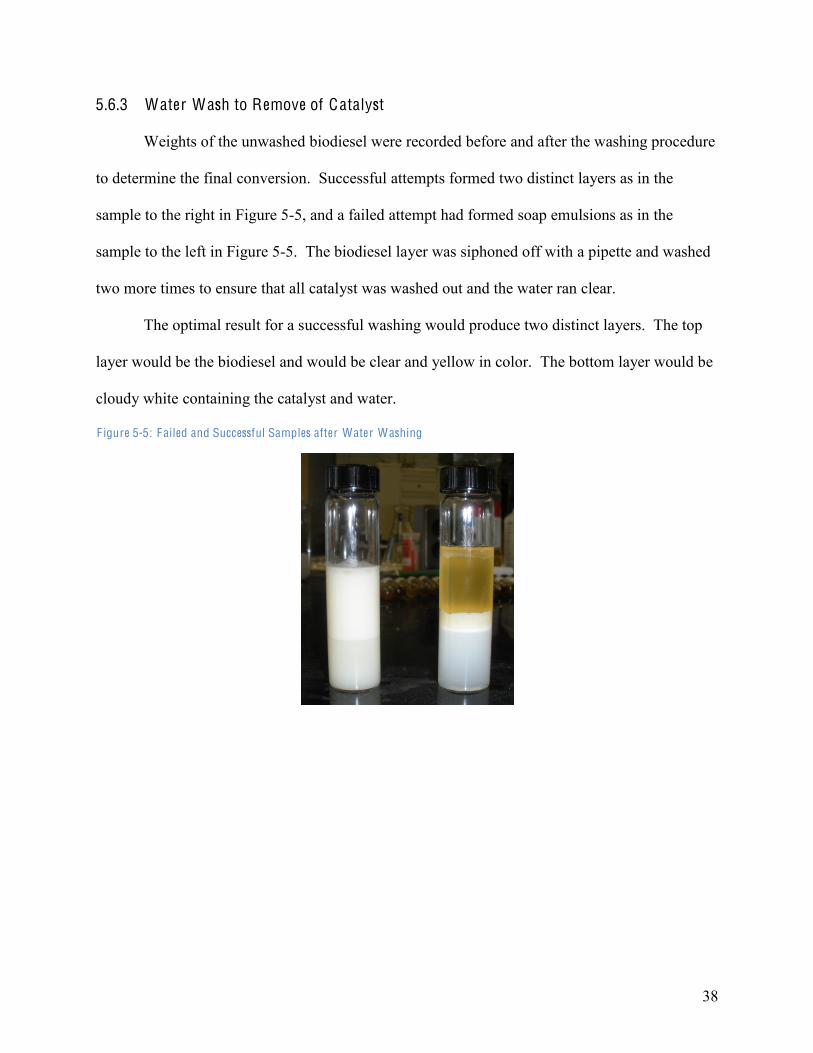
38
5.6.3 Water Wash to Remove of Catalyst
Weights of the unwashed biodiesel were recorded before and after the washing procedure
to determine the final conversion. Successful attempts formed two distinct layers as in the
sample to the right in Figure 5-5, and a failed attempt had formed soap emulsions as in the
sample to the left in Figure 5-5. The biodiesel layer was siphoned off with a pipette and washed
two more times to ensure that all catalyst was washed out and the water ran clear.
The optimal result for a successful washing would produce two distinct layers. The top
layer would be the biodiesel and would be clear and yellow in color. The bottom layer would be
cloudy white containing the catalyst and water.
F igure 5-5: Failed and Successful Samples after Water Washing

39
6 Conclusions
During this project, we aimed to provide recommendations to the scientific community
on the parameters required for efficient production of J. curcas biodiesel. The task was to
uncover specific methods and scientific procedures to produce biodiesel from J. curcas oil as
well as the feasibility of implementation for large-scale production. Experiments were
conducted in a laboratory to determine ideal parameters to be considered in the processing of
biodiesel derived from J. curcas oil. The highest conversion of 77.6% was obtained when
operating for 1 hour at 6570 °C with a ratio of 0.4 mL of methanol/mL of oil before distillation
and washing. The results from these experimental investigations were used to formulate the
viability of producing biodiesel in Haiti.
Due to rises prices in petroleum, it is advised that smaller countries like Haiti start to
decrease their dependence on petroleum oil by converting to biodiesel. By increasing efforts to
find new sustainable methods of development, such as considering the production of biodiesel
from J. curcas oil, the government of Haiti can diminish its dependency on petroleum products.
The change to biodiesel will also increase the self-sufficiency of the economy of Haiti by
subtracting foreign dependency transportation fuel.
40
7 Recommendations
In addition to the information provided in this report, there are many other areas that affect
the production of biodiesel by J. curcas.
7.1 Recommendations for Laboratory A rrangement
After this project was completed, there are a few recommendations on laboratory
arrangements for future experiments on biodiesel optimization. The first suggestion would be to
increase the scale of the reaction. This would allow for more processing to be done to the
sample without fear of a significant loss of product. During processing and transportation of
samples much of the biodiesel was lost, the average rate of yield was 45%. A second suggestion
would be to obtain bettercontrolled heating equipment to produce repeatable, accurate results.
In addition, with a controlled device, the temperature could be purposefully varied in order to
determine the optimal reaction temperature.
7.2 Recommendations for Components
An increased amount of information on the J. curcas oil was desired for this project. In
future studies it is recommended to obtain an information sheet from the company tabulating
how the company had processed the oil and the current state.
In addition, the catalyst used in this project was possibly compromised due to contact
with water vapor in the air. As a result, it is recommended to purchase fresh catalyst when
completing a transesterification reaction.
7.3 Further Studies on Parameters
This project analyzed the affect of reaction time and methanol amount on
transesterification of J. curcas oil. Many other parameters can be varied, including the
temperature of the reaction, the amount of catalyst, and the type of catalyst. Analysis of

41
increasing the temperature of the reaction should consider the cost of increasing the temperature
compared the increase in biodiesel production per unit of oil. The catalyst in transesterification
is one of the most expensive parameters. Finding a cheaper catalyst or the smallest amount of
catalyst required for transesterification would increase the appeal of biodiesel production form J.
curcas oil. Testing these parameters along with the parameters varied in this project should also
be done, in case they have an effect on results. Incorporating more experimentation would give a
broader range of J. curcas potential as a feedstock for biodiesel production.
7.4 Further Studies on Quality Analysis
The analysis performed during this project was valid. However, the analysis was
superficial and could have been more detailed. A better understanding of the all properties of J.
curcas oil could possibly lead to betterinformed decisions about how to perform the
transesterification reaction more ideally. With more indepth analysis, all points of the biodiesel
standards could be tested. It is recommended that a viscometer be purchased or borrowed for
determining the viscosity of the fresh and processed oil. Another recommended analysis would
be to test the final ester content in the biodiesel and the free and total glycerin to see if the
product meets the final standards specifications. This analysis can be performed by using a gas
chromatograph. A procedure for testing ester content by gas chromatograph can be found in
Appendix B.
7.5 Further Studies on Recover of Components
Finally, recovery and recycling of the unused byproducts, methanol, and catalyst are
essential to decrease environmental impact due to manufacturing, production, and processing. A
decrease in the total cost of production could also be found by recovering the methanol and

42
catalyst. During this project, fresh methanol and catalyst was used for each sample and the
glycerin byproduct was not purified for reuse.
7.6 E conomic Analysis
This project focuses on decreasing costs by using the least amount of components
necessary for the highest yield of biodiesel. However, many other costs can be analyzed. To
consider fully an economic plan more research should be done into biodiesel during all stages of
production. A brief plant design including equipment, land, and utilities is costed in Appendix
E. Costs for creating a biodiesel product include the price of the crop, building a biodiesel
production plant, processing the biodiesel, and transporting all the components. Areas that could
be analyzed for efficiency are reaction vessel sizing, recycling of water, methanol and catalyst,
and steam and cooling processes.

a
8 Appendix A : Procedures for Experiments
Contact information for Dawn Exports
Admin Office: 6/27 6th Street, V.N.R Nagar, Vadavalli , Coimbatore - 641 041. TamilNadu (India) [email protected] A-1 Procedure of T ransesterification Reaction with Edible O ils
1. 50 mL of fresh oil was measured in a 250 mL Erlenmeyer flask
2. 0.29 g of catalyst was dissolved in 10 mL of methanol, it was stirred for 10 mins
3. Methanol mixture was added to the oil
4. Stopper was inserted into flask and covered with tape
5. Oil was placed on a hotplate with a magnetic stirrer
6. The reaction time was set for 1 hr; see Figure 7-1 for photo.
7. Upon reaction completion, the flasks were removed to cool to room temperature.
8. The product was transferred to a separator funnel to allow the layers to settle for 24 hrs
9. The glycerin letter was removed F igure 8-1: E rlenmeyer flasks containing coconut oil (back two flasks) and soy oil (front two flasks) are being reacted with methanol and catalyst

b
A-2 Pretreatment of J. curcas Oil
Water removal
1. 100 mL of fresh oil was added to a 250 mL Erlenmeyer flask, the weight was recorded 2. The oil was heated to 100oC 3. Every 15 mins the oil and flask was weighed, and the weight recorded 4. This was done for 2 hrs 5. The final weight of the oil was subtracted from the starting weight
Density test
1. A 5 mL of graduated cylinder was weighed and tarred
2. 5 mL of oil was added to the cylinder and re-weighed
Acid Value test
1. Base solution was made by dissolving 1.0072 g of KOH in 1 L of distilled water
2. 4 mL of methanol was mixed with phenlythalene dye in a 50 mL Erlenmeyer flask
3. Base solution was added until the phenylthalene turned a magenta color
4. 2 mL of fresh J. curcas oil was added to the methanol and base solution
5. Base solution was added drop-wise to the oil until the phenylthalene turned magenta, shown in Figure 7-2
6. The amount of base solution required to neutralize the oil mixture was recorded F igure 8-2: Neutralized Oil
A-2 T ransesterification Reaction of J. curcas Oil
Acid catalyzed T ransesterification
1. 50 mL of heated oil was poured into the flask and heated to about 45oC.

c
2. 16 mL of methanol and 0.025 mL of sulfuric acid was added and stirred at low stirring speed for 10 min
3. 25 mL of water was added
4. The mixture was poured into a separator funnel
5. The biodiesel was separated from other impurities
3. The acid value test was repeated with a sample of the biodiesel product to find a new acid value
Alkaline Catalyzed T ransesterification
This procedure is for the basic method of alkaline catalyzed transesterification. The amount of methanol and the reaction time was changed for varied, see Table 8-1 for amounts. Table 8-1: T ransesterification Variables
Experiments M ethanol Amount mL
Catalyst Amount g
Reaction T ime h
1 10 0.46 30 2 10 0.46 60 3 10 0.46 90 4 10 0.46 120 5 5 0.46 60 6 10 0.46 60 7 15 0.46 60 8 20 0.46 60
1. 25 mL of oil was measured into an Erlenmeyer flask
2. 0.45 g of KOH was dissolved in 10 mL of methanol using a magnetic stir bar 3. The beaker with methanol was covered with parafilm
4. 5 mL of the methanol mixture was put into the oil and stirred for 10 min
5. The remaining methanol mixture was added to the oil
6. The mixture was heated to 70oC and stirred for 2 hrs, while covered with parafilm
7. Mixture was removed from heat, magnetic stir bar was removed from flask
8. Flask sat for at least 3 hrs to settle
A-3 Separation and Purification of Biodiesel Product
Separation of Biodiesel form Glycerin
1. Parafilm was removed from the flask
2. Pipette was used to remove glycerin and place in X dram vials
3. Glycerin layer was weighed

d
4. Biodiesel layer was transferred to X dram vial and weighed
Removal of Methanol
1. 100 ml beaker was half filled with water and placed on hotplate
2. Beaker was heated to over 100oC
3. 11 dram vial containing biodiesel product was placed in beaker, with no top
4. After 1 hr biodiesel product was weighed
Removal of Methanol by distillation
1. A simple distillation was set up
2. The sample was placed in a tarred round bottom flask and weighed
3. Round bottom flask was heated in a water bath over 100o-C for 20 minutes
4. After 20 minutes, biodiesel product was weighed.
Removal of Catalyst
1. 5 mL of biodiesel product was placed in vial
2. 2.5 mL of water was added to vial and mixed
3. After separation of layers water was removed by pipette
4. Steps 1-3 were repeated twice
e
9 Appendix B: Recommended Procedures
B-1 Analysis by Gas Chromatography
1. 500 mg of methylheptadecanoate in 50 mL heptane is prepared in 50 mL volumetric flask
2. 2 -250 mg samples of biodiesel are weighed and transferred to 10 mL screw cap vials
3. The first vial, 5 mL of the methylheptadecanoate solution is added
4. The second vial, the reference, 5 mL of heptane is added.
5. The column is set to: a capillary HP-INNOWax Column (30mx0.25mmx0.25microm), with a split flow rate of 25 mL/min, and a temperature of 220oC
6. The carrier gas is He and is pressured at 100 kPa with a flow of 1.3mL/min
7. The initial oven temperature is 150oC, and is increased at 5oC/min up to 220oC, with a run time of 15 mins.

f
10 Appendix C : Calculations and Data
C-1 Density Determination
Prior to Processing
! = "# = 4.5115 $
0.005 % = 902.3$%
Processed Biodiesel
! = "# = 3.807 $
0.005 % = 761.4$%
C-2 Acid Value Calculations for J. curcas oil
&'($ℎℎ* +, +(- ./'0 = # × ! = 10 "% × 1 %1000 "% × 902.3
$% = 9.023$
12(0 /+-.*(+3 = 1007.2 "$ 4561000 "% 625
= 1.0072 "$ 456"% 625
12(0 /+-.*(+3 7'8.(7'0 ,+7 3.'*71-(91*(+3 =24.36 mL
12(0 7'8.(7'0 ,+7 3.'*71-(91*(+3 = 24.19 "% × 1.0072"$ 456"% 625= 24.36 "$ 456
12(0 :1-.' = "$ 456 $ +(- = 24.36 "$ 456
9.023 $ +(- = 2.7"$ 456$ +(-

g
C-3 T ime Variable
Table 10-1: Results of T ime Variation for Single Step Process
T rial Layer T ime M in
Catalyst g
M ethanol mL
J. curcas
oil mL
W eight g
Total W eight
g
Y ield of Biodiesel
Layer wt %
Average of two
tr ials with same
parameter 1 Glycerin 30 0.4485 10 25 12.129 - - - 1 Biodiesel 30 0.4485 10 25 12.034 24.163 0.498 - 2 Glycerin 30 0.4535 10 25 8.072 - - 0.634 2 Biodiesel 30 0.4535 10 25 27.037 35.109 0.770 - 3 Glycerin 60 0.4485 10 25 7.973 - - - 3 Biodiesel 60 0.4485 10 25 19.953 27.926 0.714 - 4 Glycerin 60 0.4535 10 25 6.201 - - 0.745 4 Biodiesel 60 0.4535 10 25 15.755 21.956 0.776 - 5 Glycerin 90 0.4485 10 25 7.648 - - - 5 Biodiesel 90 0.4485 10 25 18.871 26.519 0.712 - 6 Glycerin 90 0.4535 10 25 6.581 - - 0.715 6 Biodiesel 90 0.4535 10 25 17.734 24.315 0.718 - 7 Glycerin 120 0.4485 10 25 9.794 - - - 7 Biodiesel 120 0.4485 10 25 16.702 26.496 0.630 - 8 Glycerin 120 0.4535 10 25 7.652 - - 0.647 8 Biodiesel 120 0.4535 10 25 15.085 22.737 0.663 -
Table 10-2: Results for T ime Variation for Two Step Process
T rial Layer T ime M in
Catalyst G
M ethanol mL
J. curcas oil mL
W eight g
Total W eight
g
Y ield of Biodiesel
Layer wt %
9 Glycerin 30 0.4485 10 25 10.029 - - 9 Biodiesel 30 0.4485 10 25 16.190 26.219 0.617 10 Glycerin 60 0.4485 10 25 7.803 - - 10 Biodiesel 60 0.4485 10 25 18.756 26.559 0.706 11 Glycerin 90 0.4485 10 25 5.816 - - 11 Biodiesel 90 0.4485 10 25 16.488 22.304 0.739 12 Glycerin 120 0.4485 10 25 5.888 - - 12 Biodiesel 120 0.4485 10 25 16.882 22.770 0.741
;('-0 +, <(+0('/'- = &* +, <(+0('/'- &* +, <(+0('/'- + &* +, $-;2'7(3

h
C-4 Methanol Variable
Table 10-3: M ethanol Variable Results Before Washing
T rial Layer T ime hr
Catalyst g
M ethanol mL
O il mL
W eight g
Total W eight
g
Y ield of Biodiesel
wt % 13 Glycerin 60 0.4725 5 25 6.394 - - 13 Biodiesel 60 0.4725 5 25 16.871 23.265 0.725 14 Glycerin 60 0.4725 5 25 6.933 - - 14 Biodiesel 60 0.4725 5 25 16.599 23.532 0.705 15 Failed 60 0.4725 5 25 - - - 15 Failed 60 0.4725 5 25 - - - 16 Failed 60 0.4725 15 25 - - - 16 Failed 60 0.4725 15 25 - - - 17 Glycerin 60 0.4725 15 25 5.796 - - 17 Biodiesel 60 0.4725 15 25 18.33 24.126 0.759 18 Glycerin 60 0.49 15 25 11.724 - - 18 Biodiesel 60 0.49 15 25 19.485 31.209 0.624 19 Glycerin 60 0.49 20 25 10.333 - - 19 Biodiesel 60 0.49 20 25 12.083 22.416 0.539 20 Failed 60 0.4725 20 25 - - - 20 Failed 60 0.4725 20 25 - - - 21 Glycerin 60 0.4725 20 25 6.308 - - 21 Biodiesel 60 0.4725 20 25 16.732 23.04 0.726
;'(-0 +, <(+0('/'- = &* +, <(+0('/'- &* +, <(+0('/'- +&* +, $-;2'7(3

i
C-5 Distillation of Methanol
Table 10-4: Results of M ethanol Distillation
"1// +, "'*ℎ13+- 100'0 = "% +, "'*ℎ13+- × ! +, "'*ℎ13+-
! +,85% =.7' "'*ℎ13+- 1* 20+> = 0.834 $"%
"'*ℎ13+- 0(/*(--'0 = <(+0('/'- <',+7' 0(/*(--1*(+3 − <(+0('/'- 1,*'7 0(/*(--1*(+3
% ;('-0 +, "'*ℎ13+- = &* +, "'*ℎ13+- 0(/*(--'0&* +, "'*ℎ13+- 100'0 × 100
T rial M ethanol O riginally
mL
M ethanol O riginally
g
Before Distillation
g
A fter Distillation
g
M ethanol Distilled
g
M ethanol Amount % yield
1 10 8.34 16.587 15.994 0.593 7.1103 2 10 8.34 14.093 13.68 0.413 4.952 3 10 8.34 18.459 17.78 0.679 8.1415 4 10 8.34 16.234 15.532 0.702 8.4173 5 10 8.34 15.785 14.637 1.148 13.765 6 10 8.34 10.916 10.4 0.516 6.1871 7 10 8.34 16.819 16.625 0.194 2.3261 8 10 8.34 17.474 17.172 0.302 3.6211 9 10 8.34 23.933 23.332 0.601 7.2062
10 10 8.34 14.9 14.755 0.145 1.7386 11 10 8.34 17.102 16.955 0.147 1.7626 12 10 8.34 14.253 14.167 0.086 1.0312 13 5 4.17 16.286 16.131 0.155 3.717 14 5 4.17 15.967 15.79 0.177 4.2446 15 5 4.17 Failed - - - 16 15 12.51 Failed - - - 17 15 12.51 16.581 16.09 0.491 0.039249 18 15 12.51 20.255 19.886 0.369 0.029496 19 20 16.68 7.568 7.1822 0.3858 0.02312 20 20 16.68 Failed - - - 21 20 16.68 12.115 11.942 0.173 1.0372
Average recovery of methanol 4.6914

j
C-6 Recovery of Catalyst
Table 10-5: Results of Washing
If washing had not removed biodiesel products as well as catalyst the following calculations would have been done:
21*1-;/* 7'2+:'7'0 = <(+0('/'- <',+7' − <(+0('/'- 1,*'7
21*1-;/* 1"+.3* ;('-0 = &* +, 21*1-;/* 7'2+:'7'0&* +, +7$(31- 21*1-;/* × 100
T rial O riginal Catalyst
g
Biodiesel Before Washing
g
Biodiesel A fter Washing
g
Mass Removed
F rom Washing
g 1 0.4485 15.994 10.015 5.979 2 0.4535 13.68 8.447 5.233 3 0.4485 17.78 13.518 4.262 4 0.4535 15.532 10.103 5.429 5 0.4485 14.637 Failed - 6 0.4535 10.4 8.149 2.251 7 0.4485 16.625 Failed - 8 0.4535 17.172 11.078 6.094 9 0.4485 23.332 12.754 10.578 10 0.4485 14.755 6.067 8.688 11 0.4485 16.955 Failed - 12 0.4485 14.167 6.36 7.807 13 0.4725 16.131 12.195 3.936 14 0.4725 15.79 11.787 4.003 15 0.4725 - - - 16 0.4725 - - - 17 0.4725 16.09 13.402 2.688 18 0.4900 19.886 12.083 7.803 19 0.4900 7.1822 Failed - 20 0.4725 - - - 21 0.4725 11.942 6.553 5.389

k
C-7 F inal Biodiesel Product
Table 10-6: F inal Y ield of Biodiesel
T rial O riginal Amount
g
Before Processing
g
Y ield wt%
After Processing
g
Y ield wt%
1 22.8 12.034 0.532478 10.015 43.9254 2 22.8 27.037 1.196327 8.447 37.0482 3 22.8 19.953 0.882876 13.518 59.2895 4 22.8 15.755 0.697124 10.103 44.3114 5 22.8 18.871 0.835 - - 6 22.8 17.734 0.78469 8.149 35.7412 7 22.8 16.702 0.739027 - - 8 22.8 15.085 0.667478 11.078 48.5877 9 22.8 16.19 0.716372 12.754 55.9386
10 22.8 18.756 0.829912 6.067 26.6096 11 22.8 16.488 0.729558 - - 12 22.8 16.882 0.746991 6.36 27.8947 13 22.8 16.871 0.746504 12.195 53.4868 14 22.8 16.599 0.734469 11.787 51.6974 15 22.8 Failed 0 - - 16 22.8 17.213 0.761637 - - 17 22.8 18.33 0.811062 13.402 58.7807 18 22.8 19.485 0.862168 12.083 52.9956 19 22.8 12.083 0.534646 - - 20 22.8 18.779 0.830929 - - 21 22.8 16.732 0.740354 6.553 28.7412
Average 0.769367 44.6463
@'72'3* A('-0 <; B'($ℎ* = C1"=-' 7'"1(3(3$57($(31- &'($ℎ* × 100

l
11 Appendix D: Description of Samples
D-1 Physical Description of Unwashed biodiesel
T rial Description of G lycerin Layer Description of Biodiesel L ayer 1 lucid, dark yellow brown, emulsions
suspended very lucid, pale yellow
2 lucid, dark yellow brown, emulsions suspended
very lucid, pale yellow
3 lucid, dark yellow brown, emulsions suspended
very lucid, pale yellow
4 very lucid, dark yellow brown, homogeneous very lucid, pale yellow 5 cloudy, pale yellow, off white precipitant very lucid, pale yellow, off white precipitate 6 very lucid, dark yellow brown, homogeneous very lucid, pale yellow, off white precipitate 7 very lucid, dark yellow brown, homogeneous very lucid, pale yellow 8 off white cloudy layer, very lucid in other,
dark yellow brown, homogeneous very lucid, pale yellow, off white precipitate
9 lucid, dark yellow brown, emulsions suspended
very lucid, pale yellow
10 very lucid, dark yellow brown, homogeneous very lucid, pale yellow 11 very lucid, dark yellow brown, homogeneous very lucid, pale yellow 12 very lucid, pale yellow, cloudy emulsions very lucid, pale yellow 13 very lucid, dark yellow brown, homogeneous very lucid, pale yellow 14 very lucid, dark yellow brown, homogeneous very lucid, pale yellow 15 Failed – no layers, yellow, cloudy 16 Failed – no layers, yellow, cloudy 17 very lucid, dark yellow brown, homogeneous very lucid, pale yellow 19 very lucid, dark yellow brown, homogeneous very lucid, pale yellow 20 Failed – no layers, yellow, cloudy 21 cloudy, dark yellow brown, off white
precipitate very lucid, pale yellow
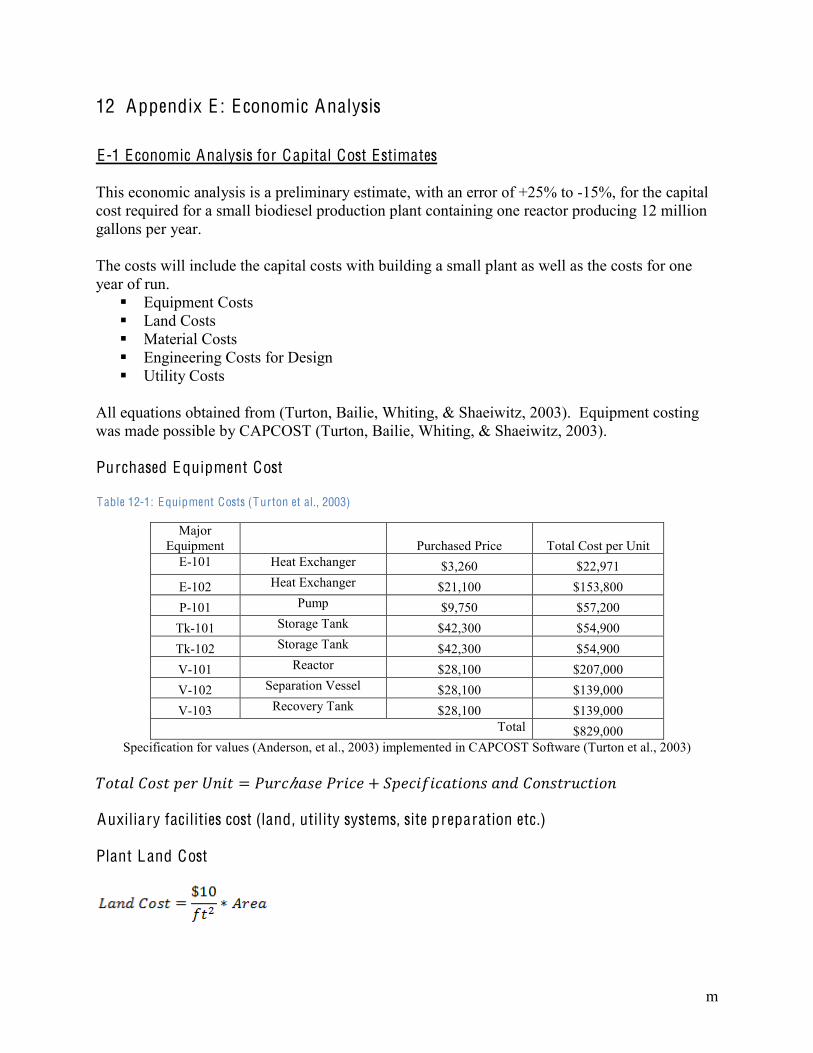
m
12 Appendix E : E conomic Analysis
E-1 E conomic Analysis for Capital Cost Estimates
This economic analysis is a preliminary estimate, with an error of +25% to -15%, for the capital cost required for a small biodiesel production plant containing one reactor producing 12 million gallons per year. The costs will include the capital costs with building a small plant as well as the costs for one year of run.
Equipment Costs Land Costs Material Costs Engineering Costs for Design Utility Costs
All equations obtained from (Turton, Bailie, Whiting, & Shaeiwitz, 2003). Equipment costing was made possible by CAPCOST (Turton, Bailie, Whiting, & Shaeiwitz, 2003). Purchased Equipment Cost
Table 12-1: Equipment Costs (Turton et al., 2003)
Major Equipment
Purchased Price Total Cost per Unit
E-101 Heat Exchanger $3,260 $22,971 E-102 Heat Exchanger $21,100 $153,800 P-101 Pump $9,750 $57,200
Tk-101 Storage Tank $42,300 $54,900 Tk-102 Storage Tank $42,300 $54,900 V-101 Reactor $28,100 $207,000 V-102 Separation Vessel $28,100 $139,000 V-103 Recovery Tank $28,100 $139,000
Total $829,000 Specification for values (Anderson, et al., 2003) implemented in CAPCOST Software (Turton et al., 2003)
D+*1- >+/* ='7 E3(* = @.72ℎ1/' @7(2' + C='2(,(21*(+3/ 130 >+3/*7.2*(+3 Auxiliary facilities cost (land, utility systems, site preparation etc.)
Plant Land Cost

n
Engineering
Hours Estimate (P)
Yearly Wage
Hourly Wage
Markup Amount Spent to Complete
Project Process Engineer $704 $80,000 $40.82 $91.22 $64,222
Mechanical Engineer $1,056 $80,000 $40.82 $91.22 $96,333 Mechanical Design Engineer $2,112 $80,000 $40.82 $91.22 $192,666
Electrical Engineer $1,056 $80,000 $40.82 $91.22 $96,333 Instrumentation and Control
Design Engineer
$2,112
$80,000
$40.82
$91.22 $192,666 Quality Assurance $352 $80,000 $40.82 $91.22 $32,111
Project Management $2,112 $95,000 $48.47 $102.70 $216,911 Total $891,242
>+3*(3$'32; = (0.2)($829,000 + $4,000 + $891,242) = $344,848.40 @7(2' >+/*/ = 4
3 (>+3*(3$'32;
0.2 *1.2) = $2,758,787 Utilities systems
Equipment Utility Annual Utility Cost P-101 A/B Electricity $10,100
Total $10,100 Steam=Cooling Water=$0/year Electricity=$10,100/year Man Power: (assuming about $40,000 per year per operator)

o
A=$87,360+$10,100=$97,460/year H@ =
(1 + 0.06)40 − 10.06(1 + 0.06)40 = 15.046
Present Value = $6,477 The total cost is equal to the Present Value + the Contingency cost Total Cost = $6,477+$2,758,787=$2,765,264 Land
J. curcas plant can produce 3,000 kg/hectare (Barta, 2007). The density of J. curcas oil is 932.92 g/L (Pramanik, 2003).
I'8.(7'0 <(+0('/'- +.*=.* = 12 mil. gal × 3.8 L1 gal × 932.92gL = 42.5 × 10⁹g
J(+0('/'- ;('-0 ,7+" +(- = 59.95 &*% I'8.(7'0 5(- ,+7 @7+0.2*(+3 = 42.5 × 10⁹g ÷ .5995 = 7.09 × 10¹⁰$
%130 H7'1 I'8.(7'0 ,+7 @7+0.2*(+3 = 7.09 × 10¹⁰$ × 1 K$1000 $ ×
1 ℎ'2*17'3,000 K$
= 23,642 ℎ'2*17'/

p
12.1 E-2 Plant Performance Data- C rown Plant
(Anderson, Masterson, Mc Donald, & Sullivan, 24-28 August 2003)
*Specifications used for economic cost analysis

q
13 References
Anderson, D., & Derek Masterson, B. M. (24-28 August 2003). Industrial Biodiesel Plant Design and Engineering: Practical Experience. Chemistry and Technology Conference, Session Seven: Renewable Energy Management, International Palm Oil Conference (PIPOC). Putrajaya, Malaysia.
Barta, P. (2007, August 24). Jatropha plant gains steam in global race for biofuels. Wall Street Journal , A1.
Central Intelligence Agency. (2009, March 19). Haiti. Retrieved March 31, 2009, from The World Factbook: https://www.cia.gov/library/publications/the-world-factbook/print/ha.html
Centre For Jatropha Promotion. (2009). Centre For Jatropha Promotion. Retrieved April 5, 2009, from The Plant - Profile: http://www.jatrophaworld.org/jatropha_plant_9.html
Chromic. (2002, May 13). Distillation of Safrole. Retrieved 4 2009, May , from Chemistry Archive: http://designer-drug.com/pte/12.162.180.114/dcd/chemistry/safrole.distillation.html
Energy Information Administration. (2008, December 8). World Petroleum Data. Retrieved March 31, 2009, from International Energy Annual 2006: http://www.eia.doe.gov/iea/pet.html
Environmental Protection Agency. (2008, February 8). Human Health. Retrieved Mary 1, 2009, from National Clean Diesel Campaign: http://www.epa.gov/otaq/schoolbus/humanhealth.htm
Environmental Protection Agency. (2009, January 15). Particulate matter. Retrieved May 1, 2009, from Six Common Pollutants: http://www.epa.gov/oar/particlepollution/
Hutson, S. (2009). Jatropha tree could be a biodiesel boon for F lorida farmers, U F researcher says . Retrieved April 2009, from Inside IFAS: http://emr.ifas.ufl.edu/inside_ifas/8_2007/8_2007_19.html
Ma, F., & Hanna, M. (1999). Biodiesel production: a review. Bioresource Technology , 1-15.
Jaffery, R. S. (2009). When oil grows on trees. Retrieved March 31, 2009, from World Agroforests: http://www.worldagroforestrycentre.org/news/default.asp?NewsID=75F25096-4E40-4437-B445-37AD534D033F
Kemp, W. (2006). Biodiesel: Basics and Beyond. Tamsworth, Ontario Canada: Aztext Press.
Kumar, M. e. (2003). An experimental comparison of methods to use methanol and Jatropha oil in a compression ignition engine. Biomass & Bioenergy , 309-318.
Meher, L. C., Sagar, D. V., & Naik, a. S. (2004). Technical aspects of biodiesel production by transesterification - a review. Renewable & Sustainable Energy Reviews , 248-268.
Mittelbach, M., & Remshmidt, C. (2006). Biodiesel. Graz, Austria: Martin Mittelbach.

r
Motta, L. (2007). Viscosity. Retrieved May 1, 2009, from Wolfram Research: http://scienceworld.wolfram.com/physics/Viscosity.html
National Biodiesel Board. (2009). Benefts of Biodiesel.
Openshaw, K. (2000). A review of Jatropha curcas: an oil plant of unfulfilled promise. Biomass & Bioenergy , 1-15.
Patil, P. D., & Deng, S. (2009). Optimization of biodiesel production from edible and non-edible vegetable oils. Fuel , 1302–1306.
Pramanik, K. (2003). Properties and use of Jatropha curcas oil and diesel fuel blends in compression ignition engine. Renewable Energy, 28, 239-248.
Rothkopt, G. (2008). A Blueprint for Green Energy in the Americas. Retrieved April 5, 2009, from Inter-American Development Bank: http://www.iadb.org/biofuels/
Schober, S., Seidl, I., & Mittelbach, M. (2006). Ester Content evaluation in biodiesel from animal fats and lauric oils. Scientific Technology , Volume 108 Page 309-314.
Sheehan, J., Camobreco, V., Duffield, J., Graboski, M., & Shapouri, H. (1998). An Overview of Biodiesel and Petroleum Diesel Life Cycles. Golden, Colorado.
Tiwari, A., Akhilesh, K., & Raheman, H. (2007). Biodiesel production from jatropha oil (Jatropha curcas) with high free fatty acids: An optimized process. Biomass & Bioenergy, 569-575.
Turton, R., Bailie, R. C., Whiting, W. B., & Shaeiwitz, J. A. (2003). Analysis, Synthesis, and Design of Chemical Processes, (2nd Edition). Prentice Hall.
U. S. Department of Energy. (2008, April). Fact Sheet. Retrieved April 15, 2009, from Clean Cities: http://www.afdc.energy.gov/afdc/pdfs/42562.pdf