azul logistics business august 2021
TRANSCRIPT

1
Azul Logistics Business August 2021

Disclaimer
The information contained in this presentation is only a summary and does not purport to be complete. This presentation has been prepared solely for informational purposes and should not be construed as financial, legal, tax, accounting, investment or other advice or a recommendation with respect to any investment. This presentation does not constitute or form part of any offer or invitation for sale or subscription of or solicitation or invitation of any offer to buy or subscribe for any securities, nor shall it or any part of it form the basis of or be relied on in connection with any contract or commitment whatsoever.
This presentation includes estimates and forward-looking statements within the meaning of the U.S. federal securities laws. These estimates and forward-looking statements are based mainly on our current expectations and estimates of future events and trends that affect or may affect our business, financial condition, results of operations, cash flow, liquidity, prospects and the trading price of our preferred shares, including in the form of ADSs. Although we believe that these estimates and forward-looking statements are based upon reasonable assumptions, they are subject to many significant risks, uncertainties and assumptions and are made in light of information currently available to us.
These statements appear throughout this presentation and include statements regarding our intent, belief or current expectations in connection with: changes in market prices, customer demand and preferences and competitive conditions; general economic, political and business conditions in Brazil, particularly in the geographic markets we serve as well as any other countries we currently serve and may serve in the future; our ability to keep costs low; existing and future governmental regulations; increases in maintenance costs, fuel costs and insurance premiums; our ability to maintain landing rights in the airports that we operate; air travel substitutes; labor disputes, employee strikes and other labor-related disruptions, including in connection with negotiations with unions; our ability to attract and retain qualified personnel; our aircraft utilization rate; defects or mechanical problems with our aircraft; our ability to successfully implement our growth strategy, including our expected fleet growth, passenger growth, our capital expenditure plans, our future joint venture and partnership plans, our ability to enter new airports (including certain international airports), that match our operating criteria; management’s expectations and estimates concerning our future financial performance and financing plans and programs; our level of debt and other fixed obligations; our reliance on third parties, including changes in the availability or increased cost of air transport infrastructure and airport facilities; inflation, appreciation, depreciation and devaluation of the real; our aircraft and engine suppliers; and other factors or trends affecting our financial condition or results of operations, including those factors identified or discussed as set forth under “Risk Factors” in the prospectus included in our registration statement on Form F-1 (No. 333-215908) filed with the Securities and Exchange Commission (the “Registration Statement”).
In addition, in this presentation, the words “believe,” “understand,” “may,” “will,” “aim,” “estimate,” “continue,” “anticipate,” “seek,” “intend,” “expect,” “should,” “could,” “forecast” and similar words are intended to identify forward-looking statements. You should not place undue reliance on such statements, which speak only as of the date they were made. We do not undertake any obligation to update publicly or to revise any forward-looking statements after we distribute this presentation because of new information, future events or other factors. Our independent public auditors have neither examined nor compiled the forward-looking statements and, accordingly, do not provide any assurance with respect to such statements. In light of the risks and uncertainties described above, the future events and circumstances discussed in this presentation might not occur and are not guarantees of future performance. Because of these uncertainties, you should not make any investment decision based upon these estimates and forward looking statements.
In this presentation, we present EBITDA, which is a non-IFRS performance measure and is not a financial performance measure determined in accordance with IFRS and should not be considered in isolation or as alternatives to operating income or net income or loss, or as indications of operating performance, or as alternatives to operating cash flows, or as indicators of liquidity, or as the basis for the distribution of dividends. Accordingly, you are cautioned not to place undue reliance on this information.
2

3
IntroductionAzul at a glance

4
AWARD-WINNING AIRLINE SUPPORTED BY STRONG CULTURE
#1
AIRLINE
WORLDWIDE
#1
AIRLINE
LATIN AMERICA
#1
AIRLINE
BRAZIL
#1
LOW COST
LATIN AMERICA
#1
ECONOMY CLASS
WORLDWIDE
#1
ECONOMY CLASS
LATIN AMERICA

AZUL LED BY FOUNDERS
5
David NeelemanFounder and Chairman
John RodgersonFounder and CEO
Alex MalfitaniFounder and CFO
Flavio CostaFounder and COO
Jason WardFounder and VP,
People & Customers
Abhi ShahFounder and CRO

AZUL BUSINESS MODEL FOUNDATION
6
Over US$1.6 billion of capital invested:
United investment US$100 million
Start-up capital US$250 million
Acquisition of Trip Airlines
HNA investment US$450 million
IPO US$406 million
2008 2012 2015 2016 2017
ConvertibleUS$325 million
2020

7
DELIVERING ON OUR IPO PROMISES
ASKs (billion)
Net Revenue(R$ billion)
EBITDAR(R$ billion)
20192016 2018
22.9
29.4
35.9
57%
2018
6.7
2016 2019
9.1
11.4
72%
1.8
2016 2018 2019
2.5
3.6
101%
Source: Azul and Bloomberg

SUCCESSFUL
GROWTH TRACK
RECORD 2008 2019
8

MARKET AND ROUTE LEADERSHIP
Azul
Competitors
Azul Competitor 1 Competitor 2
Domestic Cities Served
Cities Where #1 Daily Departures
So urce: Azul , ANAC and Co mpani es. Co nsi der s l eadershi p by number o f departure – As o f 2Q219
197
132
94
693
480 467
154
4741

AZUL GROWS DEMAND
10
Brazil Domestic Passengers by Year
(in millions)
50
70
126
26
20192008 2022E
96
+92%
S o urce: Azul , ANAC, IATA, CE BR, ABE AR, IBGE and B l o o mberg. Assumes 20 1 9 do mesti c passeng er gro wth ex - Azul remai ns f l at
Aviation in Brazil has DOUBLEDover the last ten years
Azul was responsible for 60% of Brazilian market growth

UNIQUE NETWORK WITH DIVERSIFIED HUB LOCATIONS
11
Competitors focus on
São Paulo, Brasília and Rio
Rio de Janeiro(SDU+GIG)
São Paulo(GRU+CGH)
Brasília
Azul serves all of Brazil
More than 90% of competitors’ domestic ASKs werefrom/to cities in the triangle, compared to 30% for Azul
Pre COVID-19 pandemic

Growth Opportunity
BRAZILIAN AVIATION MARKET GROWTH OPPORTUNITY
12
Flights Per Capita
0.5
Brazil 2007 Mexico 2019Brazil 2019 Colombia 2019 Chile 2019
2.8
0.3
USA 2019
0.80.9
1.4
Brazil 2019 Brazil at 0.8(same as Mexico)
Brazil at 0.9 (same as Colombia)
Brazil at 1.4 (same as Chile)
+2.3+3.0
+6.8
Source: Azul, ANAC, IATA, CEBR, IBGE and Bloomberg
Aviation in Brazil has doubled over the last ten years, but it still presents enormous potential
To reach Mexico’s flights per capita ratio, Brazil would need to add capacity equivalent to twice that of Azul; for Chile, over six times

13
Azul Cargo Logistics

14
AZUL CARGO UNPARALLELED REACH
88% of our ATK’s coming from belly space at very low variable cost
300 locations nationwide serving 4,500+ cities
Air-service to 130+ destinations
#1 in Brazil
Accessing over 90% of Brazil’s population
5.6+ million packages delivered in 1H21
Delivery within 48 hours to over 1,000 cities

AZUL CARGO OUTSTANDING PERFORMANCE
15
2009 2010 2015 20162011 20132012 2014 2017 2018 2019 2020 2021E
+100%
• Consistent revenue growth
• Early in the growth curve
• On track to double net revenue in 2021 compared to 2019

AZUL CARGO MARKET SHARE
16
Azul35%
Azul28%
Azul20%
Azul9%
Azul12%
2018 2020
2017 2019 1H2021
S o urce: ANAC
• Strong market out-performance
• Growing the market, not stealing share

17
Cargo compartment load factor of 50%, half of which is bags
Opportunity to grow cargo by
3x plus fleet growth and next
gen fleet50% Load factor
EXPANDING OPPORTUNITIES THROUGH BELLY CARGO CAPACITY

FLEXIBLE CARGO CAPABILITIES
Cessna Caravan
E-195 adapted for logistics
Boeing 737
18

E195 E2 A320neo
-29%-26%
118 seats 136 seats 174 seats
E2E195 A320neo
-14%+5%
118 seats 136 seats 174 seats
CASK Advantage
Trip Cost Advantage
The addition of next-generation aircraft is the cornerstone of Azul’s margin expansion strategy and cargo capacity increase going forward
AZUL’S FLEET TRANSFORMATION
19
E2E195 A320neo
+63%
+209%
Belly Cargo Capacity

20
AZUL CARGO MARGINAL COST OPPORTUNITY
Passenger vs Cargo
Cargo Marginal CostPax Average Fare Pax Average Cost

INTEGRATED END-TO-END LOGISTICS SOLUTIONS
21
Unique in the market

22
1H2020
84.4%
1H2021
96.7%
+12.3 p.p
SLA
Performance
1.6 M
1H2020
2.6M
1H2021
+63%
CARGO PERFOMANCE
Last-Mile
Deliveries

23
Brazilian Market Opportunities

Source: Statista 24
LARGEST E-COMMERCE MARKETS
in billion US$
Chinese and US e-commerce
markets are 45x and 34x larger
than the Brazilian e-commerce
market, respectively
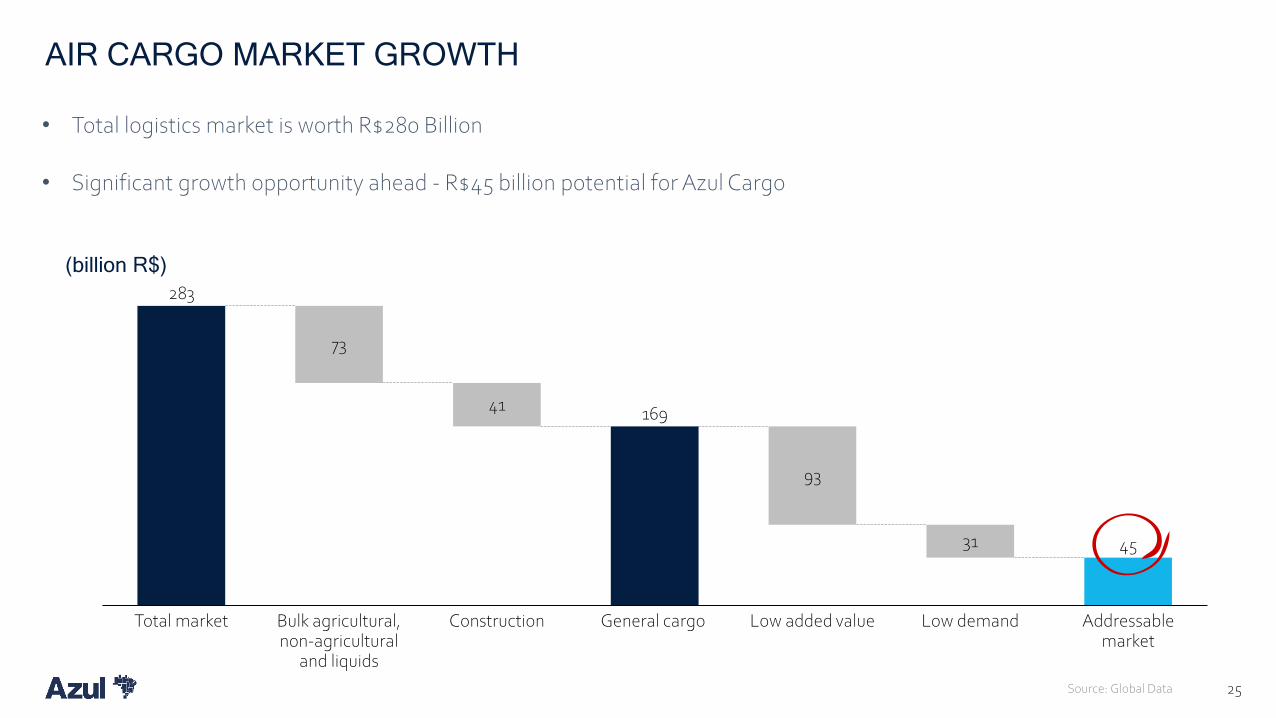
AIR CARGO MARKET GROWTH
Source: Global Data 25
(billion R$)
• Total logistics market is worth R$280 Billion
• Significant growth opportunity ahead - R$45 billion potential for Azul Cargo
283
169
45
73
41
93
31
Low demandTotal market Bulk agricultural, non-agricultural
and liquids
Construction Low added valueGeneral cargo Addressable market

26
AZUL CARGO – MULTY YEAR GROWTH STORY
• 100% growth from 2019 to 2021
• Significant growth levers from 2021 and beyond
• Azul fleet transformation and network growth key to margin expansion
• 15x larger addressable market
Fleet
Transformation
Brazil market
growth
Logistics
capabilities Network reach
2019 2021 2025
100%
