axis equity saver fund - axis mutual funds india equity saver... · top 10 stocks % of nav ... the...
TRANSCRIPT

AXIS EQUITY SAVER FUND Open Ended Equity Scheme

A primer on asset allocation
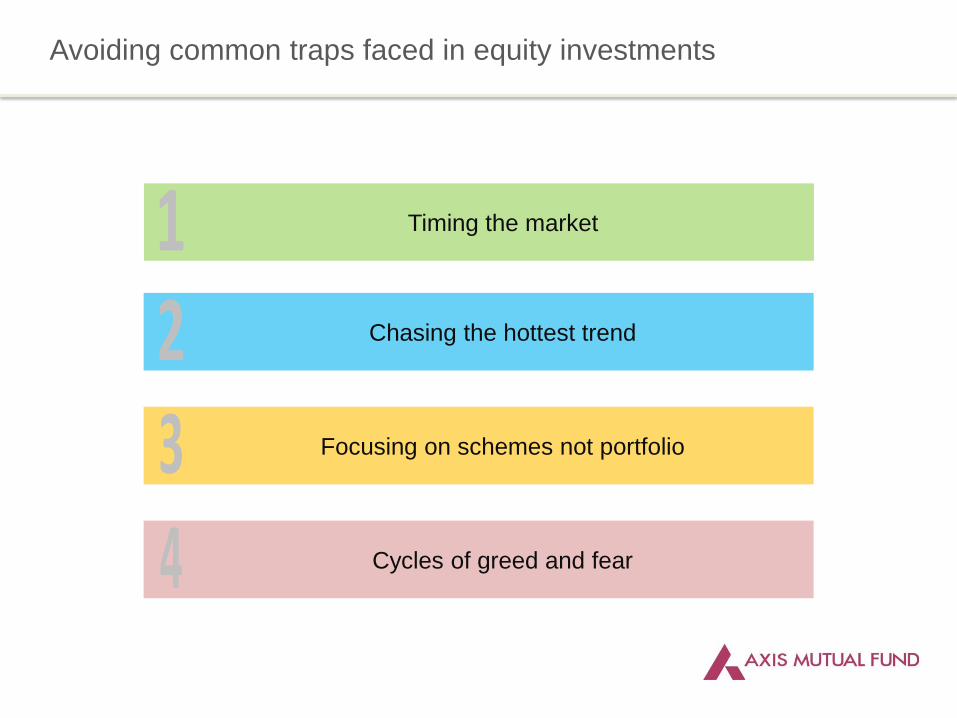
Avoiding common traps faced in equity investments
Timing the market
Chasing the hottest trend
Focusing on schemes not portfolio
Cycles of greed and fear

Portfolio diversification reduces risk
Lower volatility of returns i.e., Stable returns over a medium
term
Freedom from market timing
Tailors the portfolio to
your risk profile
Why do Asset Allocation?

Bonds and Cash
Equity and Cash
Equity and Bonds
Process of diversifying your investments across a range of assets - equity, debt, money market
Strategy aims to balance risk with return by distributing into investments that have a low
correlation with each other
Correlation
Period: April 2002 -15. Equity: Nifty 50 Bonds: Bonds: I Sec Sovereign Bond Index , Cash: Crisil Liquid Fund Index. Source of data: Bloomberg Note:
This is historical data. Past performance may or may not be sustained in future.
15%
8%
3%
What is Asset Allocation?

If the markets fall by Increase required to recover
-10% 11%
-15% 18%
-20% 25%
-25% 33%
-50% 100%
-80% 400%
Higher the fall, larger is the increase required to recover!
How does volatility affect investments?
Above data is for illustration purpose

Portfolio needs to balance both risk and return
In order to get the optimal outcome, investors need to either
minimize risk based on a given
level of expected return
maximize expected return
based on a given level of risk
OR

• Equity has, traditionally, given higher return than debt in 7 out of last 10 calendar years^
• However the risk of losing money over shorter periods is much higher for equity than debt
• Multi-asset portfolio benefits from growth potential but cuts down the risk of losses
• Potential for higher return than debt funds
• Lower risk of losing money as often as equity
• Can a multi-asset portfolio be made available with an efficient tax structure?
Why combine debt and equity?
Data: ACEMF Note: Equity refers to Nifty. 50. Debt refers to ISEC Sovereign Bond Index. ^Returns are calendar
year returns. Since 2004, Nifty 50 Index outperformed ISEC Sovereign Bond Index in every calendar year
except 2008, 2011and 2015.
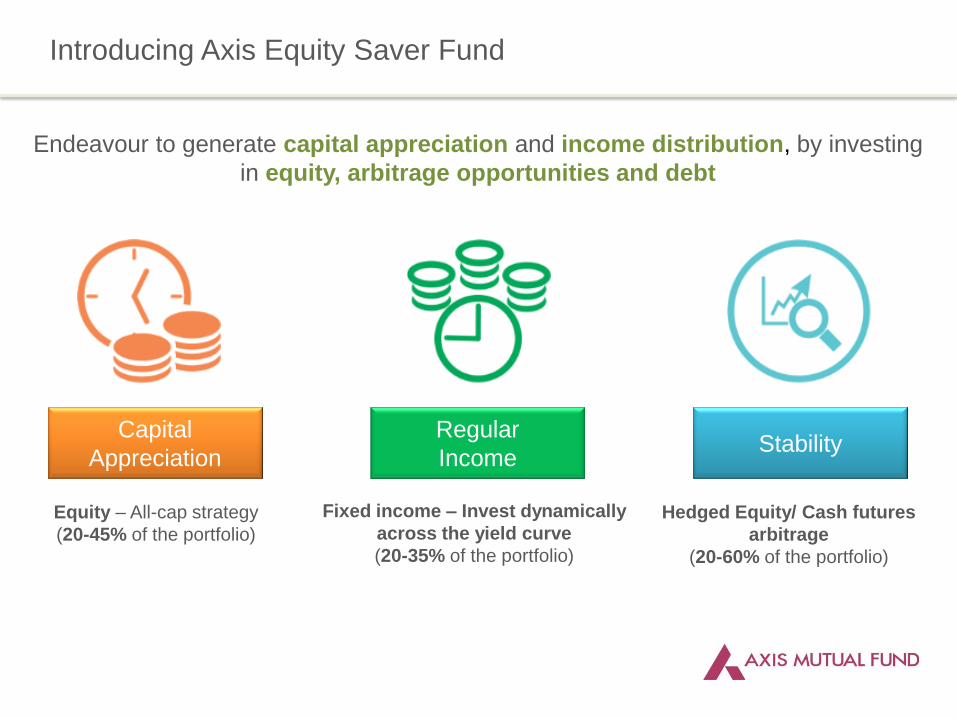
Endeavour to generate capital appreciation and income distribution, by investing
in equity, arbitrage opportunities and debt
Fixed income – Invest dynamically
across the yield curve
(20-35% of the portfolio)
Equity – All-cap strategy
(20-45% of the portfolio)
Capital
Appreciation
Regular
Income Stability
Hedged Equity/ Cash futures
arbitrage
(20-60% of the portfolio)
Introducing Axis Equity Saver Fund

Equity(20-45%)
Actively managed diversified portfolio of strong
growth companies
Hedged Equity/Cash-futures arbitrage
(20-60%)
Make advantage of market inefficiencies
Debt(20-35%)
High quality papers with portfolio duration based
on interest rate view
Tax efficient
Gross equity exposure
of 65 -80 %
Endeavours to provide
regular income and
adds stability to the
portfolio
Aims to better portfolio
returns with potential for
capital growth
Asset Allocation + Tax Efficiency

Balanced
Risk
Po
ten
tia
l R
etu
rns
Axis Equity
Saver Fund
Equity
MIP
Debt
Debt: I-sec Sovereign Bond Index, MIP: Crisil MIP Blended Index, Balanced: Crisil Balanced Fund Inex, Equity: Nifty 50
Index. Above representation is for illustration purpose.
Axis Equity Saver Fund – Relative positioning

Equity Bonds Crisil Liquid
Fund Index* Model portfolio
2002-04 38% 5% 4% 18%
2003-05 23% 2% 4% 11%
2004-06 38% 6% 5% 18%
2005-07 47% 6% 7% 22%
2006-08 -14% 17% 8% 3%
2007-09 -8% 9% 7% 4%
2008-10 44% 0% 5% 18%
2009-11 -6% 6% 7% 2%
2010-12 -2% 9% 8% 5%
2011-13 17% 7% 9% 12%
2012-14 18% 10% 9% 13%
2013-15 12% 13% 9% 12%
Source: AMFI Portal, Bloomberg, ACEMF. Data period : Apr 2002 to Dec 2015. Model portfolio: 40% Nifty 50 Index + 35% I-sec Sovereign
Bond Index + 25% Crisil Liquid Fund Index (The arbitrage component of the representative portfolio is benchmarked to Crisil Liquid Fund Index),
Equity: Nifty, 50; Bonds: I-Sec Sovereign Bond Index, *The arbitrage component of the model portfolio is benchmarked to Crisil Liquid Fund
Index. All returns annualized. Above data is only for illustration purpose and does not indicate any expected returns from the fund. Past
performance may or may not be sustained in future
Model portfolio has
performed second
best majority of the
times over the last
decade
Period 2002 - 2015: 2 yr rolling returns
Multi asset strategy v/s single assets

Diversification provides stability and improves the risk-return mix
-5% 2% 4% 3%
59%
14% 9%
25%
18%
8% 7% 12%
-50%
-30%
-10%
10%
30%
50%
70%
Equity Bonds Crisil Liquid FundIndex*
Model Portfolio
Period 2002 - 2015: 3 yr rolling returns
Source: AMFI Portal, Bloomberg, ACEMF. Data period : Apr 2002 to Dec 2015. Model portfolio: 40% Nifty 50 ndex + 35% I-sec Sovereign Bond
Index + 25% Crisil Liquid Fund Index (The arbitrage component of the representative portfolio is benchmarked to Crisil Liquid Fund Index),
Equity: Nifty 50, Bonds: I-Sec Sovereign Bond Index, *The arbitrage component of the model portfolio is benchmarked to Crisil Liquid Fund
Index. All returns annualized. Above data is only for illustration purpose and does not indicate any expected returns from the fund. Past
performance may or may not be sustained in future

Limiting Drawdown – Across market cycles
Past performance may or may not be sustained in future. Source: ACEMF, Model portfolio: 40% Nifty 50
Index + 35% I-sec Sovereign Bond Index + 25% Crisil Liquid Fund Index (The arbitrage component of
the representative portfolio is benchmarked to Crisil Liquid Fund Index), Equity: Nifty 50. Drawdown is
the measure of the decline from a historical peak in index value/NAV at a given point in time. Data
updated upto 31st Dec 2015.
-70%
-60%
-50%
-40%
-30%
-20%
-10%
0%
Apr-02 Aug-03 Dec-04 Apr-06 Aug-07 Dec-08 Apr-10 Aug-11 Dec-12 Apr-14 Aug-15
Equity Model portfolio

Styl
e
Sustainable growth
Dis
cip
line
Investment decisions are an output of a logical and disciplined investment process
Fun
dam
en
tals
Bas
ed
Investment process utilizes „Bottom up‟ approaches to identify fundamentally sound companies
Re
sear
ch D
rive
n
Investment decisions are driven by extensive macroeconomic and company research
• The fund can invest across market capitalization
• Focus on quality stocks with sustainable growth potential
• Endeavor to add value to the investor‟s returns in the long run
Investment Strategy – Equity
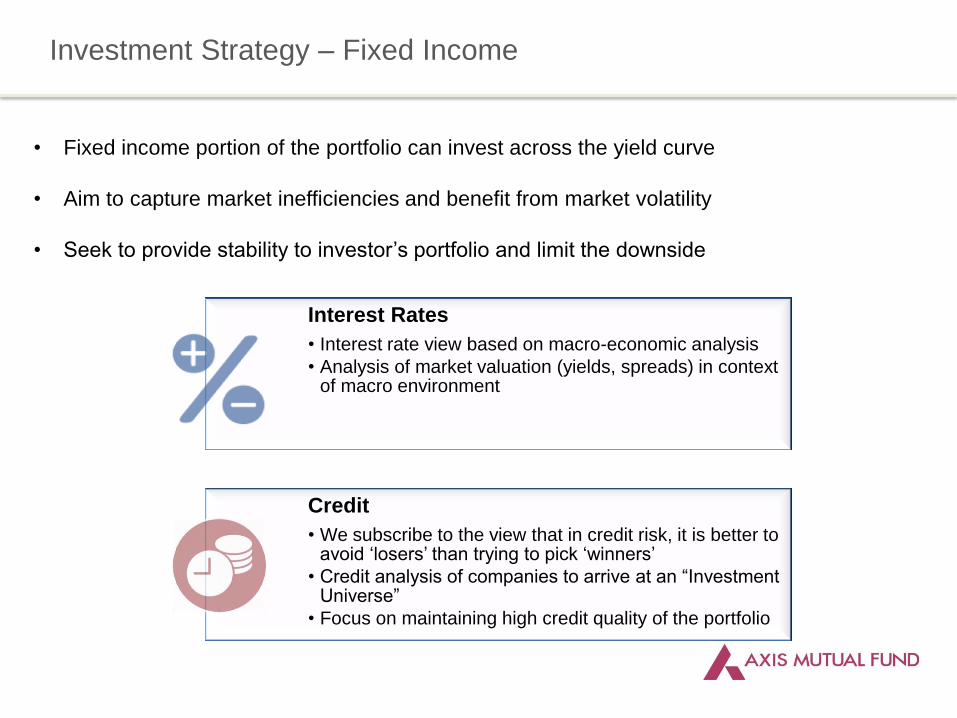
• Fixed income portion of the portfolio can invest across the yield curve
• Aim to capture market inefficiencies and benefit from market volatility
• Seek to provide stability to investor‟s portfolio and limit the downside
Interest Rates
• Interest rate view based on macro-economic analysis
• Analysis of market valuation (yields, spreads) in context of macro environment
Credit
• We subscribe to the view that in credit risk, it is better to avoid „losers‟ than trying to pick „winners‟
• Credit analysis of companies to arrive at an “Investment Universe”
• Focus on maintaining high credit quality of the portfolio
Investment Strategy – Fixed Income

Portfolio Update – 31st May 2016
Portfolio Characteristics:
Average Maturity 6.4 years
Modified Duration 4.1 years
Yield to Maturity^ 7.94%
Top 10 Stocks % of NAV
Larsen & Toubro Limited 3.6
HDFC Ltd 3.5
Kotak Mahindra Bank Limited 3.3
Motherson Sumi Systems Limited 3.0
HDFC Bank Limited 2.9
Tata Consultancy Services Limited 2.7
Maruti Suzuki India Limited 2.4
Sun Pharmaceuticals Industries
Limited 2.1
Nestle India Limited 1.7
Pidilite Industries Limited 1.7
Allocation & maturity is based on the current market conditions and is subject to changes depending on the fund manager’s view of the markets. ^The yield
to maturity given above is based on the portfolio of funds as on date given above. This should not be taken as an indication of the returns that maybe
generated by the fund and the securities bought by the fund may or may not be held till their respective maturities. The calculation is based on the invested
corpus. Sector(s) / Stock(s) / Issuer(s) mentioned above are for the purpose of disclosure of the portfolio of the Scheme(s) and should not be construed as
recommendation. The fund manager(s) may or may not choose to hold the stock mentioned, from time to time. Investors are requested to consult their
financial, tax and other advisors before taking any investment decision(s).
100% of the Fixed Income portion
is in AAA/SOV or equivalent rated
papers.
45.2
21.0
33.8
Total Unhedged Equity
Total Hedged Equity
Debt, Cash and Other Receivables

Debt Oriented Funds Equity Oriented Funds
Pre-tax rate of return 9% 9%
Applicable tax rate* 33.99% 0
Investment (Rs.) 1,000,000 1,000,000
Capital gains (Rs.) 90,000 90,000
Taxable gain (Rs.) 90,000 0
Tax payable (Rs.) 30,591 0
Post tax return 5.94% 9.00%
Tax free dividends *
Monthly, Quarterly div options
available
Capital Gain Tax @ 15%*
For investments up to 1 year
Tax free dividends*
Monthly, Quarterly div options
available
NO CAPITAL GAIN TAX
Please consult your tax adviser with respect to the specific tax implications
Illustration : For investment period of more than 1 year
Tax benefit
For investments more than 1 year

• Aims to benefit from asset allocation & diversification
• Endeavors to take advantage of growth and stability at the same time
• Helps in leveraging on tax benefits even with moderate participation in pure equity
Benefits of investing in Axis Equity Saver Fund

Statutory Details and Risk Factors
Statutory Details: Axis Mutual Fund has been established as a Trust under the Indian Trusts Act, 1882, sponsored by Axis Bank Ltd. (liability
restricted to Rs. 1 Lakh). Trustee: Axis Mutual Fund Trustee Ltd. Investment Manager: Axis Asset Management Co. Ltd. (the AMC) Risk
Factors: Axis Bank Limited is not liable or responsible for any loss or shortfall resulting from the operation of the scheme.
This document represents the views of Axis Asset Management Co. Ltd. and must not be taken as the basis for an investment decision. This
document does not constitute advice to buy/sell any scheme of Axis Mutual Fund. Neither Axis Mutual Fund, Axis Mutual Fund Trustee Limited
nor Axis Asset Management Company Limited, its Directors or associates shall be liable for any damages including lost revenue or lost profits
that may arise from the use of the information contained herein. No representation or warranty is made as to the accuracy, completeness or
fairness of the information and opinions contained herein. The AMC reserves the right to make modifications and alterations to this statement
as may be required from time to time.
Please consult your tax adviser with respect to the specific tax implications
Data as on 31st May 2016
Mutual Fund Investments are subject to market risks, read all scheme related documents carefully.