aws re:invent 2016: effective application data analytics for modern applications( arc304)
TRANSCRIPT

© 2016, Amazon Web Services, Inc. or its Affiliates. All rights reserved.
Christian Beedgen, CTO, Sumo Logic
Ben Newton, Principal Product Manager, Sumo Logic
Ben Abrams, Lead DevOps Engineer, Cloud Cruiser
November 30, 2016
ARC304
Effective Data Analytics
for Modern Applications

What to Expect from the Session
Drivers for Data & Modern Applications
Designing a Data Analytics Strategy
Case Study: Cloud Cruiser
Q&A
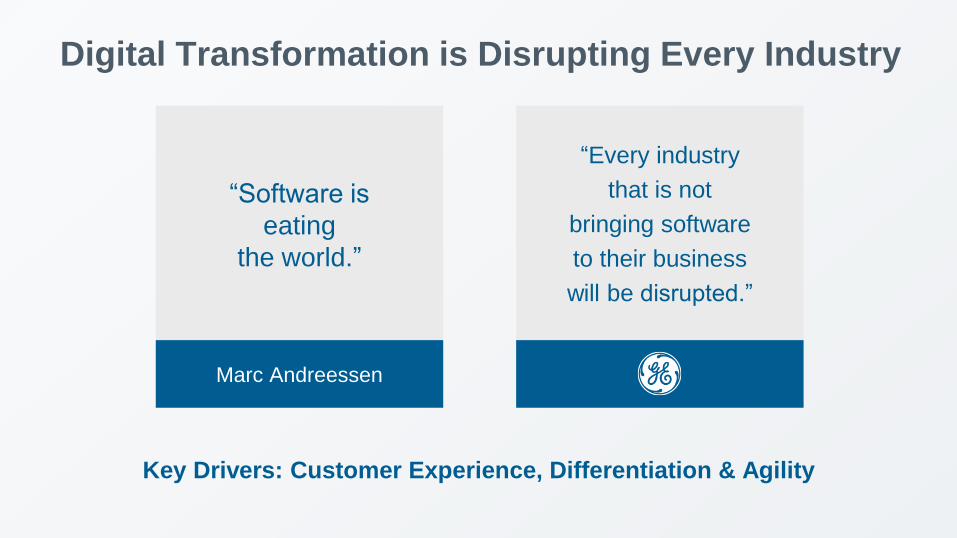
Key Drivers: Customer Experience, Differentiation & Agility
Digital Transformation is Disrupting Every Industry
“Software is
eating
the world.”
Marc Andreessen
“Every industry
that is not
bringing software
to their business
will be disrupted.”

Applications are being built differently

Teams are changing too
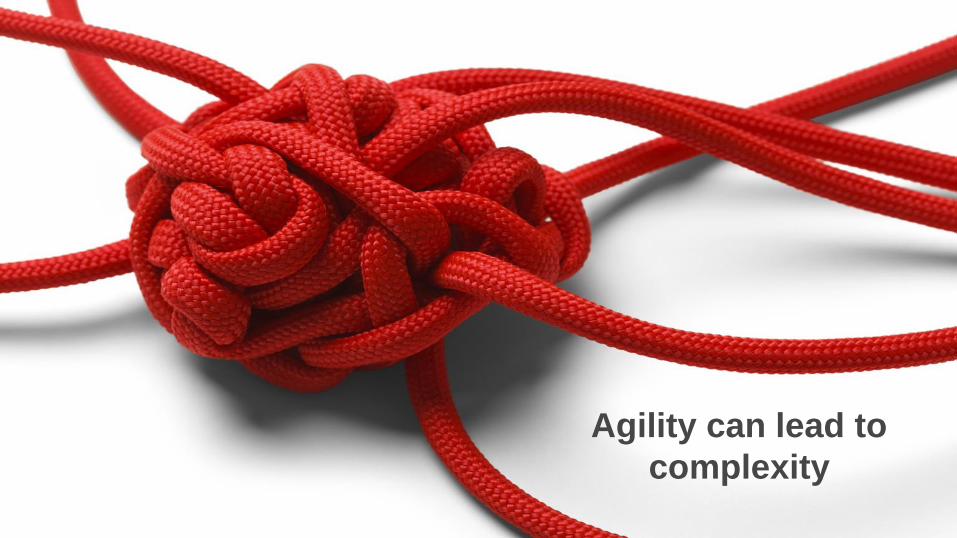
Agility can lead to
complexity

You can’t fix what
you can’t see

With Great Power Comes Great Responsibility
YOU ARE HERE
• CEO / Board / Shareholders
• Customers
• Partners
• Customer Success
• CSO / VP Security
• Product Management
App Log
App Monitoring
Infra Monitoring
Ad-hoc Tools
Cloud
Management
Infra Log
Security Tools
Compliance
Reporting
Dev Tools
Modern Application
OpsDevOps
LOBSecurity
Designing a Data Analytics Strategy

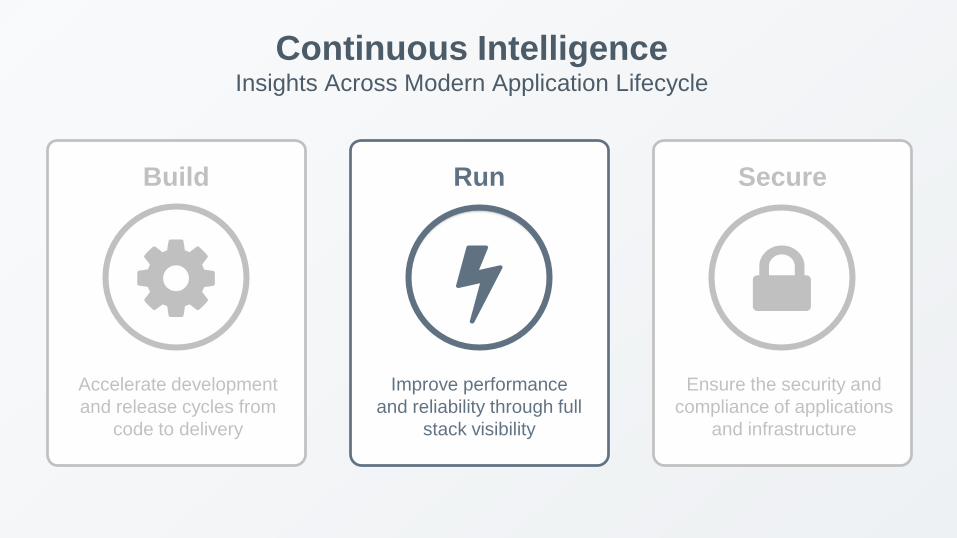
Continuous Intelligence Insights Across Modern Application Lifecycle
Build
Accelerate development
and release cycles from
code to delivery
Secure
Ensure the security and
compliance of applications
and infrastructure
Run
Improve performance
and reliability through full
stack visibility
Build
Accelerate development
and release cycles from
code to delivery
Secure
Ensure the security and
compliance of applications
and infrastructure
Run
Improve performance
and reliability through full
stack visibility
Continuous Intelligence Insights Across Modern Application Lifecycle

What Type of Activities Does
Your Data Support?
App IntelligenceTroubleshootingMonitoring
Detect Notify Identify Diagnose Restore Resolve Understand Improve Report
Run
Improve performance
and reliability through full
stack visibility

Who Cares About this Data?
Development /
EngineeringOps / DevOps
Development /
EngineeringOps / DevOps
Development /
Engineering
Product
Management
Customer
Success
Marketing /
SalesSupport
Stakeholders Stakeholders Stakeholders
Focus on User Visible Functionality
Monitoring
Focus on User Activity & Visibility
App Intelligence
Focus on End-to-End Visibility
Troubleshooting

Use Data to Solve Real Problems
What’s important to your
business? Can you measure
it?
Measure and monitor user
visible metrics
Build fewer, higher impact,
real-time monitors
You can’t fix what you
can’t measure
Comprehensive metrics
coverage is essential
Correlate metrics with
logs to reduce resolution
time
You can’t improve what you
can’t measure
You need both activity metrics
and detailed logs
Up to date data drives better
data-driven decisions
Focus on User Visible Functionality
Monitoring
Focus on User Activity & Visibility
App Intelligence
Focus on End-to-End Visibility
Troubleshooting


Data From all Parts of Your Stack
Infrastructure
Samples
Amazon
ECS
CPU, Memory, etc.
Process Metrics
System Logs/Events • Rollups vs. Detailed
• What resolution makes sense?
• Is real-time necessary?
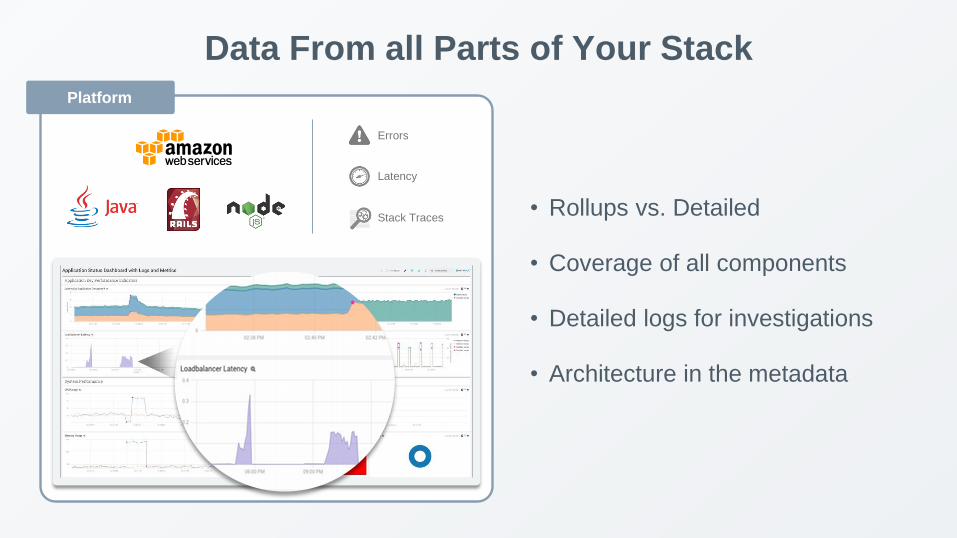
Data From all Parts of Your Stack
Platform
Samples
Errors
Latency
Stack Traces• Rollups vs. Detailed
• Coverage of all components
• Detailed logs for investigations
• Architecture in the metadata

Data From all Parts of Your Stack
Custom
Samples
User Activity
User Visits
Transactions
Elastic Load
Balancing
Amazon
DynamoDB
• How is your service measured?
• What frustrates users?
• How does the business measure
itself?
• The business in the metadata
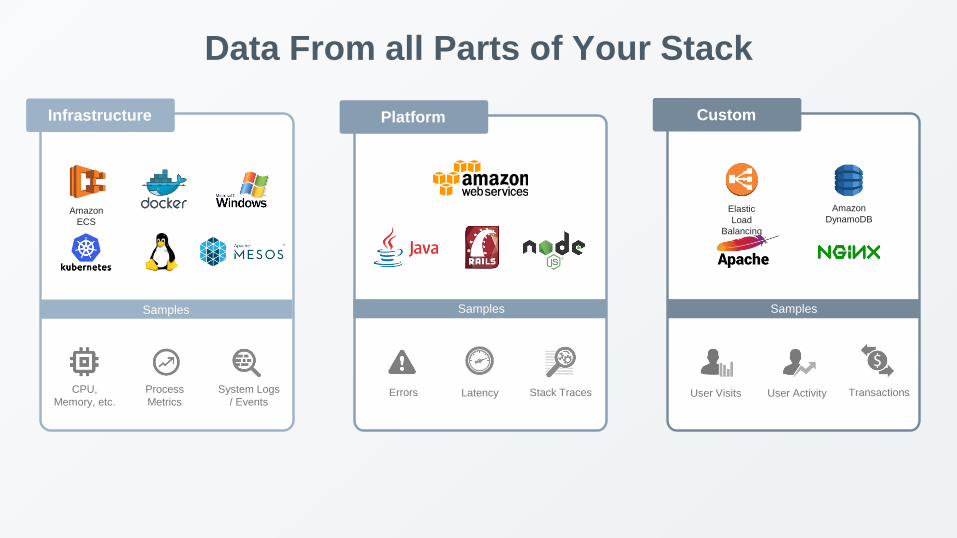
Data From all Parts of Your Stack
Infrastructure Platform Custom
Latency
Samples
Transactions
Samples
CPU,
Memory, etc.
Samples
Process
Metrics
System Logs
/ EventsErrors Stack Traces User Activity
Elastic
Load
Balancing
Amazon
DynamoDBAmazon
ECS
User Visits
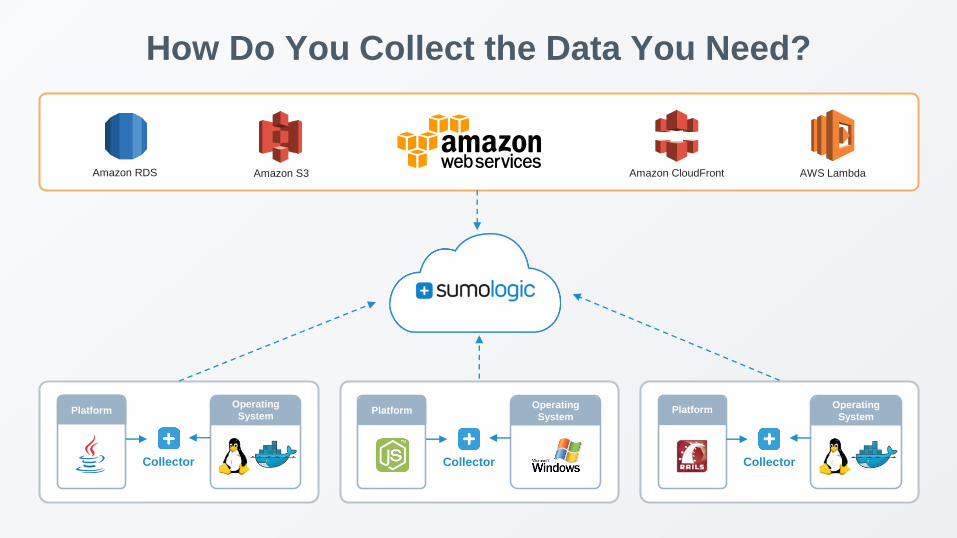
How Do You Collect the Data You Need?
PlatformOperating
System
Collector
PlatformOperating
System
Collector
PlatformOperating
System
Collector
Amazon RDS Amazon S3 AWS LambdaAmazon CloudFront

Use Data Analytics to Your Advantage
Measure and monitor what
matters to your users
Send notifications to incident
management platforms
(PagerDuty, VictorOps, etc.)
and/or Collaboration Tools
(Slack, etc.), rather than flood
your engineers with email
Late/Delayed Metrics mean
late/delayed resolution –
real-time matters
Tie your Playbook instructions
directly to the data (search this,
look at this, etc.)
Correlate performance (Metrics)
with what happened (Logs) to
resolve issues quickly
Use Metadata to make the data
reflect your view of the world, not
vice versa
Good user activity data will
improve your product and your
user experience
Keep long term trends of your
data to understand your progress
Focus on User Visible Functionality
Monitoring
Focus on User Activity & Visibility
App Intelligence
Focus on End-to-End Visibility
Troubleshooting

Case Study: Cloud Cruiser

© 2016 Cloud Cruiser | www.cloudcruiser.com© 2016 Cloud Cruiser | www.cloudcruiser.com
Meter and Manage Your Cloud Spend
Cloud Cruiser

Ben Abrams, Lead DevOps Engineer
Official Title:
Lead “DevOps” Engineer
Preferred Title:
“Supreme Unicorn Hunter of
Planet Earth and the Entire
Galaxy Besides”
“My team supports all aspects of Engineering
(Dev, QA, Ops, Sales, and Product). I like to
think of us as an Application Delivery Team.”
“We provide a SaaS app which enables you to easily
collect, meter, and understand your cloud spend in
AWS, Azure, and GCP.”
“Our customers are large enterprises and
mid-market players globally distributed
across all verticals.”
“Our SaaS app manages 100s of millions of cloud spend.”

Our Tech Stack
• Microservices written in Java
using dropwizard framework
• Angularjs + Tomcat (webapp)
• Elasticsearch
• DynamoDB
• ElastiCache (memcached)
• Blob Storage (s3)
• Quartz Scheduler (RDS)
• AWS (300-500 instances)
• Linux (ubuntu)
• Chef, Terraform, Packer
• Ruby
• Consul
• Nginx (reverse proxy)
• Elasticsearch + MongoDB
• Jenkins
• Sensu
InfrastructureApplication

Our Tech Stack
[1] All calls are required to be signed by the auth services (other than the login page).
User
NGINIX
Reverse Proxy
(priv-app subnet)
Consul
(service discovery)
(priv-util subnet)
ES APP
(priv-db subnet)
MongoDB
(priv-db subnet)
S3 - AWS Hosted
Amazon S3
DynamoDB - AWS Hosted
Amazon DynamoDB
Elasticache - AWS Hosted
Amazon ElastiCache
Public ELB (SSL)
(pub-elb subnet)
Elastic Load Balancing
SQS - AWS Hosted
Amazon SQS
RDS (MySQL) - AWS Hosted
Amazon RDS
Webapp + CC services [1]
(priv-app subnet)

Why We Came to Sumo Logic
• Had trust in Sumo Logics’ ability
to deliver – already a happy log
customer
• Prevent another tool being
managed/added
• Operational burden / distraction
• Security
• Scale + Cost
MetricsBurdens of ELK

• Reduced operational burden
• Reduced cost
• Increased confidence in log
integrity
• Was able to reduce the number
of people needing VPN
• Alerting based on searches did
not need ops handholding
(previously did with Sensu)
Value We Got from Sumo Logic
• Increased visibility in system and
application health
• Used in an ongoing effort with
application and infrastructure
changes in which we were able
to reduce our monthly AWS bill
by over 100%
MetricsLogs

The Rollout…
What are we using to get this?
• Chef: automation of config and collector install
• Application Graphite Metrics from Dropwizard
• Other graphite metrics forwarded by Sensu to Sumo Logic

Our Schema:_sourceCategory=$ENV/$LOG_TYP
E/$SERVER_ROLE
Breakdown:ENV: prod-west
LOG_TYPE: nginx_access
SERVER_ROLE: this corresponds
to a Chef role
Naming Conventions
Our Schema:_sourceCategory=$ENV/metrics/$METR
IC_TYPE/$METRIC_SOURCE
Breakdown:ENV: prod-west
METRIC_TYPE: graphite, statsd, host
METRIC_SOURCE: who sent the actual
metrics. This corresponds to a Chef
role. Remember to consider metric
forwarders.
MetricsLogs

31 © 2016 Cloud Cruiser | www.cloudcruiser.com31 © 2016 Cloud Cruiser | www.cloudcruiser.com
Deploying with Chef

Base Sumo Logic Config and Install
remote_file
"#{Chef::Config[:file_cache_path]}/sumocollector.deb" do
source node['sumologic']['collectorDEBUrl']
end
dpkg_package 'sumocollector' do
source
"#{Chef::Config[:file_cache_path]}/sumocollector.deb"
action :install
end
service 'collector' do
action [:enable, :start]
end
template node['sumologic']['sumo_conf_path'] do
cookbook node['sumologic']['conf_config_cookbook']
source conf_source
sensitive true
owner 'root'
group 'root'
mode '0600'
variables(accessID: credentials[:accessID],
accessKey: credentials[:accessKey])
notifies :restart, 'service[collector]', :delayed
end
directory node['sumologic']['sumo_json_path'] do
owner 'root'
group 'root'
mode '0755'
action :create
end
These are
from an
encrypted
data bag
(defined
elsewhere/
out of scope)
Don’t log
secrets!

Log Collector Setup
role = node.roles[0]
# syslog
syslog_excludes =
node['cc']['sumologic']['syslog']['filters']
sumo_source_local_file 'localfile-syslog' do
description 'Syslog'
source_json_directory node['sumologic']['sumo_json_path']
category "#{node.chef_environment}/syslog/#{role}"
path_expression '/var/log/syslog'
filters [
syslog_excludes['dhcp']
]
only_if { node['platform_family'].include? 'debian' }
end
# cc service logs
sumo_source_local_file 'localfile-microservice' do
description 'Microservice Log File'
source_json_directory node['sumologic']['sumo_json_path']
category "#{node.chef_environment}/microservice/#{role}"
path_expression '/var/log/cc/*/*.log'
multiline_processing_enabled true
use_autoline_matching false
manual_prefix_regexp '^[A-Z]+\s+\[\d{4}-\d{2}-
\d{2}\s+\d{2}:\d{2}:\d{2}\,\d{3}\].*'
only_if { node.roles.include? 'microservice_base' }
end

Metric Collector Setup
# host metrics
template
"#{node['sumologic']['sumo_json_path']}/systemstats-
default.json" do
source 'systemstats.json.erb'
action :create
notifies :restart, 'service[collector]', :delayed
variables(category:
"#{node.chef_environment}/metrics/systemstats/#{role}",
description: 'Host Metrics',
name: 'systemstats-default',
interval:
node['cc']['sumologic']['systemstats_frequency'])
end
# host metrics template
{
"api.version": "v1",
"source":
{
"name": "<%= @name %>",
"sourceType": "SystemStats",
<% if @category %>
"category": "<%= @category %>",
<% end %>
<% if @hostName %>
"hostName": "<%= @hostName %>",
<% end %>
<% if @description %>
"description": "<%= @description %>",
<% end %>
"interval": <%= @interval %>
}
}
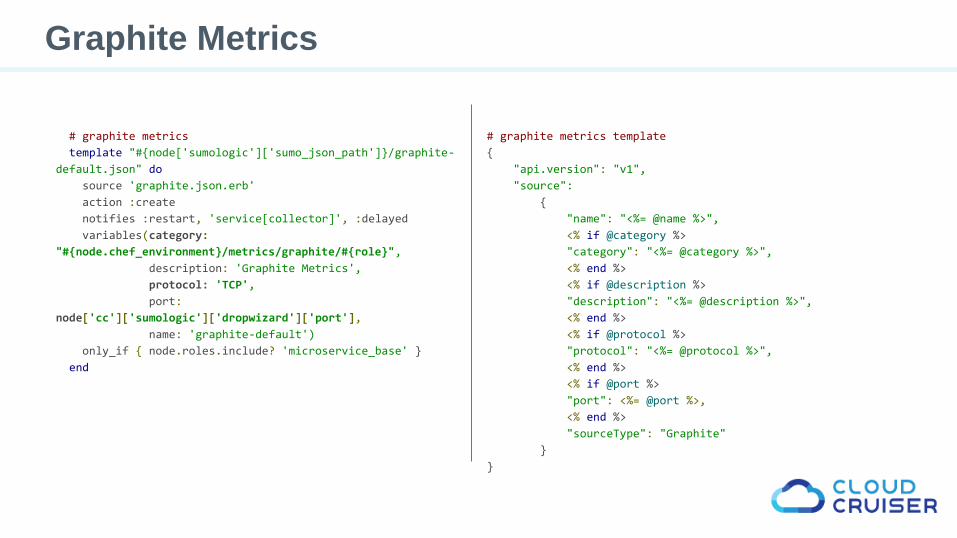
Graphite Metrics
# graphite metrics
template "#{node['sumologic']['sumo_json_path']}/graphite-
default.json" do
source 'graphite.json.erb'
action :create
notifies :restart, 'service[collector]', :delayed
variables(category:
"#{node.chef_environment}/metrics/graphite/#{role}",
description: 'Graphite Metrics',
protocol: 'TCP',
port:
node['cc']['sumologic']['dropwizard']['port'],
name: 'graphite-default')
only_if { node.roles.include? 'microservice_base' }
end
# graphite metrics template
{
"api.version": "v1",
"source":
{
"name": "<%= @name %>",
<% if @category %>
"category": "<%= @category %>",
<% end %>
<% if @description %>
"description": "<%= @description %>",
<% end %>
<% if @protocol %>
"protocol": "<%= @protocol %>",
<% end %>
<% if @port %>
"port": <%= @port %>,
<% end %>
"sourceType": "Graphite"
}
}

36 © 2016 Cloud Cruiser | www.cloudcruiser.com36 © 2016 Cloud Cruiser | www.cloudcruiser.com
Search Examples

Searching Logs
Query: _sourceCategory=_sourceCategory=prod-west/microservice/*
“Query timed out” | count by bravotenantid
Searching Logs
Query: _sourceCategory=_sourceCategory=prod-west/microservice/*
“Query timed out” | count by bravotenantid

Searching Logs
Query: _sourceCategory=_sourceCategory=prod-west/microservice/*
“Query timed out” | count by bravotenantid

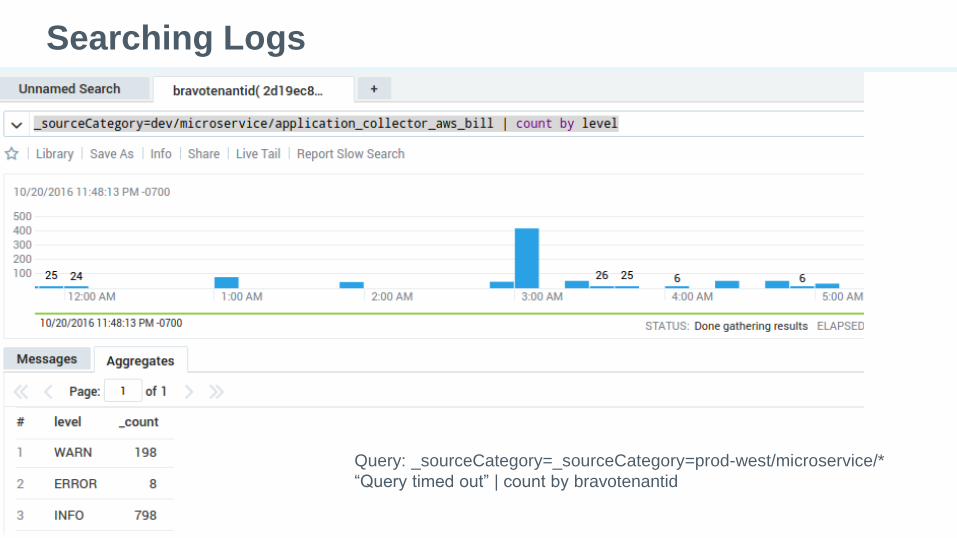
Searching Logs
Query:
_sourceCategory=_sourceCategory=dev/microservice/application_collector_
aws_bill | where bravotenantid = "SOME_TENANT_UID"

Searching Metrics
Query: _sourceCategory=prod-
west/metrics/systemstats/platform_analytics_datamanagement
metric=Mem_ActualFree

Searching Metrics
Query: _sourceCategory=prod-
west/metrics/graphite/platform_analytics_datamanagement _2=jvm
_3=memory _4=total
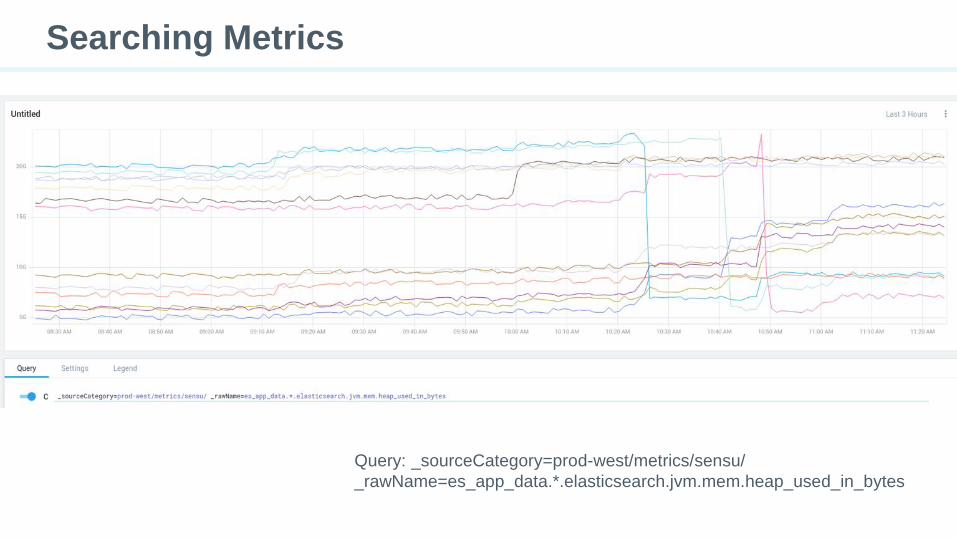
Searching Metrics
Query: _sourceCategory=prod-west/metrics/sensu/
_rawName=es_app_data.*.elasticsearch.jvm.mem.heap_used_in_bytes

44 © 2016 Cloud Cruiser | www.cloudcruiser.com44 © 2016 Cloud Cruiser | www.cloudcruiser.com
Dashboards for Metrics and Logs

Dashboards tell you what’s going on…
• Relevant data gives you bird’s-eye view
• Cut troubleshooting time
• Service-specific

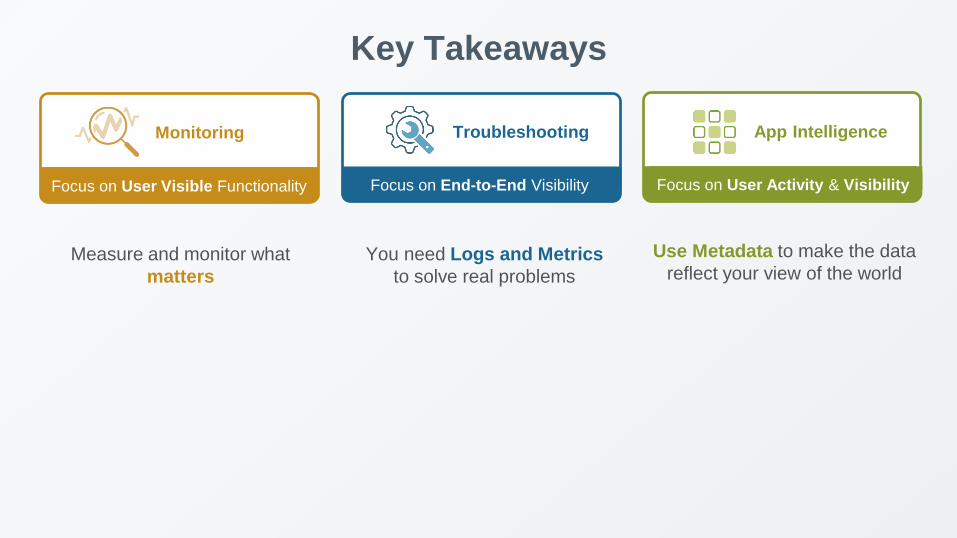
Key Takeaways
Measure and monitor what
matters
You need Logs and Metrics
to solve real problems
Use Metadata to make the data
reflect your view of the world
Focus on User Visible Functionality
Monitoring
Focus on User Activity & Visibility
App Intelligence
Focus on End-to-End Visibility
Troubleshooting

Thank you!
Come Visit Sumo Logic at Booth #604
Remember to complete
your evaluations!