avoiding the pitfalls of pharmacy pricing...understand the complexities of pharmacy pricing become...
TRANSCRIPT


Luke Johnson, PharmDClinical Pharmacy Director – Pharmastar PBM
Richard Mueller, PharmD, MS-PharmacoeconomicsPharmacy Director - Community Care Organization
Robert Tanner, MBA, MS-PharmacoeconomicsChief Operating Officer – Pharmastar PBM

Understand the complexities of pharmacy pricing
Become aware of the rapidly changing cost trends
Understand how to enhance current contracts to benefit PACE organizations


AWP – Average Wholesale Price
WAC – Wholesale Acquisition Price
MAC – Maximum Allowable Cost
FUL – Federal Upper Limit
NADAC – National Average Drug Acquisition Cost

Widely accepted benchmark price for drug payers◦ Readily available for payers and pharmacies◦ Medi-Span® is commonly used publisher of AWP◦ Redbook® and Gold Standard® also publish◦ Pharmacy contracting typically a percentage discount
of AWP
Despite it’s name it is not very representative of purchase price of the medications◦ Often compared to “sticker price” on a car◦ Usually related to a mark-up on WAC

Typically a number set by the manufacturer
Related to WAC - generally recognized multiplier for branded medications is AWP = WAC x1.20◦ Improper inflation related to AWP lead to a 2009
lawsuit that rolled back this multiplier from 1.25
This calculation generally does not hold true for multi-source generic medications

Brand medications◦ Still primary source of contracting◦ Since multiplier is generally understood this is a
reasonable benchmark to use◦ Consideration needs to be made on overall price
and pharmacy incentives
Generic medications◦ Although still used more payers are moving WAC
or MAC contracting ◦ Lack of consistency between AWP and WAC
pricing leaves room for pricing manipulation.

List price from manufacturer to wholesaler or direct purchaser, not accounting for discounts◦ Designed to more accurately depict the medication
cost◦ If AWP is the “sticker price” than WAC should be
viewed as the “invoice price”◦ Some medications do not have WAC pricing as they
are sold directly to pharmacies◦ Pharmacy contracting is typically a markup on WAC

Closer to Acquisition due to lack of artificial markup associated with AWP◦ 1.20 factor for brand name medications ◦ Typically significantly more markup and variability with generic
medications
However several rebating and discounting opportunities are not factored into WAC◦ Wholesalers offer discounts off WAC to pharmacies◦ Manufacturers offer direct up front and rebating opportunities
to pharmacies through wholesalers◦ Some pharmacies contract directly with manufacturers and
maintain there own warehouses (primarily generics)
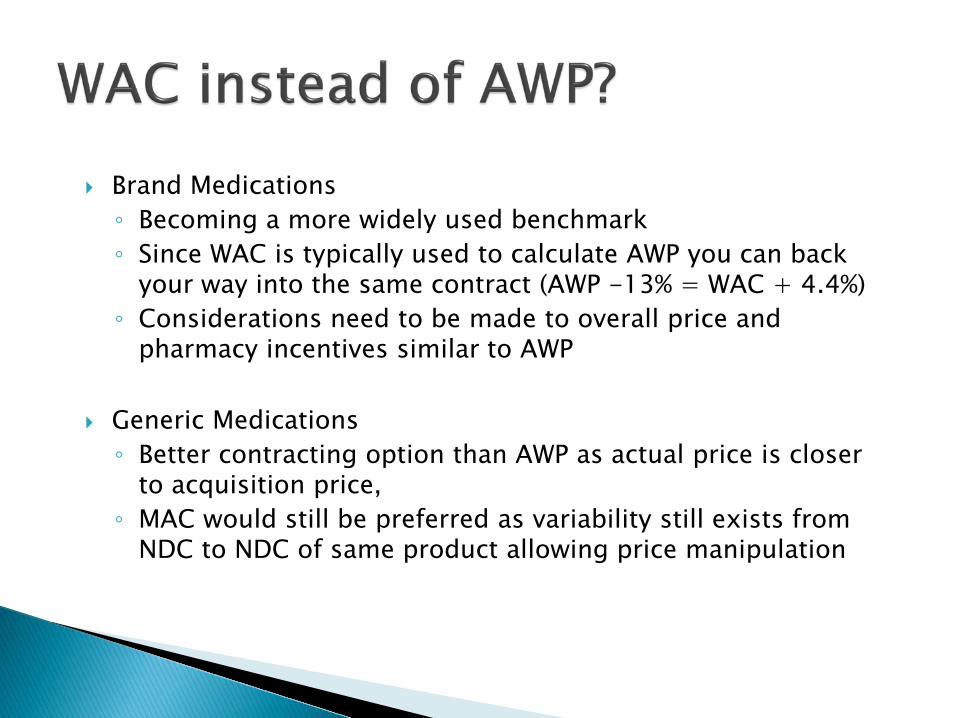
Brand Medications◦ Becoming a more widely used benchmark ◦ Since WAC is typically used to calculate AWP you can back
your way into the same contract (AWP -13% = WAC + 4.4%) ◦ Considerations need to be made to overall price and
pharmacy incentives similar to AWP
Generic Medications◦ Better contracting option than AWP as actual price is closer
to acquisition price, ◦ MAC would still be preferred as variability still exists from
NDC to NDC of same product allowing price manipulation

Reimbursement limit for a multi-source product of the same strength and dosage form◦ All NDCs of the same drug are reimbursed equally◦ Usually NDCs are grouped by GPI (generic product
indicator) or GSN (Generic Sequence Number)
Limit is determined by individual payers or States (Medicaid MAC)◦ State MAC lists are typically based on acquisition cost, but
should not exceed FUL (in aggregate)◦ Private MAC lists are created by PBMs/payers and are
typically based on multiple pricing benchmarks including AWP, WAC, and NADAC
Incentivizes pharmacies to order the lowest cost generics for their wholesaler
Provides price stability to a plan/payer due to different pricing for different NDCs based on WAC and AWP
Limits year over year inflation that can happen with AWP or WAC percentage contracts
Prevents price manipulation that occur when pharmacies can order “High AWP” generics at similar acquisition prices

No standard private sector definition◦ Created by the plan for the plan ◦ No standard development basis (AWP, WAC,
FUL)
Lists are typically proprietary◦ Transparency concerns for pharmacies◦ Addressed by generic effective rates or GER
(usually based on AWP)
Update maintenance is not well defined◦ Has become less of a concern with more recent
legislation addressing this issue.

List created and maintained by the federal government for use in State Medicaid programs
Used to determine upper limit for reimbursement for generic and other multi-sourced drugs
Although this list is created for use by State Medicaid Programs this list is available for public use

To be included the medication must be:◦ Multi-sourced with at least 3 “A-rated” therapeutically
equivalent product as defined by the FDA’s Orange Book◦ At least 3 suppliers of the medication be listed in the
national compendia
Pricing Calculated:◦ 175% of weighted average (based on utilization) of
Average Manufacturer Price (AMP)◦ If is determined that the calculated price is lower than
the average retail pharmacies’ acquisition cost based on surveys (NADAC)

Created in August of 2011 to represent the true acquisition costs to retail pharmacies
Price list created by having a private firm survey a sampling of independent and chain pharmacies invoice prices
List is maintained, updated, and published on weekly basis by CMS

More representative of actual acquisition cost
Used for brand and generic medications
Updated regularly and established by CMS
Can be used to prevent price games that are sometimes played with AWP and WAC
Aligns pharmacy purchasing incentives with plan goals

Not all medications are on the NADAC list
The sample size of the survey is small relative to the total number of pharmacies
Since this is an average big chain pharmacies still have a volume advantage over small independent pharmacies
If treated like a MAC list current dispensing fees would not support pharmacy labor costs

Applications to Specialty Pharmacy

Specialty medications accounted for 28.1% of the total drug spend for Medicare recipients in 2016
2016 Express Scripts Drug Trend Report

The specialty trend is growing much quicker than the traditional drug trend
2016 Express Scripts Drug Trend Report

Managing specialty drug cost trend is very important in plan design in the industry
2017 PBMI Research Report

High Cost
Treat a Chronic, Complex Condition
Requires Special Disease/Patient Monitoring
Requires Special Handling/Storage
Treat a Rare/Orphan Condition Requires special administration such as
injection or infusion

Most specialty medications are brand and thus are contracted based on AWP
Contract directly with specialty pharmacies ◦ Specialty pharmacies can offer deeper discounts◦ Can be challenging for PACE organizations due to Part
D regulations◦ This is the only way to manage limited distribution
specialty meds

Negotiate a deeper discount with traditional pharmacy for specialty medications
◦ Absolute dollar margin on specialty medications are much higher than traditional medications due to high cost of specialty
◦ Specialty medications are typically easier to dispense as they come as unit of use
◦ This would not be a good strategy for limited distribution as these are not available at traditional pharmacies

Drug Name AWP - 12% AWP -16% WAC Diff from WAC (12%)
Diff from WAC (16%)
Savings to PACE plan
Revlimid® 25mg $13,475.69 $12,863.16 $12,761.07 $714.62 $102.09 $612.53
Harvoni® $33,264.00 $31,752.00 $31,500.00 $1,764.00 $252.00 $1,512.00
Enbrel® 50mg Sureclick $4,690.75 $4,477.54 $4,442.00 $248.75 $35.54 $213.22
Humira® 40mg Pen $4,689.94 $4,476.76 $4,441.23 $248.71 $35.53 $213.18
Copaxone® 40mg $6,158.59 $5,878.66 $5,832.00 $326.59 $46.66 $279.94
*Price is based on a typical one month supply

Drug Name AWP - 12% WAC Diff From WAC (12%)
Lantus® Solostar (1box) $393.63 $372.76 $20.87
Spiriva® Handihaler $388.82 $368.20 $20.62
Advair® Diskus 250/50 $390.44 $361.40 $29.04
Januvia® 100mg $420.08 $397.80 $22.28
Xarelto® 10mg $409.75 $388.02 $21.73
*Price based on typical 1 month supply unless otherwise specified

Even with a 4% larger discount specialty medications still generate similar and reasonable dollar margins for pharmacies
Diff from WAC (12%)Top 5 Specialty
Diff from WAC (16%)Top 5 Specialty
Diff Form WAC (12%)Top 5 Traditional
$714.62 $102.09 $20.87
$1,764.00 $252.00 $20.62
$248.75 $35.54 $29.04
$248.71 $35.53 $22.28
$326.59 $46.66 $21.73

Who defines and maintains the specialty list?◦ PACE organization◦ Pharmacy ◦ Pharmacy benefits manager
How is the contract administered?◦ Most drugs for the purposes of contracting are
identified by brand vs. generic codes or multi-source codes
◦ Specialty list would typically have to be defined by generic product indicator (GPI), generic sequence number (GSN), or national drug code (NDC)

The Generic AWP Trap

AWP discounts are raising over time
Unlike branded drugs – there is NO relationship between the pharmacy’s cost for a multi sourced generic drug and AWP
The AWP on the same generic drug varies by manufacturer
A change from AWP-70% to AWP-75% is a 16.7% change in cost.

AWP rose by 10% and ironically – the discount rose by 10%.
If your plan has a locked in discount – you are eating the 10% AWP increase.
Year Average AWPPer Script
AverageDiscount
Average Paid Ingredient Cost
2015 $78.55 80.26% $15.51
2016 $80.25 80.92% $15.31
2017 $86.46 82.24% $15.36
MeridianRx retail claims data

Since AWPs are set by manufacturers each NDC may have a different AWP ◦ There are multiple manufacturers for most generic
medications and AWPs can vary widely◦ These different NDCs commonly cost the pharmacies
very similar prices
Misaligns incentives of providers and payers◦ Pharmacies can profit more using the higher AWP
versions of generics◦ Some manufacturers will set AWPs high to incentivize
the purchase of their product

DRUG LOW AWP HIGH AWP AVERAGE AWP
Omeprazole Cap 20mg 0.74500 4.44867 3.69309
VITAMIN D CAP 50000UNT 1.45640 1.97190 1.85833
FUROSEMIDE TAB 20MG 0.12278 0.17160 0.14004
FUROSEMIDE TAB 40MG 0.14030 0.20300 0.15979
AMLODIPINE TAB 10MG 2.37322 2.67333 2.37968
SIMVASTATIN TAB 20MG 3.69456 4.92098 4.91690
AMLODIPINE TAB 5MG 1.72222 1.90234 1.73392
CLOPIDOGREL TAB 75MG 4.36180 6.96114 6.92495
METOPROL TAR TAB 25MG 0.10780 0.27000 0.24654
GABAPENTIN CAP 300MG 1.32960 1.34180 1.33203
Pharmastar PACE Claims Data

DRUG LOW AWP HIGH AWP AVERAGE AWP
OMEPRAZOLE DR 20 MG CAPSULE 1.114 4.44864 4.16413
VIT D2 1.25 MG (50,000 UNIT) 0.7194 2.03 1.84948
FUROSEMIDE 20 MG TABLET 0.1167 0.429 0.18825
AMLODIPINE BESYLATE 10 MG TAB 0.1153 2.67333 2.37952
FUROSEMIDE 40 MG TABLET 0.1333 0.5868 0.2179
AMLODIPINE BESYLATE 5 MG TAB 1.6429 1.94778 1.7372
ATORVASTATIN 40 MG TABLET 0.8573 10.69833 5.7776
GABAPENTIN 300 MG CAPSULE 0.18 1.3418 1.32004
PANTOPRAZOLE SOD DR 40 MG TAB 0.434 5.26714 4.67895
CLOPIDOGREL 75 MG TABLET 0.4123 6.96114 6.94138
Pharmastar PACE Claims Data

Looking at the discount is misleading
Small changes in discounts result in big changes in cost◦ Going from paying .25 on the dollar to .24 is
a 4% reduction in cost

Stated discount favors the pharmacy◦ The discount can be gamed◦ Doesn’t align price incentives◦ Discounts are rising
MAC lists can be scary to pharmacies◦ Pharmacies have less control◦ MAC lists maintained by PBM and confidential◦ Some PBMs not responsive to market changes

If you don’t use a PBM there are still things that can be done
◦ Don’t lock in rates over years
◦ Use a MAC list established by the your state’s Medicaid program if available
◦ Set a MAC for your most widely used generics based on NADAC prices
◦ Consider paying a higher dispensing fee to move to a cost-based model for ingredient cost

Wrap Up AndFuture Directions

AWP and WAC are reasonable benchmarks for brand name medications
◦ If using AWP a discount off AWP should be used, for PACE organizations a reasonable discount would be in the low teens (-12% to -13%)
◦ If using WAC typically would be a few percentage point over WAC, for PACE organization a reasonable mark-up would be (+3% or 4%)
◦ The rate that is reasonable is subject to change

Considerations of absolute price should be made for high cost specialty medications
◦ Most specialty meds are discounts off AWP as they are brand
◦ Even a few percentage points difference can save the plan a considerable amount and still pay pharmacies a fair amount.
◦ AWP – 15% or 16% would be a reasonable amount for a PACE organization to pay at a traditional pharmacy

MAC lists are preferred for generic medications
◦ Prevents some of the price manipulation that can occur with AWP and WAC
◦ PBM typically would maintain these lists
◦ If no PBM involved you could specify a specific state MAC list to be used by the pharmacy
◦ If MAC is not an option than WAC would typically be more reasonable than AWP, discounting a few points (-3 or -4%) off WAC for generics

Should represent something closer to a trueacquisition cost◦ Critics argue that only a small sample of pharmacies
respond to the survey◦ Since it is an average, higher volume pharmacies
still have an advantage
Would reduce percentage effect that leads to huge absolute dollar mark-ups on specialty medications

Could be viewed as publically available MAC list created by CMS
◦ Would likely require significantly higher dispensing fees (cost+ model)
◦ Can be used for both brands and generic medications
◦ This is being considered to be used by Medicaid for pricing

Review Pharmacy Contracting
◦ Avoiding locking in long-term contract rates
◦ When using percentage-based contracting take absolute dollar amounts in consideration
◦ Avoid AWP contracting for generic medications
◦ Remain aware of where the industry is moving

Questions?

ReferencesAcademy of Managed Care Pharmacy. AMCP Guide to Pharmaceutical
Payment Methods, 2013 Update (Version 3.0). JMCP Supplement. Apr 2013.
Academy of Managed Care Pharmacy. What is the Price Benchmark to Replace Average Wholesale Price (AWP)? . JMCP Supplement. Sept 2010. Vol. 16, No. 7
Elsevier/Gold Standard. Drug Price Types and Options for a Future Standard, https://www.elsevier.com/__data/assets/pdf_file/0006/139911/Drug-Price-Types-and-Options-for-a-Future-Standard-PAC.pdfAccessed 6 Sept 2017.
Centers for Medicare and Medicaid Services. Affordable Care Act Federal Upper Limit Methodology and Data Elements Guide, 24 Feb 2016, https://www.medicaid.gov/medicaid-chip-program-information/by-topics/prescription-drugs/true-up/xxxxxdraft-true-up-methodology.pdf. Accessed 6 Sept 2017

ReferencesDepartment of Health and Human Services. Medicaid Drug Pricing in
State Maximum Allowable Cost Programs, Aug 2018 https://oig.hhs.gov/oei/reports/oei-03-11-00640.pdf. Accessed 7 Sept 2017.
Centers for Medicare and Medicaid Services. Methodology for Calculating the National Average Drug Acquisition Cost (NADAC) for Medicaid Covered Outpatient Drugs, Nov 2013, https://www.medicaid.gov/medicaid-chip-program-information/by-topics/prescription-drugs/ful-nadac-downloads/nadacmethodology.pdf. Accessed 7 September 2017.
Express Scripts. 2016 Drug Trend Report, Feb 2017, http://lab.express-scripts.com/lab/drug-trend-report. Accessed 7 Sept 2017.
2017 Trends in Specialty Drug Benefits [PDF]. (2017). Plano, TX: Pharmacy Benefit Management Institute.

ReferencesNational Association of Specialty Pharmacy. NASP Definitions of
Specialty Medications, 24 Feb 2016, http://naspnet.org/wp-content/uploads/2017/02/NASP-Defintions-final-2.16.pdf. Accessed 7 Sept 2017.
Centers for Medicare and Medicaid Services. Announcement of Calendar Year (CY) 2017 Medicare Capitation Rates and Medicare Advantage and Part D Payment Policies and Final Call Letter, 4 Apr 2016, https://www.cms.gov/Medicare/Health-Plans/MedicareAdvtgSpecRateStats/Downloads/Announcement2017.pdf. Accessed 7 Sept 2017.