avoiding a fiscal/demographic/economic debacle in japan
TRANSCRIPT

- 299 -
11 Avoiding a Fiscal/Demographic/Economic Debacle in Japan
Laurence J. Kotlikoff1
11.1 Introduction
Japan is the now the oldest country in the world and getting older by the day. Currently there
are almost 3 Japanese of working age per Japanese oldster. By 2040, this ratio will be 1 to
1. The graying of Japan reflects fertility and mortality rates that, demographically speaking,
are hard to believe. In 1950 Japan’s fertility rate was 2.7. It’s now just 1.3. In comparison,
today’s U.S. rate is 2.1. Japanese life expectancy at birth is currently 81 years – the highest of
any country in the world and a full 5 years higher than that of the U.S. In the early 50s, the
U.S. had a 5-year lead over Japan in the race to live the longest. But since then U.S. life
expectancy increased by just 7 years, while Japanese life expectancy rose by 17 years. By
mid century Japanese life expectancy is projected to reach 84. At that point Americans will
be just starting to achieve current Japanese longevity.
Even, as some hope, the Japanese fertility rate gradually rises through 2050 to a value of
2.1 — the level needed for population replacement, Japan’s population at the end of the
century will number half of what it numbers today. This is harakiri on a national scale.
Japan isn’t the only country that’s aging. Every developed country in the world is getting
very old very fast. And each is facing the challenge of paying high and growing pension and
DMSDR1S-#2734743-v5-x_ Chapter 11_ Kotolikoff_ Avoiding a Fiscal_Demographic_Economic Debacle in Japan1.DOC April 6, 2006 (5:48 PM)

- 300 -
health care benefits to a tidal wave of old people who seem motivated by one and only one
thing – self interest.
Paying the Japanese elderly their pension and medical benefits already takes a fifth of
Japanese national income. By 2025 it will take a third. On average, Japanese retired couples
are currently collecting $20,000 in pension benefits. This is fairly close to the U.S. level even
though Japan’s per capital GDP is a quarter smaller.
For every dollar the Japanese government now pays in pension benefits, it pays 58 cents in
health care benefits and 14 cents in long-term care benefits. In the course of two decades, the
Japanese will be paying 69 cents in health care benefits per dollar spent on pensions and
22 cents in long-term care benefits. Thus health care benefits per beneficiary are expected to
grow much more rapidly than pension benefits per beneficiary. More importantly, they are
expected to grow much more rapidly than the average wages of the workers paying these
benefits.
11.2 A Cross Country Perspective
Table 11.1, taken from Hagist and Kotlikoff (2005), examines the growth in Japanese,
German, and U.S. government health expenditures over the period 1970 to 2002. In
preparing this table we assumed that the relative profiles of health care spending by age
observed in the last three years in the three countries prevailed in the past. The Japanese
profile comes from Fukawa and Izumida (2004), the German profile from Fetzer and

- 301 -
Raffelhüschen (2005), and the U.S. profile from data reported by the Centers for Medicaid
and Medicare Services (2003). Using these profiles, historic age-specific population counts,
and historic government health care expenditure totals, reported in OECD (2004), we were
able to calculate absolute real health care expenditures by age in each year from 1970 to
2002.2 These derived data permit us, in turn, to compare growth over this period across the
three countries in health care expenditures per recipient at a given age.
Table 11.1: Average Annual Growth Rates in Real Health Expenditures per Recipient
and Real GDP Per Capita, 1970–2002
Country Real Health Expenditures Per
Recipient at a Given Age
Real Health
Expenditures
Per Capita
Real GDP
Per Capita
Relative Growth of
Health Expenditures
Germany 2.82 3.12 1.63 1.9
Japan 3.07 4.56 2.16 2.1
United States 4.24 4.91 1.89 2.6
Source: Christian Hagist and Laurence J. Kotlikoff, “Who’s Going Broke? Ris ing Heal th Care Costs
in Ten OECD Countr ies ,” mimeo, Boston Universi ty, June 2005.
As Table 11.1 indicates, between 1970 and 2002, Japanese real health expenditures per
recipient at a given age grew, on average, by over 3 percent per year. This is below the U.S.
rate of 4.24, but still very high. Moreover, thanks to the aging of the Japanese population and
the fact that the elderly are more expensive than the young, real health expenditures per
capita rose each year at any average rate of 4.56 percent. Since Japan’s real per capita income
grew annually at only 2.16 percent over the period, the growth rate of health expenditures per

- 302 -
capita exceeded that of per capita GDP by a factor of 2.1. This is below the U.S. ratio of
2.6, but above the German ratio of 1.9.
11.3 What to Do?
Clearly, neither Japan, Germany, nor the U.S. can let government health expenditures grow
indefinitely at a faster rate than their economies grow. As the late, great economist
Herb Stein used to say, “If something can’t go on forever, it will stop.” This is surely true.
But it’s also the case that something that can’t go on forever can stop too late. In this context,
stopping too late means limiting the growth of health care benefits per capita to that of GDP
per capita only after benefits per capita have reached an unaffordable level. Yes, the growth
in real health care benefits per capita can, in principle, always be cut in the future so that after
rising faster than per capita income, benefits start rising more slowly. But, in practice, cutting
benefit growth to this extent may not be feasible unless and until there is a major financial
crisis that provides politicians with the political cover to make radical changes.
Stated differently, the most that may be possible in the absence of a crisis is to eventually
stabilize government health expenditures as a share of GDP below the maximum share that is
sustainable and affordable. But if this limit is, say, 10 percent of GDP, and the government
allows the spending share to reach 11 percent, a crisis must result. This crisis is not only
inevitable, it’s also immediate, because if financial markets see a sure meltdown coming,
they’ll melt down today as everyone runs for the proverbial door. Hence, current
governments need to be aware that they are playing with fire in allowing excessive growth in

- 303 -
health care benefits. And the danger of a conflagration is not thirty or ten or 5 years off in the
future, it’s right now.
In this regard, Table 11.2 compares the present value costs of projected health expenditures
in the three countries assuming, optimistically, that real health care expenditure per capita
growth rates over the next twenty years equal what we observed from 1970 through 2002 and
then decline over the following 30 years to equal the rate of growth of per capita GDP.
Table 11.2: Projected Future Health Spending as Percent of Projected Future GDP
Discount Rate
Country r=3% r=5% r=7%
Germany 12.5 11.7 11.1
Japan 10.5 9.7 9.1
US 12.7 11.0 9.9
Source: Christian Hagist and Laurence J. Kotlikoff, “Who’s going broke? Rising Heal th Care Costs
in Ten OECD Countr ies ,” mimeo, Boston Universi ty, June 2005.
At a 3 percent real discount rate, the U.S. has the highest present value projected cost
measured relative to the projected present value of GDP. At 5 and 7 percent discount rate,
Germany comes out on top. While Japan wins this competition, its third worst showing is
nothing to brag about. Assuming a 3 percent discount rate, the Japanese government is,

- 304 -
roughly speaking, projected to spend 10.5 percent of every yen the country produces from
now till the end of time on health care. Relative to the present situation, this represents an
almost 60 percent increase in the share of the economy going to government health care
spending.
Of course high and growing health care expenditures are only one component of Japan’s
fiscal problem. To understand the overall picture, one needs to do a comprehensive fiscal gap
analysis or, even better, generational accounting. Unfortunately, one needs to go back to
1999 to find such an analysis. In that year, Takayama and Kitamura (1999) conducted a
generational accounting study for Japan through the Bank of Japan at which
Professor Kitamura was then employed. Their analysis was included in Generational
Accounting Around the World, a cross-country comparison of generational accounts.
While an updated generational accounting analysis is badly needed to understand the
magnitude of the overall fiscal burden being left to current young and future Japanese, the
1999 results are worth considering. They showed three things. First, although Japan’s
workers earned at that time roughly a quarter less than their American counterparts, their
absolute lifetime net tax burden was 70 percent higher. Second, future Japanese faced net
taxes over their lifetimes that were 2.7 times higher than those confronting current workers.
And third, this intergenerational imbalance in Japanese fiscal policy was very much larger
than that in the U.S., Germany, and almost all other developed countries.

- 305 -
Indeed, according to the study, Japan needed to cut federal and provincial government
purchases of goods and services on everything from elementary school education to the
Prime Minister’s salary immediately and permanently by 26 percent to insulate future
Japanese from higher lifetime net tax rates. The corresponding spending cuts for the U.S. and
Germany were 19 percent and 21 percent, respectively.
The study led by Takayama and Kitamura offered two other equally unpleasant means for
achieving generational balance. The first was immediately and permanently raising income
taxes by 54 percent. The second was immediately and permanently cutting all pension
benefits, welfare benefits, health care benefits, unemployment benefits, disability benefits,
and other government transfers by 29 percent.
Japan did not adopt any of these particular options in 1999 suggesting that it faces an even
larger generational imbalance today. But this doesn’t take into account the fact that Japan has
made other policy changes since 1999. In 2000, for example, the government enacted
legislation that promises to gradually cut social security benefits by one fifth. The
government has also considered cutting public works projects and raising various taxes.
Although the Japanese government is taking its long-term fiscal problems seriously, the real
question is whether it is taking them seriously enough. Cutting pension benefits in the long-
term by one fifth is a far cry from immediately and permanently cutting all transfer payments
by 29 percent. And the latest government projections show aggregate pension, health care,
and other social security costs rising from 22.5 percent of GDP now to 32.5 percent in 2025.

- 306 -
To be fair, the ruling coalition parties have also recently enacted a gradual 35 percent
increase in the current employer plus employee 13.58 percentage-point payroll tax rate that
finances state pensions, which will leave the rate at 18.3 percent. This tax hike, coupled with
the aforementioned benefit cuts, represents a significant response to the nation’s
fiscal/demographic crisis. However, both the benefit cut and the tax hike are geared to hit
middle aged, young, and future workers the hardest, leaving older baby boomers as well as
all of the currently elderly off the hook with respect to dealing with the pension system’s
long-term financing problem. This raises concerns about generational equity as well as the
willingness of young and middle age workers to pay these much higher payroll taxes, which
now will provide them with claims to much lower future benefits.
11.4 Can Immigration Help?
Japan currently has a relatively low immigration policy under which only about a quarter of a
million new immigrants enter the country each year. Could Japan alleviate its demographic
and fiscal problems by bringing in more immigrants? The answer that I and two co-authors
(Fehr, Jokisch, and Kotlikoff, 2004) reach using a detailed life-cycle dynamic simulation
model is no. The reason is that immigrants aren’t free. They require public goods and
services, and they also demand the same transfer payments as the indigenous population. On
balance, additional immigrants would likely cost the Japanese fiscal authorities almost as
much as they would generate in additional revenues.

- 307 -
11.5 How About Technology-Driven Higher Productivity Growth?
Another supposed elixir to cure a country’s demographic woes is higher productivity growth
driven by improved technology. The first thing to say is that a country can’t snap its fingers
and generate more advanced technology. It can try to develop more advanced technology by
investing in more R&D, but this costs money and may not pay off.
The second thing to say is that if the generation of new technology is done by private-sector
inventors, they won’t be giving it away for free. Instead, they extract rents for its use, which
means that firms renting the new technology may have little wherewithal, after they’ve paid
the license fees, to pay their workers higher real wages.
The third thing to say is that if real wages rise, pension and health care benefit levels will
likely rise as well, which will limit the potential for technological improvements to reduce
payroll and other tax rates. Hence, higher productivity may simply mean higher benefit
levels. This is certainly the historical story. Japan has experienced dramatic productivity
growth in the postwar period, but its pension benefits have, from what I understand, been
raised to maintain a roughly 60 percent replacement rate of benefits to pre-retirement wages.
And health care benefits have, in recent years, grown at roughly twice the rate of
productivity. So while higher productivity growth occasioned by technological advances
would definitely afford Japan the opportunity to outgrow some of its pension and health care
obligations, whether Japan would actually opt to do that is not clear.

- 308 -
11.6 Can Japan’s Economy Alleviate its Fiscal Problems?
The other way to raise real wages, apart from acquiring, but not having to fully pay for, new
technology, is to experience capital deepening. In Fehr, Jokisch, and Kotlikoff (2005), we
explore the issue of capital deepening in the aforementioned dynamic life-cycle simulation
model modified to include not just Japan, the U.S., and the EU, but also China. We added
China to the model to explore Jeremy Siegel’s (2005) prediction that China and other
developing countries will, over time, become major suppliers of capital to the developed
world.
China certainly has a very high current saving rate, namely 33.3 percent of national income.
In contrast, the Japanese, U.S., and EU national saving rates are currently running at
8.0 percent, 2.3 percent, and 8.7 percent, respectively. The Chinese private sector appears to
be saving 40.0 percent of private available output, defined as net national income minus
government purchases of goods and services. This extraordinarily high Chinese saving rate
explains why the Chinese are currently exporting more capital to the rest of the world than
they are importing.
But China has a long way to go if it is to become the developed world’s principal saver and,
potentially, saviour. China’s per capita income and wealth levels are currently only a small
fraction – probably less than 15 percent – of the developed world’s levels. Of course, China
has lots of “capita” – its population is 2.6 times the population of the U.S., Japanese, and EU,
combined. Still, its total holdings of wealth appear to be less than one quarter and could

- 309 -
easily be less than a tenth one of total wealth holdings across the four regions. Moreover,
Chinese saving behaviour may change. As living standards rise, the Chinese may begin
consuming like citizens of developed countries.
The fact that China, like Japan and the West, is aging and faces significant fiscal obligations
associated with that process suggests that China’s inclusion in our model would make little
difference to its prediction of a small capital shortage. But because of China’s much higher
rates of growth and saving and because its population is so large, adding China can generate
a capital glut. Whether or not this occurs depends on how China’s fiscal policy and saving
behaviour evolve. If, over the course of the next 25 years, China adopts fiscal arrangements
and saving propensities that are similar to those of the U.S., capital per unit of human capital
will end up roughly where it is today leaving real Japanese wages per unit of human capital
at the end of this century only 4 percent higher than they are today. (Note that the model
includes technological change in worker efficiency, so that this 4 percent wage increase is
above and beyond the increase arising from technological change).
If, on the other hand, China limits growth in public expenditures and the Chinese people
continue to eschew consumption, China will save enough for its own capital needs as well as
those of the developed world, leaving Japanese real wages per unit of human capital at the
end of this century end up 63 percent higher than they are today!
The usefulness of these findings depends, of course, on the realism of our model. Our life-
cycle model includes age-, region-, and year-specific fertility and mortality rates, lifespan

- 310 -
uncertainty, age-, region-, and year-specific pension, disability, health care, and other
government transfer policies, region- and year-specific government purchases of goods and
services, region-specific levels of debt, high, middle, and low earners within each cohort in
each region, region-specific personal wage, capital income, corporate income, and payroll
taxes, international capital mobility, technological change, quadratic costs of adjusting each
region’s capital stock, age-specific inheritances, age-specific and unintended bequests,
intertemporally separable CES utility functions in consumption and leisure, region-specific
Cobb-Douglas production functions, the presence of children’s utility in parents’ utility
functions when the children are young, exogenously specified age-, earnings class-, region-,
and year-specific immigration, and region- and cohort-specific time preference rates.
As with our other three regions, we set the time preference rate in calibrating each region’s
saving behaviour. And we’ve calibrated the multifactor productivity coefficient in the
Chinese production function to match the current observed Chinese relative wage. The big
questions with respect to China’s calibration, however, are not how to treat current saving
preferences and technology, but rather how to model future saving preferences and
technology.
Consider first the issue of technology. It seems reasonable to believe that the level of Chinese
technology will converge to that of the west. The unknown is the rate of convergence. We
assume in our study that the Chinese multifactor productivity coefficient rises gradually,
reaching the U.S., Japanese, and EU rates by mid century.

- 311 -
Now consider modelling future Chinese saving behaviour. Here we examine two alternative
assumptions. The first is that the Chinese time preference rate remains fixed through time at
the very low rate needed to calibrate the current Chinese saving rate. The second is that
successive cohorts of Chinese gradually adopt western saving behaviour such that the
Chinese born in 2050 and thereafter have the same time preference rate as Americans in
2004.
Table 11.3 shows that the model’s demographics match up quite well with those predicted by
the UN. Table 11.4 shows how well the model’s calibration does in matching up
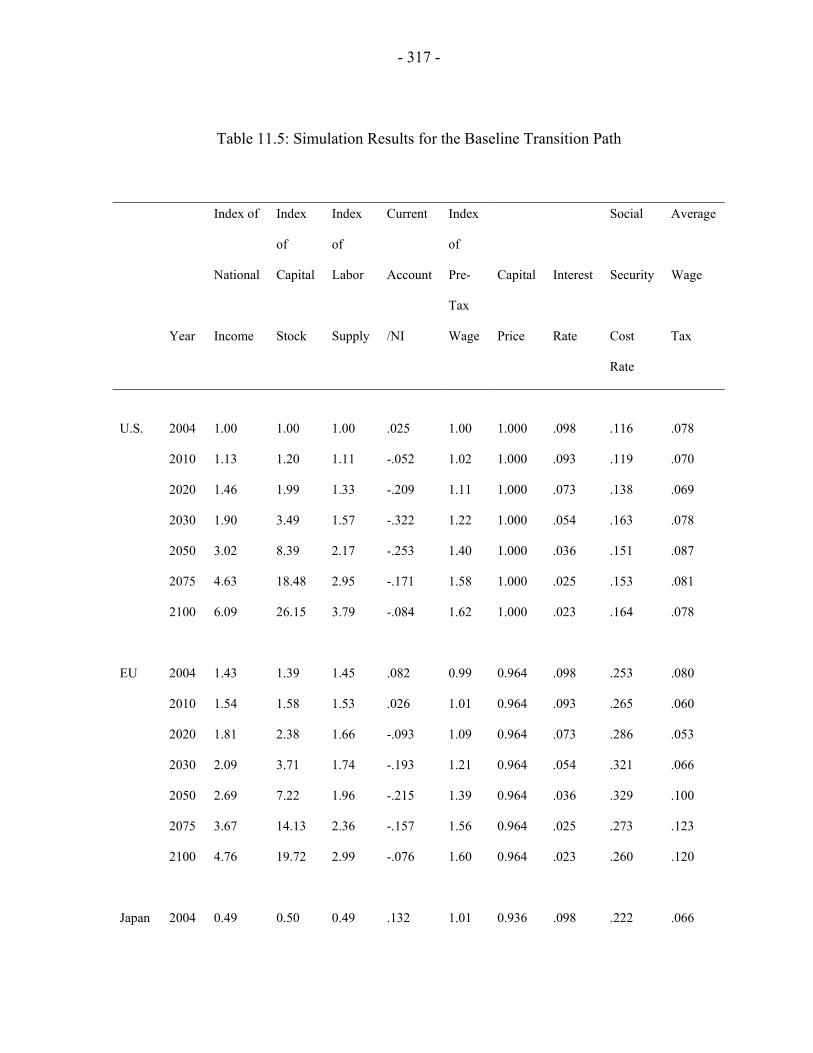
macroeconomic and fiscal variables for 2004 relative to actual 2004 data. Table 11.5 presents
the baseline simulation in which Chinese saving behaviour remains unchanged through time.
And Table 11.6 shows the same simulation when the Chinese time preference rate is raised
over the next 25 years for each successive cohort until it reaches the U.S. value. A
comparison of the two simulations indicate that if China maintains its current saving
behaviour it will dramatically raise real wages in the developed world over the long run. It
will also significantly mitigate payroll and other tax increases. For example, the Japanese
pension benefit cost for 2040 is 40.3 percent of wages if China becomes a U.S.-type saver,
but 34.4 percent if it remains a high saver. The 2100 cost rate differences are even larger –
25.8 percent if China continues saving like crazy and 35.7 percent if it stops saving.
So China is in a position to materially help the developed world by continuing to save, but
even if it does the cost pressures on Japan, the U.S., and the EU from their pensions and
health care systems will be very great.

- 312 -
Table 11.3: Comparing Actual and Simulated Population Projections
Population Projection U.S.
Year 2000 2010 2020 2030 2040 2050 2100
Total Population1
Model 276.2 307.3 340.0 366.4 385.8 400.3 442.0
Official2 285.0 314.9 344.3 370.4 391.4 408.7 -
Age Structure3
<15 Model 21.6 20.1 19.7 18.5 18.2 17.8 15.9
Official2 21.8 20.5 20.0 19.3 18.5 17.9 -
15-64 Model 66.2 67.2 64.0 61.4 61.7 62.1 60.7
Official2 65.9 66.6 64.1 61.5 61.7 62.1 -
65-90 Model 12.2 12.7 16.3 20.1 20.2 20.1 23.3
Official2 12.3 12.8 15.9 19.2 19.8 20.0 -
Population Projection EU
Year 2000 2010 2020 2030 2040 2050 2100
Total Population1
Model 376.4 385.8 390.9 391.1 384.1 372.1 340.6
Official2 377.3 383.2 384.4 382.8 377.8 369.8 -

- 313 -
Age Structure3
<15 Model 16.9 15.3 14.5 14.3 14.3 14.8 16.5
Official2 16.7 15.3 14.4 14.4 14.7 15.0 -
15-64 Model 66.9 66.9 64.7 60.8 57.7 57.2 59.7
Official2 66.9 66.5 64.7 60.8 57.5 56.7 -
65-90 Model 16.2 17.8 20.8 24.9 28.0 28.0 23.9
Official2 16.3 18.2 21.0 24.7 27.8 28.3 -
Population Projection Japan
Year 2000 2010 2020 2030 2040 2050 2100
Total Population1
Model 126.7 128.9 127.1 121.8 114.2 108.8 84.8
Official2 127.0 128.0 125.6 121.0 115.7 109.7 -
Age Structure3
<15 Model 14.6 13.4 12.5 11.9 12.5 12.9 16.0
Official2 14.6 13.6 12.4 11.8 12.6 13.0 -
15-64 Model 68.2 64.1 59.2 58.1 55.0 52.1 56.3
Official2 68.2 64.0 59.5 57.8 53.0 50.4 -
65-90 Model 17.2 22.5 28.2 30.0 32.5 35.0 27.7
Official2 17.2 22.4 28.1 30.4 34.4 36.5 -

- 314 -
Population Projection China
Year 2000 2010 2020 2030 2040 2050 2100
Total Population1
Model 1273.1 1360.7 1455.0 1490.7 1481.3 1430.8 1181.8
Official4 1274.0 1354.5 1423.9 1446.5 1433.4 1392.3 -
Age Structure3
<15 Model 24.6 19.5 18.3 16.5 15.6 16.3 18.5
Official4 24.8 19.5 18.4 16.9 15.6 15.7 -
15-64 Model 68.6 73.3 70.6 67.8 63.1 61.6 61.7
Official4 68.4 72.2 69.7 66.8 62.1 60.7 -
65-90 Model 6.8 7.2 11.1 15.7 21.3 22.0 19.8
Official4 6.8 8.3 11.9 16.3 22.3 23.6 -
1 in millions
2 United Nations Population Division (2003): World Population Prospects: The 2002 Revision, Medium Variant
Projections
3 in percent of total population
4 United Nations Population Division (2005): World Population Prospects: The 2004 Revision, Medium Variant
Projections

- 315 -
Table 11.4: The Year 2004 of the Baseline Patha
Model Official
U.S. EU Japan China U.S. EU Japan China
National Income
Private consumption 79.9 65.1 70.9 51.3 79.3 67.3 69.3 49.4
Government purchases of goods
and services
18.7 31.0 22.0 17.8 17.4 24.3 21.7 17.6
General public expenditures 10.9 19.3 12.4 13.7
Aggregate education outlays 5.9 6.0 4.4 2.1 5.9 6.0 4.3 2.1
Aggregate health benefits 1.9 5.7 5.2 2.0 2.5 6.2 6.8 2.0
Current account 2.5 8.2 13.2 -15.4 -4.6 -1.2 3.0 1.9
Government Indicators
Social contributions received 8.1 16.4 13.9 7.2 7.9 16.6 13.4
Aggregate pension benefits 5.3 9.2 7.6 5.2 5.7 11.6 10.8 3.0
Aggregate health benefits 1.9 5.7 5.2 2.0 2.5 6.2 6.8 2.0
Aggregate disability benefits 0.9 1.5 1.1 - 0.9 - - -
Pension contribution rateb 7.7 14.2 12.1 8.0 10.6 - 17.3 11.0
Health-care contribution rateb 2.5 8.8 8.3 3.1 2.9 - 8.5 8.0
Disability-insurance contribution
rateb
1.4 2.3 1.8 - 1.9 - - -
Interest payment on public debt 3.3 3.8 4.1 1.0 3.0 3.5 3.7 0.8
Tax revenues 20.4 30.3 21.9 15.8 20.6 31.0 19.1 14.8

- 316 -
Direct taxes 12.2 14.9 11.5 5.5 12.5 15.1 8.9 2.8
Personal income taxes 9.2 10.5 7.6 5.5 9.5 10.7 4.7 0.7
Wage taxes 5.7 5.9 4.9 5.5 - - - -
Capital taxes 3.5 4.6 2.7 0.0 - - - -
Corporate income taxes 3.0 4.4 3.9 0.0 3.0 4.4 4.2 2.1
Indirect taxes 8.2 15.4 10.4 10.3 8.1 15.9 10.2 12.0
Wage tax ratesb
Average 7.8 8.0 6.6 7.3 - - - -
Marginal 14.2 13.9 11.9 9.1 - - - -
Consumption tax ratesb 10.2 23.6 14.7 20.0
Capital-income tax ratesb 11.0 14.0 8.0 0.0
Corporate tax ratesb 12.0 18.0 16.0 0.0
Capital-output ratio 2.2 2.2 2.3 2.5 - - - -
Capital-labor ratio 3.0 2.8 3.1 0.5 - - - -
Interest rateb 9.8 9.8 9.8 9.8 - - - -
a in percent of national income if not stated differently.
b in percent
- 317 -
Table 11.5: Simulation Results for the Baseline Transition Path
Index of Index
of
Index
of
Current Index
of
Social Average
National Capital Labor Account Pre-
Tax
Capital Interest Security Wage
Year Income Stock Supply /NI Wage Price Rate Cost
Rate
Tax
U.S. 2004 1.00 1.00 1.00 .025 1.00 1.000 .098 .116 .078
2010 1.13 1.20 1.11 -.052 1.02 1.000 .093 .119 .070
2020 1.46 1.99 1.33 -.209 1.11 1.000 .073 .138 .069
2030 1.90 3.49 1.57 -.322 1.22 1.000 .054 .163 .078
2050 3.02 8.39 2.17 -.253 1.40 1.000 .036 .151 .087
2075 4.63 18.48 2.95 -.171 1.58 1.000 .025 .153 .081
2100 6.09 26.15 3.79 -.084 1.62 1.000 .023 .164 .078
EU 2004 1.43 1.39 1.45 .082 0.99 0.964 .098 .253 .080
2010 1.54 1.58 1.53 .026 1.01 0.964 .093 .265 .060
2020 1.81 2.38 1.66 -.093 1.09 0.964 .073 .286 .053
2030 2.09 3.71 1.74 -.193 1.21 0.964 .054 .321 .066
2050 2.69 7.22 1.96 -.215 1.39 0.964 .036 .329 .100
2075 3.67 14.13 2.36 -.157 1.56 0.964 .025 .273 .123
2100 4.76 19.72 2.99 -.076 1.60 0.964 .023 .260 .120
Japan 2004 0.49 0.50 0.49 .132 1.01 0.936 .098 .222 .066

- 318 -
2010 0.49 0.54 0.49 .069 1.03 0.936 .093 .260 .044
2020 0.54 0.75 0.49 -.105 1.11 0.936 .073 .313 .030
2030 0.63 1.18 0.52 -.193 1.23 0.936 .054 .317 .042
2050 0.72 2.03 0.51 -.194 1.41 0.936 .036 .344 .056
2075 0.90 3.65 0.57 -.130 1.59 0.936 .025 .288 .072
2100 1.10 4.83 0.68 -.055 1.63 0.936 .023 .258 .069
China 2004 1.33 1.53 8.96 -.154 0.15 1.000 .098 .111 .073
2010 2.33 2.82 9.92 -.006 0.24 1.000 .093 .082 .092
2020 4.56 7.06 10.78 .117 0.43 1.000 .073 .080 .094
2030 7.01 14.61 10.38 .163 0.68 1.000 .054 .100 .086
2050 12.13 38.26 9.28 .122 1.32 1.000 .036 .149 .063
2075 14.81 67.20 9.05 .100 1.65 1.000 .025 .224 .013
2100 17.68 86.29 10.54 .053 1.69 1.000 .023 .259 -.011

- 319 -
Table 11.6: Simulation Results From Raising China’s Time Preference Rate
in China Over 25 Years to Match the U.S. Rate
Index of Index
of
Index
of
Current Index
of
Social Average
National Capital Labor Account Pre-
Tax
Capital Interest Security Wage
Year Income Stock Supply /NI Wage Price Rate Cost
Rate
Tax
U.S. 2004 1.00 1.00 1.00 .029 1.00 1.000 .098 .116 .078
2010 1.13 1.19 1.11 -.038 1.02 1.000 .093 .119 .070
2020 1.47 1.91 1.35 -.143 1.09 1.000 .075 .138 .069
2030 1.88 3.03 1.62 -.168 1.17 1.000 .061 .164 .078
2050 2.63 4.09 2.28 .054 1.16 1.000 .063 .171 .093
2075 3.28 4.02 3.08 .037 1.07 1.000 .080 .209 .080
2100 4.10 4.64 3.95 .016 1.04 1.000 .087 .230 .068
EU 2004 1.42 1.38 1.45 .084 0.99 0.964 .098 .253 .080
2010 1.53 1.56 1.53 .033 1.00 0.964 .093 .265 .060
2020 1.79 2.26 1.67 -.051 1.08 0.964 .075 .287 .051
2030 2.03 3.16 1.76 -.082 1.16 0.964 .061 .329 .058
2050 2.27 3.42 2.00 .031 1.14 0.964 .063 .381 .071
2075 2.56 3.04 2.43 .015 1.06 0.964 .080 .381 .079
2100 3.18 3.48 3.11 .019 1.03 0.964 .087 .367 .074

- 320 -
Japan 2004 0.48 0.50 0.48 .132 1.01 0.936 .098 .222 .066
2010 0.49 0.53 0.48 .073 1.02 0.936 .093 .261 .044
2020 0.54 0.72 0.49 -.064 1.10 0.936 .075 .315 .029
2030 0.60 1.00 0.52 -.084 1.18 0.936 .061 .328 .034
2050 0.60 0.96 0.52 .051 1.16 0.936 .063 .403 .030
2075 0.62 0.78 0.58 .020 1.08 0.936 .080 .393 .041
2100 0.74 0.85 0.71 .052 1.05 0.936 .087 .357 .048
China 2004 1.33 1.52 8.90 -.160 0.15 1.000 .098 .111 .071
2010 2.29 2.75 9.77 -.019 0.24 1.000 .093 .082 .088
2020 4.23 6.28 10.13 .079 0.42 1.000 .075 .085 .076
2030 5.82 10.67 8.99 .092 0.65 1.000 .061 .115 .043
2050 8.50 15.07 7.87 -.028 1.09 1.000 .063 .189 -.015
2075 9.55 13.35 8.62 -.018 1.12 1.000 .080 .269 -.002
2100 11.28 14.56 10.46 -.015 1.09 1.000 .087 .277 .019
11.7 Making Money to Make Money
Absent major tax hikes or benefit cuts or a Chinese saving salvation, the government will be
forced to print money to “pay” its bills. This would likely kick off inflation, if not
hyperinflation. But if the government is eventually going to have to do this, it should start
now when inflation is negative. Specifically, the Bank of Japan should dramatically increase
its purchase of government bonds and continue to the point that none remain in the hands of
the public. The Bank has been moving in this direction in recent years by increasing base

- 321 -
money by upwards of 30 percent on an annual basis. But it should move even more rapidly.
By eliminating outstanding government debt, the government will eliminate its need to
service that debt in the future when it will face higher pension and health care obligations.
There is no magical free lunch here. When the government prints money and spends it, it
generates a real seignorage tax on the public. This tax comes in the form of a reduction in the
purchasing power of the public’s holdings of existing money due to a rise in prices. In
addition, if the government has outstanding nominal government liabilities, which the
Japanese government has in spades, the increase in the price level reduces the real purchasing
power of that debt, thereby delivering a real capital loss to the public and a real capital gain
to the government.
The current circumstances in Japan in which prices are falling doesn’t change the ways in
which Japan’s government can make money by making money. It just makes it harder for the
public to perceive. And that fact should, from the government’s perspective, be considered a
good thing. No government likes to advertise the fact that it is taxing the public. In this case,
the seignorage and capital gains taxes are very subtle. They arise by having prices fall by less
than would otherwise be the case. Stated differently, were the Bank of Japan not printing
money in the quantities that it is now printing money, prices would, presumably, be falling a
lot more rapidly than is currently the case. And because of that, the public would be enjoying
larger real capital gains on its money holdings and government bonds. But with the
significant money creation that’s now going on, the public is experiencing smaller capital
gains on these assets and that, in fact, is the form in which it is being taxed. While

- 322 -
economists can appreciate this, no one in the public will complain that prices are falling by
less than they should have fallen. Hence, the government is in the unusual position to being
able to make money by making money without anyone really noticing it.
Of course, there is a danger that injecting so much base money into the economy will lead to
very rapid price increases, if not hyperinflation. All this depends on the extent to which the
banking system lends out these new base money injections. In recent years, the banking
system hasn’t lent out the additional base money that ends up coming to it in the form of
deposits. Instead, it has accumulated very large excess reserves. Stated differently, the
banking system has operated with a very low money multiplier.
But what happens if the banking system decides overnight to eliminate its excess reserves?
In this case, the money multiplier will shoot up and there will be a major expansion in the
money supply. This, in turn, could trigger major price rises. The plus side of kicking off such
a process is that it would reduce the real value of outstanding nominal government liabilities.
The downside is that it would unleash inflationary expectations that become embedded in
high nominal interest rates, which, in turn spells high real interest rates. Brazil provides an
example of this problem. Its current nominal rates are roughly 20 percent, while its inflation
rate is roughly 10 percent, leaving its real rate at 10 percent.
My recommendation here is to dramatically raise required reserves to limit the banking
system’s ability to dramatically expand the money multiplier. This, of course, places a tax on
the banking system insofar as the rate at which they can lend reserves is positive. But rates

- 323 -
are now so low, that this tax on reserves would be very small. Indeed, it might not be much
noticed. By raising required reserves, the Bank of Japan would be able to proceed to
monetize large amounts of the government’s fiscal liabilities without fear of losing control of
the money supply and the level of inflation.
There is a limit to how far one can go with this policy of monetizing the nation’s debt.
Japan’s net debt appears to be about 80 percent of GDP, but its monetary base is only about
20 percent of GDP. So retiring all the net debt would require increasing the monetary base by
a factor of 5. This could easily unleash hyperinflation. But buying back much more debt than
is currently occurring is surely a good idea. Indeed, I would continue to print money and buy
back debt until it generates a moderate inflation, of say 5 percent per year. Running inflation
at this or, indeed, any rate would certainly help Japan with its fiscal liabilities, none of which
seem to be formally indexed for inflation. In particular, the government can use inflation to
effect a decline in the real value of pension benefits as well as the salaries of government
workers. Over time, the real fiscal savings from this would add up. Moreover, this process
would make up for the involuntary rise in real pension benefits, government worker salaries,
etc. that has arisen as a result of the nation’s ongoing deflation.
Much of what I’ve said here does, of course, run afoul of the goal of central bank
independence and the proposition that a central bank’s sole raison d’etre is to achieve and
maintain low inflation. “Central bank independence” is a nice sounding term, but it’s a
luxury that Japan can no longer afford. The fact is that monetary policy is in large part a form

- 324 -
of fiscal policy and that, in a crisis, the government needs to use all its fiscal tools to survive,
including its ability to monetize the debt.
11.8 Pension Benefit Reform
At the same time the Bank of Japan retires the country’s debt, the Japanese Ministry of
Finance (MOF) should proceed to close down the existing pay-as-you-go pension system at
the margin by promising retirees and current workers to pay all their accrued benefits in
retirement, but nothing more. This policy would dramatically reduce future benefit payments
relative to what is now projected. And rather than raise the payroll tax rate, the government
should be able to leave the rate where it is.
As the same time the MOF retires the old pension system, it should introduce the Personal
Security System or PSS and force workers to contribute 7 percent of their wages to personal
security accounts. While these accounts would be private property, all account balances
would be invested by the MOF in a global market-weighted index fund of stocks, bonds, and
real estate securities. This would ensure that all contributors, in a given year, are invested in
the same portfolio and earn the same rate of return. To achieve social solidarity, the
government would provide matching contributions to the accounts of low-wage workers and
contribute on behalf of the unemployed and disabled. Non-working spouses would be
protected by splitting account contributions equally between spouses so that each has the
same size account. The government would oversee all the accounts, provide annual reports,
and invest all assets in the global index fund.

- 325 -
The government would also be charged with very gradually selling off workers’ account
balances as they approached retirement and converting the proceeds into inflation-protected
pensions. Finally, the government would guarantee that all PSS participants receive a
cumulative non-negative real rate return on their account balances as determined by the
amount of their account balances at each point that they are being annuitized.
The PSS represents, in effect, a modern version of a social security system. Were Count
Bismark alive today, he might well be proposing the PSS. Unlike the traditional Bismarkian
defined benefit pensions, the PSS entails private property and makes use of the market. There
are individual accounts and individual ownership of those accounts. If a participant dies, his
or her account balance would be bequeathable. But unlike standard individual investment
accounts, the PSS account owners would have no discretion over how the account balances
are invested. They would be forced to hold the market and, thereby, be prevented from trying
to time or otherwise beat the market.
This may seem to limit individual economic freedom, but the key purpose of any government
retirement saving system is not just to force people to save, but to force them to save in a way
that doesn’t leave the government on the hook to support them in old age.
The PSS is completely transparent. What one puts into the accounts, what one has
accumulated at any point in time, and what one can expect to get back would be clearly
detailed in annual PSS statements. The PSS is progressive thanks to the government’s

- 326 -
matching contributions. It also protects dependents, the disabled, and unemployed. The PSS
puts the public into the world’s financial market at low cost and with downside protection.
Finally, the PSS pools longevity and inflation risk by having the government convert the
global index account balances into inflation indexed bonds. This conversion from a mixed
portfolio to an inflation-indexed annuity, in effect, moves PSS participants at retirement out
of the global stock market and into a completely safe asset – inflation indexed annuities,
which the government would back with inflation-indexed bonds. These inflation indexed
bonds would be purchased by the government using the proceeds it receives from selling off
participants’ PSS balances at retirement. The government would hold these bonds in reserve,
selling them off over time as need be to meet its outflow of annuity payments.
To summarize, the PSS combines the best features of traditional defined benefit (DB)
pensions and those of modern defined contribution (DC) retirement accounts. Unlike DB
plans there is no complex benefit formula that can make contributing to a DB plan feel like
paying a tax. But unlike DC plans, there is downside protection against the market
performing poorly. The PSS plan also makes clear that government pension reform need not
be constrained by existing institutions. Yes, there is an obligation to pay accrued liabilities,
but one can do that by shutting down the old system at the margin and simultaneously
establishing a modern social security system.

- 327 -
11.9 Health Care Reform
The Ministry of Health, Labor, and Welfare also has a job to do to ensure that the
government doesn’t accrue health care expenditure obligations in excess of what is
affordable. However, in order to limit what the government must pay, the Ministry needs, in
my view, to radically reform the Japanese health care system by establishing what I call the
Medical Security System (MSS). Here’s how the MSS would work.
In October of each year, the MSS would provide each Japanese citizen with an individual-
specific voucher to be used to purchase health insurance for the following calendar year. The
size of the voucher would depend on the recipients’ expected health expenditures over the
calendar year. Thus, a 45 year-old with colon cancer would receive a very large voucher,
while a healthy 75 year-old would receive a much small voucher. The MSS would have
access to all medical records concerning each Japanese citizen and set the voucher level each
year based on that information.
The vouchers would pay for basic in- and out-patient medical care as well as for prescription
medications over the course of the year. If one ended up costing the insurance company more
than the amount of his voucher, the insurance company would make up the difference. If one
ended up costing the company less than the voucher, the company would pocket the
difference. Insurers would be free to market additional services at additional costs. MSS
would promote healthy competition in the insurance market, which would go a long way to
restraining health care costs.

- 328 -
The beauty of this plan is that all Japanese would receive health care coverage and that the
government could limit its total voucher expenditure to what the nation could afford. Unlike
the current state-run system under which the government appears to have little effective
control over the bills it receives or the payments it makes, MSS would explicitly limit the
government’s liability at the margin. The plan is also progressive. The poor, who are more
prone to illness than the rich, would receive larger vouchers, on average, than the rich.
Would the collection of data needed to price out the MSS vouchers as well as the sharing of
that information with insurers represent an invasion of privacy? Not really. The government
is currently paying for the health care of the population, so it already has access to most, if
not all, of the information that it would use to price the vouchers. Since the government has
what I take to be a perfect tract record on maintaining the confidentiality of its medical
treatment and diagnoses of the Japanese population, one can expect it will treat MSS data
with equal care. As for insurance companies who would be able to review MSS participant
medical records prior to signing up them up, one needs to bear in mind that private insurers
would otherwise be collecting this information from potential clients. The big difference here
is that potential customers will not face a financial penalty for disclosing, via the
government, their medical status. The reason, to repeat, is that the size of the voucher will be
set in proportion to the individual’s expected medical costs. Thus the MSS plan effectively
eliminates the problem of adverse selection in the private health insurance market by a)
providing the information that insurers seek and b) compensating the insured for having bad
information.

- 329 -
11.10 Tax Reform
A final reform that Japan could and should undertake is to replace its current income and
payroll taxes with a national retail sales tax. The beauty of the sales tax is that it’s
transparent, straightforward to collect, represents a tax on wealth as well as a tax on all
wages, and adds some generational equity to a course of Japanese policy that seems to be
forcing middle age, young, and future workers to absorb all of the cost of the demographic
transition.
Compared to the current system of taxation, the retail sales tax places a bigger burden on the
elderly because the elderly own a disproportionately large share of the nation’s wealth. And
when that wealth is spent on consumption, a portion of it must be spent on taxes.
How about the poor? Well the poor, be they old or young, could easily be insulated from the
sales tax by also enacting a rebate. The rebate would be provided to each household based on
its composition (numbers of adults and children) and be large enough to ensure that the poor
pay no sales tax on net.
11.11 Conclusion
All indicators suggest that Japan is in very bad fiscal shape. But thanks to its current
deflation, Japan has the opportunity to repurchase large quantities of its debt and thereby
eliminate this major fiscal obligation. Japan also has the opportunity to fix its pension system

- 330 -
by eliminating any future pension accrual under the old system and by making workers
contribute to Personal Security Accounts. Finally, Japan can adopt the Medical Security
System to regain control of its health care expenditures and introduce intergenerational
equity and transparency to its tax system by replacing its income and payroll taxes with a
federal retail sales tax. Each of these proposals is radical, but it’s time for radical, but
sensible, moves in Japan.
Failure to act will surely lead to a financial meltdown sometime in the near future in which
investors in Japanese bonds dump them as they realize that printing money is the
government’s only way of meeting its myriad and colossal obligations. At that point, nominal
and real interest rates will soar and the Bank of Japan will, in any case, be forced to buy up
the bonds to lower rates. So the financial markets will ultimately engender what I’m
proposing be done. But if the financial markets force this policy on the Bank of Japan, they
will do so under much less desirable circumstances than exist now.

- 331 -
References
Auerbach, Alan J. and Philip Oreopolous, 1999, “Generational Accounting and Immigration
in the United State,” NBER working paper no. 7041, (March)
Centers for Medicare and Medicaid Services (2003), Office of Information Services: Data
from the Medicare Decision Support Access Facility; data development by the Office
of Research, Development and Information.
Fehr, Hans, Sabine Jokisch, and Laurence J. Kotlikoff, 2004, “The Role of Immigration in
Dealing with the Developed World’s Demographic Transition,” FinanzArchiv.
Ferguson, Niall and Laurence J. Kotlikoff, 2005, “A New New Deal,” The New Republic,
(forthcoming).
Fetzer, S. und B. Raffelhüschen ,2005, Zur Wiederbelebung des Generationenvertrags in der
Gesetzlichen Krankenversicherung – Die Freiburger Agenda, Perspektiven der
Wirtschaftspolitik (forthcoming).
Fukawa, T. and N. Izumida ,2004, Japanese Health care Expenditures in a Comparative
Context, The Japanese Journal of Social Security Policy, 3 (2), 51-61.
Gokhale, Jagadeesh and Kent Smetters, 2005, “Measuring Social Security’s Financial
Problems,” NBER working paper no. 11060.

- 332 -
Hagist, Christian and Laurence J. Kotlikoff, 2005, “Who’s going broke? Rising Health
Care Costs in Ten OECD Countries,” Boston University,.(mimeo)
Kotlikoff, Laurence J., 2003, Generational Policy -- The 2002 Caroli Lectures, Cambridge,
MA: MIT Press.
OECD, 2004a, Health Data 2004, 3rd edition, Paris.
Takayama, Noriuki and Yukinobu Kitamura, 1999, “Generational Accounting in Japan,” in
Generational Accounting Around the World, Alan J. Auerbach, Laurence J. Kotlikoff,
and Willi Leibfritz, eds., Chicago, Ill: University of Chicago Press.

- 333 -
Endnotes
1 Professor of Economics, Boston University, Research Associate, The National Bureau of
Economic Research
2 Past and projected population counts were taken from the websites of the national statistic
offices or census bureaus of the analyzed countries as well as the websites of Eurostat and the
Population Division of the UN.