avo and constrained sparse spike inversion for reservoir ...modelling (frm) and avo synthetic...
TRANSCRIPT

INTEG, GEOPIC, ONGC, KDMIPE Campus, Kaulagarh Road, Dehradun.
10th Biennial International Conference & Exposition
P 059
AVO and Constrained Sparse Spike Inversion for reservoir
characterization of an area in Mahanadi Offshore Basin
Binode Chetia*, Puja Prakash, P.K Chaudhuri, A.K. Tandon
Summary
AVO and inversion techniques became very popular in the oil industry in recent days. Although AVO technique can be used
for direct detection of hydrocarbon, however it suffered from ambiguities caused by lithology effects, tuning effects and
overburden effects. Seismic inversion is the process of transforming seismic reflection into a quantitative rock-property
description of a reservoir. Apart from general interpretation, these studies are done to extract additional information from
seismic data.
The present study area is from Mahanadi offshore basin. Over twenty wells have been drilled under exploration activity but
commercial success has remained elusive till now. Majority of drilled wells have evidence of gaseous hydrocarbon
accumulation in thin sands. In most of the gas bearing wells drilled so far thin sands are found to be hydrocarbon bearing
while thick ones are brine sands. The aim of this study is to look for the probable locale of larger hydrocarbon bearing sands,
if any within Mio-Plio sequence of the study area.
Keywords: Inversion, Mahanadi Offshore
Introduction
The importance of seismic inversion and AVO techniques
has been growing steadily over the last few decades. These
studies when integrated with conventional interpretation
are essential to add value to hydrocarbon exploration and
development projects. Inversion and AVO studies are the
means to extract additional information from seismic data.
There are various seismic inversion techniques and
algorithms suitable for different input data scenario and
objective of study. Pre-stack inversion technique to
discriminate lithology and fluid is applied for this study.
The amplitude character of seismic reflections varies with
offset due to changes in the angle of incident which is
evident in pre-stack CMP gathers. The Amplitude Versus
Offset (AVO) behavior of reservoir rock is useful to detect
the presence of hydrocarbon saturated reservoirs. This
study area is in Mahanadi offshore basin which is situated
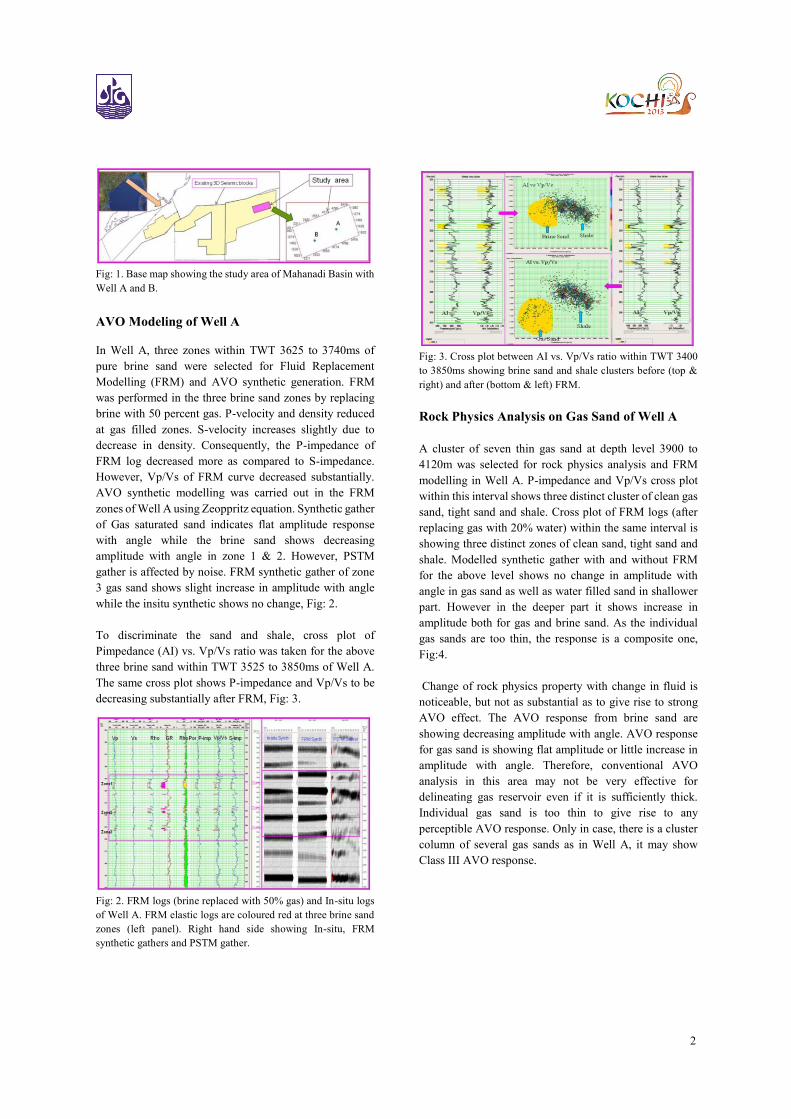
in the northern part of the East Coast of India, Fig: 1.The
bathymetry of study area is 1100 to 1390m. Wells A & B
were drilled in this study area in structural closure and
encountered thin gas sands within Miocene. Objective of
this integrated study is to discriminate gas sands from the
rest of the clastics. On the basis interpretation few
prospective locations were identified. Time migrated pre-
stack data are used as basic input to Constrained Sparse
Spike inversion (CSSI) and AVO analysis. Inversion and
AVO analysis were carried out independently for the 3D
seismic volume using the Well A and Well B. To delineate
gas sand in this area, gas sand polygon is selected from
cross plot of inversion derived Pimpedance and Vp/Vs at
Well A. Due to bad well to seismic ties and unstable
wavelet extraction, Well B was used as blind well for
validation. As observed from the analysis, the thin
individual pay sands may not be detectable; however
vertical cluster of such sands is likely to get detected using
inversion volumes.
Based on the AVO modelling result at well position,
seismic signatures corresponding to gas sand were
searched in the adjoining area. Intermediate range of P-
impedance and low Vp/Vs as observed in gas sand is also
used for delineating most likely pay sands. Both AVO and
inversion studies were combined to arrive at the final
location.
Geo-body extraction from the inversion volume using gas
sand polygon of Well A are used to delineate the most
probable gas sand within the zone of interest.
2
Fig: 1. Base map showing the study area of Mahanadi Basin with
Well A and B.
AVO Modeling of Well A
In Well A, three zones within TWT 3625 to 3740ms of
pure brine sand were selected for Fluid Replacement
Modelling (FRM) and AVO synthetic generation. FRM
was performed in the three brine sand zones by replacing
brine with 50 percent gas. P-velocity and density reduced
at gas filled zones. S-velocity increases slightly due to
decrease in density. Consequently, the P-impedance of
FRM log decreased more as compared to S-impedance.
However, Vp/Vs of FRM curve decreased substantially.
AVO synthetic modelling was carried out in the FRM
zones of Well A using Zeoppritz equation. Synthetic gather
of Gas saturated sand indicates flat amplitude response
with angle while the brine sand shows decreasing
amplitude with angle in zone 1 & 2. However, PSTM
gather is affected by noise. FRM synthetic gather of zone
3 gas sand shows slight increase in amplitude with angle
while the insitu synthetic shows no change, Fig: 2.
To discriminate the sand and shale, cross plot of
Pimpedance (AI) vs. Vp/Vs ratio was taken for the above
three brine sand within TWT 3525 to 3850ms of Well A.
The same cross plot shows P-impedance and Vp/Vs to be
decreasing substantially after FRM, Fig: 3.
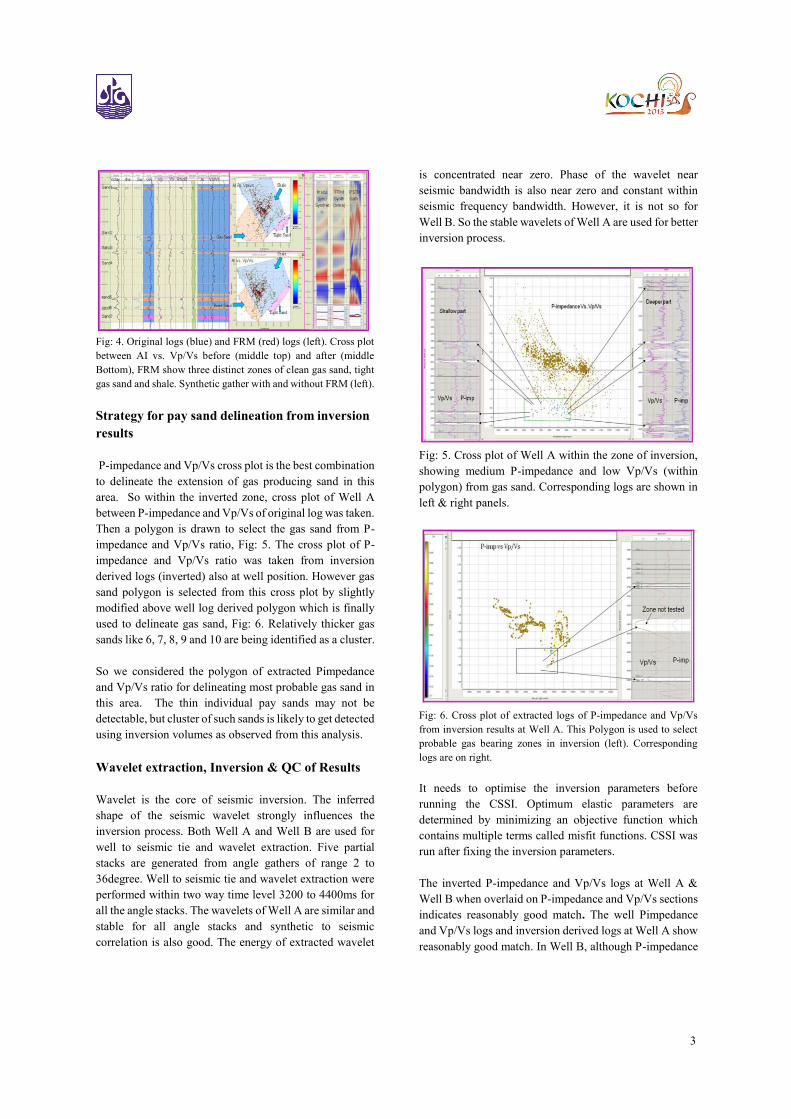
Fig: 2. FRM logs (brine replaced with 50% gas) and In-situ logs
of Well A. FRM elastic logs are coloured red at three brine sand
zones (left panel). Right hand side showing In-situ, FRM
synthetic gathers and PSTM gather.
Fig: 3. Cross plot between AI vs. Vp/Vs ratio within TWT 3400
to 3850ms showing brine sand and shale clusters before (top &
right) and after (bottom & left) FRM.
Rock Physics Analysis on Gas Sand of Well A
A cluster of seven thin gas sand at depth level 3900 to
4120m was selected for rock physics analysis and FRM
modelling in Well A. P-impedance and Vp/Vs cross plot
within this interval shows three distinct cluster of clean gas
sand, tight sand and shale. Cross plot of FRM logs (after
replacing gas with 20% water) within the same interval is
showing three distinct zones of clean sand, tight sand and
shale. Modelled synthetic gather with and without FRM
for the above level shows no change in amplitude with
angle in gas sand as well as water filled sand in shallower
part. However in the deeper part it shows increase in
amplitude both for gas and brine sand. As the individual
gas sands are too thin, the response is a composite one,
Fig:4.
Change of rock physics property with change in fluid is
noticeable, but not as substantial as to give rise to strong
AVO effect. The AVO response from brine sand are
showing decreasing amplitude with angle. AVO response
for gas sand is showing flat amplitude or little increase in
amplitude with angle. Therefore, conventional AVO
analysis in this area may not be very effective for
delineating gas reservoir even if it is sufficiently thick.
Individual gas sand is too thin to give rise to any
perceptible AVO response. Only in case, there is a cluster
column of several gas sands as in Well A, it may show
Class III AVO response.
3
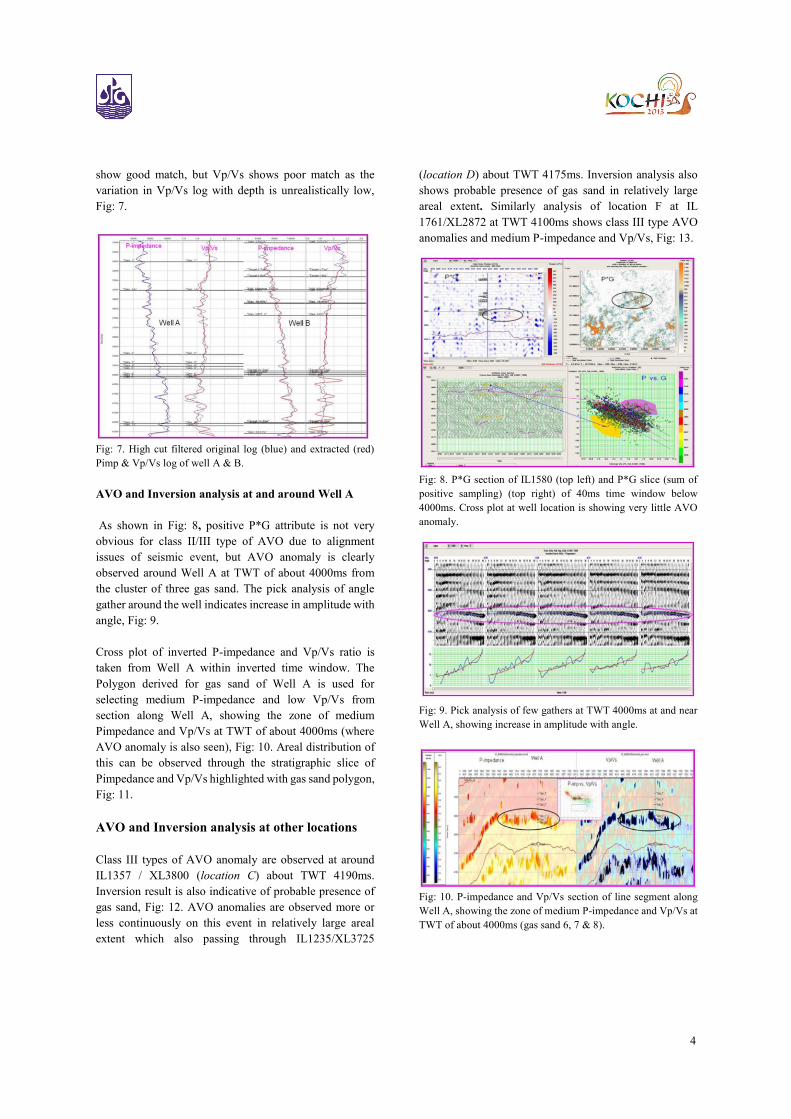
Fig: 4. Original logs (blue) and FRM (red) logs (left). Cross plot
between AI vs. Vp/Vs before (middle top) and after (middle
Bottom), FRM show three distinct zones of clean gas sand, tight
gas sand and shale. Synthetic gather with and without FRM (left).
Strategy for pay sand delineation from inversion
results
P-impedance and Vp/Vs cross plot is the best combination
to delineate the extension of gas producing sand in this
area. So within the inverted zone, cross plot of Well A
between P-impedance and Vp/Vs of original log was taken.
Then a polygon is drawn to select the gas sand from P-
impedance and Vp/Vs ratio, Fig: 5. The cross plot of P-
impedance and Vp/Vs ratio was taken from inversion
derived logs (inverted) also at well position. However gas
sand polygon is selected from this cross plot by slightly
modified above well log derived polygon which is finally
used to delineate gas sand, Fig: 6. Relatively thicker gas
sands like 6, 7, 8, 9 and 10 are being identified as a cluster.
So we considered the polygon of extracted Pimpedance
and Vp/Vs ratio for delineating most probable gas sand in
this area. The thin individual pay sands may not be
detectable, but cluster of such sands is likely to get detected
using inversion volumes as observed from this analysis.
Wavelet extraction, Inversion & QC of Results
Wavelet is the core of seismic inversion. The inferred
shape of the seismic wavelet strongly influences the
inversion process. Both Well A and Well B are used for
well to seismic tie and wavelet extraction. Five partial
stacks are generated from angle gathers of range 2 to
36degree. Well to seismic tie and wavelet extraction were
performed within two way time level 3200 to 4400ms for
all the angle stacks. The wavelets of Well A are similar and
stable for all angle stacks and synthetic to seismic
correlation is also good. The energy of extracted wavelet
is concentrated near zero. Phase of the wavelet near
seismic bandwidth is also near zero and constant within
seismic frequency bandwidth. However, it is not so for
Well B. So the stable wavelets of Well A are used for better
inversion process.
Fig: 5. Cross plot of Well A within the zone of inversion,
showing medium P-impedance and low Vp/Vs (within
polygon) from gas sand. Corresponding logs are shown in
left & right panels.
Fig: 6. Cross plot of extracted logs of P-impedance and Vp/Vs
from inversion results at Well A. This Polygon is used to select
probable gas bearing zones in inversion (left). Corresponding
logs are on right.
It needs to optimise the inversion parameters before
running the CSSI. Optimum elastic parameters are
determined by minimizing an objective function which
contains multiple terms called misfit functions. CSSI was
run after fixing the inversion parameters.
The inverted P-impedance and Vp/Vs logs at Well A &
Well B when overlaid on P-impedance and Vp/Vs sections
indicates reasonably good match. The well Pimpedance
and Vp/Vs logs and inversion derived logs at Well A show
reasonably good match. In Well B, although P-impedance
4
show good match, but Vp/Vs shows poor match as the
variation in Vp/Vs log with depth is unrealistically low,
Fig: 7.
Fig: 7. High cut filtered original log (blue) and extracted (red)
Pimp & Vp/Vs log of well A & B.
AVO and Inversion analysis at and around Well A
As shown in Fig: 8, positive P*G attribute is not very
obvious for class II/III type of AVO due to alignment
issues of seismic event, but AVO anomaly is clearly
observed around Well A at TWT of about 4000ms from
the cluster of three gas sand. The pick analysis of angle
gather around the well indicates increase in amplitude with
angle, Fig: 9.
Cross plot of inverted P-impedance and Vp/Vs ratio is
taken from Well A within inverted time window. The
Polygon derived for gas sand of Well A is used for
selecting medium P-impedance and low Vp/Vs from
section along Well A, showing the zone of medium
Pimpedance and Vp/Vs at TWT of about 4000ms (where
AVO anomaly is also seen), Fig: 10. Areal distribution of
this can be observed through the stratigraphic slice of
Pimpedance and Vp/Vs highlighted with gas sand polygon,
Fig: 11.
AVO and Inversion analysis at other locations
Class III types of AVO anomaly are observed at around
IL1357 / XL3800 (location C) about TWT 4190ms.
Inversion result is also indicative of probable presence of
gas sand, Fig: 12. AVO anomalies are observed more or
less continuously on this event in relatively large areal
extent which also passing through IL1235/XL3725
(location D) about TWT 4175ms. Inversion analysis also
shows probable presence of gas sand in relatively large
areal extent. Similarly analysis of location F at IL
1761/XL2872 at TWT 4100ms shows class III type AVO
anomalies and medium P-impedance and Vp/Vs, Fig: 13.
Fig: 8. P*G section of IL1580 (top left) and P*G slice (sum of
positive sampling) (top right) of 40ms time window below
4000ms. Cross plot at well location is showing very little AVO
anomaly.
Fig: 9. Pick analysis of few gathers at TWT 4000ms at and near
Well A, showing increase in amplitude with angle.
Fig: 10. P-impedance and Vp/Vs section of line segment along
Well A, showing the zone of medium P-impedance and Vp/Vs at
TWT of about 4000ms (gas sand 6, 7 & 8).
5
Fig: 11. Stratigraphic slice of P-impedance and Vp/Vs
highlighted with gas sand polygon from P-impedance and Vp/Vs
at TWT of about 4000ms at Well A.
Fig: 12. Pick analysis of Few Angle Gather of IL 1357 (location
C) near TWT 4190ms, showing increase in amplitude with angle
(Top). P-impedance and Vp/Vs section along location C,
showing the zone of medium P-impedance and Vp/Vs at TWT of
about 4190ms.
Fig: 13. Pick analysis of Few Angle Gather of IL 1761 near TWT
4100ms, showing increase in amplitude with angle (top).
Pimpedance and Vp/Vs section of IL1761/XL2872 along
location F (bottom), showing the zone of medium P-impedance
and Vp/Vs at TWT of about 4100ms.
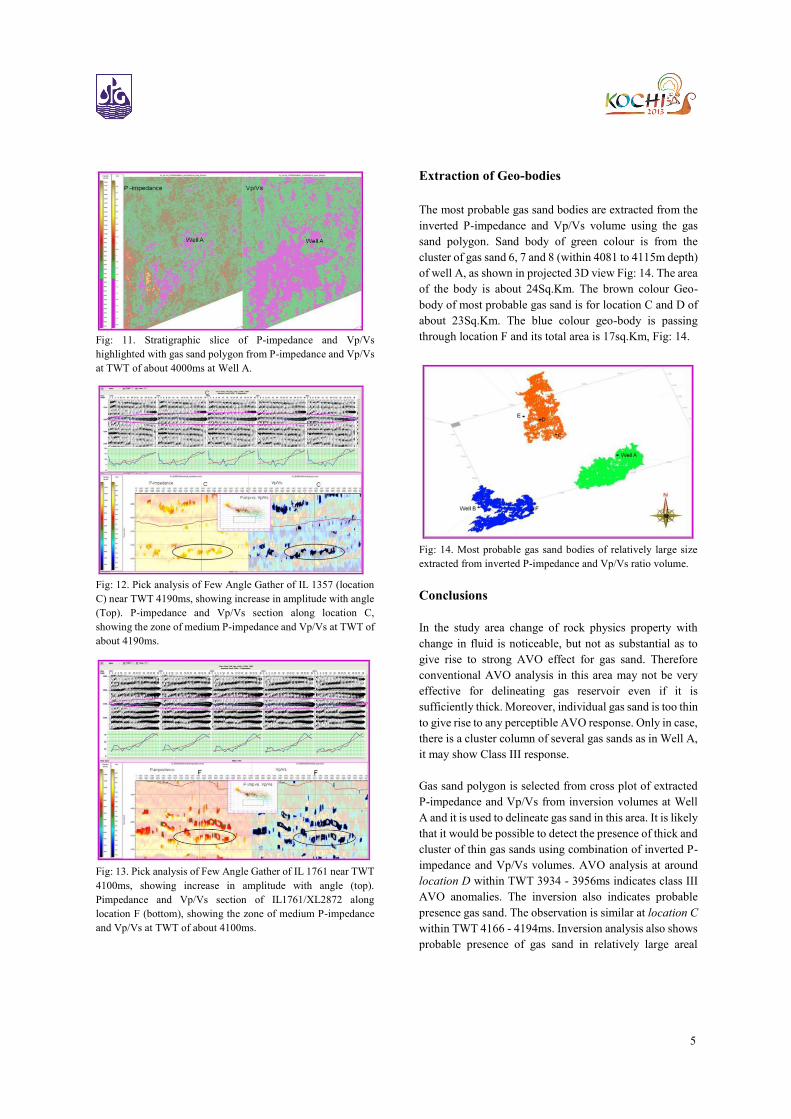
Extraction of Geo-bodies
The most probable gas sand bodies are extracted from the
inverted P-impedance and Vp/Vs volume using the gas
sand polygon. Sand body of green colour is from the
cluster of gas sand 6, 7 and 8 (within 4081 to 4115m depth)
of well A, as shown in projected 3D view Fig: 14. The area
of the body is about 24Sq.Km. The brown colour Geo-
body of most probable gas sand is for location C and D of
about 23Sq.Km. The blue colour geo-body is passing
through location F and its total area is 17sq.Km, Fig: 14.
Fig: 14. Most probable gas sand bodies of relatively large size
extracted from inverted P-impedance and Vp/Vs ratio volume.
Conclusions
In the study area change of rock physics property with
change in fluid is noticeable, but not as substantial as to
give rise to strong AVO effect for gas sand. Therefore
conventional AVO analysis in this area may not be very
effective for delineating gas reservoir even if it is
sufficiently thick. Moreover, individual gas sand is too thin
to give rise to any perceptible AVO response. Only in case,
there is a cluster column of several gas sands as in Well A,
it may show Class III response.
Gas sand polygon is selected from cross plot of extracted
P-impedance and Vp/Vs from inversion volumes at Well
A and it is used to delineate gas sand in this area. It is likely
that it would be possible to detect the presence of thick and
cluster of thin gas sands using combination of inverted P-
impedance and Vp/Vs volumes. AVO analysis at around
location D within TWT 3934 - 3956ms indicates class III
AVO anomalies. The inversion also indicates probable
presence gas sand. The observation is similar at location C
within TWT 4166 - 4194ms. Inversion analysis also shows
probable presence of gas sand in relatively large areal
6
extent. Same inversion results are observed at around
location F about TWT 4078ms. Integration of AVO and
Pre-stack inversion studies provided confidence in results
of prospectivity analysis. However, for reducing
uncertainty it is recommended to use these results along
with other G&G analysis.
Acknowledgement
This technical paper is part of the project work carried out
at INTEG, GEOPIC. The authors are thankful to ONGC
authority for permitting to publish the work as technical
paper. The authors express their gratitude to Shri A. K.
Dwivedi, GGM-Basin Manager MBA Basin, Kolkata for
giving opportunity to carry out this project. Thanks also
goes to the concerned group for providing technical input
during the execution of the project. We are thankful to
EDHOI-GEOPIC for his coordination and valuable
guidance.
References
Avseth Per, Tapan Mukerji and Gary Mavko, 2005,
Quantitative seismic interpretation, Applying rock physics
tool to reduce interpretation risk.
Veeken, P. and Rauch-Davies, M., 2006, AVO attribute
analysis and seismic reservoir characterisation, First
Break, vol. 24, p.41-52.
Hampson Russell knowledge base.
Frugro Jason training manual.
Ikon Science RokDoc manual.