avionics radiation hardness assurance (rha) guidelines
TRANSCRIPT

July 2021
NASA/TM−20210018053
NESC-RP-19-01489
Avionics Radiation Hardness Assurance (RHA)
Guidelines
Robert F. Hodson
Langley Research Center, Hampton, Virginia
Jonathan A. Pellish, Rebekah A. Austin, Michael J. Campola, and Raymond L. Ladbury
Goddard Space Flight Center, Greenbelt, Maryland
Kenneth A. LaBel
Science Systems and Applications, Inc., Greenbelt, Maryland
Gregory R. Allen
Jet Propulsion Laboratory, Pasadena, California
Razvan Gaza
Johnson Space Center, Houston, Texas
Emily M. Willis
Marshall Space Flight Center, Huntsville, Alabama

NASA STI Program Report Series
Since its founding, NASA has been dedicated to the
advancement of aeronautics and space science. The
NASA scientific and technical information (STI)
program plays a key part in helping NASA maintain
this important role.
The NASA STI program operates under the auspices
of the Agency Chief Information Officer. It collects,
organizes, provides for archiving, and disseminates
NASA’s STI. The NASA STI program provides access
to the NTRS Registered and its public interface, the
NASA Technical Reports Server, thus providing one
of the largest collections of aeronautical and space
science STI in the world. Results are published in both
non-NASA channels and by NASA in the NASA STI
Report Series, which includes the following report
types:
• TECHNICAL PUBLICATION. Reports of
completed research or a major significant phase of
research that present the results of NASA
Programs and include extensive data or theoretical
analysis. Includes compilations of significant
scientific and technical data and information
deemed to be of continuing reference value.
NASA counterpart of peer-reviewed formal
professional papers but has less stringent
limitations on manuscript length and extent of
graphic presentations.
• TECHNICAL MEMORANDUM.
Scientific and technical findings that are
preliminary or of specialized interest,
e.g., quick release reports, working
papers, and bibliographies that contain minimal
annotation. Does not contain extensive analysis.
• CONTRACTOR REPORT. Scientific and
technical findings by NASA-sponsored
contractors and grantees.
• CONFERENCE PUBLICATION.
Collected papers from scientific and technical
conferences, symposia, seminars, or other
meetings sponsored or
co-sponsored by NASA.
• SPECIAL PUBLICATION. Scientific,
technical, or historical information from NASA
programs, projects, and missions, often
concerned with subjects having substantial
public interest.
• TECHNICAL TRANSLATION.
English-language translations of foreign
scientific and technical material pertinent to
NASA’s mission.
Specialized services also include organizing
and publishing research results, distributing
specialized research announcements and feeds,
providing information desk and personal search
support, and enabling data exchange services.
For more information about the NASA STI program,
see the following:
• Access the NASA STI program home page at
http://www.sti.nasa.gov
• Help desk contact information:
https://www.sti.nasa.gov/sti-contact-form/
and select the “General” help request type.

National Aeronautics and
Space Administration
Langley Research Center
Hampton, Virginia 23681-2199
July 2021
NASA/TM−20210018053
NESC-RP-19-01489
Avionics Radiation Hardness Assurance (RHA)
Guidelines
Robert F. Hodson
Langley Research Center, Hampton, Virginia
Jonathan A. Pellish, Rebekah A. Austin, Michael J. Campola, and Raymond L. Ladbury
Goddard Space Flight Center, Greenbelt, Maryland
Kenneth A. LaBel
Science Systems and Applications, Inc., Greenbelt, Maryland
Gregory R. Allen
Jet Propulsion Laboratory, Pasadena, California
Razvan Gaza
Johnson Space Center, Houston, Texas
Emily M. Willis
Marshall Space Flight Center, Huntsville, Alabama

Available from:
NASA STI Program / Mail Stop 148
NASA Langley Research Center
Hampton, VA 23681-2199
Fax: 757-864-6500
Acknowledgments
The NESC team wishes to thank peer reviewers Mr. Charles Bailey, Johnson
Space Center (JSC); Dr. Stephen Buchner, Naval Research Laboratory; Dr. James
Howard, Missile Defense Agency/a.i. solutions, Inc.; Dr. Jean-Marie Lauenstein,
Goddard Space Flight Center (GSFC); Mr. Steven McClure, Jet Propulsion
Laboratory/California Institute of Technology; Mr. Steven Gentz, Marshall Space
Flight Center (MSFC); Dr. Azita Valinia, GSFC; and Mr. Timothy Brady, JSC;
for their support.
The use of trademarks or names of manufacturers in the report is for accurate reporting and does not
constitute an official endorsement, either expressed or implied, of such products or manufacturers by the
National Aeronautics and Space Administration.

iii
Table of Contents 1.0 Notification and Authorization ..................................................................................................... 1 2.0 Executive Summary ....................................................................................................................... 2 3.0 Guideline Introduction .................................................................................................................. 3
3.1 Motivation ........................................................................................................................................ 3 3.2 Document Structure and Navigation ................................................................................................ 4 3.3 Radiation Hardness Assurance (RHA) Philosophy ......................................................................... 5 3.4 Common Space Environment Reference ......................................................................................... 7 3.5 RHA Best Practices for Project Milestone Entrance and Exit Criteria ............................................ 8 3.6 Considerations for Commercial-off-the-shelf (COTS) Technologies ............................................ 10 3.7 References ...................................................................................................................................... 11
4.0 Shielding and Radiation Transport ............................................................................................ 13 4.1 Section Summary ........................................................................................................................... 13 4.2 Radiation Effects ............................................................................................................................ 14
4.2.1 Cumulative Effects ................................................................................................................ 14 4.2.2 Transient or Rate Effects ....................................................................................................... 15
4.3 Radiation Analysis Tools ............................................................................................................... 15 4.3.1 Non-Monte Carlo (MC) ......................................................................................................... 15 4.3.2 Forward Monte Carlo (FMC) ................................................................................................ 16 4.3.3 Reverse Monte Carlo (RMC) ................................................................................................. 16
4.4 Summary Table .............................................................................................................................. 17 4.5 References ...................................................................................................................................... 18
5.0 Total Ionizing Dose (TID) ........................................................................................................... 21 5.1 Section Summary ........................................................................................................................... 21 5.2 Physical Mechanisms ..................................................................................................................... 22 5.3 Susceptible Devices ....................................................................................................................... 23 5.4 Overview of Piece-Part Hardness Assurance ................................................................................. 25 5.5 Challenges Introduced by Uncertainties in the Environment and Part-Level Radiation
Performance ................................................................................................................................... 27 5.6 Future Advancements .................................................................................................................... 29 5.7 References ...................................................................................................................................... 29
5.7.1 Useful Standards and Additional References for TID ........................................................... 31 6.0 Total Non-ionizing Dose (TNID)/Displacement Damage Dose (DDD) .................................... 33
6.1 Section Summary ........................................................................................................................... 33 6.2 Physical Mechanisms ..................................................................................................................... 34 6.3 Susceptible Devices ....................................................................................................................... 35 6.4 TNID Calculations ......................................................................................................................... 36
6.4.1 Environments of Interest ........................................................................................................ 36 6.4.2 Effective Fluence Calculations .............................................................................................. 36 6.4.3 Limitations of Non-ionizing Energy Loss (NIEL) Scaling and Effective Fluence ................ 36
6.5 References ...................................................................................................................................... 38 6.5.1 Useful Standards and Additional References for Displacement Damage .............................. 38
7.0 Single Event Effects (SEEs) ......................................................................................................... 40 7.1 Section Summary ........................................................................................................................... 40 7.2 SEE Fundamentals ......................................................................................................................... 41 7.3 SEE Requirements and the IRCP ................................................................................................... 42 7.4 SEE Types and Mechanisms .......................................................................................................... 44 7.5 SEE Mitigation Techniques ........................................................................................................... 46 7.6 SEE Testing ................................................................................................................................... 47
7.6.1 Piece-Part Heavy Ion SEE Testing ........................................................................................ 47

iv
7.6.2 High-Energy Proton and Neutron SEE Testing ..................................................................... 48 7.6.3 CCA SEE Testing .................................................................................................................. 49
7.7 SEE Test Facilities ......................................................................................................................... 50 7.8 SEE Rate Calculations and Circuit Impact Assessment ................................................................ 51 7.9 References ...................................................................................................................................... 52
8.0 Single Event Effects Criticality Analysis (SEECA) .................................................................. 57 8.1 Section Summary ........................................................................................................................... 57 8.2 SEE Hazards .................................................................................................................................. 58 8.3 SEEs at the System Level .............................................................................................................. 59
8.3.1 System-Level Inference ......................................................................................................... 59 8.3.2 Criticality Classification ........................................................................................................ 60 8.3.3 Mission, Environment, Application, and Lifetime (MEAL) ................................................. 62
8.4 SEECA and Requirements Flow .................................................................................................... 63 8.5 Guidance for SEECA Implementation ........................................................................................... 64 8.6 References ...................................................................................................................................... 66
9.0 Radiation Testing and Analysis .................................................................................................. 68 9.1 Section Summary ........................................................................................................................... 68 9.2 Drivers for Test and Analysis Methodologies ............................................................................... 69 9.3 Using Archival Data in a Radiation Analysis ................................................................................ 70 9.4 Matching Approaches to the Threat ............................................................................................... 72
9.4.1 TID Test and Analysis ........................................................................................................... 72 9.4.2 TNID Test and Analysis ........................................................................................................ 75 9.4.3 SEE Testing and Analysis...................................................................................................... 76
9.5 Prioritizing Radiation Testing Efforts ............................................................................................ 81 9.6 References ...................................................................................................................................... 81
9.6.1 Useful Standards and Additional References for Radiation Testing and Analysis ................ 82 10.0 Operational Monitoring for Radiation Effects .......................................................................... 83
10.1 Section Summary ........................................................................................................................... 83 10.2 Best Practices ................................................................................................................................. 84 10.3 References ...................................................................................................................................... 86
11.0 Consolidated Reference List ....................................................................................................... 88 Appendix A. Ray Trace/Shielding Analysis Checklist for NOVICE RMC Simulations .................. 101 Appendix B. Generating Radiation Requirements .............................................................................. 103 Appendix C. Goal Structuring Notation (GSN) and Model-Based Mission Assurance (MBMA) ... 108 Appendix D. Proton Testing at Medical Therapy Facilities ................................................................ 115 Appendix E. Impact of Sample Size on Radiation Testing and Analysis ........................................... 127
List of Figures Figure 2.0-1. Guideline Document Organization Graph .......................................................................... 3 Figure 3.2-1. Guideline Document Organization Graph .......................................................................... 4 Figure 3.2-2. Example Navigation Graphic, Section 6.0 .......................................................................... 4 Figure 3.3-1. Graphical Mapping between RHA Processes, Themes, and Levels ................................... 5 Figure 3.3-2. Lifecycle Processes for Flight Program/Project RHA ........................................................ 7 Figure 3.5-1. Recommended RHA Process Gates as a Function of General Program/Project Phases .... 9 Figure 5.2-1. IB+ versus Total Dose for LM111s [adapted from Shaneyfelt et al., 2000] ...................... 23 Figure 5.4-1. Piece-Part RHA Methodology [adapted from Poivey, 2017] ........................................... 26 Figure 5.5-1. After Figure 3.3.1.1-4 from Revision G of the DSNE, representing daily Trapped
Radiation Belt TID inside Shielding for ISS Orbit ........................................................... 28

v
Figure 6.2-1. Potential Isolated Defects in Silicon induced by Incident Particle (left) [Srour and
Palko, 2013] ...................................................................................................................... 34 Figure 6.4-1. Damage for Dark Current as a Function of NIEL in Silicon Devices for Variety of
Particle Energies and Species [Srour and Palko, 2013; Summers et al., 1993] ................ 37 Figure 8.3-1. Levels of Spacecraft Design [Gates and LaBel, 1995] ..................................................... 59 Figure 8.3-2. Example Single-Event Severity Flow Diagram [SEECA, 1996] ...................................... 61 Figure 8.4-1. RHA Flow with SEECA Considerations .......................................................................... 64 Figure 8.5-1. Boxed Representation of SEECA ..................................................................................... 65 Figure 9.4-1. Sample Size and Failure Distribution Variations .............................................................. 74 Figure 9.4-2. Example of One-Sided Tolerance Limits Applied to TID Data ....................................... 74 Figure 9.4-3. Process of Calculating SEE Rates ..................................................................................... 78 Figure 9.4-4. Destructive SEE Data for Power MOSFET Safe Operating Area Determination ............ 80
List of Tables Table 3.4-1. Applicability Matrix for DRM by Region of Space ........................................................... 8 Table 3.5-1. Examples of Recommended RHA Activities for Program/Project Milestones .................. 9 Table 4.4-1. Radiation Transport Tools Summary ................................................................................ 17 Table 5.3-1. Potentially Susceptible Technologies and Impacted Parameters ...................................... 24 Table 6.3-1. Potentially Susceptible Technologies and Impacted Parameters ...................................... 35 Table 7.4-1. SEE Type Susceptibility of Various Technologies and Part Types [adapted from
Ladbury, 2017] .................................................................................................................. 45 Table 7.4-2. SET Signature Guidelines for Selected Device Types (these apply to rad-hard parts
only and are to be interpreted as enveloping 90% of applications) .................................. 46 Table 7.5-1. Sample Error Detection Methods and Correction Capabilities [adapted from
LaBel, 1996] ..................................................................................................................... 47 Table 8.3-1. Sample of Consequence Criteria ....................................................................................... 63 Table 8.5-1. Steps for Implementing SEECA ....................................................................................... 66 Table 9.2-1. Driving Factors for Radiation Testing and Analysis Methodologies ................................ 70

vi
Nomenclature C Level of Confidence
E0 Monoenergetic Particle
Feff Effective Fluence
Kdark Damage Factor
Ps Probability of Survival
Rf Radiation Failure Level of the Part
Rspec Radiation Specification Level
∅ Particle Fluence
3D Three-dimensional
ADC Analog-digital Converters
Ag Silver
APEX Advanced Photovoltaic Experiment
APS Active Pixel Sensor
ASET Analog Single-event Transient
ASIC Application-specific Integrated Circuit
BCH Bose–Chaudhuri–Hocquenghem
BiCMOS Bipolar CMOS
BJT Bipolar Junction Transistor
BNL Brookhaven National Laboratory
BoK Book of Knowledge
Br Bromine
CAD Computer-aided Design
CCA Circuit Card Assembly
CCD Charge-coupled Device
CGS centimeter–gram–second
CIS CMOS Image Sensor
CL Confidence Level
CMOS Complementary Metal Oxide Semiconductor
CONOPS Concept of Operations
COTS Commercial off the Shelf
CRRES Combined Release and Radiation Effects Satellite
CRUX Cosmic Ray Upset Experiment
CTE Charge Transfer Efficiency
DC Direct Current
DDD Displacement Damage Dose
DRAM Dynamic Random-access Memory
DRM Design Reference Missions
DSEE Destructive Single-event Effects
DSET Digital Single-event Transient
DSNE Design Specification for Natural Environments
DUT Device Under Test
EDAC Error Detection and Correction
EEEE Electrical, Electronic, Electromechanical, And Electro-optical
ELDRS Enhanced Low Dose-Rate Sensitivity

vii
ESA European Space Agency
ESCC European Space Components Coordination
ESD Electrostatic Discharge
ESP Emission of Solar Protons (model)
FAR Federal Acquisition Regulation
FET Field Effect Transistor
FLUKA FLUktuierende KAskade (FMC)
FMC Forward Monte Carlo
FMECA Failure Mode, Effects, and Criticality Analysis
FPGA Field-programmable Gate Arrays
FRIB Facility for Rare Isotope Beams
GaAs Gallium Arsenide
GCR Galactic Cosmic Ray
GNC Guidance, Navigation, and Control
GSN Goal Structuring Notation
Gy Gray, where 1 Gy = 1 J/kg
HDR High Dose Rate
HEOMD Human Exploration and Operations Mission Directorate
HIPAA Health Insurance Portability and Accountability Act
HNC Hardness Non-critical
HZETRN High-Z and Energy Transport (FMC)
IC Integrated Circuit
IEEE Institute of Electrical and Electronics Engineers
INCOSE International Council on Systems Engineering
IRCP Ionizing Radiation Control Plan
IRENE International Radiation Environment Near Earth
ITS Integrated Tiger Series (FMC)
IUCF Indiana University Cyclotron Facility
JEDEC Joint Electron Device Engineering Council
JFET Junction Field Effects Transistor
JPL Jet Propulsion Laboratory
krad kilorad (106 rad, where 1 rad = 100 erg/g = 0.01 Gy)
KTL K Factor for Statistical Tolerance Limit
LBNL Lawrence Berkeley National Laboratory
LDEF Long Duration Exposure Facility
LDPC Low-density Parity Check
LDR Low Dose Rate
LED Light-emitting Diode
LEO Low Earth Orbit
LET Linear Energy Transfer
LOC Loss of Crew
LOM Loss of Mission
LWS Living With a Star
MBMA Model-based Mission Assurance
MBSE Model-based System Engineering
MBU Multiple-bit Upset

viii
MC Monte Carlo
MCNP Monte Carlo N-Particles (FMC)
MCU Multiple-cell Upset
MEAL Mission, Environment, Application, and Lifetime
MeV mega electron-volt
MOS Metal-Oxide-Semiconductor
MOSFET Metal-Oxide-Semiconductor Field Effect Transistor
MPTB Microelectronics and Photonics Test Bed
MPTF Medical Proton Therapy Facility
MTBF Mean Time between Failures
MTTF Mean Time to Failure
MTTR Mean Time to Repair
MU Monitor Unit
NAND NOT-AND logic gate
NASEM National Academies of Sciences, Engineering, and Medicine
NEPP NASA Electronic Parts and Packaging
NESC NASA Engineering and Safety Center
NIEL Non-ionizing Energy Loss
NIST National Institute of Standards and Technology
NMOS N-type Metal-oxide Semiconductor
NSCL National Superconducting Cyclotron Laboratory
NSREC Nuclear and Space Radiation Effects Conference
NSRL NASA Space Radiation Laboratory
NTRS NASA Technical Reports Server
OSMA Office of Safety and Mission Assurance
PBTM Proton Board Level Test Method
PETS Pre-irradiation Elevated-Temperature Stress
PIGS Post-irradiation Gate Stress
PMAD Power Management and Distribution
PSYCHIC Prediction of Solar particle Yields for CHaracterizing Integrated Circuits (model)
PTCOG Particle Therapy Co-Operative Group
PWM Pulse Width Modulator
R&M Reliability & Maintainability
rad radiation absorbed dose
RDM Radiation Design Margin, Rf divided by Rspec
RHA Radiation Hardness Assurance
RLAT Radiation Lot Acceptance Testing
RMC Reverse Monte Carlo
ROIC Readout Integrated Circuit
RPP Rectangular Parallelepiped
RTG Radioisotope Thermoelectric Generators
s second
SAA South Atlantic Anomaly
SBU Single-bit Upset
SCR Semiconductor-controlled Rectifier
SEAM System Engineering and Assurance Modeling

ix
SEB Single-event Burnout
SECDED Single Error Correction, Double Error Detection
SEDR Single-event Dielectric Rupture
SEE Single Event Effects
SEECA SEE Criticality Analysis
SEESAW Space Environment Engineering and Science Applications Workshop
SEFI Single-event Functional Interrupt
SEGR Single-event Gate Rupture
SEL Single-event Latchup
SET Single-event Transient
SEU Single-event Upset
SI International System of Units
Si Silicon
SiO2 Silicon Dioxide
SIP System-in-Package
SMD Science Mission Directorate
SME Subject Matter Expert
SOA Safe Operating Area
SOBP Spread Out Bragg Peak
SOI Silicon-on-Insulator
SOS Silicon-on-Sapphire
SOTA State of the Art
SOTP State of the Practice
SPE Solar Particle Event
SPENVIS SPace ENVironment Information System
SRAM Static Random-access Memory
SRHEC Strategic Radiation-Hardened Electronics Council
SRIM Stopping and Range of Ions in Matter
SRR System Requirements Review
STMD Space Technology Mission Directorate
SUT System under Test
SV Sensitive Volume
TAMU Texas A&M University
TID Total Ionizing Dose
TLYF Test like you Fly
TMR Triple Module Redundancy
TNID Total Non-ionizing Dose
U.S. United States
USAF United States Air Force
VDBP Variable-Depth Bragg Peak
VDS Drain-to-source Voltage
VGS Gate-to-source Voltage
VHDL Very-high-speed Integrated Circuit Hardware Description Language

1.0 Notification and Authorization
As human exploration moves outside the protection of Earth's magnetosphere and embraces a
broader range of missions in more severe radiation environments, it is crucial to ensure that all
parties are cognizant of the risks posed by the requirements derived from mission, environment,
application, and lifetime factors. Based on the need to develop and adopt timely and up-to-date
guidance to ensure that natural space radiation environment threats do not compromise mission
success, the NASA Engineering and Safety Center (NESC) was solicited to develop and publish
guidance for deriving radiation hardness assurance (RHA) requirements and for evaluating
avionics hardware elements with respect to total ionizing dose (TID), total non-ionizing dose
(TNID), and single event effects (SEE). Furthermore, the NESC was tasked to assess, update,
and publish guidance for performing a SEE Criticality Analysis (SEECA).
The key stakeholders for this assessment are the NASA Electronic Parts and Radiation Effects
Engineering capability and the NASA Electronic Parts and Packaging (NEPP) Program. Given
the focus on avionics flight hardware, the (HEOMD), the Science Mission Directorate (SMD)
and the Space Technology Mission Directorate (STMD) are affected as well.
The following table lists the key personnel and major historical dates of the assessment:
NESC Lead Robert F. Hodson, NASA Technical Fellow for Avionics
Technical Lead Jonathan Pellish
Approval to Proceed October 15, 2019
Final Report April 1, 2021
The NESC team included the following team members:
Name Discipline Organization
Core Team
Robert Hodson NESC Lead LaRC
Jonathan Pellish Technical Lead GSFC
Gregory Allen Radiation Engineer JPL
Rebekah Austin Radiation Engineer GSFC
Michael Campola Lead, Radiation Engineering and Analysis Group GSFC
Razvan Gaza Radiation Engineer JSC
Kenneth LaBel Radiation Engineer GSFC/SSAI
Raymond Ladbury Radiation Engineer GSFC
Leif Scheick Lead, Radiation Effects Group JPL
Emily Willis Space Environment Effects MSFC
Erica Worthy Materials Research Engineer JSC
Consultants
Yuan Chen Electronic Parts Engineering & Reliability LaRC
Christopher Iannello NASA Technical Fellow for Electrical Power KSC
Dwayne Morgan Avionics Systems WFF
Joseph Minow NASA Technical Fellow for Space Environments MSFC
David Petrick Chief Engineer, Electrical Engineering Division GSFC
Robert Suggs Team Lead, Natural Environments Branch MSFC
Business Management
Becki Hendricks Program Analyst LaRC/MTSO

2
Name Discipline Organization
Assessment Support
Linda Burgess Planning and Control Analyst LaRC/AMA
Jonay Campbell Technical Editor LaRC/KBR
Melinda Meredith Project Coordinator LaRC/AMA
2.0 Executive Summary
This NASA Engineering and Safety Center (NESC) technical memorandum focuses on
developing radiation hardness assurance (RHA) guidance for aerospace avionics systems—it is
not a technical standard or catalog of requirements. The creation of this document was motivated
by the current state and future trajectory of NASA’s human, science, and space technology
exploration objectives. The full assessment report that contains the source material (NESC-RP-
19-01489) for this technical memorandum is available through the NESC to United States (U.S.)
government agencies and U.S. government agency contractors only.
As NASA human exploration moves outside the protection of Earth’s magnetosphere and
embraces a wider range of missions in more severe radiation environments, it is crucial to ensure
that all parties are cognizant of the threats presented by these evolving mission, environment,
application, and lifetime (MEAL) factors, and the resources required to mitigate them. For
traditional approaches to RHA, there tend to be gaps between state of the practice (SOTP) and
state of the art (SOTA), based on what has been proven successful in flight and what is possible
from a research and development perspective. RHA is forced to evolve at the speed of
technology development and insertion, which can strain accepted methodologies, particularly in
light of significant mission objective and acquisition strategy evolutions. Furthermore, much of
the critical RHA knowledge in the spaceflight community is experiential and tied to a relatively
small number of subject matter experts (SMEs), placing paramount importance on continuously
aggregating and documenting best practices for the wider community, which needs to leverage
these discipline resources.
In this memorandum, the NESC team documented best practices and guidelines spanning the
primary radiation effects (i.e., total ionizing dose (TID), total non-ionizing dose
(TNID)/displacement damage dose (DDD), and single event effects (SEE)) and significant
content on radiation shielding and transport, radiation effects testing and analysis, and
operational monitoring for radiation effects. Figure 2.0-1 shows the organizational graph for the
overall report. Increasing levels of detail are shown by the addition of outward-facing segments
on the inner rings (i.e., start with RHA, which is further subdivided into the primary document
sections and subsections). Additionally, five appendices provide supporting information on ray
trace analysis, generation of radiation requirements, model-based mission assurance (MBMA),
proton testing at medical therapy facilities, and the impact of sample size on radiation testing and
analysis.

3
Figure 2.0-1. Guideline Document Organization Graph
The goal of this technical memorandum is to document the state of NASA’s current RHA best
practices and make them broadly accessible across NASA, to our international partners, and
within other government agencies and the growing commercial aerospace sector. It is hoped that
this document will serve not only as an aid and a reference for radiation engineers, but also as a
body of knowledge to educate and inform the broader community to the challenges of radiation
assurance and methods to understand, mitigate, and manage radiation effects in avionics systems.
3.0 Guideline Introduction
3.1 Motivation
As NASA human exploration moves outside the protection of Earth’s magnetosphere and
embraces a wider range of missions in more severe radiation environments, it is crucial to ensure
that all parties are cognizant of the threats presented by these evolving MEAL factors. The
NESC team has developed and recommends timely adoption of up-to-date RHA guidance to
ensure that natural space radiation environment threats do not unnecessarily compromise mission
success.
The scope of this guideline covers TID, TNID, and SEE, as well as supporting disciplines
including radiation shielding and transport SEECA, radiation testing, and radiation data analysis.
The appendices provide additional background and useful references for requirements
generation, goal structuring notation, model-based assurance, proton testing at medical therapy
facilities, and the impact of sample size on radiation testing and analysis. All of this is done with
a focus on electrical, electronic, electromechanical, and electro-optical (EEEE) piece parts,
components, and systems. This document uses the more inclusive term “EEEE parts” to
recognize the rapid expansion of electro-optical technologies in space flight as well as the
criticality of radiation effects awareness and mitigation for their successful deployment.
Given the predominant focus on TID, TNID, and SEE, high-energy radiation effects in the
natural space radiation environment are addressed as defined by the Cross-Program Design

4
Specification for Natural Environments (DSNE), SLS-SPEC-159 [Roberts, 2019]. The DSNE
and the practices outlined in this guideline form the general basis for civil space system RHA
programs. While the DSNE is the environmental reference in this instance, programs and
projects can generate their own environment specifications. The same processes would apply,
albeit with a different starting point. Natural space environments that induce effects other than
TID, TNID, and SEE are out of scope for this guidelines document.
3.2 Document Structure and Navigation
Figure 3.2-1 shows the organizational graph for this document. Increasing levels of detail are
shown with the addition of outward-facing segments on the inner rings (i.e., start with RHA,
which is subdivided into the primary document sections and subsections). Clicking on the links
allows the reader to navigate easily throughout the document. Corresponding graphics, including
the example shown in Figure 3.2-2 for Section 3.0, are provided at the beginning of each section.
These graphics contain links that lead back to this point (i.e., the “Return to Main” links) and
provide additional details about specific section contents.
Figure 3.2-1. Guideline Document Organization Graph
Navigation
Link
Section Description Additional
Content
Return to
Main
See Appendix
B
Figure 3.2-2. Example Navigation Graphic, Section 6.0

5
3.3 Radiation Hardness Assurance (RHA) Philosophy
The RHA process is laid out with interdependent activities. It may help to group these activities
by the type or “theme” of work (e.g., modeling, analysis, or testing), or to examine the “level” or
scope to which these activities can address information (e.g., mission, system, or part level). An
example mapping between RHA processes, themes, and levels is shown in Figure 3.3-1. From
this point, some distinctions can be made:
• Defining radiation requirements relies on modeling and model fidelity.
• Radiation requirements exist at the system and part levels.
• Testing and analysis may be conducted at the part level, but outcomes and engineering are
most prevalent and defined at the system level.
Figure 3.3-1. Graphical Mapping between RHA Processes, Themes, and Levels
Best practice indicates that each program or project should have a single point of contact or lead
who is responsible for overall system RHA. This lead role may have a matrixed team of direct
reports and/or other resources that cover subsystems or aspects of system RHA. While
organizations might implement many or most of the RHA process foundations, there is a lack of
consistency across organizations, including varying radiation discipline taxonomies, which can
make enterprise-level integration difficult or impossible. Additional standardization would
benefit programs and projects as well as their probability of mission success.
Within the context of the program or project, primary interfaces for the RHA lead1 include but
are not limited to:
• Project or instrument manager and/or their designees.
1 For the purposes of this guidelines document “RHA lead’ refers to the individual and their team of SMEs.

6
• Systems engineers.
• Parts engineers.
• Safety and mission assurance.
• Reliability engineers.
• Electrical and optical systems designers.
• Materials engineers.
• Mechanical and thermal engineers.
• Science team (when radiation tolerance may impact science instrument performance).
• Other discipline engineering as needed.
The RHA lead should be responsible for providing the planning and delivery of:
• Space radiation environment description and requirements external to the spacecraft.
• In the case of this guideline, the natural radiation environment is specified by the DSNE
[Roberts, 2019].
• Transport of space radiation environment and requirements internal to the spacecraft.
• Radiation requirements definition.
• EEEE component radiation assessment and design review support. Iteration of the analyses
below occurs as designs and component selections change and evolve.
• Radiation tolerance/susceptibility.
• Risk identification and mitigation.
• Test requirements and recommendations.
• Design recommendations when applicable.
In the case of some out-of-house projects or hardware deliveries, the roles of the RHA lead may
be delegated to a non-NASA agent. The same RHA philosophy principles and leadership roles
still apply. When this is the case, the RHA lead should review and validate environment
definitions, requirements, specifications, etc. As discussed in Appendix C on goal structuring
notation and model-based assurance, in this case it is even more important to know and
understand implicit assumptions and logic given the system- and mission-level consequences of
misunderstandings when it comes to RHA. Figure 3.3-2 illustrates the typical roles and
responsibilities of the RHA lead. This role can span the full program or project lifecycle. While it
may not be explicit in the figure, coordination and collaboration between the RHA lead and the
other engineering disciplines is essential. This is particularly true for the design evaluation stage,
where the RHA lead/team have critical dialogue with the circuit designers and their teams,
basically negotiating RHA through system performance, size, weight, power, cost, and schedule
boundaries. Each of these stages can be and often is iterative.

7
Flight Program Radiation Engineering
Environment Definition
Project Requirements
and SpecificationsDesign Evaluation
In-Flight Evaluation
External Environment
Environment in the presence of the
spacecraft / instrument
Board and component level; detailed modeling
and analysis – 3D ray trace, Monte Carlo, etc.
Technology Hardness
Risk Posture and Design Margins
Box / System Level
Parts List Screening
Radiation characterization,
instrument calibration, and performance
predictions
Mitigation approaches and design reliability
Technology Performance
Anomaly Resolution
Lessons Learned
Iteration over project development cycle Figure 3.3-2. Lifecycle Processes for Flight Program/Project RHA
3.4 Common Space Environment Reference
Roberts (2019) describes the ionizing radiation environments that lead to TID, TNID, and SEE in
EEEE parts and systems. The DSNE is a publicly available document released through the
NASA Technical Reports Server (NTRS), located at https://ntrs.nasa.gov/. Users can search for
the DSNE by visiting the public search option and querying “DSNE” in the title search field.
Sort by publication date to ensure linkage to the most recent version or to the version stipulated
in contractual requirements. The DSNE is currently at Revision G and is subject to updates.
The environment specifications include galactic cosmic rays (GCRs), solar particle event (SPE)
fluxes, and trapped radiation. Environments are defined for all phases of the Design Reference
Missions (DRMs), as defined in ESD 10012, Exploration Systems Development (ESD) Concept
of Operations. Table 3.4-1, adapted from tables in the DSNE, shows the applicability matrix for
each DRM (i.e., shown in the leftmost column) for each region of space defined in this document
(subsequent columns). An “X” is placed in each box where the region of space is applicable to
that DRM. For the “Staging and Transit Orbits” column, subsections are called out as applicable
since not all may be applicable for each DRM. Since the expected number of SPEs is a function
of total mission time, placing SPE in the section for each region of space would place multiple
events in a DRM when only one may be appropriate. Therefore, the SPE environment, for both
geomagnetically shielded and unshielded scenarios, is placed in its own subsection with the
appropriate number of events incorporated based on specific mission requirements.

8
Table 3.4-1. Applicability Matrix for DRM by Region of Space
DRM Region of Space
LE
O
Sta
gin
g a
nd
Tra
nsi
t O
rbit
s
GE
O
Inte
rpla
net
ary
Lu
na
r O
rbit
Lu
na
r S
urf
ace
NE
A
Ma
rs O
rbit
Ma
rs S
urf
ace
SP
E
Distant Retrograde Orbit X X X X
Crewed Lunar Orbit X X X X X
Low Lunar Orbit X X X X X
Initial Capability NEA X X X X
Advanced NEA X X X X
Full Capability NEA X X X X
Lunar Surface Sortie X X X X X X
ISS Crew Delivery Backup X X
GEO Vicinity X X X X
Martian Moon X Reserved X X X
Martian Landing X Reserved X X X X
In Roberts [2019], Table 1.3-1 contains a crosswalk matrix between DRM concepts of operation
and the DSNE section number. This is an essential reference. To build a compliant radiation
environment for a given DRM, all relevant DSNE sections must be aggregated, with
environment contributions summed and separated as appropriate.
3.5 RHA Best Practices for Project Milestone Entrance and Exit Criteria
A RHA program should be planned and implemented for all flight programs and projects to
verify and validate component- and system-level radiation hardness by key decision points
associated with fabrication of the final design (see Table 3.5-1). Programs/projects that ignore or
under-resource this discipline often discover too late that instruments/spacecraft are susceptible
to radiation effects in ways that can impact “operate through” capabilities, mission success, and
loss of crew/loss of mission metrics.
A higher-level graphical example of the recommended RHA activities indicated in Table 3.5-1 is
depicted in Figure 3.5-1. These activity recommendations could serve as example entry and exit
criteria for program and project milestones. Failure to observe this general order of operations,
including the deferral of necessary steps to later development phases, can result in increased
technical and programmatic risks.

9
Table 3.5-1. Examples of Recommended RHA Activities for Program/Project Milestones
Mission
Phase: Formulation
Concept and
Technology
Development
Preliminary
Design and
Technology
Completion
Final Design, Fabrication,
Assembly, Integration, and
Test
Launch and
Operations
Activities: Include a preliminary RHA assessment in the concept study.
Update RHA assessment and include resources for RHA program support in proposals.
Complete radiation environment analysis and begin assessment of radiation sensitivity of EEEE parts through test or analysis, as practicable.
1. Implement radiation hardness requirements for part selection.
2. Identify and implement mitigation plans for non-compliance.
3. Complete parts RHA categorization.
4. Complete parts RHA qualification.
5. Complete radiation test reports for outstanding analyses.
Track on-orbit performance post-launch, plan for anomaly resolution processes, and feedback lessons learned.
Figure 3.5-1. Recommended RHA Process Gates as a Function of General
Program/Project Phases

10
3.6 Considerations for Commercial-off-the-shelf (COTS) Technologies
Before addressing high-level RHA considerations for COTS parts, it is worth considering what
defines a COTS EEEE part. The definition can be based on technical specifications, product
targets, or market drive for different sectors (e.g., automotive, consumer, industrial, medical,
etc.). Those details are beyond the scope of this guideline document, and the reader is referred to
NESC-RP-19-01490, “Recommendations on Use of Commercial-Off-The-Shelf (COTS)
Electrical, Electronic, and Electromechanical (EEE) Parts for NASA Missions – Phase I Report”
[2020].
COTS EEEE parts are not explicitly designed for aerospace applications. Radiation effects are
usually excluded from COTS design trade spaces except for specialized subsets of terrestrial and
atmospheric avionics applications that are sensitive to neutron and alpha particle SEE. TID and
TNID are currently of no concern for terrestrial technologies with few exceptions (i.e., nuclear
medicine, nuclear reactor, and particle accelerator-based applications); accelerator applications
also need to address SEE. Even in cases where terrestrial radiation effects may be addressed
during the design process, space radiation effects may be qualitatively different as well as
quantitatively more common, impacting preconceived system architectures in unforeseen ways.
There is not presently a low impact means of translating from the intended use conditions for
COTS parts to space applications, especially when addressing radiation environments. Engaging
those parts to meet mission requirements, whether for programmatic and/or technical reasons,
will continue to require experiential knowledge combined with effective risk identification and
management. The EEEE parts supply chain also offers other part types that are important to keep
in mind for appropriate context. Radiation-tolerance implies certain types of inherent reliability,
but reliability does not imply radiation tolerance.
It is important to note that parts screening levels in documentation that propagates from
references such as MIL-PRF-19500, MIL-PRF-38534, MIL-PRF-38535, EEE-INST-002, etc.,
do not indicate the level of radiation tolerance. Even in cases where these parts carry a RHA
designator, it may only apply to TID and possibly TNID. Items intentionally hardened against
TID, TNID, and SEE are rare and possibly fabrication- or packaging-lot specific.
Compared with traditional military- and aerospace-specification parts, the factors that exacerbate
radiation risk for COTS include:
• Applicable archival radiation data (e.g., TID, TNID, and/or SEE) for COTS parts may be
difficult to find.
• The large number of COTS manufacturers, coupled with their short product lifecycle,
make it likely that archival radiation data for the part may not exist.
• Even if a part has been radiation tested, organizations may consider the data sensitive
since a SOTA part may be critical to their design architecture. Moreover, even if data are
obtained, the data may only be applicable for that organization’s application(s).
• Design mask set or fabrication process-related changes may invalidate archival data even
though acceptable form, fit, and function are maintained. COTS manufacturers are not
necessarily required to notify customers of these changes, and they can have dramatic
effects on radiation reliability.
• SOTA parts can have short product life cycles or between-die revisions, leaving a very short
window for procuring parts once a favorable radiation test outcome is realized. This can

11
impact economy of scale operations that do not have robust periodic characterization
processes. Two examples are SOTA synchronous dynamic random access memory and
NAND flash memory, where a die revision can completely invalidate past radiation testing
results, and die revisions can happen as rapidly as every 18 months.
• For heavy ion SEE testing, ensuring that ions penetrate sufficiently to traverse device
sensitive volumes often requires the active die surface be exposed and possibly thinned. The
close integration of semiconductor and packaging inherent to complex parts often makes
such exposure difficult, if not impossible. Moreover, alteration of the part may be sufficiently
disruptive that part functionality is affected. This is not unique to COTS parts, but the
situation with COTS parts significantly exacerbates the issue, where lead frames and other
packaging are integral to the structural stability of the part, and components (e.g., capacitors)
were affixed to the die in such a manner that they cannot be removed without destroying the
die. It has become more challenging with increasingly sophisticated integration schemes,
such as three-dimensional (3D) and system-in-package (SIP) COTS parts.
• SOTA COTS parts may pose significant testing challenges, resulting in high testing costs.
Radiation-hardened or space parts technology lags behind commercial technology by about
three to four generations at this point. As a result, while the following issues may be
encountered with advanced radiation-hardened parts, these will likely be much worse with
SOTA COTS parts.
• Complicated SOTA parts usually require sophisticated SOTA test equipment, which is
expensive, susceptible to damage, and may be hard to configure and place in radiation
test facility environments.
• SOTA parts may have many different operating modes and conditions, each of which
may have different susceptibilities. This can result in either long, expensive test
campaigns or incomplete data collection.
Radiation effects are indiscriminate and affect both COTS and traditional MIL-SPEC EEEE
parts and systems through the same mechanisms related to TID, TNID, and SEE, even though
the details may differ. The rest of this guideline covers those details at a lower level, as well as
introduces concepts to support a robust and effective RHA program.
3.7 References
Exploration Systems Development (ESD) Concept of Operations, ESD 10012.
“General Specification for Hybrid Microcircuits,” MIL-PRF-38534, retrieved from
https://www.dla.mil/LandandMaritime/.
“General Specification for Integrated Circuits (Microcircuits) Manufacturing,” MIL-PRF-38535,
(https://www.dla.mil/LandandMaritime/).
“General Specification for Semiconductor Devices,” MIL-PRF-19500, retrieved from
https://www.dla.mil/LandandMaritime/.
Instructions for EEE Parts Selection, Screening, Qualification, and Derating,” EEE-INST-002,
April 2008. Also NASA/TP—2003-212242, April 2008. Retrieved from
https://nepp.nasa.gov/.

12
“Recommendations on Use of Commercial-Off-The-Shelf (COTS) Electrical, Electronic, and
Electromechanical (EEE) Parts for NASA Missions – Phase I Report,” NESC Final Report
NESC-RP-19-01490, October 27, 2020.
Roberts, B. C., “Cross-Program Design Specification for Natural Environments (DSNE),” SLS-
SPEC-159, Revision G, NASA Marshall Space Flight Center, Huntsville, Alabama, 2019.
Retrieved from https://ntrs.nasa.gov/.

13
4.0 Shielding and Radiation Transport
Return to Main See also:
Appendix A
4.1 Section Summary
Radiation shielding analysis is a design process in which the local radiation environment at
components within the spacecraft (e.g., for devices, materials, sensors/detectors, etc.) is
computed and defined. During this analysis, the ambient radiation environment is “transported”
to specific locations within the spacecraft to estimate the radiation levels expected at those
positions. A variety of shielding and radiation transport codes are available and used for this
purpose in the space radiation environments and shielding communities. The term “radiation
transport codes” is used in a general sense in this document. Here, the definition of transport
code is inclusive of codes actually “transporting” particles (e.g., Monte Carlo (MC) codes) and
those that do not actually transport particles (e.g., ray-tracing tools). The specific use for each
code is strongly dependent on the radiation effect being investigated and the level of modeling
fidelity desired for simulations. That is, there is no one-size-fits-all radiation transport code that
can be used for all space radiation shielding analysis. Simple ray-tracing tools with a crude
geometric model may be sufficient in some cases, and sophisticated Monte Carlo code with
detailed geometry and comprehensive physics interaction models may be required for other
cases. Careful thought and some experience in using them are prerequisites for users. This
section provides a review of radiation shielding and transport codes available to the community,
as well as a top-level overview and a few notable characteristics for each code.
Historically, ray-tracing tools were used out of necessity due to the computational intensity of
Monte Carlo and the difficulty in recreating accurate physical geometries (e.g., electronics boxes,
instruments, spacecraft, etc.). Today, the relevant geometries are directly imported from native

14
computer-aided design (CAD) models, and MC is more easily completed on desktop machines.
Since MC is more precise than ray tracing, it is often the method of choice today, assuming
appropriate CAD models are available.
Section Highlights and Takeaways
• Transport is the process of calculating the radiation environment internal to the skin of the
spacecraft or system for the development of requirements and subsequent part testing. The
target mission environment and the risks from TID, TNID, and SEEs determine the necessity
and types of transport analysis.
• Transport codes are the software used to perform this task and come in multiple variations
that provide options for analysis fidelity with associated tradeoffs (e.g., execution time).
• Transport may be used to determine radiation mitigation methods (e.g., the addition of
shielding or repositioning of avionics box locations or boards within an avionics box).
• Baseline radiation requirements require relevant environments (e.g., trapped particles and
solar protons) be transported through an assumed nominal level of shielding, often 100 mil of
equivalent aluminum, in an idealized geometry such as a semi-infinite slab or solid sphere.
The process then often moves from simple toward more detail to refine the output prediction.
• Advanced transport analysis can include simplified system geometries such as empty boxes
or complex geometries that include full computer-aided design (CAD) drawings of all
material objects.
• Explicitly adding or reconfiguring shielding will likely benefit TID and TNID to a point but
will have limited effects on lowering GCR flux and SEE rates. Shielding changes can also
inadvertently increase ion linear energy transfer spectra, presenting a possible negative
hardness assurance impact. That said, shielding can be beneficial in SPE environments.
4.2 Radiation Effects
Space radiation is a key design consideration for any space mission. Radiation can cause
functional damage or disruption to electronics, materials, and sensors/detectors through TID,
TNID/DDD, SEE, or radiation-induced background noise. Charging (both internal and surface)
induced by space radiation environment can also be important for certain missions, especially
those passing through an aurora region (surface charging) or subjected to high-energy electron
environments (internal charging). However, for the purpose of this guideline, which focuses on
EEEE parts, surface and internal charging are out of scope. Charging and other radiation effects
on materials (e.g., ablation, darkening of optics, changing of thermal properties, etc.) are critical
and need to remain in scope for all space flight programs and projects.
4.2.1 Cumulative Effects
Among these radiation effects, TID, which is a cumulative effect, can place demands on the
spacecraft mass budget (by requiring shielding) and the allowable mission duration (to limit
lifetime TID exposure). TNID can have a similar effect on mission design for the subset of
electronics for which damage is characterized by TNID rather than TID. Whether it is TID or
TNID, radiation transport codes can be used to compute “doses” (energy deposition in the unit
mass of a material) at specific locations within the spacecraft [Jun, Zhu, Martinez-Sierra, & Jun,
2020].

15
4.2.2 Transient or Rate Effects
SEE is a transient effect where a single particle with relatively high linear energy transfer (LET)
can produce an ionization trail along the particle traverse in the sensitive volume within an EEEE
device, sufficient to cause temporary changes in a circuit state or catastrophic failures of the
entire system. For detectors/sensors (e.g., charge-coupled devices (CCDs), complementary metal
oxide semiconductor (CMOS) image sensors (CISs), microchannel plate detectors (MCPs), etc.),
the space environment can generate radiation-induced noise that can temporarily degrade their
functions. Radiation transport codes can also be used to estimating these phenomena. For
example, Reed et al. [Reed 2013] provide a comprehensive review of radiation transport codes
available for SEE (and other radiation effects).
4.3 Radiation Analysis Tools
As discussed earlier, radiation transport codes are used to support the analysis of TID, TNID, and
SEE by propagating radiation environments through various physical structures, perhaps
multiple times during various program and project phases. Depending on methodologies
implemented, transport codes can be classified into two categories: non-MC and MC code. MC
code can be further divided into forward and reverse (also known as adjoint, or time reversal)
codes. Radiation transport codes are desired to be versatile in their geometry modeling capability
and in being able to transport various particles species found in the space environment (i.e.,
electrons, protons, heavy ions, and secondary particles). Secondary particles may include neutral
particles (e.g., neutrons and gammas). There are numerous radiation transport codes available
from various radiation communities; hence, based on common experience this report only
provides brief synopses of a few radiation transport codes that are commonly used in the space
radiation community. This should not be treated as an exhaustive accounting.
4.3.1 Non-Monte Carlo (MC)
There are a few non-MC codes being used in the community, for example, ray-tracing code (also
known as sectoring analysis method) such as FASTRAD [FASTRAD], which uses dose-depth
curves to estimate crude TID or TNID levels at given locations, and deterministic code such as
HZETRN (High-Z and Energy Transport), which numerically solves the time-independent
Boltzmann radiation transport equation in a given geometry with various nuclear interactions
cross sections as inputs, for example, Wilson, Slaba, Badavi, Reddell, & Bahadori [2014]. Note
that the ray-tracing codes are not really “transporting” particles. To calculate the dose received at
a particular point, a specified number of straight rays are emitted from the dose point, distributed
equally in all directions. For each of these rays, the encountered aluminum-equivalent thickness
is computed. The dose received from each ray direction is interpolated from the aluminum dose-
depth curve and an averaging is performed over all directions. Dose-depth curves for any
specific material can be generated using other MC transport codes described in Sections 4.3.2
and 4.3.3. SHIELDOSE-2 is another popular program that can generate the dose-depth curves for
a few selected materials [Seltzer, 1994].
These non-MC codes tend to provide the results quickly, but at the same time their capabilities
can be somewhat limited. For example, ray-tracing codes employ the dose-depth curve for a
single material and cannot include the shielding effectiveness of different materials, and
deterministic codes are restricted to a small number of geometries that can be solved
numerically. Jun, Zhu, Martinez-Sierra, & Jun [2020] and Norbury, Slaba, Sobolevskyb, &

16
Redell [2017] provide the results from comparing FASTRAD and HZETRN to other
representative MC transport codes for a small number of example cases. The FASTRAD Ray
Tracing option is being used frequently for rapid assessment of TID and TNID for electronic
components inside spacecraft structures. HZETRN is typically used for quick-turnaround
radiation shielding design for human exploration vehicles or radiation risk assessments for
astronauts.
4.3.2 Forward Monte Carlo (FMC)
FMC codes follow particles from the source to the targets where local radiation environments or
dosimetry data are desired; thus, they resemble actual physical processes. They are most efficient
when the source is confined in relatively small regions and the targets are distributed in multiple
locations. FMC codes have been developed mainly for nuclear physics, accelerator beam, and
nuclear reactor communities. The use of FMC codes for space radiation applications may not be
numerically efficient where the radiation source region is not confined in space and the target of
interest is small compared with the overall spacecraft dimension, which means a bulk of the
source particles will not be able to reach the target locations (i.e., being “lost”). Thus, the main
use of the FMC codes typically has been for beam condition simulation, design and numerical
simulation of space radiation detectors, nuclear planetary sciences, etc. With faster and more
powerful computing infrastructure widely available, FMC codes can be and are being
increasingly used for applications where dose computations are needed in small component
volumes within large spacecraft.
Among many FMC codes available, Geant4 [Geant4], MCNP (Monte Carlo N-Particles)
[MCNP, 2017], ITS (Integrated Tiger Series) [Ronald, Kensek, Franke, Crawford, & Valdez,
2014], FLUKA (FLUktuierende KAskade) [FLUKA], and the FMC option in FASTRAD
[FASTRAD] might be popular choices for users in the space radiation transport community.
These are 3D and have extensive particle interaction physics options. Geant4, MCNP, FLUKA,
and FASTRAD FMC can transport various types of radiation species, while ITS can only
transport electrons and photons.
4.3.3 Reverse Monte Carlo (RMC)
As the name implies, the RMC codes track particles in time-reversal sense (i.e., from the targets
to the source). They are also called adjoint or backward method codes. The RMC codes are
especially efficient for cases where the radiation source is dispersed in large spatial scale and the
radiation effect computation is desired in a small volume. This exactly resembles the space
radiation transport situation. The most widely used RMC code, NOVICE, was specifically
developed for this situation [Jordan, NOVICE; Jordan, 1976]. (Also see the NOVICE section in
Reed et al. [2013].) NOVICE has been and still is the primary TID/TNID computation tool in the
space radiation shielding community around the world. More recently, another RMC code has
been made available to the community as a part of the FASTRAD package [FASTRAD]. It is
being compared with other FMC and RMC codes in an attempt to validate its usage for space
radiation shielding design applications [Jun, Zhu, Martinez-Sierra, & Jun, 2020; Pourrouquet
et al., 2016].

17
4.4 Summary Table
Examples of space radiation transport analysis for shielding design using the codes described
above are abundant. Selected representative references are listed here for a few application areas:
1. Shielding analysis for Jovian missions [Jun, Zhu, Martinez-Sierra, & Jun 2020; Netherlands
Workshop, 2010; Santin et al., 2010; Cherng, Jun, and Jordan, 2007].
2. Shielding effectiveness of different materials and multi-layers for different environment
conditions (e.g., Martina et al. [2018] and Slaba et al. [2017] for GCR; Mangeret, Carriere,
Beaucour, & Jordan [1996] for electrons and protons at GEO; Ibarmia et al. [2013] for high-
energy electrons; and Atwell, Rojdev, Aghara, and Sriprisan [2013] for GCR and solar
protons).
3. Effects of proton-induced secondary particles [Turflinger et al., 2017; Turflinger et al.,
2015].
4. Secondary neutrons from GCR [Armstrong and Colborn, 2001; Heilbronn et al., 2015].
5. Radiation environment at aviation altitude [Mertens, Meier, Brown, Norman, and Xu, 2013].
Table 4.4-1 summarizes the tools mentioned earlier. The choice of a code for any specific
problem is in many occasions dependent on user preference based on individual experience. For
example, when a monoenergetic electron beam condition needs to be estimated to emulate the
space electron spectrum environment, the one-dimensional module (called TIGER) of ITS may
be desired because it is simple, fast, has accurate electron/photon transport physics implemented,
and is well benchmarked [Jun, 2003]. Of course, this does not mean that other 3D FMC codes
cannot be used for this purpose.
To repeat, some codes are most useful when quick estimates of TID and DDD are needed for
components within complex spacecraft structures (e.g., FASTRAD ray tracing), while other
codes should be used for simulations where detailed particle interactions should be accounted for
in simulations (e.g., Geant4, MCNP, or FLUKA). MC codes are also being used to perform
event-by-event energy deposition scoring in micrometric volumes and are, therefore, relevant for
SEE calculations [Reed et al., 2013; García Alía, 2020]. In some cases, multiple codes are used
to validate simulation results. However, given the time and expertise required, this is usually
limited to dedicated studies with the explicit intent of simulation outcome comparison (e.g., Jun,
Zhu, Martinez-Sierra, & Jun, 2020).
Table 4.4-1. Radiation Transport Tools Summary
Typical
Applications+
Transport Method Geometry
Input*
Run Time
(Qualitatively)
FASTRAD
Ray Tracing
System-level dose
calculations and
shielding analysis for
parts/material at
specific locations
within spacecraft
Ray tracing with input
dose-depth curves of
single material (for
example, aluminum
dose-depth curves
generated by NOVICE,
SHIELDOSE, etc.)
STEP, IGES,
GDML
Fast

18
Typical
Applications+
Transport Method Geometry
Input*
Run Time
(Qualitatively)
HZETRN Shielding design for
GCR and SEP for
human exploration
Deterministic.
Numerical solutions to
the time-independent,
linear Boltzmann
equation
Combinatorial,
Ray thickness
distribution
Fast
ITS Detailed particle
interaction simulations
for parts, materials,
sensors, and detectors
FMC with accurate
physics interaction and
extensive cross-section
databases
Combinatorial,
ACIS
Slow
MCNP Combinatorial Slow
Geant4 Combinatorial,
GDML
Slow
FLUKA Combinatorial Slow
FASTRAD
FMC
STEP, IGES,
GDML
Slow
NOVICE System-level dose
calculations and
shielding analysis for
parts/material at
specific locations
within spacecraft
Adjoint/RMC method
using backward
integration of particles
reached at local/small
detectors
Combinatorial,
VRML
Intermediate
FASTRAD
RMC
STEP, IGES,
GDML
Intermediate
+ Mainly based on the author’s experience at the Jet Propulsion Laboratory (JPL).
* STEP (Standard for the Exchange of Product Model Data); IGES (Initial Graphics Exchange Specification);
GDML (Geometry Description Markup Language); ASIC (ACIS 3D Geometric Modeler
(http://www.spatial.com/)); VRML (Virtual Reality Modeling Language)
4.5 References
Armstrong, T. and Colborn, B., “Predictions of Secondary Neutrons and their Importance to
Radiation Effects inside the International Space Station,” Radiation Measurements, Vol. 33,
2001, pp. 229–234. DOI:10.1016/s1350-4487(00)00152-9.
Atwell, W., Rojdev, K., Aghara, S., and Sriprisan, S., “Mitigating the Effects of the Space
Radiation Environment: A Novel Approach of Using Graded-Z Materials,” AIAA 2013-
5385, September 2013. Available at https://doi.org/10.2514/6.2013-5385
Cherng, M., Jun, I., and Jordan, T. M., “Optimum Shielding in Jovian Radiation Environment,”
Nucl. Instrum. Methods Phys. Res. Sec. A 580, 2007, pp.633–636.
FASTRAD, “FASTRAD, A Radiation Analysis Software,” by TRAD, Toulouse, France.
Available at: http://www.trad.fr/FASTRADSoftware.html
FLUKA. Available at: http://www.fluka.org/fluka.php
García Alía, R., CERN, Personal Communication, 2020.
Geant4, “Geant4 (Geometry and Tracking), A Platform for Particle Transport Simulation using
Monte Carlo Methods.” Available at https://geant4.web.cern.ch/
Heilbronn, L., Borak, T., Townsend, L., Tsai, P., Burnham, C., and McBeth, R., “Neutron Yields
and Effective Doses Produced by Galactic Cosmic Ray Interactions in Shielded

19
Environments in Space,” Life Sciences in Space Research, Vol. 7, November 2015, pp. 90–
99. Available at https://doi.org/10.1016/j.lssr.2015.10.005.
Ibarmia, S., Eck, J., Ivanchenko, V., et al., "Experimental Dose Enhancement in Multi-Layer
Shielding Structures Exposed to High-Energy Electron Environments," IEEE Transactions
on Nuclear Science, Vol. 60, No. 4, August 2013, pp. 2486–2493.
Jordan, T. M., “An Adjoint Charged Particle Transport Method,” IEEE Trans. Nucl. Sci.,
Vol. NS-23, No. 6, December 1976, pp. 1857–1861.
Jordan, T. M., “NOVICE a Radiation Transport/Shielding Code,” Experimental and
Mathematical Physics Consultants, Rep.EMP.L82.001. 2982. Available at https://empc.com/
Jun, B., Zhu, B. X., Martinez-Sierra, L. M., and Jun, I. “Intercomparison of Ionizing Doses from
Space Shielding Analyses Using MCNP, Geant4, FASTRAD, and NOVICE,” IEEE Trans.
Nucl. Sci., Vol. 67, No. 7, 2020, pp. 1629–1636. DOI:10.1109/TNS.2020.2979657.
Jun, B., Zhu, X., Martinez-Sierra, L., and Jun, I., “Inter-Comparison of Ionizing Doses from
Space Shielding Analyses using MCNP, Geant4, FASTRAD, and NOVICE,” IEEE
Transactions on Nuclear Science, 2020. Available at
https://doi.org/10.1109/TNS.2020.2979657
Jun, I. and McAlpine, W., “Displacement Damage in Silicon due to Secondary Neutrons, Pions,
Deuterons, and Alphas from Proton Interactions with Materials,” IEEE Transactions on
Nuclear Science, Vol. 48, No. 6, 2001, pp. 2034–2038.
Jun, I., “Benchmark Study for Energy Deposition by Energetic Electrons in Thick Elemental
Slabs: Monte Carlo Results and Experiments,” IEEE Trans. Nucl. Sci., Vol. 50, No. 5,
October 2003, pp. 1732–1739.
Jun, I., “Effects of Secondary Particle on the Total Dose and the Displacement Damage in Space
Proton Environments,” IEEE Transactions on Nuclear Science, Vol. 48, No. 1, 2001, pp.
162–175.
Jun, I., Kang, S., Santin, G., and Nieminen, P., Shielding Code Comparison: A Simple
Benchmark Problem,” EJSM Instrument Workshop, Noordwijk, Netherlands, January 8–10,
2010. Available at https://sci.esa.int/documents/34530/36042/1567253749508-
EJSM3IW_06_ESA_Instrument_WS_Shielding_v15.pdf.
Mangeret, R., Carriere, T., Beaucour, J., and Jordan, T., “Effects of Material and/or Structure on
Shielding of Electronic Devices,” IEEE Transactions on Plasma Science, Vol. 43, No. 6,
1996.
Martina, G., Christoph, S., Uli, W., Marta, R., Giovanni, S., John, W. N., Emanuele, T.,
Alessandra, M., Luca, B., Cesare, L., Marco, D., and Chiara La, T., “Accelerator-Based Tests
of Shielding Effectiveness of Different Materials and Multilayers using High-Energy Light
and Heavy Ions,” Radiation Research, Vol. 190, No. 5, August 2018, pp. 526-537.
Mertens, C., Meier, M. M., Brown, S., Norman, R. B., and Xu, X., “NAIRAS Aircraft Radiation
Model Development, Dose Climatology, and Initial Validation,” Space Weather, Vol. 11, pp.
603–635, 2013. DOI:10.1002/swe.20100.
MNCP, “MCNP User’s Manual Code,” Version 6.2, LA-UR-17-29981, 2017.

20
Norbury, J. W., Slaba, T. C., Sobolevskyb, N., and Redell, B., “Comparing HZETRN, SHIELD,
FLUKA and GEANT Transport Codes,” Life Science in Space Research, Vol. 14, 2017, pp.
64–73, 2017. Available at https://doi.org/10.1016/j.lssr.2017.04.001
Pourrouquet, P., Varotsou, A., Sarie, L., Thomas, J-C., Chatry, N., Standarovski, D., Rolland, G.,
and Barillot, C., “Comparative Study between Monte-Carlo Tools for Space Applications,”
Proceedings of the16th Eur. RADECS, Conference paper number C1, September 19–23,
2016.
Reed, R., Weller, R. A., Akkerman, A., Barak, J., Culpepper, W., et al., “Anthology of the
Development of Radiation Transport Tools as Applied to Single Event Effects,” IEEE
Transactions on Nuclear Science, Vol. 60, 2013, pp. 1876–1911.
Ronald, T. W. L., Kensek, P., Franke, B. C., Crawford, M. J., and Valdez, G. D., “ITS Version
6.4: The Integrated TIGER Series of Monte Carlo Electron/Photon Radiation Transport
Codes,” ANS RPSD 2014, 18th Topical Meeting of the Radiation Protection and Shielding
Division of the American Nuclear Society, Knoxville, TN, LaGrange Park, IL, September
14–18, 2014.
Santin, G. Kamg, S. Jun, I., Nieminen, P., et al., “A Radiation Transport Code Benchmarking
Study for the EJSM Mission,” IEEE Nuclear Science Symposium & Medical Imaging
Conference, 10.1109/NSSMIC.2010.5873852, November 2010.
Seltzer, S. M., “Updated Calculations for Routine Space-Shielding Radiation Dose Estimates:
SHIELDOSE-2,” Technical Report PB95-171039, National Institute of Standards and
Technology, Gaithersburg, MD, December 1994.
Slaba, T. C., Bahadori, A. A., Reddell, B. D., Singleterry, R. C., Clowdsley, M. S., and Blattnig,
S. R., “Optimal Shielding Thickness for Galactic Cosmic Ray Environments,” Life Sciences
in Space Research, Vol. 12, February 2017, pp. 1–15.
Turflinger, T. L., Clymer, D. A., Mason, L. W., Stone, S., George, J. S., Koga, R., Beach, E., and
Huntington, K., “Proton on Metal Fission Environments in an IC Package: An RHA
Evaluation Method,” IEEE Trans. Nucl. Sci., Vol. 64, No. 1, 2017, pp. 309-316.
DOI:10.1109/TNS.2016.2626960.
Turflinger, T. L., Clymer, D. A., Mason, L. W., Stone, S., George, J. S., Savage, M., Koga, R.,
Beach, E., and Huntington, K., “RHA Implications of Proton on Gold-Plated Package
Structures in SEE Evaluations,” IEEE Trans. Nucl. Sci., Vol. 62, No. 6, November 2015, pp.
2468–2475. DOI:10.1109/TNS.2015.2496288.
Wilson, J. W., Slaba, T. C., Badavi, F. F., Reddell, B. D., and Bahadori, A. A., “Advances in
NASA Radiation Transport Research: 3DHZETRN,” Life Sci. Space Res., Vol. 2, 2014, pp.
6–22.

21
5.0 Total Ionizing Dose (TID)
Return to Main
5.1 Section Summary
In some ways, TID is the oldest radiation effect, or certainly the one under study the longest, in
addition to displacement damage (see Section 9). Its roots can be traced back to the beginning of
the radiation effects community when research was focused on effects in bulk materials in a
variety of environments. Since that time, and as bulk material studies have given way to more
sophisticated effects in SOTA microelectronics, TID remains a critical component of RHA for
every type of space system [McLean & Oldham, 1987; Oldham & McLean, 2003; Pease, 2004;
Poivey, 2017]. The following content is based in large part on the 2017 Institute of Electrical and
Electronics Engineers (IEEE) Nuclear and Space Radiation Effects Conference (NSREC) short
course given by Christian Poivey [Poivey, 2017] and draws on other significant sources from the
past 40 years.
Section Highlights and Takeaways
• TID is a target-dependent accumulation of energy deposited (i.e., absorbed dose) in bulk
materials within an EEEE component due to incident ionizing radiation. TID can affect
EEEE components regardless of bias condition, including cold spares2. Users should not
presume to know worst-case operating conditions in the absence of adequate data for similar
environments and applications. Worst-case conditions for a given mission, environment, and
application are usually determined by test or detailed analysis of relevant existing data.
2 Cold spare refers to any device that requires configuration and/or adjustment in the event of issues or total failure.
Cold spares are usually stored in an unbiased condition (not powered). A cold spare may be an internal or external
computing component that is usually present in non-redundant systems with only one device instance.

22
• TID may cause parametric and/or functional (i.e., electrical performance, power
consumption, etc.) degradation up to and including hard failures. TID degradation modes are
cumulative and characterized as an increasing failure probability as dose accumulates over
the mission.
• TID parametric degradation may or may not cause system performance issues or failures,
depending on the overall circuit application and design margins.
• TID testing typically uses a gamma ray source; however, proton, electron, and X-ray sources
may be considered for specific missions or environment concerns.
• Radiation design margins (RDMs) on test requirements should account for both space
environment variability and the variability of EEEE component responses, particularly for
COTS electronics. Given that RDM is an ad hoc approach that can result in under- or over-
specifying requirements, NASA is moving toward quantifiable assurance methods that use
uniform confidence levels based on sophisticated space environment models.
• A criticality assessment process for TID similar to what is available for SEEs needs to be
developed.
5.2 Physical Mechanisms
TID is the absorbed dose in a target material resulting from the energy deposition of ionizing
radiation. It is equal to the energy deposited per unit mass of medium, which can be measured as
joules per kilogram and represented by the equivalent International System of Units (SI) unit,
gray (1 Gy = 1 J/kg), or the older centimeter–gram–second (CGS) unit, rad (1 rad = 100 erg/g).
The electronics radiation effects community in the United States tends to use rad instead of Gy.
The absorbed dose depends not only on the incident radiation but also on the absorbing material,
so absorbed dose must be reported as a function of target material (e.g., rad(SiO2) or Gy(Si)).
Dependence on target material is one complicating factor that can make TID more difficult to
assess as part of the RHA process.
In the space environment, TID usually results from exposure to protons and electrons over a
period of time from both trapped radiation in planetary magnetic fields and SPEs. TID and TNID
(covered in Section 9) are cumulative radiation effects, which make them fundamentally
different from SEE (discussed in Section 10).
TID produces electron-hole pairs within the semiconductor and insulating materials (e.g.,
oxides). Some of this charge is trapped in insulators or leads to the formation of interface states
at the semiconductor-insulator surface [Fleetwood, 1995; McLean & Oldham, 1987; Oldham &
McLean, 2003]. In metal-oxide-semiconductor (MOS) structures, the trapped charge causes a
shift in the gate threshold voltage. Since the trapped charge resulting from ionization is positive,
N-type metal-oxide-semiconductor field effect transistors (MOSFETs) experience a reduction in
threshold voltage and are not always completely switched off when no external bias is applied.
Conversely, p-type MOSFETs experience an increase in threshold voltage and become harder to
drive. TID also plays a role in creating leakage paths under and around isolation oxides, which
increases parasitic power consumption and can result in other functional complications if the
device threshold shifts are large enough to cause inversion regions. In SOTA technologies,
where the gate oxides are extremely thin and the isolation oxides have smaller volumes, these
effects have tended to become less concerning for many civil space missions. However, some of
the newer 3D transistor geometries and ultra-thin body silicon on insulator devices are

23
challenging this general rule of thumb. RHA professionals should not assume that “SOTA” is a
proxy for TID immunity in CMOS processes.
Figure 5.2-1. IB+ versus Total Dose for LM111s [adapted from Shaneyfelt et al., 2000]
In bipolar devices, trapped charges in oxide layers cause two different effects. The traps increase
surface recombination, decreasing the gain of bipolar transistors. If the trap density is high
enough, an inversion layer can be created in p-doped regions that increase the surface area of the
junction. This also affects transistor gain and can cause substantial increases in leakage current
[Pease, Turfler, Platteter, Emily, & Blice, 1983]. Bipolar and bipolar-CMOS (BiCMOS)
technologies can also suffer from enhanced low dose-rate sensitivity (ELDRS), where device
electrical parameters can degrade more under low-dose-rate conditions (e.g., the natural space
environment) than under high-dose-rate conditions (e.g., accelerated/standard TID testing)
[Enlow, Pease, Combs, Schrimpf, & Nowlin, 1991; Johnston, Rax, & Lee, 1995; Johnston,
Swift, & Rax, 1994; McClure, Pease, Will, & Perry, 1994]. An example of ELDRS in a LM111
voltage comparator is shown in Figure 5.2-1 [Shaneyfelt et al., 2000], which plots TID for
LM111s subjected to 175 °C, 300-hr pre-irradiation elevated-temperature stress (PETS). The
devices were irradiated at 0.01 (triangles) and 50 rad(SiO2)/s (circles) with all pins shorted.
Following the 50 rad(SiO2)/s irradiation, the devices were annealed at room temperature with all
pins shorted for a time equivalent to the low dose rate irradiation (open circles).
5.3 Susceptible Devices
This subsection contains a high-level view of TID effects for important device-type categories
that often appear in avionics and instrumentation hardware. It is important to remember that TID
can affect technologies whether they are biased or unbiased during ground irradiation or mission
operations. Radiation engineers may not know worst-case bias conditions a priori, which can be
important for cold spares or low duty cycle hardware, so both biased and unbiased irradiation
data may need to be collected to appropriately capture risks.

24
Table 5.3-1 includes the following general technology and device categories. This technology
and effect list is intended to be broadly applicable but may not be inclusive for all applications.
• Active Pixel Sensors (APSs) or CISs.
• Analog microcircuits.
• Significant focus tends to be on linear bipolar microcircuits but can also include analog
portions of mixed-signal devices (e.g., data converters and other embedded functions,
etc.).
• Whether divergent behavior is consequential for a given mission will depend on several
factors (e.g., design margin, biased versus unbiased pathology, irradiated performance
versus control samples, etc.), but should never be dismissed as an outlier without detailed
consideration.
• Bipolar transistors,
• Applies to bipolar transistors in BiCMOS technologies as well as Heterojunction Bipolar
Transistors.
• CCDs.
• Digital microcircuits.
• Whether divergent behavior is consequential for a given mission will depend on several
factors (e.g., design margin, biased versus unbiased pathology, irradiated performance
versus control samples, etc.) but should never be dismissed as an outlier without detailed
consideration.
• Junction Field Effect Transistors (JFETs).
• MOS transistors.
• Applicable to MOS devices in hybrid devices.
• Some effects may also be applicable to embedded MOS capacitors in predominantly
bipolar microcircuits.
• Solar cells.
Table 5.3-1. Potentially Susceptible Technologies and Impacted Parameters
Technology / Type Parameters
APS and CIS
Effects are generally the same as CCD (except charge transfer
efficiency (CTE)) changes to MOS-based circuitry, including
changes in pixel amplifier gain
Analog Microcircuits Offset voltage, offset current, and bias-current changes; gain
degradation; etc.
Bipolar Transistors Transistor gain (e.g., hFE) degradation, especially at low collector
current, and increases in leakage current
CCD Increased dark current, effects on (CTE), and effects on MOS
transistor circuits
Digital Microcircuits Enhanced transistor leakage, logic failure due to decreases in gain,
changes in threshold voltage and switching speed, etc.
JFET Enhanced source-drain leakage current
MOS Transistors Threshold voltage shifts, decreases in drive current and switching
speed, and increases in leakage current
Solar Cells Increased light absorption (darkening) of coating material, which
reduces solar cell efficiency

25
5.4 Overview of Piece-Part Hardness Assurance
At the system level, there are many approaches to mitigate the effects of radiation on parts
[Lum, 2004]. However, the current TID hardness assurance is based on working at the piece-part
level. This is a methodology to assure that microelectronic piece-parts meet specified
requirements for system operation at specified radiation levels for a given probability of survival
(PS) and a level of confidence (C). The requirement for system operation allows for a failure
definition that is determined by the application of the part in the system; other definitions of
failure include failure to meet specifications (e.g., pre- or post-irradiation) and functional failure.
The requirement to meet a specified radiation level allows the testing of parts as a function of
radiation environment and comparison of the radiation failure level of the part to the
specification level. The specification of the PS and C for the part allows development of
statistical approaches for sample testing of the piece parts [Pease, 2004]. The basic principles of
TID piece-part RHA were laid out by U.S. military and space agencies in the mid-1970s (e.g.,
MIL-HDBK-814). To date, these principles are generally applied in the development of space
systems. Other related examples include the European Standard of Radiation Hardness
Assurance, ECSS-Q-ST-60-15C [Marec, 2015; Poivey, 2011].
For any system’s piece-part hardness assurance program, designers and RHA engineers must
start with the application of the part in the system. The application will determine the failure
level of the part, and the system’s mission, environment (e.g., orbit, trajectory), lifetime duration,
and location of the part in the system will determine the rest of the parameter space. When they
are defined, the PS and C for the piece-parts are based on the overall system PS and C. In the
methodology described in Figure 5.4-1, based on MIL-HDBK-814, all the microelectronic piece
parts are categorized for each system application and each radiation environment based on a
radiation design margin [Pease, 2004; Poivey, 2017]. The RDM is defined as the radiation failure
level of the part, Rf, divided by the radiation specification level, Rspec. However, based on the
statements in the previous paragraph, there are multiple definitions of failure, so it is important to
be specific as to whether failure is intended to be application-specific based on data sheet
specification violations, or functional. The failure levels of the individual samples in the
radiation data are determined from the degradation of performance of the part as a function of the
radiation environment and the failure criteria determined by the application of the part.
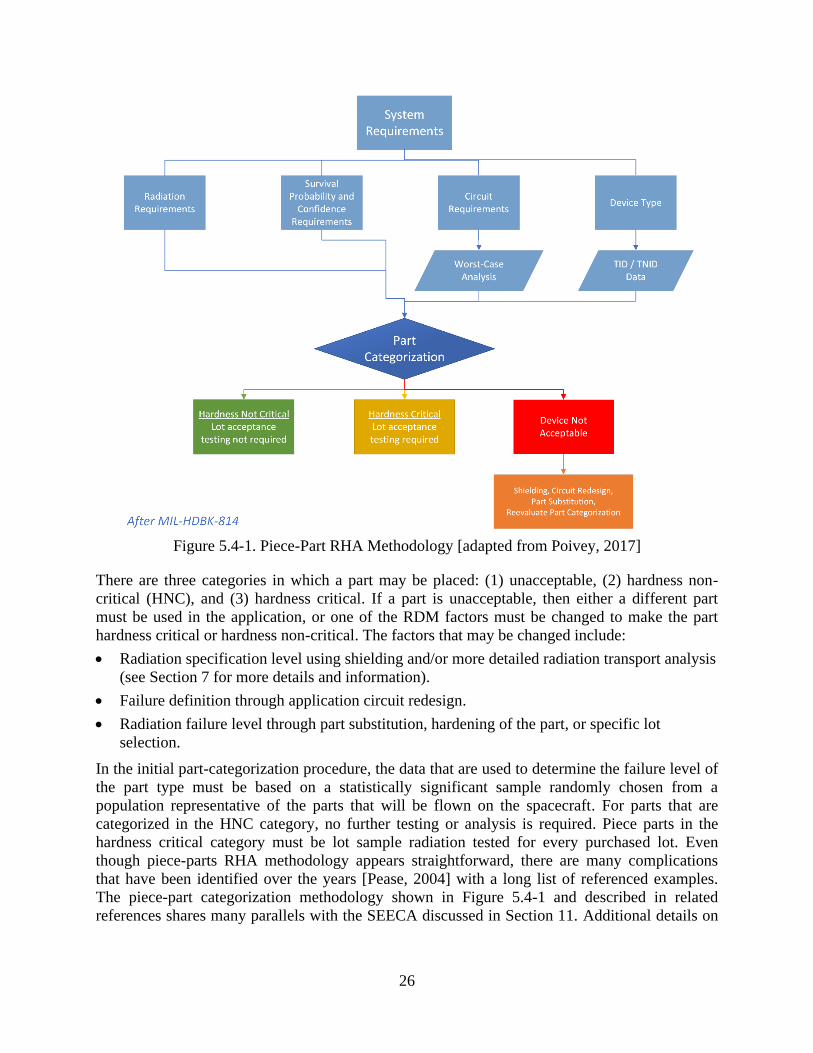
26
Figure 5.4-1. Piece-Part RHA Methodology [adapted from Poivey, 2017]
There are three categories in which a part may be placed: (1) unacceptable, (2) hardness non-
critical (HNC), and (3) hardness critical. If a part is unacceptable, then either a different part
must be used in the application, or one of the RDM factors must be changed to make the part
hardness critical or hardness non-critical. The factors that may be changed include:
• Radiation specification level using shielding and/or more detailed radiation transport analysis
(see Section 7 for more details and information).
• Failure definition through application circuit redesign.
• Radiation failure level through part substitution, hardening of the part, or specific lot
selection.
In the initial part-categorization procedure, the data that are used to determine the failure level of
the part type must be based on a statistically significant sample randomly chosen from a
population representative of the parts that will be flown on the spacecraft. For parts that are
categorized in the HNC category, no further testing or analysis is required. Piece parts in the
hardness critical category must be lot sample radiation tested for every purchased lot. Even
though piece-parts RHA methodology appears straightforward, there are many complications
that have been identified over the years [Pease, 2004] with a long list of referenced examples.
The piece-part categorization methodology shown in Figure 5.4-1 and described in related
references shares many parallels with the SEECA discussed in Section 11. Additional details on

27
radiation testing and analysis, as well as foundational information on sample statistics, can be
found in Section 12 and Appendix E.
5.5 Challenges Introduced by Uncertainties in the Environment and Part-Level
Radiation Performance
The radiation environment for a mission depends on the orbital parameters of the mission, the
foreseen epoch for launch, and the mission duration. Transfer orbits may also present important
parameters, especially for spiral orbit raising trajectories such as those used with electric
propulsion systems, since they can expose systems to prolonged exposure to trapped radiation in
planetary magnetospheres. For TID, environment uncertainty is confined to trapped radiation
environments and SPEs since GCRs do not represent a significant absorbed dose contribution.
Given that the space environment can have large spatiotemporal variations, uncertainty in space
climate models is unavoidable and part of the hardness assurance process that establishes
appropriate design margins and prediction confidence levels.
For this guideline document, which references the Cross-Program DSNE, AE8 [Vette, 1991] and
AP8 [Sawyer & Vette, 1976] are the standard models for trapped energetic particles near Earth.
The DSNE also uses the Emission of Solar Protons (ESP) [Xapsos et al., 2004] and Prediction of
Solar particle Yields for CHaracterizing Integrated Circuits (PSYCHIC) [Xapsos, Stauffer,
Jordan, Barth, & Mewaldt, 2007] models to address solar proton and solar heavy ion fluences.
More details about these models are available in Barth [1997, 2009] and Xapsos [2006], and
associated references. Since these original models were introduced, new solar cycle observations,
data, and models have been gathered and produced. Choosing between available models can also
introduce systematic uncertainty but may offer the opportunity to capitalize on new model
features that could benefit the overall hardness assurance program. Care should be used in any
case.
The top-level TID environment is represented by the dose depth curve, an example of which is
shown in Figure 5.5-1. Dose depth curves can also show the integrated dose for an entire mission
if the total duration and trajectory is known a priori. This type of presentation can provide dose
as a function of shield thickness in a planar geometry or as a function of spherical shielding
about a point. The spherical model gives a conservative estimate of the dose received. The planar
model is appropriate for surface materials or for locations near a planar surface. Dose-depth
calculations such as this are usually performed with a tool such as SHIELDOSE-2 [Seltzer,
1994], which has been integrated into many different platforms, such as the SPace ENVironment
Information System (SPENVIS) [https://www.spenvis.oma.be/]. More complex radiation
transport methodologies are addressed in Section 7, including ray trace (sector) analysis and 3D
MC. These other techniques facilitate the inclusion of more realistic spacecraft geometries,
which can help refine more simplistic dose-depth estimates [Pellish et al., 2010; Xapsos et al.,
2014].

28
Figure 5.5-1. After Figure 3.3.1.1-4 from Revision G of the DSNE, representing daily Trapped
Radiation Belt TID inside Shielding for ISS Orbit
Knowledge of the radiation tolerance of sensitive parts is essential to the overall hardness
assurance program. To obtain the data, the space radiation environment must be simulated in the
laboratory. Although attempts are often made to replicate the space environment to the greatest
extent possible by irradiating with the same particle type, energy, and fluxes encountered in
space, more often the dominant effect of the radiation is simulated with a convenient radiation
source to reduce cost and technical challenges. For the TID, the damage is caused by the
ionization energy absorbed by the sensitive materials. This implies that a wide variety of
ionization sources can be used for simulation, particularly the generation of Compton electrons
from high-energy incident photons. However, the total dose response is also a strong function of
the dose rate.
Details on ionization process mechanisms are beyond the scope of the current guideline
document. However, while there are number of ways to induce TID in EEEE piece parts and
components, including high-energy photons, electrons, protons, and heavy ions, >1 MeV gamma
rays produced by appropriate radioisotope sources continue to be the preferred means in space
radiation standards, such as European Space Components Coordination (ESCC) Basic
Specification No. 22900 or MIL-STD-883 Test Method 1019. It is possible to consider other TID
radiation sources on a case-by-case basis, such as lower energy gamma rays, high-energy protons
(e.g., ≥50 MeV), electrons, or 10 keV X-rays, but cognizant engineers need to remain vigilant for
things like electron-hole pair yield and the effects of high particle density recombination.
Although the radiation facilities used to simulate the environment are a major factor in radiation
testing and are source of large uncertainties [Stassinopoulos & Brucker, 1991], another important
factor is the simulation of the operating conditions of the devices. The failure mechanisms of
many microelectronic devices exposed to radiation are a strong function of the operating bias,
operating mode (standby or active), and temperature. Devices are usually characterized under a

29
variety of test conditions to find the worst-case operating conditions. The temperature of many
space electronics systems is controlled to be within a range of 0 to 80 °C. Failure levels within
this range usually do not vary significantly from room temperature, where most radiation testing
is performed. There are some space applications, however, where temperature extremes are
encountered (e.g., cryogenic electronics for certain detectors and high temperatures for some
space power systems). In these cases, the failure levels can be significantly different from those
measured at room temperature, and the testing should be performed at the appropriate
temperature. For more details on radiation testing and analysis, as well as foundational
information on sample statistics, please refer to Section 12 and Appendix E.
Section 12.0 covers additional TID RHA issues related to part-to-part response variation, which
can also have a significant impact on application performance uncertainty, perhaps equal to or
greater than environment-related uncertainty. Bounding radiation responses for a given mission,
application, and lifetime requires the union of environment and device uncertainty. Combining
these two sources of variability is an area of current study with the radiation effects community.
5.6 Future Advancements
Looking forward, hardness assurance for TID radiation, and for TNID as well, is likely to evolve
beyond the traditional concept of radiation design margin. This is driven in part by the
availability of more sophisticated trapped radiation environment models, which permit
simulation output based on confidence level, thereby making them compatible with solar particle
modeling. Xapsos et al. [2017] demonstrated the RHA possibilities for this kind of approach.
While this work has already proved to be a valuable approach for connecting environment
modeling directly to RHA, it must be coupled with statistical modeling approaches that can
capture variability at the piece-part level to form a complete description of uncertainty sources.
Such unified techniques likely will be available in literature during calendar year 2021 and
should quickly find their way into SOTP for RHA processes.
5.7 References
Barth, J. L., “Evolution of the Radiation Environments,” Paper presented at the Radiation Effects
on Components and Systems Conference Short Course, Bruges, Belgium, 2009.
Barth, J. L., “Modeling Space Radiation Environments,” Paper presented at the Nuclear and
Space Radiation Effects Short Course, Snowmass Village, CO, 1997.
Enlow, E. W., Pease, R. L., Combs, W., Schrimpf, R. D., and Nowlin, R. N., “Response of
Advanced Bipolar Processes to Ionizing Radiation,” IEEE Trans. Nucl. Sci., Vol. 38, No. 6,
1991, pp. 1342–1351. DOI:10.1109/23.124115.
Fleetwood, D. M., “A First-Principles Approach to Total-Dose Hardness Assurance,” Paper
presented at the Nuclear and Space Radiation Effects Conference Short Course, Madison,
WI, 1995.
Johnston, A. H., Rax, B. G., and Lee, C. I., “Enhanced Damage in Linear Bipolar Integrated
Circuits at Low Dose Rate,” IEEE Trans. Nucl. Sci., Vol. 42, No. 6, 1995, pp. 1650–1659.
DOI:10.1109/23.488762.
Johnston, A. H., Swift, G. M., and Rax, B. G., Total Dose Effects in Conventional Bipolar
Transistors and Linear Integrated Circuits,” IEEE Trans. Nucl. Sci., Vol. 41, No. 6, 1994, pp.
2427–2436. DOI:10.1109/23.340598.

30
Lum, G. K., “Hardness Assurance for Space Systems,” Paper presented at the Nuclear and Space
Radiation Effects Conference Short Course, Atlanta, GA, 2004.
Marec, R., “TID Radiation Hardness Confirmation Procedure for Electronic Components and
Systems in Europe and USA,” Paper presented at the Radiation Effects on Components and
Systems Short Course, Moscow, Russia, 2015.
McClure, S., Pease, R. L., Will, W., and Perry, G., “Dependence of Total Dose Response of
Bipolar Linear Microcircuits on Applied Dose Rate,” IEEE Trans. Nucl. Sci., Vol. 41, No. 6,
1994, pp. 2544–2549. DOI:10.1109/23.340614.
McLean, F. B. and Oldham, T. R., “Basic Mechanisms of Radiation Effects on Electronic
Materials, Devices, and Integrated Circuits,” Paper presented at the Nuclear and Space
Radiation Effects Short Course, Snowmass, CO, 1987.
Oldham, T. R. and McLean, F. B., “Total Ionizing Dose Effects in MOS Oxides and Devices,”
IEEE Trans. Nucl. Sci., Vol. 50, No. 3, 2003, pp. 483–499. DOI:10.1109/tns.2003.812927.
Pease, R. L., “Microelectronic Piece Part Radiation Hardness Assurance for Space Systems,”
Paper presented at the Nuclear and Space Radiation Effects Conference Short Course,
Atlanta, GA, 2004.
Pease, R. L., Turfler, R. M., Platteter, D., Emily, D., & Blice, R., “Total Dose Effects in
Recessed Oxide Digital Bipolar Microcircuits,” IEEE Trans. Nucl. Sci., Vol. 30, No. 6, 1983,
pp. 4216-4223. DOI:10.1109/TNS.1983.4333111.
Pellish, J. A., Xapsos, M. A., Stauffer, C. A., Jordan, T. M., Sanders, A. B., Ladbury, R. L., . . .
Rodbell, K. P., Impact of Spacecraft Shielding on Direct Ionization Soft Error Rates for Sub-
130 nm Technologies. IEEE Trans. Nucl. Sci., 57(6), 2010, pp. 3183-3189.
Poivey, C., Total Ionizing and Non-Ionizing Dose Radiation Hardness Assurance. Paper
presented at the Nuclear and Space Radiation Effects Conference Short Course, New
Orleans, LA, 2017.
Poivey, C., “European Cooperation for Space Standardization (ECSS) Radiation Hardness
Assurance (RHA) Standard,” Paper presented at the Radiation Effects on Components and
Systems Conference Short Course, Seville, Spain, 2011.
Sawyer, D. M., and Vette, J. I., “AP-8 Trapped Proton Environment for Solar Maximum and
Solar Minimum,” National Space Science Data Center (NSSDC), 1976.
Seltzer, S. M., “Updated Calculations for Routine Space-Shielding Radiation Dose Estimates:
SHIELDOSE-2,” (NISTIR 5477), Gaithersburg, MD: National Institute of Standards and
Technology, 1994.
Shaneyfelt, M. R., Schwank, J. R., Witczak, S. C., Fleetwood, D. M., Pease, R. L., Winokur, P.
S., . . . Hash, G. L., “Thermal-Stress Effects and Enhanced Low Dose Rate Sensitivity in
Linear Bipolar ICs,” IEEE Trans. Nucl. Sci., Vol. 47, No. 6, 2000, pp. 2539–2545.
DOI:10.1109/23.903805.
Stassinopoulos, E. G., and Brucker, G. J., “Shortcomings in Ground Testing, Environment
Simulations, and Performance Predictions for Space Applications,” Paper presented at the
Radiation Effects on Components and Systems Short Course, La Grande Motte, France,
1991.

31
Vette, J. I., “The AE-8 Trapped Electron Model Environment,” National Space Science Data
Center (NSSDC), 1991.
Xapsos, M. A., “Modeling the Space Radiation Environment,” Paper presented at the Nuclear
and Space Radiation Effects Conference Short Course, Ponte Vedra Beach, FL, 2006.
Xapsos, M. A., Stauffer, C., Gee, G. B., Barth, J. L., Stassinopoulos, E. G., and McGuire, R. E.
“Model for Solar Proton Risk Assessment,” IEEE Trans. Nucl. Sci., Vol. 51, No. 6, 2004, pp.
3394–3398.
Xapsos, M. A., Stauffer, C., Jordan, T., Barth, J. L., and Mewaldt, R. A., “Model for Cumulative
Solar Heavy Ion Energy and Linear Energy Transfer Spectra,” IEEE Trans. Nucl. Sci., Vol.
54, No. 6, 2007, pp. 1985-1989.
Xapsos, M. A., Stauffer, C., Jordan, T., Poivey, C., Haskins, D. N., Lum, G., . . . LaBel, K. A.,
“How Long Can the Hubble Space Telescope Operate Reliably? A Total Dose Perspective,”
IEEE Trans. Nucl. Sci., Vol. 61, No. 6, 2014, pp. 3356–3362.
DOI:10.1109/TNS.2014.2360827.
Xapsos, M. A., Stauffer, C., Phan, A., McClure, S. S., Ladbury, R. L., Pellish, J. A., . . . LaBel,
K. A., “Inclusion of Radiation Environment Variability in Total Dose Hardness Assurance
Methodology,” IEEE Trans. Nucl. Sci., Vol. 64, No. 1, 2017, pp. 325–331.
DOI:10.1109/tns.2016.2607021.
5.7.1 Useful Standards and Additional References for TID
“Environmental Test Methods for Microcircuits – Part 1 (1000-1999),” MIL-STD-883-1.
“General Specification for Hybrid Microcircuits,” MIL-PRF-38534.
“General Specification for Integrated Circuits (Microcircuits) Manufacturing,” MIL-PRF-38535.
“General Specification for Semiconductor Devices,” MIL-PRF-19500.
“Ionizing Dose and Neutron Hardness Assurance Guidelines for Microcircuits and
Semiconductor Devices,” MIL-HDBK-814.
“Space Engineering, Calculation of Radiation and its Effects and Margin Policy Handbook,”
European Cooperation for Space Standardization (ECSS) Handbook, ECSS-E-HB-10-12A,
December 17, 2010.
“Space Engineering, Space Environment, European Cooperation for Space Standardization
(ECSS) Standard, ECSS-E-ST-10-04C, June 15, 2020.
“Space Product Assurance, Commercial Electrical, Electronic, and Electromechanical (EEE)
Components,” European Cooperation for Space Standardization (ECSS) Standard, ECSS-Q-
ST-60-13C, October 21, 2013.
“Standard Guide for Analysis of Overtest Data in Radiation Testing of Electronic Parts,” ASTM
F1263.
“Standard Guide for Ionizing Radiation (Total Dose) Effects Testing of Semiconductor
Devices,” ASTM F1892.
“Test Methods for Semiconductor Devices,” MIL-STD-750.

32
“Total Dose Steady-State Irradiation Test Method,” ESCC Basic Specification 22900,
ESCC22900, Issue 5, June 2016.
Buchner, S. P., Marshall, P. W., Kniffin, S., and LaBel, K. A., “Proton Test Guideline
Development: Lessons Learned,” Goddard Space Flight Center, 2002. Retrieved from
https://radhome.gsfc.nasa.gov/radhome/papers/Proton_testing_guidelines_2002.pdf.
Reed, R. A., “Guideline for Ground Radiation Testing and Using Optocouplers in the Space
Radiation Environment,” Goddard Space Flight Center, 2002. Retrieved from
https://radhome.gsfc.nasa.gov/radhome/papers/2002_opto.pdf.
Space Product Assurance, Radiation Hardness Assurance – EEE Components,” European
Cooperation for Space Standardization (ECSS) Standard, ECSS-Q-ST-60-15C, October 1,
2012.
Test Method 1019: Ionizing Radiation (Total Dose) Test Procedure,” from MIL-STD-883 for
microcircuits and MIL-STD-750 for semiconductor devices.

33
6.0 Total Non-ionizing Dose (TNID)/Displacement Damage Dose (DDD)
Return to Main
6.1 Section Summary
This section discusses radiation-induced displacement damage and the potential for degradation
of materials and devices in a space environment from TNID. An overview of the physical
mechanisms of displacement damage and the impact on device performance, as well as a general
list of susceptible components, is provided. Attention to detectors and their operation constraints
warrants subject matter expertise; temperature, materials, annealing, and modeling of this
behavior are not straightforward calculations. Calculation of the total DDD deposited within an
operating environment, and the methodology for emulating that dose using ground-based testing,
is outlined but is only relevant for informed testing based on a particular device physics.
Section Highlights and Takeaways
• TNID is an incident radiation, energy, and target-dependent accumulation of non-ionizing
energy deposited (e.g., nuclear stopping power fraction) in bulk materials within an EEEE
component due to incident particle radiation. TNID is usually not bias dependent, whereas
TID can be.
• TNID may cause parametric and/or functional (i.e., electrical performance, power
consumption, etc.) degradation up to and including failure. TNID degradation modes are
cumulative and characterized as an increasing failure probability as dose accumulates over
the mission.
• TNID parametric degradation may or may not cause system performance issues or failures,
depending on the overall circuit application and performance design margins.
• Damage versus energy tends to be uncertain with some materials (e.g., II-VI, III-V);
therefore, testing must be performed with energies representative of those in the devices’

34
environment. TNID testing uses a range of particle sources and energies: 50- to 60-MeV
protons are common test energies but can be reduced to 10 MeV for energy dependence
comparison checks and easier beam collimation; solar cells have much less shielding and
focus on lower energies (e.g., 3- to 10-MeV protons and 1-MeV electrons).
• RDMs on test requirements should account for space environment variability and the
variability of EEEE component responses, particularly for COTS electronics. Given that
RDM is an ad hoc approach that can result in under- or over-specifying requirements, NASA
is moving toward quantifiable assurance methods that use uniform confidence levels based
on sophisticated space climate models.
6.2 Physical Mechanisms
An energetic particle incident on a material can deposit energy through the creation of electron
hole pairs (ionizing) and the creation of phonons and displacement of atoms in the lattice of the
material (non-ionizing). Although a majority of the energy dissipation occurs as ionization
processes, the introduction of defects through displaced atoms (i.e., termed displacement
damage) can significantly impact material properties. Provided that the incident particle has
sufficient energy to dislodge an atom from its lattice position, a pair of defects is generated
within the lattice. The absence of an atom from a normally occupied lattice location is called a
vacancy, and the presence of a dislodged atom in a non-lattice position is called an interstitial.
These radiation-induced defects (Figure 6.2-1) vary in stability and can impact material
characteristics. Depending on the amount of energy transferred to the original displaced atom
(primary knock-on atom), the displaced atom can in turn displace additional atoms, creating a
cascade of the defects that form localized clusters of disorder [Srour, Marshall, & Marshall,
2003]. Therefore, defects created from non-ionizing energy loss can either be isolated defects or
a combination of isolated and clustered defects, depending on the energy the incident particle
transfers to the original displaced atom (Figure 6.2-1). Following generation, these defects can
anneal to form stable configurations, which are temperature and excess carrier dependent. This
creates a potential time dependence to the induced defect density that potentially depends on the
temperature during irradiation and subsequent storage.
Representation of initial defect configuration related to energy of primary knock on-atom in silicon. Note that as recoil energy of
atom increased, overall defect density begins to remain relatively constant.
Figure 6.2-1. Potential Isolated Defects in Silicon induced by Incident Particle (left)
[Srour and Palko, 2013]

35
The primary mechanism for electrons displacing atoms in a lattice is Coulombic elastic
scattering. Similarly, Coulombic elastic scattering dominates for protons at low energy, while
nuclear elastic and inelastic scattering dominate for energies about ~10 MeV. Low-energy
neutrons displace atoms primarily through elastic nuclear scattering, though inelastic collisions
begin to dominate for energies greater than ~20 MeV. Due to a lower mass, electrons are less
efficient at transferring momentum to subsequent atoms and induce fewer displaced atoms per
unit flux than protons or neutrons [ECSS-E-HB-10-12A, 2010]. Along this line, secondary
electrons generated from gamma ray interactions can displace atoms, but the non-ionizing energy
loss of these electrons is low, with a typical gamma ray dose resulting in minimal displacement
damage in most devices. Therefore, gamma radiation can be used for estimating TID
susceptibility, but not TNID effects.
6.3 Susceptible Devices
The impact of radiation-induced defects on the material electrical and optical properties can be
related to the introduction of defect energy states into the bandgap of the material. Depending on
the energy level of the defect state introduced into the bandgap, defect states can enhance
thermal generation, recombination, carrier trapping, carrier compensation, and junction tunneling
[Srour & Palko, 2013; Marshall, 1999]. Increased thermal generation and junction tunneling, for
high fields and/or small bandgap, results in higher dark currents for devices with depletion
regions, while increased recombination reduces power output from solar cells and degradation of
gain in bipolar devices. Carrier trapping impacts the charge collection efficiency in particle
detectors and the charge transfer efficiency in CCDs. Carrier compensation can impact the
resistivity of lightly-doped regions in a device (e.g., the collector in a bipolar transistor or
detector). While not providing an exhaustive list, Table 6.3-1 contains common device types and
the potential metrics for degradation and is based on Poivey [May 2017]. Due to the high quality
of semiconductors, the concentration of induced defects is lower than the majority concentration.
Devices that rely on minority carrier behavior are more susceptible to TNID than majority carrier
devices [Srour & Palko, 2013; Marshall, 1999]. A notable exception is optoelectronic devices
[Reed, 2002], which are extremely susceptible to TNID.
Table 6.3-1. Potentially Susceptible Technologies and Impacted Parameters
Technology/Type Parameters
General Bipolar Bipolar Junction Transistor (BJT)
Gain degradation in BJTs, particularly for low-current conditions (PNP devices are more sensitive to TNID than NPN)
Diode Increased leakage current, increased forward voltage drop
Electro-Optical Sensors
CCDs CTE degradation, increased dark current, increased hot spots, increased bright columns, random telegraph signals
APS Increased dark current, increased hot spots, random telegraph signals, reduced responsivity
Photodiode Reduced photocurrents, Increased dark currents
Phototransistor Gain degradation, reduced responsivity, increased dark currents
Light-Emitting Diodes (LEDs)
LEDs Reduced light power output
Laser diodes Reduced light power output, Increased threshold current
Optocouplers Reduced current transfer ratio
Solar Cells Silicon, Gallium Arsenide (GaAs), InP, etc.
Reduced short-circuit current, reduced open-circuit voltage, reduced maximum power

36
Germanium Detectors
Reduced charge collection efficiency, reduced energy resolution, degraded timing characteristics, temperature dependent annealing
Optical Materials Reduced transmission
Fiber Optics Reduced transmission
6.4 TNID Calculations
6.4.1 Environments of Interest
TNID should be considered under the following radiation environments [ECSS‐E‐ST‐10‐12C,
2010]:
1. Trapped proton belts.
2. Trapped electrons, which are important for solar cell and optoelectronic devices.
3. Solar protons.
4. Secondary protons and neutrons.
5. Proximity to radioactive or nuclear energy sources (e.g., radioisotope thermoelectric
generators).
6.4.2 Effective Fluence Calculations
The non-ionizing energy loss rate (NIEL) for a particle in a material can be calculated as a
function of particle energy using first-principles MC simulation tools. In combination with
particle fluence ( ) for the operating environment, the total DDD induced by a particle in the
operating environment is
where the bounds of the integral is the energy range of interest [Srour, Marshall, and Marshall,
2003; Marshall, 1999; Summers, Burke, & Xapsos, 1995]. In most cases, it is more convenient to
represent the total DDD induced by a particle in an environment by the effective fluence, Feff,
required for a monoenergetic particle, E0, to introduce an equivalent DDD in the material:
Representing DDD with effective fluence at a monoenergetic particle energy is crucial for
ground-based testing, as cost and time can likely limit the amount of particle energies that are
practical for testing. Furthermore, as reported data are often collected using a variety of incident
particle energies, effective fluences allow for converting existing test data to particle energies of
interest.
6.4.3 Limitations of Non-ionizing Energy Loss (NIEL) Scaling and Effective Fluence
The underlying principle of NIEL scaling is that, for a given displacement damage dose, the
same amount of the device degradation occurs in ground-based testing as would occur in the
operating environment. If a specific radiation damage factor determinant is to be invariant with
NIEL for any incident particle species and energy, then the concept of NIEL scaling is said to
apply [Srour and Palko, 2013; Marshall, 1999; Summers, Burke, & Xapsos, 1995; Summers et

37
al., 1993].This invariance with NIEL indicates that material and device degradation from DDD is
approximately independent of the manner in which the dose is delivered (e.g., TID scaling with
the charge deposited by an ionizing particle). For many materials other than silicon, damage does
not necessarily scale with NIEL. It may scale with the Coulomb portion of NIEL or the
nuclear/inelastic portion. For a material and device, the damage factor can be collected as a
function of particle and/or NIEL to establish the range of energies that NIEL scaling is
applicable.
Radiation-induced generation centers result in increased dark current levels through thermal
generation in the depletion region of devices. This degradation results in the definition of the
damage factor Kdark, which normalizes the induced damage to the DDD [Summers et al., 1993].
Measured damage factors from a variety of particle energies and species, as a function of NIEL
are provided in Figure 6.4-1. It can be observed that, above the threshold NIEL energy, the
damage factor becomes invariant of the NIEL of the particle. Therefore, NIEL scaling and
equivalent fluence applies to particles with NIEL above this threshold value. Furthermore, if
monoenergetic testing with a particle above the NIEL threshold is used to estimate degradation
for particles with NIEL below the threshold, then the degradation would be overestimated.
Conversely, using a testing particle with NIEL below the threshold would underestimate the
degradation from particles with NIEL above the threshold. It is worth noting that much of work
on NIEL scaling has focused on silicon, but caution must be taken when applying to other
materials (e.g., GaAs). It has been demonstrated for alternative materials that damage either does
not scale with NIEL or does so over a narrower energy range than in silicon.
Figure 6.4-1. Damage for Dark Current as a Function of NIEL in Silicon Devices for Variety of
Particle Energies and Species [Srour and Palko, 2013; Summers et al., 1993]
(this demonstrates that for particles with a NIEL above a threshold value, the damage factor is
constant, which is a necessity for NIEL scaling to apply)

38
6.5 References
“Calculation of Radiation and its Effects and Margin Policy Handbook,” ECSS-E-HB-10-12A,
2010.
Marshall, C. J., “Proton Effects and Test Issues for Satellite Designers: Displacement Effects,”
in NSREC Short Course, 1999, pp. 1–62.
“Methods for the Calculation of Radiation Received and its Effects, and a Policy for Design
Margins,” ECSS‐E‐ST‐10‐12C, 2010.
Srour, J. R. and Palko, J. W., “Displacement Damage Effects in Devices,” in NSREC Short
Course, 2013, pp. 48–102.
Srour, J. R., Marshall, C. J., and Marshall, P. W., “Review of Displacement Damage Effects in
Silicon Devices,” IEEE Trans. Nucl. Sci., Vol. 50, No. 3, 2003, pp. 653–670.
Summers, G. P., Burke, E. A., and Xapsos, M. A., “Displacement Damage Analogs to Ionizing
Radiation Effects,” Radiat. Meas., Vol. 24, No. 1, 1995, pp. 1–8.
Summers, G. P., Burke, E. A., Shapiro, P., Messenger, S. R., and Walters, R. J., “Damage
Corellations in Semiconductors Exposed to Gamma, Electron and Proton Radiations,” IEEE
Trans. Nucl. Sci., Vol. 40, No. 6, 1993, pp. 1372–1379.
6.5.1 Useful Standards and Additional References for Displacement Damage
Buchner, S. P., Marshall, P. W., Kniffin, S., and LaBel, K. A., “Proton Test Guideline
Development – Lessons Learned,” Goddard Space Flight Center, 2002. Retrieved from
https://radhome.gsfc.nasa.gov/radhome/papers/Proton_testing_guidelines_2002.pdf.
Gorelick, J. L., Ladbury, R., and Kanchawa, L., “The Effects of Neutron Irradiation on Gamma
Sensitivity of Linear Integrated Circuits,” IEEE Trans. Nucl. Sci., Vol. 51, No. 6, 2004, pp.
3679–3685.
“Ionizing Dose and Neutron Hardness Assurance Guidelines for Microcircuits and
Semiconductor Devices, MIL-HDBK-814.
Lomheim, T. S., Moss, S. C., Rose, T. S., Sin, Y., Romeo, D. E., and Srour, J. R., “Design
Challenges for Optical Payloads Used in the Space Radiation Environment,” Paper presented
at the Nuclear and Space Radiation Effects Conference Short Course, Boston, MA, 2015.
Marshall, C. J. and Marshall, P. W., “CCD Radiation Effects and Test Issues for Satellite
Designers,” 2003. Available at
https://radhome.gsfc.nasa.gov/radhome/papers/CCD_Lessons_Learned.pdf.
Marshall, C. J., et al., “Hot Pixel Annealing Behavior in CCDs irradiated at -84°C,” IEEE Trans.
Nucl. Sci., Vol. 52, No. 6, 2005, pp. 2672–2677.
“Methods for the Calculation of Radiation Received and its Effects, and a Policy for Design
Margins,” ECSS-E-ST-10-12C.
Poivey, C., “TNID Total Non-Ionizing Dose or DD Displacement Damage,” in ESA-CERN-
SCC Workshop, 2017.

39
Poivey, C., “Total Ionizing and Non-Ionizing Dose Radiation Hardness Assurance,” Paper
presented at the Nuclear and Space Radiation Effects Conference Short Course, New
Orleans, LA, 2017.
Poivey, C., Buchner, S. P., Howard, J. R., LaBel, K. A., and Pease, R. L., “Testing and Hardness
Assurance Guidelines for Single Event Transients (SETs) in Linear Devices,” Goddard Space
Flight Center, October 24, 2005. Retrieved from
https://radhome.gsfc.nasa.gov/radhome/papers/SET_Linear05.pdf.
“Radiation Hardness Assurance - EEE Components,” ECSS-Q-ST-60-15C.
Reed, R., “Guideline for Ground Radiation Testing and Using Optocouplers in the Space
Radiation Environment,” 2002.
“Space Environment,” ECSS-E-ST-10-04.
Srour, J. R. and Palko, J. W., “A Framework for Understanding Displacement Damage
Mechanisms in Irradiated Silicon Devices,” IEEE Trans. Nucl. Sci., Vol. 53, No. 6, 2006,
pp. 3610–3620.

40
7.0 Single Event Effects (SEEs) 1.0
Return to Main See Also:
Appendix D
7.1 Section Summary
SEE are a class of effects occurring in avionic and other electronics due to exposure to the
natural space and other ionizing radiation environments [Petersen, 2013]. The process of
evaluating and ensuring reliability and availability with respect to SEE impacts is a component
of the overall RHA [LaBel, 2003]. SEE hardness assurance is crucial for all missions, but the
rigor required varies (e.g., based on environment (low Earth orbit (LEO) versus beyond LEO),
mission duration, application, etc.). SEE hardness assurance must be performed as an integral
component of the circuit design and systems-engineering process. In-scope tasks include DSNE
environment derivation and shielding analyses, requirement decomposition/development, EEEE
parts selection, SEE testing, implementing SEE mitigation (e.g., by part substitutions, circuit
design, software, operation), SEE rate calculations, and criticality analyses. The RHA lead
engineer and her/his team are stakeholders to design review milestones.
Program requirements are typically levied at a high level, such as “the system shall meet
functional, performance, and reliability requirements in the mission ionizing radiation
environment,” or equivalently, “…shall meet reliability and availability requirements…” This is
insufficient for radiation engineers to execute SEE hardness assurance. It is essential for a
detailed requirement decomposition to be performed early in the development process,
documented in an Ionizing Radiation Control Plan (IRCP) or equivalent, and approved by the
project/program [SMC-S-010, 2013; NASA-STD-8739.10, 2017]. SEE hardness assurance is a
SOTP engineering discipline. It is essential for the IRCP to be based on best practices accepted
in the field, and for any deviations to be sanctioned only with full understanding and program
acceptance of the associated risks.
Early consideration of SEE as a driver for part selection and circuit design process is important
to meet schedule and cost constraints. Use of EEEE parts with known SEE performance is
strongly preferred [SMC-S-010, 2013]. SEE testing is expensive, has long lead times, and does

41
not guarantee part performance; testing only characterizes it. SEE part performance is often
application specific. Review of existing data for applicability and all other SEE hardness
assurance tasks must be performed by experienced radiation engineer(s) familiar with the
applications’ electronic designs [NASA-STD-8739.10, 2017].
It is critical for projects and programs to allocate adequate resources and authority for the SEE
hardness assurance (and overall RHA) effort, including staffing. Ionizing radiation effects
subject matter expertise is not widely available. An appropriate skill set combination, including
but not limited to radiation physics and electronic engineering, is critical to enable project
success.
Integration of a “systems” team is necessary, especially for complex projects, and must include
all cognizant engineering disciplines, radiation, EEEE parts, design, and systems. Verification of
the reliability and availability requirements often resides at the systems engineering level.
Section Highlights and Takeaways
• SEEs are a device’s response to a single energetic particle depositing energy as it transverses
a semiconductor material. This is either via (1) direct ionization, where the energy is
deposited along the path of the primary/incident particle, or (2) indirect ionization, where the
particle interacts with a target nucleus along that path and the secondary particle(s) from the
primary collision deposit the energy through direct ionization.
• SEE are stochastic events. SEE probabilities depend on the SEE susceptibilities specific to
each EEE part and the local radiation environment to which the part is exposed.
• Assuming a constant environment, SEEs can occur with equal probability at any time during
the mission—from the first to last second. The time to first failure may be more appropriate
for critical operations, scenarios, or effects versus mean time between failures. Constant
probability issues define why we test the way that we do and also define why SEE are the
effects that must be considered for every mission regardless of environment severity and
mission duration.
• SEE responses vary from soft (e.g., bit flips, transients, etc.) to hard (e.g., burnout, gate
rupture, latchup, etc.).
• Some SEE are recoverable, while others are not. A device’s SEE response is a function of the
incident particle, location of the event, operational timing of the event, circuit design,
incident device technology, and more.
• Background GCR and/or trapped proton environments will be important for day-to-day
operations, while SPE environments may dominate SEE rates for critical applications
requiring mitigation based on function, real-time operations, etc.
7.2 SEE Fundamentals
SEEs are caused by interaction of a single primary or secondary ionizing particle (e.g., proton,
neutron, or heavy ion) with a semiconductor part. All semiconductor parts containing natural or
applied electric fields are potentially susceptible to SEE [Petersen, 2011]. These parts are
referred to as “active electronics.” SEE can be destructive or nondestructive. A single part may
exhibit multiple types of destructive and nondestructive SEEs, with different susceptibilities.
Discrete passive components (e.g., inductors, resistors, and discrete capacitors) are SEE immune;
42
there are some exceptions for integrated passive components. (For additional details, refer to
Table 7.4-1.)
SEEs are memoryless stochastic (i.e., Markov) processes; their probability in the mission
depends on the specific component’s susceptibility and the local radiation environment, but not
previous (mission) history. SEEs are Poisson distributed in the fluence domain. SEE
characterization data are often expressed as SEE cross-section as a function of LET. In the
radiation effects field, LET is defined as the energy transferred to a target by an ionizing particle
per unit path length, normalized to the target density and typically expressed in units of MeV-
cm2/mg. The LET integrated over the distance traveled in the sensitive volume is proportional to
the collected charge. Use of LET as the unifying parameter for SEE susceptibility constitutes an
approximation central to the ability to decouple the device response from the environment and
perform ground characterization testing. This approximation is subject to inherent assumptions
and limitations [Petersen, 1992]. LET includes both electronic and nuclear components. An ion
can have the same LET at a high and a low energy, or ions of different atomic numbers can have
the same LET. However, the local energy deposition patterns (i.e., “track structures”) would be
different and in turn may cause differences in the part response. Charge enhancement due to
localized bipolar response mechanisms can cause the collected charge to exceed the deposited
charge in devices such as SOI and III-V n-channel field effect transistors (FETs) [Massengill,
1990; McMorrow, 1998; Ni, 2015]. The “effective LET” concept describes the angular
dependence of SEE mechanisms caused by charge deposited in a thin sensitive volume [ASTM-
F1192, 2018]. Off-normal particle incidence increases the deposited energy by a factor of
1/cosΘ. Similarly, when the particle LET varies significantly within the sensitive volume the
integration over distance effectively equates to an equivalent LET [Ladbury, 2015].
Translating SEE cross-section into the time domain (i.e., calculating SEE rates) is performed by
analysis, based on characterization data and environment definitions [SMC-S-010, 2013]. The
result is the SEE rate, or their inverse quantity mean time between failures (MTBF). As stated in
Section 11.2, the concept of mean time to failure (MTTF) does not apply to SEE. Care must be
exercised interpreting SEE rates. Increases in the radiation environment cause simultaneous
increases in all SEE rates across the entire vehicle system. The risk for certain mitigation
schemes thus increases supralinearly with the radiation flux and requires performance to be
verified in the worst-case (peak) environments. According to Poisson statistics, the probability of
success (i.e., device not experiencing an SEE) by the time it reaches MTBF is 37%. Conversely,
the probability of one or more SEEs within the same time is 63%.
In addition to rate calculation, criticality analysis (i.e., SEECA) must be performed to determine
the consequences and system impacts of SEEs, and their contributions to reliability, availability,
and loss of crew/loss of mission (LOC/LOM) requirements.
7.3 SEE Requirements and the IRCP
Per NASA-sanctioned U.S. and international standards, radiation project/program requirements
must be tailored and documented in an IRCP or equivalent prior to the System Requirements
Review (SRR) [SMC-S-010, 2013; NASA-STD-8739.10, 2017; ECSS-Q-ST-60-15C, 2012].
SEE hardness assurance-relevant key elements of the IRCP are:
• EEEE parts SEE selection criteria: Selection criteria may emphasize the following
directions:

43
• Risk avoidance: projects impose LET thresholds for part selection; EEEE parts
susceptible to SEE below those thresholds are not acceptable for the design.
• Risk quantification: projects impose minimum LET levels to which the parts must be
characterized. Additional requirements impose reliability and availability requirements
that must be verified by analysis.
Both directions have benefits and limitations. The first provides confidence for small residual
SEE risk if the LET threshold is chosen appropriately per the mission definition (i.e.,
environments, duration). The second allows for a wider pool of parts to be considered for
the design, but it increases the scope of systems engineering effort necessary to meet
performance requirements. Some SEE types are insufficiently understood to guarantee rate
prediction accuracy. A good set of requirements combines the two directions to balance
design constraints versus analysis consistent with program specifics and accepted risk
tolerance posture. Examples are provided in the previously referenced standards:
• United States Air Force (USAF) standard SMC-S-010 considers parts with destructive
and disruptive SEE LET thresholds > 75 MeV-cm2/mg to be acceptable, parts with
destructive and disruptive SEE LET thresholds < 37 MeV-cm2/mg to be not acceptable,
and allows programs to set requirements in between [SMC-S-010, 2013].
• European Space Agency (ESA) standard ECSS-Q-ST-60-15C considers parts with SEE
thresholds > 60 MeV-cm2/mg SEE immune, and requires SEE analyses for other parts to
demonstrate that the application meets the projected availability, performance, and
reliability requirements [ECSS-Q-ST-60-15C, 2012].
SEECA, as described in Section 11 of this document, offers a methodology to inform design
for SEE hardness/tolerance, including but not limited to parts selection requirements.
Minimum LET thresholds for destructive and non-recoverable effects in the range of 60 to
75 MeV-cm2/mg are SOTP standard for critical exo-LEO applications. Reducing these values
poses unacceptable risk to most programs. While it is often impractical to impose recoverable
SEE LET thresholds for part selection, preference is given to parts with high thresholds and
low cross-sections. Part acceptability is dependent on the circuit meeting its availability
requirements, as demonstrated by analysis.
• SEE test requirements: SEE test requirements explicitly prescribed by the IRCP must
include but are not limited to acceptable test facilities, ion species, fluence, flux, particle
range, number of samples, voltage derating, beam incidence angle, temperature, SEE cross-
section statistics (i.e., minimum number of events recorded), worst-case operating conditions
for relevant SEE types, and acceptability of circuit card assembly (CCA) level. Best practices
and rationale for these requirements are presented in the SEE testing sections of this report
and the standards referenced therein.
• SEE analyses requirements: The IRCP must specify acceptable methods, software tools,
and documentation for SEE circuit analysis, impacts, and rates as input to SEECA.
• Parts similarity: Due to rapid change of manufacturing processes, a set of criteria must be
established to verify acceptability of SEE test data obtained from parts other than the flight
lot [JSC-STD-8080, 2011].
• SEE shielding and environments analyses: Whether included in the IRCP or separate, a
program environments document must be generated to define environments of interest (e.g.,
heavy ion LET and proton energy spectra) corresponding to relevant intravehicular shielding

44
distributions. Taking credit for environment reduction due to shielding reduces conservatism
in SEE rate calculations.
• Collaboration and deviation mechanism: Due to the parts’ complexity and rapid evolution,
not all scenarios can be captured, even in a comprehensive IRCP. The RHA process must
provide an effective process to allow compliance and “meet the intent” interpretation of test
data by experienced SMEs at survivability working group or parts control board levels.
7.4 SEE Types and Mechanisms
SEEs can be destructive or nondestructive. The categorization refers to the effect on the part that
exhibits it; nondestructive SEE can cause destructive or non-recoverable effects at system level.
Destructive SEE types include single-event latchup (SEL), dielectric rupture (SEDR), single-
event gate rupture (SEGR), burnout (SEB), and stuck bits. Nondestructive SEE types include
single-event transient (SET); single-event upset (SEU), including single-bit upset (SBU) and
multiple-cell upset (MCU); and functional interrupts (SEFI). Multiple-bit upset (MBU) refers to
single event upset of multiple cells in the same logical word or frame [JESD57A, 2017]. This list
is not exhaustive. In complex digital devices such as field-programmable gate arrays (FPGAs)
and processors, SETs can be captured if occurring simultaneous with clock cycles and captured
as cell state changes. These can be referred to as digital SETs (DSETs) to distinguish them from
SET in analog devices (analog SETs (ASETs)). Table 7.4-1 shows susceptibility of various
technologies and part types to different SEE. SEE type definitions vary between sources [ASTM-
F1192, 2018; JESD57A, 2017; ESCC 25100, 2014; Petersen, 2011; JESD234, 2013]. Care must
be exercised to clarify definitions, especially when consequential to determining system impacts.
SEL is the result of a parasitic thyristor (semiconductor-controlled rectifier (SCR)) (e.g., in a
CMOS structure) switching on due to free charge generated in an SEE. SEL results in high
current, which can cause part failure due to thermal effects. SEL is considered destructive by
default unless sufficient evidence exists to the contrary. Recoverable SEL may stress the device
and cause latent damage and, in turn, premature lifetime failures [Ladbury, 2005]. Technologies
that do not include parasitic SCR structures are inherently SEL immune (e.g., linear bipolar or
silicon-on-insulator (SOI)) but are potentially susceptible to other destructive SEE mechanisms.
N-type metal-oxide-semiconductor (NMOS) SOI technology is potentially susceptible to
snapback. This refers to a high-current condition due to avalanche breakdown of a bipolar
transistor following SEE-induced collector-base current flow. SEB and SEGR refer
predominantly to MOSFETs and similar devices [Titus, 2013]. SEB refers to a high drain-source
current conduction path in power MOSFET or BJT, usually causing catastrophic failure of the
device. SEBs have also been reported in Schottky diodes [O’Bryan, 2013; George, 2013]. SEGR
manifests as a high gate current due to breakdown of the gate oxide [ASTM-F1192, 2018].
SEDR refers to dielectric breakdown of oxide layers such as integrated capacitors. These effects
have angular responses different from SEU and SEL, and ion Z dependence. Particle incidence
normal to the dielectric layer constitutes a worst case for SEGR and SEDR, rendering the
concept of effective LET inadequate [Lum, 2000; Boruta, 2001; Lum, 2004]. Risk avoidance as
defined in Section 7.3 is the primary risk management technique for SEB/SEGR susceptible
parts.

45
Table 7.4-1. SEE Type Susceptibility of Various Technologies and Part Types [adapted from
Ladbury, 2017]
Catastrophic failure possible Destructive
but limited
Nondestructive
SEL1,5,7 SEGR2,5 SEB6 SEDR2 Stuck Bit SEU/SBU/
MCU
SET3,4 SEFI
CMOS MOSFET8 Power
MOSFET6
One-
time
prog.
FPGA
SRAM Digital /
bistable
technologies
Digital logic
incl. CPU,
FPGA
(DSET)
Complex
µcircuits
FLASH Power JFET Bipolar
MOS
Caps
DRAM Deep
submicron
CMOS more
MCU
susceptible
Analog linear
circuits incl.
op-amps,
opto-couplers
(ASET)
Memory
Schottky
Diode3
Power BJT FLASH MOSFET
(ASET)
ADCs
PWMs 1 Susceptibility increases with temperature. 2 Susceptibility increases with bias. 3 Susceptibility decreases with temperature. 4 Susceptibility is application dependent. 5 SEGR and SEL sensitive volume thickness ~10 µm. 6 SEB sensitive volume thickness ~30-200 µm. 7 In principle, SEL is possible in any bipolar thyristor structures (not observed in linear bipolar ICs yet). Acronym list: static random-access memory (SRAM); dynamic random-access memory (DRAM); pulse-width modulator(PWM); bipolar junction transistor (BJT); junction gate field effect transistor (JFET); iIntegrated circuit (IC)
Common in technology Possible failure mode
SET and SEU refer to temporary disruptions in analog or digital outputs, respectively [Petersen,
2011]. SET signature (e.g., for operational amplifiers and optocouplers) varies significantly with
the circuit. Test data must reflect or envelop the flight application. In testing, SETs are observed
with various amplitudes and durations due to multiple part elements being susceptible.
Application-specific SET thresholds can be defined for testing purposes. Characterization testing
must determine the application worst-case SET signature with sufficient statistical confidence
[Sandia RHA, 2008].
Worst-case SET signatures (amplitude and duration) constitute useful information for SET
mitigation design. In most cases, however, parts exhibit a wide range of SET signatures.
Different features in the same part cause different SET shapes at the part’s outputs. SETs are also
application dependent. As an example, linear devices exhibit SET shapes dependent on the LET
of incident particles; particle range; bias conditions, including power supply and input voltage(s);
and loads [Poivey, 2005]. It is, therefore, potentially dangerous to separate SET signatures from
the application.
ESA standard defines worst-case SET signatures for different device types [ECSS-Q-ST-60-15C,
2012]. Subsequent refinements can be implemented based on the device bandwidth. As an
example, Table 7.4-2 SET signatures apply to rad-hard parts only and are interpreted as
enveloping 90% of the applications. The distribution is characterized by high kurtosis (i.e., broad
tails). In rare cases, SET durations can be as long as milliseconds. When critical SET cannot be

46
mitigated in design with sufficient margin, or for parts not covered by this guidance, application-
specific SET characterization testing is strongly recommended.
Table 7.4-2. SET Signature Guidelines for Selected Device Types (these apply to rad-hard parts
only and are to be interpreted as enveloping 90% of applications)
Device Type SET Signature at Device
Output
Op-amp Vmax = ±Vcc, Tmax = 200 µs
Comparator, Voltage Reference,
Voltage Regulator
Vmax = ±Vcc, Tmax = 10 µs
Optocoupler Vmax = ±Vcc, Tmax = fall time
from rail to rail from the
vendor data sheet.
SEFI refers to SEU in any control path/area of a device. SEFIs are more problematic in complex
devices (e.g., processors, application-specific integrated circuits (ASICs), memories (especially
DRAMs), etc.). SEFIs may render the device unresponsive, cause a reset, change the operating
mode, add offset (analog-digital converters (ADCs)), etc. Like SELs, SEFIs associated with high
current can introduce permanent latent damage and must be categorized as destructive SEEs
(DSEEs) [JESD57A, 2017].
7.5 SEE Mitigation Techniques
The desired outcome of SEE mitigation is to reduce the consequence of an effect (or a
combination/accumulation of effects) for a given function that is critical to mission success.
Mitigation can be strategically added to a system or may be inherent in design practices with
respect to electrical engineering best practices (e.g., error detection and correction, filtering,
redundancy, etc.). Different classes of SEE mitigation techniques apply for different SEE types.
Destructive SEE are primarily addressed via risk avoidance (i.e., EEEE part selection). Voltage
derating is effective mitigation for SEB and SEGR/SEDR. Standards require derating to be
supported by test data [ECSS‐Q‐ST‐30‐11C Rev 1, 2011; ECSS-Q-ST-60-15C, 2012]. Radiation
derating may be in addition to (i.e., more stringent than) requirements imposed by EEEE parts
standards [EEE-INST-002, 2003]. SEL usually can be prevented from becoming destructive by
current limiting, over-current detection, and power cycling. Such circuitry must consist of
radiation-hardened parts and be validated in test and/or analysis. SEL current density signature
must be evaluated for latent effects. SET and SEU mitigation includes redundancy in conjunction
with filtering, voting (e.g., triple module redundancy (TMR) in FPGA fabric level or very-high-
speed integrated circuit hardware description language (VHDL), and persistence/averaging. SEFI
mitigation examples are watchdog timers and autonomous reset. Implementation must pay
attention to resetting the pre-SEFI effector states. Data and communication errors may be
mitigated using error detection and correction (EDAC). Table 7.5-1 shows example error
detection methods and their respective error correction capabilities [LaBel, 1996]. Logic
architectures should be defined so that MCU does not cause MBU [JESD57A, 2017]. Stuck bits
tend to occur as isolated bits, so EDAC generally constitutes effective mitigation. In the case of
single-error-correction, double-error detection (SECDED), a stuck bit in a word means that the
first single-bit upset could not be corrected, only detected, while two or more upsets in the word
could be neither detected nor corrected. More sophisticated EDAC and interleaving across die is

47
recommended for devices susceptible to SBU, MBU, stuck bits, and non-radiation-induced bit
retention errors such as SDRAM.
Table 7.5-1. Sample Error Detection Methods and Correction Capabilities
[adapted from LaBel, 1996]
Method Capability
Parity Detects single-bit errors
Cyclic Redundancy Check code Detects whether errors occurred in a given data
structure
Hamming code Corrects single-bit errors, detects double-bit errors
(SECDED)
Bose–Chaudhuri–Hocquenghem (BCH)
codes
Corrects multiple random errors in the symbol
(generic class)
Reed-Solomon code Corrects multiple random errors in the symbol (as
specific instance of BCH code)
Low-Density Parity Check (LDPC) code Corrects multiple-bit errors, used for signals having
sparse parity check matrices
Convolutional encoding Corrects isolated burst noise in a communication
stream
Overlying protocol Refers to error detection/retransmission capabilities
intrinsic to the data transfer protocol (e.g., TCP/IP)
System-level mitigation often relies on redundancy [Hodson, 2019]. Power cycling potentially
requires device reinitialization/restoration of previously commanded state with significant
operational impacts. Reliability and availability analyses must account for device down-time
during error identification and correction. Reliability and availability must be validated in the
worst-case driving environments. Other mitigation techniques are possible in addition to the
examples above [FAA, 2016; Ladbury, 2007].
7.6 SEE Testing
7.6.1 Piece-Part Heavy Ion SEE Testing
Piece-part testing with high-energy heavy ions is the primary method required to assess the SEE
susceptibility of electronic hardware [ASTM-F1192, 2018; JESD57A, 2017; MIL-STD-750E,
2006; ESCC 25100, 2014)] SEE testing is characterization testing. Typical heavy ion test
fluences are 1e+7 p/cm2 for SEL/SEU [ASTM-F1192, 2018] and 1e+5 – 1e+7 p/cm2 for
SEB/SEGR [MIL-STD-750E, 2006]. Especially at high LET, this represents particle fluence
many orders of magnitude above the flight environment, but is required to ensure physical
coverage of all device features and, in turn, to characterize all SEE modes with sufficient
statistical confidence.
Test results consist of safe operation limits (typically for DSEE), or SEE cross-sections versus
LET for SEE rate calculations. SEE testing also provides event signature characterization (e.g.,
amplitude and width of SETs, error bit patterns, SEL current signatures and recovery, and
actions needed to restore part functionality). It is important that piece-part testing be performed
early in the design cycle. This allows prompt implementation of mitigation, including part
substitutions and circuit design changes. Tests must be adequately instrumented to capture the
events of interest to the application [ASTM-F1192, 2018]. Test instrumentation, facility

48
calibration, and beam dosimetry must return accurate event counts, LET, and fluence,
respectively.
SEE susceptibility is application dependent. For example, SEL susceptibility increases with
temperature and bias voltage. Conversely, worst-case testing for SET/SEU is at low temperature
and bias voltage. For specific part types, including operational amplifiers (op-amps),
comparators, and optocouplers, SET/SEU signatures are heavily dependent on the circuit design.
SEGR and SEDR susceptibility increases with bias voltage. Load reactance affects MOSFET
SEB susceptibility. Radiation engineers are responsible for confirming that test conditions
envelop the application.
SEGR testing should be performed at the worst-case angle of incidence (e.g., normal beam
incidence for planar devices) [ESCC 25100, 2014] and followed by a post-irradiation gate stress
(PIGS) test [JESD57A, 2017; MIL-STD-750E, 2006]. SEB/SEGR testing is typically performed
as pass/fail to establish safe operating limits [JESD57A, 2017; ECSS-Q-ST-60-15C, 2012]. Full
safe operating area (SOA) characterization requires many test samples. Alternatively,
SEB/SEGR verification testing can be performed for the application-specific bias and load
conditions.
Fluence rate (i.e., flux) effects must be considered when applicable. For example, EDAC
performance observed in high flux testing significantly under-predicts performance in the natural
space environment. EDAC efficiency is best determined analytically from the raw (uncorrected)
SBU/MCU rates and the driving mission environment. All part functionalities used in flight must
be exercised during SEE testing. Setup must allow test results to be obtained with good statistical
significance and may have to be adjusted to account for duty cycles in flight versus test.
Required documentation for SEE tests consists of a test plan and a test report, the contents of
which are stipulated in the IRCP [ESCC 25100, 2014]. SEE testing is a significant effort that
must be adequately scoped. More detail regarding SEE testing is provided in Section 12 of this
document.
7.6.2 High-Energy Proton and Neutron SEE Testing
Current state-of-the-practice recommends proton SEE testing for accurate rate predictions in
proton rich environments and provides test and analysis guidelines [JESD234, 2013; NEPP,
2002; NEPP, 2009]. Currently, the dominant process by which high-energy protons cause SEE is
indirect ionizations. Nuclear interactions of high-energy protons within the semiconductor can
produce heavy ion recoils. If produced in or reaching the sensitive region, the recoils can, in turn,
cause SEE by direct ionization [JESD234, 2013]. Recoils produced in silicon by 200-MeV
protons have LET up to 11.5 to 15 MeV-cm2/mg [O’Neill, 1997; Hiemstra, 2003]. The vast
majority (>99.7%) of high LET recoils have a range below 8 µm and, as such, may be
insufficient to cause SEE in thick, sensitive volumes typically associated with DSEEs [Ladbury,
2015]. ESA standard requires proton testing for devices exhibiting heavy ion SEE LETth
< 15 MeV-cm2/mg [ECSS-Q-ST-60-15C, 2012]. Higher energy protons and/or technologies
incorporating heavier elements in the active regions of the part or packaging may result in higher
LET recoils being produced [Turflinger, 2015; Ladbury, 2020]. Parts exhibiting LETth < 37 to
40 MeV-cm2/mg are considered potentially susceptible to proton SEE [NEPP, 2009; Sandia,
2008]. Such effects, however, may not be observed in medical accelerator proton testing, or their
rates may not be accurately predicted for specific mission environments.

49
The ESA standard requires proton energies for SEE testing in the range of 20 to 200 MeV and
cautions against excessive energy degrading to avoid energy spreading [ESCC25100, 2014]. The
Joint Electron Device Engineering Council (JEDEC) standard references proton energy range of
40 to 500 MeV and reports on SEL in some devices being observed only for energies >400 MeV
[JESD234, 2013]. The energy range of 200 to 250 MeV is widely used by medical proton
therapy facilities, increasing its availability for parts testing. In addition, the cross-section for
secondary particle production is relatively flat in this energy range, reducing energy-spreading
concerns.
Proton SEE testing is performed with higher fluence than heavy ion testing, in the range of
1E+10 to 1E+12 p/cm2 [JESD234, 2013]. This accounts for indirect ionizations being
statistically rare events and for the need to increase statistical confidence of device coverage. As
proton irradiation causes significant dose in devices under test (DUTs), TID degradation is often
the fluence-limiting factor for proton SEE tests. Test standards caution against inferring heavy
ion SEL performance from proton test data [JESD234, 2013]. Proton testing alone is considered
insufficient to assess the risk for critical hardware for exo-LEO missions.
SEE produced by direct ionization from protons may become more important in the future. With
ever decreasing sensitive volumes, it is conceivable that the critical SEE charge can be reached
by low ionization events. Low-energy proton testing is out of scope for this guideline, but
published information is available [Dodds, 2014].
Like protons, neutrons can also cause SEE by indirect ionization. Neutron testing eliminates the
drawback of significant dose imparted to the DUT from direct ionizations [JESD89, 2001].
Neutron testing is not currently recommended for space applications, as no accepted standard
exists for the target audience, and facility availability is very limited due to interest from
terrestrial and atmospheric avionics communities.
7.6.3 CCA SEE Testing
CCA testing is defined here as simultaneously irradiating multiple piece-parts on a card
representative of the flight application. CCA SEE testing can be performed with protons or high-
energy heavy ions in the range of hundreds of MeV/n. While CCA testing is often perceived as a
preferred cost-effective alternative to piece-part testing, it is important to understand its
limitations. NASA NEPP has published a Book of Knowledge (BoK) on the proton board level
test method (PBTM) focused on COTS systems [Guertin, 2017]. This BoK presents a case study
quantifying the SEE performance confidence that can be accomplished analytically (no testing)
versus PBTM versus full SEE test campaign.
CCA testing limits the ability to derate/stress the part beyond the nominal application. It also
limits the ability to control the operating conditions of the parts (e.g., temperature, duty cycles,
operating modes). CCA testing is difficult to instrument due to a multitude of test points
potentially relevant to diagnosing performance and developing mitigation. Other facility-specific
limitations apply as described in Section 5.7. CCAs typically become available for testing late in
the design engineering cycle, often too late to develop mitigation based on the test results. CCA
testing, however, may be valuable to validate integrated hardware-software performance, and the
only choice for down-selection of non-critical COTS hardware. CCA testing should be used as
supplemental information to piece-part data and testing.

50
7.7 SEE Test Facilities
SEE testing is performed in heavy ion and proton accelerator facilities. Facilities usually provide
beam time and dosimetry at an hourly cost; instrumenting and performing the test is the
responsibility of the test team. Projects should be aware that “sending the parts out for test” is not
possible and that they must expect to provide significant input toward development of test
objectives, success criteria, and provide test support hardware and personnel. Some facilities
offer beam time 24 hours/day. This must be factored into the size of the test team to allow safe
and effective test performance. Test logistics are primarily driven by the beam energy. The
information presented here is current as of the time of writing these guidelines and is subject to
change based on facility maintenance, user community developments, etc. Additional
information is available in the literature [NAS, 2018].
The referenced report from the National Academies of Sciences, Engineering, and Medicine
(NASEM), “Testing at the Speed of Light: The State of U.S. Electronic Parts Space Radiation
Testing Infrastructure,” [NAS, 2018] details a number of threats facing U.S. heavy ion SEE test
facilities, including the potential for capacity and capability gaps based on program needs. These
NASEM findings, observations, and recommendations are supported by a more recent heavy ion
SEE test facility assessment that was conducted by the Department of Defense-based Strategic
Radiation-Hardened Electronics Council (SRHEC). The SRHEC report is restricted and
available upon request to U.S. government personnel with a need to know. Based on the
conclusions in these reports, there could be real risks, both programmatic and technical, for
NASA missions in a wide range of lifecycle phases until the test facility issues are sufficiently
mitigated or retired entirely.
From a technical perspective, the particle species and energy determines the penetration range.
Traditional heavy ion testing with a 5- to 50-MeV beam energy typically requires that piece parts
be depackaged and/or deprocessed to expose and possibly thin the semiconductor die. The
Lawrence Berkeley National Laboratory (LBNL) BASE 88-inch cyclotron facility provides
species as heavy as bismuth and energies up to 30 MeV/u (http://cyclotron.lbl.gov/base-rad-
effects/heavy-ions/cocktails-and-ions) [LBNL, 2020]. Ion species can be changed fast;
irradiations are performed in vacuum. The Texas A&M University (TAMU) K500 cyclotron
facility provides species as heavy as gold and energies up to 40 MeV/u
(https://cyclotron.tamu.edu/ref/images/heavy_ion_beams.pdf) [TAMU, 2020]. At both facilities,
high energies are restricted to lighter ions; TAMU can provide Au @ 15 MeV/u and, as such, is
preferred for testing parts with thick active regions (e.g., power MOSFETs). TAMU testing can
be performed in air, but the ion species changes are slower than at LBNL. Both TAMU and
LBNL facilities are planning future upgrades.
The Brookhaven National Laboratory (BNL) NASA Space Radiation Laboratory (NSRL) facility
provides heavy ions at extremely high energies, up to Au @ 400 MeV/u, enabling penetration
ranges up to centimeters in silicon (https://www.bnl.gov/nsrl/userguide/let-range-plots.php). This
allows testing parts without de-lidding them, including special packaged parts (e.g., flip-chips),
individually or at the CCA level. The beam is extracted in 0.3- to 0.4-s spills followed by ~3.6-s
beam-off time [NSRL, 2020]. Inherent to the shape of the Bragg curve, the LET at the part-
sensitive volume varies with the amount of material (e.g., potting, lid) acting as a degrader. In
the context of CCA, sensitive volumes on the same board can be subject to different LETs,
depending on part packaging and board design. This can be problematic for DSEE screening, as
well as full cross-section characterization. Part sectioning may be required to measure the depth

51
of the active region inside the package. Conversely, intentional interposition of degraders
between the source and the target allows modulation of the LET at the sensitive region. The
Variable-depth Bragg Peak (VDBP) method was developed to allow SEE cross-section
characterization at the NSRL without part sectioning. VDBP uses energy degraders to modulate
the LET within the part, and the DUT response to calibrate the position of the Bragg peak with
respect to the sensitive region. DSEE LET threshold characterization is a two-step process
requiring additional sacrificial test samples [Buchner, 2011; Foster, 2012; Roche, 2014]. Lower
fluence per run (1e+6 p/cm2) is typically used to mitigate TID concerns.
At the time of this document, the Michigan State University National Superconducting Cyclotron
Laboratory (NSCL) is undergoing upgrades. Projected beam availability includes 15–50 MeV/u
from the K500 cyclotron, 25–200 MeV/u from the K1200 cyclotron, and 200–300 MeV/u from
the Facility for Rare Isotope Beams (FRIB). For this and all other facilities, the user should
verify current status, capacity, and capability directly with the facility.
Proton beam time is more widely available than heavy ions, and the list of facilities is increasing.
For current list of medical facilities, see PTCOG [2017]. Depending on the test application, beam
quality considerations include the beam spreading technique (passive scattering versus active
scanning) and time structure of the beam (direct current (DC) versus pulsed) [Cascio, 2018;
Cascio, 2015]. High-energy proton testing does not require part de-lidding.
Spatial and temporal information about SEEs can be obtained by pulsed laser testing [Buchner,
2013], microbeam from Sandia National Laboratories (few µm2, low energy), and the
synchrotron X-ray at Argonne National Laboratory. Direct correlation with LET cross-section is
difficult, but efforts are ongoing [Hales, 2018].
7.8 SEE Rate Calculations and Circuit Impact Assessment
Analysis is required to validate performance requirements with respect to SEE. Both the SEE
occurrence rates and the SEE circuit impacts must be assessed.
SEE rates are calculated using tools of the trade (e.g., CRÈME, SPENVIS, or OMERE). Rate
calculations are based on the rectangular parallelepiped (RPP) model and critical charge concept
[Petersen, 2011]. Inputs to the tools consist of mission environment definitions and SEE
characterization data (e.g., Weibull parameters of the cross section versus LET functional
dependence). Assumptions for RPP dimensions can significantly affect the calculated rates and
must be made judiciously [Hansen, 2020]. If test irradiations are performed at off-normal angles,
both the LET and fluence must be corrected for effective values [ESCC 25100, 2014]. For some
devices, geometry effects can cause the measured cross sections versus LET to shift with angle.
Comparison of normal and off-normal cross-sections may provide a method for determining
device depth and funnel length but may be impractical due to limited data availability [Petersen,
2008]. The RPP method is not valid for all SEE types or device geometries; SEDR, SEGR, and
SEB are notable exceptions [Lum, 2000; George, 2017]. As stated in Section 12.4.3.2 of this
document, reliable rate estimation is problematic, and risk management for these mechanisms is
almost always by threat avoidance. Decreased susceptibility to off-normal particle incidence can
be considered for SEGR/SEB risk assessment of planar MOS structures but not for complex
geometry devices (e.g., trench- and FinFETs, silicon-germanium heterojunction bipolar
transistors, SOI/SOS (silicon-on-sapphire), etc.) [ESCC 25100, 2014].

52
SEEs are inherently subject to statistical interpretation. The primary SEE risk uncertainty driver
is the number of events recorded during the test. Other sources of errors include sample-to-
sample variations, device coverage (especially for small feature size devices), dosimetry, and
LET calibration. Guidelines for statistical error analysis is provided in the literature [JESD57A,
2017; ESCC 25100, 2014; Sandia RHA, 2008; Ladbury-Campola, 2015; Ladbury-2, 2007].
SEE impact analyses consider the circuit design and SEE signatures (e.g., SET shapes).
Depending on the circuit design, nondestructive SEE in specific parts can cause destructive
effects in other parts in the circuit, (e.g., out-of-spec bias conditions on downstream
components). Analysis must account for existing circuit mitigation and identify SEE that
propagate beyond the circuit interface. Responsibility of mitigations at firmware/software/VHDL
levels often belongs outside the immediate circuit design and must be validated at the system
level.
SEE circuit impacts and their rates constitute inputs to SEECA. Both destructive and
nondestructive SEEs can have consequences in terms of LOC/LOM. It is imperative that both
reliability and availability SEE impacts are assessed consistent with the SEECA portion of this
document. Accurate rate derivation is conditioned by availability of SEE characterization data
over the full LET range up to 60 to 75 MeV-cm2/mg. In some cases, SEE characterization over a
partial LET range renders a rate determination impossible; in such cases, projects must accept
unquantifiable risk or pursue supplemental testing.
7.9 References
“88-Inch Cyclotron Cocktails and Ions,” LBNL, 2020. Available at (last retrieved March 31,
2020): http://cyclotron.lbl.gov/base-rad-effects/heavy-ions/cocktails-and-ions
“Beam Ion Species and Energies,” NASA Space Radiation Laboratory (NSRL), Brookhaven
National Laboratory, 2020. Available at (last retrieved March 31, 2020):
https://www.bnl.gov/nsrl/userguide/beam-ion-species-and-energies.php
“Electrical, Electronic, and Electromechanical (EEE) Parts Assurance Standard,” NASA-STD-
8739.10, June 13, 2017.
“Heavy ion Beams, Revised March 2020,” Texas A&M University Cyclotron Institute, 2020.
Available at (last retrieved March 31, 2020):
https://cyclotron.tamu.edu/ref/images/heavy_ion_beams.pdf
“JSC Design and Procedural Standards,” Johnson Space Center, Engineering Directorate, JSC-
STD-8080, Standard E-22 Ionizing Radiation Effects on Electronics, October 2011.
Available at: https://ntrs.nasa.gov/archive/nasa/casi.ntrs.nasa.gov/20120015984.pdf)
“Measurement and Reporting of Alpha Particles and Terrestrial Cosmic Ray-Induced Soft Errors
in Semiconductor Devices,” JEDEC Solid State Technology Association, JEDEC Standard
JESD89, August 2001.
“Particle Therapy Facilities in Clinical Operation,” Particle Therapy Co-Operative Group
(PTCOG), last updated February 2020. Available at (last retrieved March 31, 2020):
https://www.ptcog.ch/index.php/facilities-in-operation

53
“Radiation Single Event Effects (SEE) Impact on Complex Avionics Architecture Reliability,”
NASA/TM-2019-220269, NESC-RP-17-01211, April 2019. Available at (last retrieved May
1, 2020): https://ntrs.nasa.gov/archive/nasa/casi.ntrs.nasa.gov/20190002742.pdf
“Single Event Effects Test Method and Guidelines,” European Space Agency, European Space
Components Coordination, ESCC Basic Specification No. 25100, October 2014.
“Space Product Assurance Derating - EEE Components,” European Cooperation for Space
Standardization, ECSS-Q-ST-30-11C Rev 1, October 3, 2011.
“Space Product Assurance Radiation Hardness Assurance - EEE Components,” European
Cooperation for Space Standardization, ECSS-Q-ST-60-15C, October 1, 2012.
“Standard Guide for the Measurement of Single Event Phenomena (SEP) Induced by Heavy Ion
Irradiation of Semiconductor Devices,” ASTM International, ASTM F1192 – 11, reapproved
2018.
“Technical Requirements for Electronic Parts, Materials, and Processes used in Space Vehicles,”
USAF Space Command, Space and Missile Systems Center Standard, SMC-S-010, April 12,
2013.
“Test Procedures for the Measurement of Single-Event Effects in Semiconductor Devices from
Heavy Ion Irradiation,” JEDEC Solid State Technology Association, JEDEC Standard
JESD57A, November 2017.
“Test Standard for the Measurement of Proton Radiation Single Event Effects in Electronic
Devices,” JEDEC Solid State Technology Association, JEDEC Standard JESD234, October
2013.
“Testing at the Speed of Light: The State of U.S. Electronic Parts Space Radiation Testing
Infrastructure,” National Academies of Sciences, Engineering, and Medicine, Washington,
DC, The National Academies Press, 2018. Available at: https://doi.org/10.17226/24993
Boruta, N., Lum, G. K., O’Donnell, H., Robinette, L., Shaneyfelt, M. R., and Schwank, J. R., “A
New Physics-Based Model for Understanding Single-Event Gate Rupture in Linear
Devices,” IEEE Transactions on Nuclear Science, Vol. 48, No. 6, December 2001.
Buchner, S. P., Miller, F., Pouget, V., and McMorrow, D. P., “Pulsed-Laser Testing for Single-
Event Effects Investigations,” IEEE Transactions on Nuclear Science, Vol. 60, No. 3,
December 2013.
Buchner, S., Kanyogoro, N., McMorrow, D., Foster, C. C., O’Neill, P. M., and Nguyen, K.V.,
“Variable Depth Bragg Peak Method for Single Event Effects Testing,” IEEE Transactions
on Nuclear Science, Vol. 58, No. 6, December 2011.
Buchner, S., Marshall, P., Kniffin, S., and LaBel, K., “Proton Test Guideline Development:
Lessons Learned,” NASA Electronic Parts and Packaging (NEPP), Goddard Space Flight
Center, August 22, 2002. Available at (last retrieved April 2, 2020):
https://radhome.gsfc.nasa.gov/radhome/papers/Proton_testing_guidelines_2002.pdf.
Cascio, E. W., “A Five-Year Compendium of Proton Test Usage Patterns at The Francis H. Burr
Proton Therapy Center,” 2018 IEEE Radiation Effects Data Workshop (REDW), 2018.
Cascio, E. W., chart presentation, 2015 SEE Symposium, unpublished.

54
Department of Defense, “Test Method Standard, Test Methods for Semiconductor Devices,” Test
Method 1080 Single Event Burnout and Single Event Gate Rupture, MIL-STD-750E,
November 20, 2006.
Dodds, N. A., Schwank, J. R., Shaneyfelt, M. R., Dodd, P. E., Doyle, B. L., Trinczek, M.,
Blackmore, E. W., Rodbell, K. P., Gordon, M. S., Reed, R. A., Pellish, J. A., LaBel, K. A.,
Marshall, P. W., Swanson, S. E., Vizkelethy, G., Van Deusen, S., Sexton, F. W., and
Martinez, M. J., “Hardness Assurance for Proton Direct Ionization-Induced SEEs using a
High-Energy Proton Beam,” IEEE Transactions on Nuclear Science, Vol. 61, No. 6, 2014.
Foster, C. C., O’Neill, P. M., Reddell, B. D., Nguyen, K. V., Jones, B. H., Roche, N. J-M.,
Warner, J., and Buchner, S., “Certification of Parts for Space with the Variable Depth Bragg
Peak Method,” IEEE Transactions on Nuclear Science, Vol. 59, No. 6, December 2012.
George, J. S., Clymer, D. A., Turflinger, T. L., Manson, L. W., Stone, S., Koga, R., Beach, E.,
Huntington, K., Lauenstein, J.-M., Titus, J., and Sivertz, M., “Response Variability in
Commercial MOSFET SEE Qualification,” IEEE Transactions on Nuclear Science, Vol. 64,
No. 1, 2017.
Guertin, S. M., “Board Level Proton Testing for NASA Electronic Parts and Packaging
Commercial-off-the Shelf Book of Knowledge,” JPL Publication 17-7, NASA NEPP, 2017.
Available at (last retrieved May 4, 2020): https://nepp.nasa.gov/files/29179/NEPP-BOK-
2017-Proton-Testing-CL18-0504.pdf
Hales, J. M., Khachatrian, A., Buchner, S., Roche, N. J.-H., Warner, J., Fleetwood, Z. E.,
Ildefonso, A., Cressler, J. D., Ferlet-Cavrois, V., and McMorrow, D., “Experimental
Validation of an Equivalent LET Approach for Correlating Heavy-Ion and Laser-Induced
Charge Deposition,” IEEE Transactions on Nuclear Science, Vol. 65, No. 8, August 2018.
Hansen, D. L., “Design-of-Experiments and Monte-Carlo Methods in Upset Rate-Calculations,”
IEEE Transactions on Nuclear Science, Vol. 67, No. 1, 2020.
Hiemstra, D. M. and Blackmore, E. W., “LET Spectra of Proton Energy Levels From 50 to 500
MeV and Their Effectiveness for Single Event Effects Characterization of Microelectronics,”
IEEE Transactions on Nuclear Science, Vol. 50, No. 6, December 2003.
Kai, N., Zhang, E. X., Samsel, I. K., Schrimpf, R. D., Reed, R. A., Fleetwood, D. M., Sternberg,
A. L., McCurdy, M. W., Ren, S., Ma, T.-P., Dong, L., Zhang, J. Y., and Ye, P. D., “Charge
Collection Mechanisms in GaAs MOSFETs,” IEEE Transactions on Nuclear Science, Vol.
62, No. 6, December 2015.
LaBel, K. A. and Gates, M. M., “Single-Event-Effect Mitigation from a System Perspective,”
IEEE Transactions on Nuclear Science, Vol. 43, No. 2, April 1996.
LaBel, K. A., “Proton Single Event Effects (SEE) Guideline,” NASA Electronic Parts and
Packaging (NEPP), August 2009. Available at (last retrieved April 2, 2020):
https://nepp.nasa.gov/files/18365/Proton_RHAGuide_NASAAug09.pdf
LaBel, K. A., “Radiation Requirements and Requirements Flowdown: Single Event Effects
(SEEs) and Requirements,” HEART Short Course, March 12, 2003.
Ladbury, R., “Latent Damage, Best Test and Analysis Practice for Managing Risks,” GSFC
NASA Advisory NA-GSFC-2005-05, August 29, 2005.

55
Ladbury, R., (2) “Statistical Properties of SEE Rate Calculation in the Limits of Large and Small
Event Counts,” IEEE Transactions on Nuclear Science, Vol. 54, No. 6, 2007.
Ladbury, R., “Radiation Hardening at the System Level,” 2007 IEEE NSREC Short Course,
2007.
Ladbury, R., “Risk Methodology for SEE Caused by Proton-Induced Fission of High-Z
Materials in Microelectronics Packaging,” IEEE Transactions on Nuclear Science, 2020 (in
print).
Ladbury, R., “Strategies for SEE Hardness Assurance: From Buy-It-And-Fly-It to Bullet Proof,”
presented at the 2017 IEEE Nuclear and Space Radiation Effects Conference (NSREC), New
Orleans, LA, July 17-21, 2017. Available at:
https://ntrs.nasa.gov/archive/nasa/casi.ntrs.nasa.gov/20170006865.pdf
Ladbury, R. and Campola, M. J., “Statistical Modeling for Radiation Hardness Assurance:
Toward Bigger Data,” IEEE Transactions on Nuclear Science, Vol. 62, No. 5, 2015.
Ladbury, R., Lauenstein, J.-M., and Hayes, K. P., “Use of Proton SEE Data as a Proxy for
Bounding Heavy-Ion SEE Susceptibility,” IEEE Transactions on Nuclear Science, Vol. 62,
No. 6, December 2015.
Lum, G. K., Boruta, N., Baker, J. M., Robinette, L., Shaneyfelt, M. R., Schwank, J. R., Dodd, P.
E., and Felix, J. A., “New Experimental Findings for Single-Event Gate Rupture in MOS
Capacitors and Linear Devices,” IEEE Transactions on Nuclear Science, Vol. 51, No. 6,
December 2004.
Lum, G. K., O’Donnell, H., and Boruta, N., “The Impact of Single Event Gate Rupture in Linear
Devices,” IEEE Transactions on Nuclear Science, Vol. 47, No. 6, December 2000.
Massengill, L.W., Kerns, D. V., Jr., Kerns, S. E., and Alles, M. L., “Single-Event Charge
Enhancement in SOI Devices,” IEEE Electron Device Letters, Vol. 11, No. 2, February 1990.
McMorrow, D., Melinger, J. S., Knudson, A. R., Buchner, S., Tran, L. H., and Campbell, A. B.,
“Charge-Enhancement Mechanisms of GaAs Field-Effect Transistors: Experiment and
Simulation,” IEEE Transactions on Nuclear Science, Vol. 45, No. 3, June 1998.
Mutuel, L. H., “Single Event Effects Mitigation Techniques Report,” Federal Aviation
Administration, Report No. DOT/FAA/TC-15/62, February 2016.
O’Bryan, M. V., et al., “Compendium of Recent Single Event Effects for Candidate Spacecraft
Electronics for NASA,” in Proceedings of the IEEE Radiation Effects Data Workshop
(REDW), San Francisco, CA, July 2013, pp. 22–29.
O’Neill, P. M., Badhwar, G. D., and Culpepper, W. X., “Risk Assessment for Heavy Ions of
Parts Tested with Protons,” IEEE Transactions on Nuclear Science, Vol. 44, No. 6,
December 1997.
Petersen, E. L., Pickel, J. C., Adams, J. H., and Smith, E. C., “Rate Predictions for Single Event
Effects – A Critique,” IEEE Transactions on Nuclear Science, Vol. 39, No. 6, December
1992.
Petersen, E. L., “Single-Event Data Analysis,” IEEE Transactions on Nuclear Science, Vol. 55,
No. 6, December 2008.

56
Petersen, E., Single Event Effects in Aerospace, Wiley, 2011.
Petersen, E. L., Koga, R., Shoga, M. A., Pickel, J. C., and Price, W. E., “The Single Event
Revolution,” IEEE Transactions on Nuclear Science, Vol. 60, No. 3, June 2013.
Poivey, C., Buchner, S., Howard, J., LaBel, K., and Pease, R., “Testing and Hardness Assurance
Guidelines for Single Event Transients (SETs) in Linear Devices,” October 24, 2005.
Available at: https://radhome.gsfc.nasa.gov/radhome/papers/SET_Linear05.pdf
Roche, N. J-H., Buchner, S. P., Foster, C. C., King, M. P., Dodds, N. A., Warner, J. H.,
McMorrow, D., Decker, T., O’Neill, P. M., Reddell, B. D., Nguyen, K. V., Samsel, I. K.,
Hooten, N. C., Bennett, W. G., and Reed, R. A., “Validation of the Variable Depth Bragg
Peak Method for Single-Event Latchup Testing Using Ion Beam Characterization,” IEEE
Transactions on Nuclear Science, Vol. 61, No. 6, December 2014.
Sahu, K., “Instructions for EEE Parts Selection, Screening, Qualification, and Derating,” EEE-
INST-002, NASA/TP—2003-212242, (2003, original document; April 2008, revision to
incorporate addendum 1).
Schwank, J. R., Shaneyfelt, M. R., and Dodd, P. E., “Radiation Hardness Assurance Testing of
Microelectronic Devices and Integrated Circuits: Test Guideline for Proton and Heavy Ion
Single-Event Effects,” Sandia National Laboratories Document SAND 2008-6983P, 2008.
Titus, J. L., “An Updated Perspective of Single Event Gate Rupture and Single Event Burnout in
Power MOSFETs,” IEEE Transactions on Nuclear Science, Vol. 60, No. 3, June 2013.
Turflinger, T. L., Clymer, D. A., et al., “RHA Implications of Proton on Gold-Plated Package
Structures in SEE Evaluations.” IEEE Transactions on Nuclear Science, Vol. 62, No. 6,
December 2015.

57
8.0 Single Event Effects Criticality Analysis (SEECA)
Return to Main See Also:
Appendix C
8.1 Section Summary
A SEECA offers a methodology to identify the impact of SEEs on mission, system, and
subsystem reliability. It provides guidelines for the assessment of SEE-induced failure modes or
impacts throughout a mission’s concept of operations. To weigh the consequences associated
with SEEs and how they propagate through a design at the system level, it is important to take
into account the application, predicted environment, and functional operating requirements to
support RHA success. This section intends to guide when and how to use SEECA for verification
of availability, performance, schedule, and cost risk associated with SEE for a chosen
environment iteratively throughout the design process. Early adoption is necessary; if performed
too late in the project life cycle, a SEECA cannot affect the design. If the analysis begins during
formulation and preliminary design, then it can aid in adoption of new technologies, simplify
design complexity, and provide verification of reliability goals. SEECA may be used in
determining the severity of faults caused by SEEs, accounting for criticality of functions
performed, and identifying the necessity to design for SEE tolerance. A completed SEECA is a
tool for radiation tolerant design, requirements generation for SEEs, design verification, and
requirements validation [SEECA, 1996]. This section describes SEE hazards and suggests how
to use a SEECA to categorize these threats from a systems perspective for active design trades. It
discusses the relationship SEECA has to mission requirements, and gives guidance on how to
implement this type of analysis.
From SEECA documentation, “Our aim is not to prescribe approaches to SEE immune system
design, but rather to examine the analysis process and suggest streamlined approaches to the
related design problems” [SEECA, 1996].

58
Section Highlights and Takeaways
• This is a process that largely mimics what is already current SOTP in the reliability world
(e.g., failure mode, effects, and criticality analysis (FMECA), fault trees, etc.) but tailored
specifically for radiation effects. SEECA is best performed during the design phase (e.g.,
FMECA).
• SEECA defines three different criticality classes: functional, vulnerable, and critical.
• SEEs are directly related to the mission, its environment, its applications, and its lifetime;
availability and criticality together determine the need to perform more analysis/testing for
SEE.
• SEECA provides a methodology that facilitates the incorporation of application-specific
information derived from testing or existing results.
• SEECA evaluates the sensitivity of a part/component/system versus a given environment to
understand sensitivity to the hazard.
• In this context, “sensitivity” includes two parts: 1) destructive effects that impact
reliability (non-recoverable SEE) and 2) nondestructive effects that will or could impact
availability (recoverable SEE).
8.2 SEE Hazards
Charge deposition in semiconductor devices and ICs can lead to adverse operations or part
failure. These outcomes and the natural space radiation environment’s contribution present the
SEE hazard. Where they are not defined in the previous sections, acronyms used for SEE
classification tied to mechanism can be found defined within EIA/JESD57A [2017]. SEEs
inherently have application-specific responses (see Section 10 on SEE). These applications
dictate the physics and susceptibilities within the device tied to electric field, intended charge
storage, device manufacturing processes, and type of semiconductor material. In other words,
some hazards are only present under certain application conditions and are more likely in
specific environments.
In addition, nondestructive SEE are probabilistic events treated as MTBF, not the same as long-
term degradation treated as MTTF (see Section 8 on TID). Complex responses that are possible
may have system impacts that take significant time or operations to get back to a known state,
including ground intervention. Such outcomes may require analysis of mean time to repair
(MTTR), where availability constraints are violated. Special attention when considering the
difference between destructive and nondestructive events shows that mission duration and
availability can become drivers for events that are deemed allowable in a given architecture.
Attention to this distinction will have an impact on the SEECA outcomes, design mitigations,
and captured risks.
The hazards from SEE wholly depend on the mission environment and the electrical application-
specifics (e.g., supply voltage, clock speed, duty cycle, etc.), which can determine the likelihood
of destructive events or impact the rate of error accumulation. Designers may employ mitigation
schemes, covered in Section 10 for some effects to achieve mission objectives. SEE mitigation
has the desired outcome of reducing the consequence of an effect, including combination or
accumulation of effects for a given function that is critical to mission success. Mitigation can be
verified or tailored with appropriate single event data and system architectures; data usability and
test requirements will be explored in Section 12. Applicable data (i.e., same application, device)

59
can help determine possible outcomes and can be used within the analysis to verify functional
requirements.
Investigation at a more abstract level is only feasible with an understanding of the interaction
between technology responses to their environment and function within the design (including
mitigation).
8.3 SEEs at the System Level
Typically, space system design is broken into blocks. Figure 8.3-1 shows a hierarchical view;
spacecraft functions are built from subsystem functions, which are implanted physically at the
box (assembly), circuit board (card), circuit, or individual device/IC level. These diagrams help
describe complex functions at the system level. To understand the impact of a SEE at the system
level, the response and any mitigations must be considered locally [Gates, 1995; LaBel, 1996].
Understanding the overall function of the parts and their combinations in a system makes it
easier to identify the impacts or consequences of SEEs. Functions can be spread across
subsystems (e.g., safe-hold or attitude control) where criticality of function becomes the
parameter of interest for a SEECA.
Figure 8.3-1. Levels of Spacecraft Design [Gates and LaBel, 1995]
8.3.1 System-Level Inference
8.3.1.1 Box versus Board versus Part Level Analysis
A SEECA can be done from many vantage points. In doing so, inputs and outputs of these
analysis can be used to communicate requirements verification through having met the functional
requirements at any desired level. Requirements must span or flow down to boxes/boards and the
parts within, such that SEECA outcomes can be used to concatenate verification, minimizing
time and cost. The requirements of reliability and availability, when clearly communicated down

60
to the lower levels, enable performance impacts to be reviewed alongside the SEECA. Some
reference requirements and their translation into radiation requirements can be found in the
Appendix B.
Ideally, requirements that span or flow down to boxes, boards, and the parts within will have
common language across systems engineering and radiation engineering. Communicating
reliability and availability constraints will inform the radiation requirements generation and
determine the necessary testing or analysis that will follow. Targeted test/analysis requires inputs
that cater to the specific application and will produce different results; SEECA can aid in test
development and results interpretation if characterization is performed on combinations of
components rather than at the typical part level. A test campaign that results in useful data will
take into account the mission environment and application. Environmental contributors are
discussed in Section 6, and considerations for testing are addressed in Section 12.
It may be impossible to provide relevant information at all levels or characterize an entire system
due to the entirety of the state space. A comprehensive SEECA can help determine which
missing information is critical and for which categories the impact is negligible. To obtain this
answer, analysis of the functions that systems and subsystems are being required to provide
context of SEE impact.
8.3.1.2 Functional Analysis
SEECA is based on functional requirements. Therefore, using all available information to
determine the criticality of a function based on reliability and availability is essential. Functions
can be considered centralized or distributed. A functional requirement may span multiple boxes
or cards within a system. Single-string or redundant system architectures can be used to identify
the consequences or assert criticality for different functions. In some cases, functional
requirements can only be met through diverse redundancy when considering radiation effects
altogether (e.g., SEE with TID/TNID). Functions may include critical systems throughout the
mission (e.g., power management and distribution (PMAD) and guidance, navigation, and
control (GNC)), or can be tied directly to science objectives (e.g., data storage and retention or
transmission and downlinking). It is imperative that these functions be tied to their need for
reliability and availability.
Further considerations for the SEE impact on functions are essential building blocks for
producing the SEECA:
• Does the function need to work through all phases of mission operation (i.e., reliability)?
• Are there specific phases or operating times where the function must work without error or
interruption (i.e., availability)?
• What is the overall criticality classification?
8.3.2 Criticality Classification
The SEECA does not simply capture an assessment of all SEE responses for each part and total
them, it uses system-level concerns to identify and categorize impact to the system in question.
The characterization of a device response to heavy ions provides a part-level susceptibility.
These types of data can help begin SEECA at the circuit level. Responses that have the potential
to propagate in a circuit can be analyzed for a card or board. SEECA then calls for categorization
of impacts that SEE piece-part responses can have, as well as the propagation of those responses.

61
These “criticality classes” or categorizations are unique in that they capture the consequences of
unintended operation at the functional level:
• Error-Critical: function where SEEs are unacceptable.
• PMAD throughout the mission: no destructive effects, due to the need for high reliability
across system.
• GNC during critical maneuvers (e.g., docking; entry, descent, and landing; touch-and-go;
orbit changes, etc.): no interruptions to availability during these windows.
• Pyrotechnical and separation events.
• Environmental control and life support systems.
• Error-Vulnerable: function where low probability for SEE is required, response with
mitigation or risk of SEE is permissible.
• PMAD: single event transient of sufficient magnitude to reset a box or card.
• Data transmission: SEFI impact on availability during downlink over ground station.
• Processor (embedded or standalone) with known error rate.
• Error-Functional: function may be unaffected by SEE; large probability of events may be
acceptable.
• Data retention: memory storage can reliably detect and correct errors without loss of
information.
• Data transmission: transient effects or loss of packets acceptable for telemetry having
continued measurements.
Figure 8.3-2 depicts a decision tree for categorizing the criticality of a SEE response, referred to
as the severity assessment in the diagram. This decision tree is not limited to the part-level data
that are available. The severity can be assessed for functions that contain many systems and
subsystems working together.
Figure 8.3-2. Example Single-Event Severity Flow Diagram [SEECA, 1996]

62
Identifying SEEs that are allowable or SEEs with mitigation that are allowable at this stage can
highlight functional susceptibilities and can help visualize where redundancy may need to be
incorporated into radiation requirements. This initial mapping can inform the decision to do
nothing (i.e., accept risk), the plan to do something within the design (i.e., mitigate with
operation), or the removal/replacement of something in the design (i.e., mitigate with
architecture):
• To do nothing indicates that the risk of the type of SEE occurring is acceptable, or that the
SEE is acceptable or does not affect the design operation.
• To do something indicates that the outcome of an SEE is anticipated and the system can be
returned to a known state, or the error can be corrected without diminishing the functional
objective (operational mitigation).
• Removal/replacement (architectural mitigation) may mean alternate parts selection to
accomplish the function, or it may be the act of simplifying the design by reducing utilization
or numbers of strings. It may mean selectively calling upon a function, or disabling the
function for a given environment or operational phase as necessary for mission success.
In some instances, piece-part and functional responses allow for easy categorization due to
application information. Consider a voltage regulator with filtering on the device output (e.g.,
SETs may be frequent but will be dampened) or a temperature sensor used for telemetry that is
not critical (e.g., infrequent anomalous readings are averaged out or ignored). In that sense, for
functions whose criticality is low or are used sparingly during the mission, using a SEECA
allows risks to be addressed with unknowns or limited data [Campola, 2020].
At other times, this classification is more difficult to assert. In particular, devices with multiple
SEE responses can prove to be a challenge to categorize even with mitigation in place. Complex
and emerging technologies provide more functions within a package, which directly relates to the
number of architectures on chip. Different architectures lead to different SEE responses, and
nondestructive effects can lead to inoperable states, contention, or loss of device communication.
These types of responses are often labeled SEFIs, which may require a reset or power cycle to
recover operability [LaBel and Berg, 2005]. Mitigation of these responses requires consideration
of time to return to a known state, which can require other spacecraft functions (e.g., power
up/down), thereby impacting availability across the system. Quantifying the risk for functional
downtime across subsystems is justification for conducting the SEECA.
Because of these decisions and trades, the timing of performing a SEECA demands early
adoption and consistent iteration in the project life cycle. Changing the design can mean
selecting different parts for the job, adding circuitry for mitigation, and/or adding software for
mitigation. These changes and mitigation tailoring are the desired outcome of the SEECA.
Changing the design can be a top-down approach, where functional awareness can be the choice
between operations or safe holding during transit through higher radiation hazards (i.e., the South
Atlantic Anomaly (SAA), near the poles). The mission objectives, which predominantly dictate
the environment, and how long the system will spend there and why, can drive these decisions.
8.3.3 Mission, Environment, Application, and Lifetime (MEAL)
RHA practices include defining and evaluating the radiation environment [LaBel, 1999] external
and internal to the spacecraft. The prediction of a space environment that is dynamic requires
different models for a given radiation source and for different scenarios. SEECA relies on the

63
environment specifications (e.g., particle fluxes during a given solar cycle or solar particle event)
to make determinations and identify applicable environments for a given function. Conducting a
SEECA is one activity that supports a mission’s RHA assessment and relies on more information
than the components selected. The iterative approach to SEECA facilitates requirements
generation and informs the decision regarding which environment scenarios to consider for
worst-case conditions versus nominal operations. To categorize the SEE severity, the RHA lead
must weigh holistically the mission objectives, the intended environment, and device MEAL
[Gonzales 2017]. The MEAL approach breaks mission phases into critical and non-critical based
on reliability models and inherited availability, the level at which the mission phases are divided
is more abstract but provides valuable information and evidence of which functions are critical.
In some phases, the criticality can be asserted locally (i.e., destructive effects in a single string
may be unacceptable). In other instances, understanding of the mission objectives or
requirements is necessary to make the distinction (e.g., data retention or throughput during solar
flare conditions for space-weather monitoring). Table 8.3-1 captures how a function and its
criticality may relate to a mission consequence, which suggests:
• Requirements alternately may be defined by function (e.g., system-level parameters, such as
data coverage, etc.) rather than by piece-part requirements.
• Mission concept of operations (CONOPS) needs to be addressed; the criticality of functions
can be time- or mission-phase dependent (e.g., launch, transit, commissioning, docking, or
science data collection).
Table 8.3-1. Sample of Consequence Criteria
Function Mission Criticality Mission Consequence
GNC Error-vulnerable Interruption of pointing for downlinking or critical
station-keeping maneuvers
PMAD Error-critical Loss of observatory, subsystem, or instrument
functionality
Data Transmission Error-functional Loss of packets or telemetry with continued
measurements
Some functions and the severity will depend on the mission lifetime or a given CONOPS. For a
given environment based on one risk posture or another, these determinations and findings are
captured by a SEECA alongside the requirements levied on the design functions. Risk posture
can dictate radiation engineering efforts (e.g., screening for destructive effects, or error-critical
functions; treating cold-sparing applications with MTTR calculations, or error-vulnerable; and
verifying application responses with MTBF or rate calculations, or error-functional).
8.4 SEECA and Requirements Flow
To make use of the SEECA process, information must flow into the analysis, and an
implementation strategy must be agreed upon. Environmental requirements coming from the
DSNE (see Section 3.4) will be part of the systems engineering and RHA activities/strategy.
MEAL descriptors (e.g., mission class) are determined with systems engineers to identify the
critical functions through mission operations/phases, and reliability and availability need to be
agreed upon at a functional level for these different operating modes. SEECA is a methodology
for documenting assumptions and rationale that RHA for SEE is being considered appropriately,
without hindering innovation. Captured assumptions associated with acceptable risks, with
design implementations, are directly related to the requirements flow shown in Figure 8.4-1.

64
Figure 8.4-1. RHA Flow with SEECA Considerations
Some reliability and maintainability (R&M) practices like Goal Structuring Notation (GSN)
[ACWG, 2018] can aid in the capture and tracking of assumptions. In addition, the outputs and
findings from a SEECA can determine which information is needed to address a system concern.
It can inform the type of testing that would be required to mitigate a risk or consequence or
provide a path where insufficient data can be acceptable based on the application.
SEECA can inform the radiation requirements generation by identifying the environmental/
application conditions that need to be assessed, including:
• System response time, including the effects of:
• Fault isolation.
• Detection.
• Recovery, if present.
• Function/system criticality for:
• Mission phase.
• Availability.
• System sensitivity to increases in the radiation environment, for example:
• Solar event phenomena.
• Orbital parameters (e.g., SAA, near magnetic poles, or traversing the Van Allen belts).
• In all cases, impacts of redundancy must be taken into account:
• Cold spares.
• Voting schemes.
• Detection and correction.
8.5 Guidance for SEECA Implementation
SEECA are performed by the RHA lead with input from systems engineering and safety and
mission assurance. The teams of engineers must work together to establish which requirements
can be impacted by SEE and which risks are carried. Importantly, team members must be able to
update frequently as the design progresses or changes.
Implementing SEECA happens twofold:
• Parts radiation data provides a grassroots, or bottom-up, approach. Will the response from a
given part propagate or be impactful to the circuit, card, or assembly? Are there data to
support that the response is of no concern? Are available data representative of the
application intended to be flown?
• Requirements for SEE stem/begin from the environment and mission objectives; this is the
top-down approach. How critical is the function to the mission? Does anything need to be
changed to meet performance or reliability requirements?

65
Note that where the two approaches aim to meet in the middle is not always captured in
documentation. SEE test data that are available may provide information on the characterization
of a device that is agnostic of the application, reliability requirements may be in terms of system
data rates with many contributing components to a function, etc. The process of applying test
data to the component’s application in the system is difficult to review/verify.
Often, design margins and best practices for robust circuit design can have positive outcomes for
some SEE concerns. Those positive outcomes of certain SEEs at the part level not having an
impact at the circuit level are built on assumptions that the design will not change or that the
function of the circuit remains intact through design iterations.
Tracking these assumptions used for justification and verification of requirements can be done
through the practice of documentation (e.g., meeting notes, part lists, etc.). There are no required
tools or software to conduct a SEECA. However, there are benefits to be gained by using
graphical arguments to retain relational information (e.g., mission phase, availability) with
supporting evidence using standards or frameworks (e.g., GSN) [Austin 2017]. While the
conventional R&M hierarchy depicts how to use an argument to write a requirement, GSN is an
argument for meeting a requirement (for more detailed information on GSN, see Appendix C),
which makes GSN a useful tool for SEECA. Figure 8.5-1 depicts the graphical argument made
by a SEECA. In the figure, system requirements for availability and reliability (grey box) are
achieved by setting the RHA goal (shown in light blue) and meeting that goal with appropriate
evidence/solutions. Context is provided through the RHA plan for the mission, shown in the
yellow box. The plan provides the radiation requirements and methodology or rationale for
components to be acceptable for use. RHA plans follow the same process for different mission
risk postures, including considerations for a given MEAL. The confidence levels for mission
environment models may change, but the RHA process remains the same. The criteria for what
constitutes sufficient information and acceptable data may vary for different risk acceptance
strategies.
Figure 8.5-1. Boxed Representation of SEECA

66
Regardless of the top-level radiation requirements, the goal is for intended function performance
as expected in the presence of the natural space radiation environment. Mission requirements
(e.g., availability and reliability) will need to be met or verified by the analysis and testing as
evidence. The SEECA activities (or sub-goals) at the functional level allow for the identification
of functions that are the most susceptible to single events, which may be through the function’s
tolerances or timing or may be due to the parts or components required to enact that function. It
is important to track and rely on the independence of the information (e.g., radiation data, design
knowledge, and assumptions).
To identify the susceptible functions, two sub-goals must be completed: (1) categorization of the
function’s criticality into the three buckets and (2) determination of the SEE hazard based on the
mission context. Evidence like mitigation, test data, and the CONOPS can help with
categorization and determining whether a hazard contributes to the SEE response. Figure 8.5-1
captures these activity and information relations. SEECA is able to make use of and track that
information if implemented early enough in the project lifecycle (see Table 8.5-1).
Table 8.5-1. Steps for Implementing SEECA
1. Define the mission environment (i.e., external and internal to the spacecraft) for each
mission phase.
2. Identify critical functions in each phase for the CONOPS.
3. Establish system architectural dependencies: Identify the systems and subsystems tied to
the functions that are critical for mission success.
4. Tie mission requirements for each unique availability mode to the CONOPS.
5. Translate functional requirements into SEE requirements at the level the analysis is being
done (parts/boards/boxes).
6. Determine criticality: categorize SEE severity as critical, vulnerable, or functional within a
function.
7. Weigh and analyze consequence versus criticality, with respect to goal of availability or
reliability.
8. Determine recourse or engineering trades.
9. Collect evidence: capture assumptions, analyze data (e.g., testing, similarity, heritage, or
lack thereof), and verify functional requirements.
10. Finalize a radiation analysis (e.g., verified requirements, criticality classifications, rate
calculations where needed).
11. Follow RHA principles on new data or changes in the design with iterations to the analysis
and trade space, update requirements or environment models, if necessary.
The deliverables associated with the SEECA are the environment description, radiation
requirements, and a radiation analysis report. Tools like GSN, MBMA, and System Engineering
and Assurance Modeling 0(SEAM) document those justifications and aid in the verification of
requirements.
8.6 References
Austin, R. A., Mahadevan, N., Sierawski, B. D., Karsai, G., Witulski, A. F., and Evans, J., “A
CubeSat-Payload Radiation-Reliability Assurance Case using Goal Structuring Notation,” in
Proc. Ann. Reliability and Maintainability Symp., January 2017, pp. 1–8.

67
Campola, M., Ladbury, R., Austin, R., Wilcox, E., Kim, H., Pellish, J., and Label, K. “Single
Event Transient Case Study for System-Level Radiation Effects Analysis,” NSREC
Presentation, 2020. Available at: https://ntrs.nasa.gov/citations/20205009687
EIA/JESD57A, “Test Procedures for the Measurement of Single-Event Effects in Semiconductor
Devices from Heavy Ion Irradiation (EIA/JEDEC Standard,” November 2017. Available at:
https://www.jedec.org/standards-documents/docs/jesd-57)
Gates, M. and LaBel, K., "A Systems Engineering Approach to the Design of Survivable
Electronics for the Natural Space Ionizing Radiation Environment," AIAA Paper 95-0843,
January 1995.
Gonzales, O., “Guidelines for Verification Strategies to Minimize RISK Based on Mission
Environment, Application and Lifetime (MEAL),” Available at:
https://ntrs.nasa.gov/archive/nasa/casi.ntrs.nasa.gov/20180007514.pdf
“GSN Community Standard Version 2,” the Assurance Case Working Group (ACWG) Std.
SCSC-141B, January 2018.
Label, K. and Berg, M., “Complex Parts, Complex Data: Why You Need to Understand What
Radiation Single Event Testing Data Does and Doesn't Show and the Implications Thereof,”
GOMAC Presentation, 2005. Available at:
https://ntrs.nasa.gov/archive/nasa/casi.ntrs.nasa.gov/20150004129.pdf
LaBel, K. and Gates, M., “Single Event Effect Mitigation from a System Perspective,” IEEE
Transactions on Nuclear Science Special Edition, 1996.
Label, K., Johnston, A. H., Barth, J. L., Reed, R. A., and Barnes, C. E. “Emerging Radiation
Hardness Assurance (RHA) Issues: A NASA Approach for Space Flight Programs,” IEEE
Transactions on Nuclear Science, Vol. 45, 1999, pp. 2727–2736. DOI:10.1109/23.736521.
“SEAM (System Engineering and Assurance Modeling).” Available at:
https://modelbasedassurance.org
“Single Event Effect Criticality Analysis,” NASA HQ/Code QW, GSFC, Greenbelt, MD, Tech.
Rep. 431-REF-000273, February 1996. Available at:
https://radhome.gsfc.nasa.gov/radhome/papers/seecai.htm

68
9.0 Radiation Testing and Analysis
Return to Main See Also:
Appendix E
9.1 Section Summary
The destructive nature of radiation testing means that validation of radiation requirements and
performance must be done by analysis, with testing providing the information needed by the
analysis to bound risk due to the radiation threat. This means that test and analysis procedures
must be closely coordinated to ensure the analysis has the information needed to bound the threat
risk. Test and analysis are also driven by the nature and mechanism, sources of
uncertainty/variability, and consequences of the radiation threat. Moreover, because the risk
posed by an error/failure mode must be determined by analysis, testing must emphasize revealing
these modes rather than merely observing whether they are discovered in a “realistic” radiation
environment (called “test like you fly” (TLYF)). As such, testing is often carried out for worst-
case or bounding conditions rather than those likely to be found in the radiation environment.

69
Section Highlights and Takeaways
• The destructive nature of radiation testing means that validation of a part’s radiation
performance must be via probabilistic analysis, with testing of a representative sample of
sufficient size and fidelity supplying the information needed to determine failure
consequences and probabilities.
• A probabilistic analysis can only assess risk for the error/failure modes revealed by testing.
As a result, testing at worst-case conditions is favored over “realistic” exposures. The fact
that even rare SEE modes can occur at any time makes revealing them especially important.
However:
• Worst case can be defined for a specific application (e.g., bias, operation, temperature,
etc.) or for generic specifications (e.g., military temperature range (–55 °C – +125 °C)
etc.).
• Test conditions can be worst case or TLYF. Worst-case conditions can be used to provide
a highest bound for a particular result and TLYF can be used to provide application-
specific data with a test system designed to increase event capture probabilities.
• Some worst-case conditions (e.g., power supply voltages and operating temperature)
should be considered often. TLYF can provide application-specific test data but may not
have the necessary event capture success, depending on DUT complexity.
• Test and analysis methods must yield information that can mitigate risk by means appropriate
for the mission and the radiation threat. This may include cataloguing ways to minimize the
rate or occurrence, minimize the effect, recover normal operations, or bound the probability
of occurrence.
• Radiation test and analysis approaches must control and minimize the predominant sources
of uncertainty associated with each radiation threat.
• The high cost of radiation testing forces test and analysis approaches to compromise between
rigor and economy. Examples include limiting sample sizes or test conditions and focusing
tests to provide data required by risk management analyses.
• Not all devices require testing for all radiation effects based on mission requirements and
device technology. Note that there is also a difference between military/aerospace
qualification radiation tests (general, across multiple programs) and mission-specific
application tests.
• Testing should be performed as early in a project’s schedule as possible. This allows efficient
mitigation approaches to be added or component replacements to be made as required.
9.2 Drivers for Test and Analysis Methodologies
Radiation test and analysis methodologies are intended to evaluate risk arising from the radiation
threat targeted by the methodology. As such, understanding the similarities and differences
between the approaches for different radiation threats requires understanding how these
approaches elucidate the elements of the risk—the consequences of an error/failure mode and the
probability of its occurrence. Driving factors for radiation testing and analysis are outlined in
Table 9.2-1. This in turn requires understanding that:
1. The destructive nature of radiation testing means that validation of a part’s radiation
performance must be via probabilistic analysis, with testing of a representative sample of

70
sufficient size and fidelity supplying the information needed to determine failure
consequences and probabilities.
2. A probabilistic analysis can only assess risk for the error/failure modes revealed by testing.
As a result, testing at worst-case conditions is favored over “realistic” exposures. The fact
that even rare SEE modes can occur at any time makes revealing them especially important.
3. Test and analysis methods must yield information that can mitigate risk by means appropriate
for the mission and the radiation threat. This may include cataloguing ways to minimize the
rate or occurrence, minimize the effect, recover normal operations, or bound the probability
of occurrence.
4. Radiation test and analysis approaches must control and minimize the predominant sources
of uncertainty associated with each radiation threat.
• Sampling errors, application/test conditions for TID.
• Sampling errors and damage energy dependence (some materials) for TNID.
• Poisson errors for SEE modes; application conditions for some SEE modes.
• Incomplete model for rate estimation for SEB/SEGR.
• Application conditions for some SEE modes (e.g., SETs).
5. The high cost of radiation testing forces test and analysis approaches to compromise between
rigor and economy. Examples include limiting sample sizes or test conditions and focusing
tests to provide data required by risk management analyses.
International and generally accepted standards (e.g., military standards) are written to summarize
the best guidelines based on the above considerations.
Table 9.2-1. Driving Factors for Radiation Testing and Analysis Methodologies
TID TNID Nondestructive
SEE
SEL SEB/SEGR
Test Sample
Population
Flight wafer
lot
Flight wafer
lot
Same mask set +
fab process
Same mask
set + fab
process*
Same mask set
+ fab process*
Preferred
Radiation
Source
>1-MeV
rays
Protons and
neutrons***
Heavy ions** Energetic
heavy
ions**
Worst-case
heavy ions
Main Risk
Management
Approach
Avoid parts/
TID resulting
in failures
Avoid parts/
TNID
resulting in
failures
Ensure effects
and probability
acceptable;
SEECA
Avoidance;
ensure low
probability;
SEECA
Avoid parts/
voltages where
failure occurs;
SEECA
Dominant
Uncertainty
Sampling +
app.
dependence
Sampling +
E dependence
Poisson Errors Poisson
Errors
Poisson Errors
+ sampling
* Some parts have exhibited lot-to-lot or wafer-to-wafer variation.
** Although proton SEE rates can be bounded with heavy-ion data, proton testing can narrow the bound.
*** If energy dependence for TNID damage is not known, 3 energies are needed to determine it.
9.3 Using Archival Data in a Radiation Analysis
Radiation testing is expensive, difficult, and time consuming. As such, the first order of business
for any radiation test and analysis methodology is to minimize the testing that is done, thereby

71
preserving scarce resources for those applications that really benefit from testing. This is done in
a variety of ways:
1. Use of SEECA to identify and rank critical applications and radiation vulnerabilities.
2. Use of radiation-hardened parts with reliable guaranteed TID, TNID, and SEE
performance.
3. Use of archival data (especially for SEE) in lieu of duplicating the testing efforts.
Section 11 dealt with SEECA in detail. In the case of both 2 and 3 above, validation that the part
is suitable often relies on analyzing and interpreting data taken by other parties for other
purposes and applications. Although the manner in which such archival data are used and the
characteristics by which they are judged are similar to those for data from a radiation test,
archival data often pose additional challenges and may require more sophisticated analysis to
ensure the data are representative/bounding for the application under consideration. Because SEE
susceptibility does not usually vary significantly from part to part or lot to lot and because SEE
testing is often costly, archival SEE data are used more often than archival TID or TNID data.
One of the most significant challenges with using archival data is that it may be incomplete. This
is especially true when the data are gleaned from a data workshop compendium paper or a
database. However, even a test report may lack details, such as how the data were taken, why
they were taken in a particular manner, or even the extent to which the data are application
dependent. The minimum useful information concerns whether or not a particular part type is
susceptible to a given SEE. This is mainly useful for destructive SEE modes, where the primary
mitigation is threat avoidance, usually by avoiding parts susceptible to such modes. Somewhat
more useful is the information available in many data workshop compendia, which supply both
the onset LET where susceptibility to the mode starts and, perhaps, the limiting cross section for
the mode at high LET. Although such information is not sufficient to estimate a reliable rate, it
can give an indication of whether an SEE mode is likely to be common or rare. To estimate rates
requires a cross-section-versus-LET curve, or at least the fit parameters for a Weibull form to
such a curve. If, in addition to the cross sections, one also has error bars on the cross sections, or
better, event counts for each cross section, can be used to determine whether the fit to the cross
section data is conservative, a best fit, or overly optimistic. One can bound the cross section at
any desired confidence [Ladbury, 2007] and detect any deviations from expected behavior that
might indicate that standard rate estimation models are inappropriate. Finally, with access to the
test report and notes from the experimental run, it may be possible to assess the extent to which
the decisions made by the testers affect the applicability of the data to the application under
consideration.
Because data for TID and TNID must be traceable to the flight lot, and in part because testing for
these degradation modes is less costly than SEE testing, archival data are used in lieu of testing
much less often for TID and TNID than for SEE. If the data are for the parts from the flight lot
and for test conditions appropriate for the mission application(s), then application of the data is
straightforward. However, this rarely happens. If data exist for the non-flight lot, that data will
usually have limited predictive value due to lot-to-lot variability. The data can serve as a
qualitative guide for test planning and preliminary design (e.g., which parameters are sensitive
and the dose ranges where they may degrade). However, for some part types, even the parameter
that is most sensitive may vary from lot to lot. If historical data for several lots (>3 lots
minimum) exist, characterizing variability for the part type may be possible both from part to

72
part and from lot to lot, allowing degradation to be bounded to a desired confidence for the part
type if the data are well behaved.
Likewise, if data exist for several similar part types manufactured in the same fabrication
process, then it may be possible to characterize lot-to-lot and part-to-part variation for each and
then examine how these variabilities vary across part types in the process. This can be used to
bound performance for a part for a generic lot of a generic part type in the process, all for desired
levels of confidence. For SEE, if part-to-part and lot-to-lot variation are negligible, then one can
in some cases bound SEE consequences or rates for a generic part type in the process.
Use of archival data is not without risks or limitations:
• The data available may not be sufficient to bound flight-part radiation susceptibility, because:
• Available data may be inadequate to characterize the full variability of the part, part type,
or fabrication process.
• The flight part, lot, or part type may be out of family for its lot, part type, or fabrication
process, respectively.
• The data may have been taken for conditions inappropriate for the application. For example:
• Temperature (TID, TNID, and SEL).
• Bias (all).
• Dose rate (TID/ELDRS in linear bipolar devices).
• Operating frequency.
• Operating mode, including pattern effects (both SEE and TID in complex devices).
• Other dependencies must be evaluated based on part technology/functionality.
• Model used to bound flight part performance is inappropriate for data used.
• May not account for or may underestimate some or all sources of variation.
• Incorrect model used to extrapolate from one test condition to another.
• Bayesian model may have an inappropriate prior probability distribution.
• Data used in analysis may be incomplete or biased due to:
• Contamination (e.g., including SEFI-induced errors in SEU cross sections).
• Dismissing relevant failures by attributing them to non-radiation causes (e.g.,
electrostatic discharge).
• Misattribution (e.g., classifying SEFI as SEL and vice versa; attributing all degradation in
a proton test to TID or TNID and ignoring the other mechanism).
9.4 Matching Approaches to the Threat
The drivers discussed in the previous section determine the testing/analysis approaches used for
the different radiation threats.
9.4.1 TID Test and Analysis
The main challenges for TID hardness assurance arise from:
• High variability exhibited by many part types, not just from one wafer diffusion lot to the
next, but even within a wafer diffusion lot.
• Dependence of TID susceptibility on a broad range of application conditions ranging from
dose.

73
The result is that even when the test sample is drawn from the fight lot, TID failure distributions
may be not just broad, but pathological, exhibiting bimodality or even thick tails (see Appendix
E). Because pathological behavior in part-to-part and lot-to-lot variation necessitates costly
testing with large sample sizes, current radiation test methods start with an assumption that the
failure distribution is “well behaved.” This means that it is unimodal and the probability that a
part’s radiation response deviates from the mean goes to zero faster than any power law (e.g.,
according to a member of the family of exponential distributions (exponential, Gaussian, etc.)).
If the failure distribution for the part type and lot is known to be well behaved, then one can
approximate the distribution as approximately normal, allowing risk to be bounded using tools
such as one-sided tolerance limits for the standard normal distribution (so-called KTL factors)
[MIL-HDBK-814]. Evidence for a well-behaved failure distribution may come from:
• A characterization test carried out with sufficient sample sizes for enough test conditions to
ensure that worst-case conditions are identified and failure distributions are well behaved.
• Sufficient experience (e.g., test data for several lots and test conditions) to develop
confidence that worst-case test conditions are known and failure distributions are well
behaved.
If the failure distribution is not known to be well behaved, then the sample size should be
determined using binomial statistics. This leads to large sample sizes to achieve even moderate
assurance that a part will perform adequately in the mission radiation environment (e.g., 22 parts
with no failures demonstrates with 90% confidence that 90% of parts would pass the same test).
Figure 9.4-1 illustrates this situation—the graph on the left depicts how confidence changes with
sample size when the proportion of parts passing the test exceeds the level for each curve and
assuming no failures of the test are observed. As can be seen, large samples are required to have
high confidence that a large percentage of the parts would pass the test. On the other hand, the
chart on the right shows that even for a sample size of five parts, the one-sided tolerance limits
for the standard normal distribution can be used to establish high confidence of high success
probability as long as the part-to-part variation is well behaved. The advantage of having a well-
behaved radiation response is clear. Moreover, because binomial statistics do not depend on how
failures are distributed, increased margin does not necessarily translate into improved immunity
to failure (e.g., 22 parts passing at dose D does not mean 100% of parts would pass at dose D/2).
Incorrectly assuming the failure distribution is well behaved introduces systematic errors into the
analysis that can dominate other sources of error. (Figure 9.4-2 illustrates the result of applying
one-sided tolerance compared with other derating strategies.)
Finally, although in principle any ionizing radiation could be used as a source for TID testing, in
practice the preferred radiation source—and the one called out by all TID testing guidelines—is
gamma rays with energy >1 MeV. This is because such gamma rays deposit dose uniformly even
several millimeters into a test part, simplifying dosimetry and making it possible to compare TID
hardness for different parts and results from different facilities.

74
Figure 9.4-1. Sample Size and Failure Distribution Variations
Figure 9.4-1 examines the absence of constraints on the form of variability in failure
distributions (left-hand side); sample size should be determined by binomial statistics, which
requires large test samples to achieve reasonable assurance that a part will meet its radiation
requirements. However, if the failure distribution is known to be well behaved (Figure 9.4-1,
right-hand side), it can be approximated as a normal or lognormal distribution. This means that
one-sided tolerance limits can be used, where the lower bound with confidence level, CL, on the
dose below which 1–Ps parts fail is given by the expressions in the figure for assuming the
distribution is normal (red) or lognormal (blue).
Figure 9.4-2. Example of One-Sided Tolerance Limits Applied to TID Data
Figure 9.4-2 shows an example application of one-sided tolerance limits, where the black circles
represent failure levels for five parts drawn from a lognormal distribution with mean failure level
100 krad(Si) and a standard deviation of 20 krad(Si). The blue curve shows the lognormal fit to
the failure levels; the red line shows the dose where only 1% of parts under the blue curve fail.
The yellow shows the 99% success rate for the generating distribution, and the green curve
shows the dose level where based on the sample size, mean failure dose, and standard deviation

75
there is 90% confidence that 99% of the parts in the generating distribution will pass. In this
figure, the black dots depict the data, the curve depicts a lognormal best fit to the data, and the
vertical lines depict the lower bounds established using various strategies (indicated in the
legend) to avoid overpredicting the hardness of the parts.
9.4.2 TNID Test and Analysis
TNID is primarily a threat only for minority carrier devices, including bipolar transistor and
microcircuits, electro-optical devices, and detectors. Because TNID is also a cumulative
degradation mechanism, test and analysis approaches for this threat are similar to those for TID,
with a few key differences:
• Because damage depends on semiconductor lattice properties, variability is mainly from lot
to lot, rather than within a wafer lot. Test samples of five to ten parts are usually adequate.
• The only significant test/application dependence for TNID susceptibility is on temperature,
so:
• Usually, parts can be irradiated unbiased.
• It is important that parts be kept at or below the application condition between irradiation
and testing to avoid annealing that would not occur in the application.
• Although for silicon devices TNID damage scales with the NIEL because such damage
depends on production of lattice defects that are electrically active rather than all defects,
TNID damage does not necessarily scale with NIEL for materials other than silicon.
The third point has the most important implications for TNID in materials other than silicon. The
standard methodology for TNID in silicon devices assumes that damage scales with NIEL and
uses this scaling to equate the mission TNID with a fluence of a monoenergetic particle—most
commonly 1-MeV neutrons. This simplifies testing. For TNID in other materials (e.g., those used
in detectors), the energy dependence of TNID damage may not be known, so testing is often
carried out with protons near the predominant energy for the environment.
Mono-energetic particle testing is permitted in the event that there is a demonstrated 1) one-to-
one relationship between the NIEL and device degradation (measurements from comparable
devices or literature) or 2) particle energy chosen for testing leads to a worst-case degradation of
the DUT. The material damage induced by low and high NIEL particles is differentiated by the
distribution of defects, with low NIEL particles resulting in isolated defects, while high NIEL
particles result in defect clusters as well as isolated defects. Preferably, ground-based testing
should deposit the same amount of low and high NIEL DDD as in the operation environment.
Otherwise, the impact of isolated and clustered defects on device degradation should be
considered [Poivey, 2017]. Furthermore, the dimensionality of the device, as well as any cover
layers, should be considered when selecting particle energies to ensure that the particles can fully
traverse the sensitive regions of the DUT. As solar cell applications require minimal shielding,
lower energy electrons and protons can contribute to the DDD seen by the device. Irradiation
temperature and subsequent storage and measurements should be considered to ensure the impact
of annealing can be taken into account. Substantial annealing occurring during ground-based
testing that would not occur under operational conditions (e.g., cryogenic temperature missions)
could result in underestimating the actual device degradation during the mission. This principle
was demonstrated for the hot pixel population for the CCDs used by Marshall et al. [2005].

76
Energy dependence that does not follow NIEL must be determined by measuring damage for
several different energies. In many cases, the energy dependence follows a component of NIEL
(e.g., the portion due to elastic scattering or inelastic scattering). In some cases, the analyst
chooses the candidate among several candidate energy dependencies that yields the worst-case
equivalent fluence to increase the likelihood that test results bound on-orbit degradation. As
noted above, in proton-dominated environments where damage is likely to be caused mainly by
protons with energies of tens of MeV, testing is sometimes carried out with protons in this
energy range (e.g., 50 to 60 MeV).
Once the energy dependence of damage is known, any massive particle of sufficiently high
energy can be used as the radiation source; if the energy dependence is uncertain, then it is
prudent to select particles and energies likely to dominate the damage on orbit. As with TID, the
analysis ensures parts will meet their TNID requirements by applying RDM to the mission dose
and, in some cases, using one-sided tolerance limits as described previously.
Care should be taken when testing devices to ensure that TID and displacement damage
degradation (e.g., in optocouplers) [Gorelick and Ladbury, 2004] can be adequately decoupled.
As gamma rays induce minimal displacement damage, a separate TID test should be done on
pristine devices to the TID delivered to an equivalent device during displacement damage
testing. This can help remove the contribution of TID degradation from the displacement damage
measurements. Furthermore, it can be useful to monitor device performance following irradiation
to check for substantial recovery that can be a symptom of device degradation from TID,
although displacement damage can also demonstrate annealing behavior.
9.4.3 SEE Testing and Analysis
Because SEE can occur at any time during the mission, it is important to detect even low-
probability SEE modes so their impact to the system can be assessed. For this reason, testing
emphasizes revealing all SEE modes, as opposed to exposure of devices in a realistic or TLYF
radiation environment. Broadbeam testing usually includes high-fluence test runs with high-LET
ions, and laser tests often involve a scan over the entire die to detect as many destructive and
nondestructive SEE modes as possible.
Whether the source of ionization is a laser, a heavy-ion beam, or a proton beam, SEE test
procedures are driven by the needs of SEE analyses and include:
• Coverage (i.e., exposure of the device to reveal as many SEE modes as possible), including:
• Spatial exposure (i.e., ensuring sufficiently ionizing particles impinge on as many SEE
susceptible features as possible over the surface of the die) equates to ensuring adequate
fluence of high-LET ions.
• Temporal/operating mode (i.e., ensuring exposures occur during all states of operation
and throughout the clock cycle so that time-dependent susceptibilities are revealed).
• Characteristics of the SEE mode, including:
• Destructive versus nondestructive.
• Characteristics affecting system-level consequences (e.g., pulse width and duration of
transients; number of bits upset by mode and whether multiple bits in same logical word
are affected; whether “nondestructive” SEL mode results in latent damage).
• Actions/conditions needed to recover normal operations for nondestructive mode.
• The change in SEE susceptibility with increasing LET, charge generation, beam energy, etc.

77
• Information yielded by the test technique:
• Broad-beam heavy ion testing determines the LET that causes the effect but not the
feature on the die that causes it. Because high-energy protons cause upsets due to p +
silicon recoils, heavy-ion testing can also be used to bound proton SEE susceptibility.
• Laser testing identifies the vulnerable feature but yields only qualitative or limited
quantitative information about the LET/charge needed to cause the SEE.
• High-energy protons yield no information about which features cause an SEE and only
provide upper limits as to the LET of the ion that caused it. High-energy neutrons have
also been proposed as test beams capable of generating recoil ions without deposition of
significant TID. However, to date, their use has been limited, and the uncertainties
regarding vulnerable features and ionization/LET would be similar to those for protons.
This information serves as input to SEE hardness assurance analyses at the part, subsystem,
system and mission levels.
9.4.3.1 Nondestructive SEE Testing and Analysis
For nondestructive SEE, part-to-part and lot-to-lot variability for recent devices are usually
negligible, and when variability occurs, it usually affects the SEE rate rather than SEE
consequences. As such, a nominal test sample of three parts having the same mask set and
produced on the same fabrication line as the flight parts will generally yield data representative
of flight parts.
As indicated previously in the section on SEECA, risk management for nondestructive SEE is a
system-level activity, since the consequences of these error modes depend inherently on the
application the part is fulfilling when they occur. Because the consequences may also depend on
the state of the device when the error occurs, the resulting analysis can be complicated. If the
results of the SEECA analysis are available prior to testing, they can influence SEE testing to
ensure it provides information optimal for bounding the SEE risk. Otherwise, the SEECA uses
the available test data and system information to bound risk.
The predominant method for estimating SEE rates assumes the sensitive volume (SV) that causes
the SEE is a flat slab (i.e., an RPP), and the charge deposited in the SV depends on the ion LET
(assumed constant within the SV) and the chord length of the ion track through the slab. These
methods accept as input the cross section versus LET curve for the SEE mode, and extract from
this curve sufficiently detailed information about the SV that the mode’s rate in any radiation
environment can be estimated (see Figure 9.4-3).
There are several potential sources of uncertainty for rate estimation, including uncertainty in the
radiation environment, part-to-part variation, deviations from the assumed RPP model, Poisson
errors on event counts used to determine SEE cross sections, and so on. Despite these
uncertainties, a good SEE rate estimation should agree within a factor of 2 to 5 with the observed
on-orbit rate [Petersen, 2008; Schaefer, 2009; Ladbury 2009]. Of these sources, the only one that
can be addressed in testing is that of Poisson errors on cross section event counts. Since the
percent error for such fluctuations scales inversely as the square root of the event count, it is
usually straightforward to minimize these errors unless event counts are limited. This can happen
if:
• Parts are soft to TID, limiting test fluxes. If multiple parts are needed to complete the
irradiation, disentangling part-to-part variation from other errors can be problematic.

78
• Disruptive SEE modes are present, requiring long recoveries limit time and statistics for the
test.
• A part experiences rare but consequential SEE modes (e.g., ultra-long transients, SEFI
requiring power-on/reset for recovery), but with statistics that do not allow reliable
assessment.
The situations described above can have significant implications for nondestructive SEE risk
mitigation, since the statistics needed for accurate rate estimation will not be available precisely
for the error modes of greatest concern for the system. Similar concerns also apply when dealing
with destructive SEE.
Figure 9.4-3. Process of Calculating SEE Rates
The most common method of SEE rate estimation combines the radiation environment ion flux
versus the energy model for all elements, with the device response curve in the form of the SEE
cross section versus LET curve, assuming a model for the sensitive volume consisting of a thin
slab or RPP. Once the test generates the versus LET curve, it can be combined with any
environment to generate the SEE rate for that environment. Single-event rate calculations
combine radiation environment models with device response data assuming simplified SV
models.
9.4.3.2 DSEE Testing and Analysis
Although DSEE consequences depend on the application the part was performing when it failed,
at minimum, a DSEE results in the loss of that function. With such severe consequences, threat
avoidance is usually the preferred risk management strategy, especially if rate estimation is
problematic.
Although the mechanism for SEL is more complicated than those for nondestructive SEE,
susceptibility still scales with the charge deposited in the SEL sensitive volume. Thus, as long as
the ions have sufficient range/energy, normal rate-estimation methods work for SEL. In contrast,
79
mechanisms for SEB and SEGR are sufficiently complicated that reliable rate estimation is
problematic. Risk management for these mechanisms is almost always by threat avoidance,
usually by identifying and restricting applications to voltage ranges where the probability of
failure is negligible.
9.4.3.2.1 SEL Testing and Analysis
SEL is a regenerative, high-current mechanism that occurs in parasitic bipolar elements of
CMOS microcircuits. As with other SEE modes, it is most likely to be discovered using heavy
ions as the radiation source. However, the SEL SV is much deeper (tens of microns) than that for
nondestructive SEE. As such, the heavy ions must have sufficient energy to deposit charge all
the way to the bottom of the SV to avoid underestimating SEL susceptibility (>80 microns of
range in silicon is usually adequate). To ensure sufficient ion penetration even after traversing
device overlayers, it is useful to examine a destructive physical analysis or construction analysis
that measures the device materials and physical cross section.
SEL is a significant risk for CMOS parts not specifically designed to be immune. Roughly 50%
of commercial CMOS parts are susceptible at some level to SEL. Of those susceptible parts,
roughly 50% of parts fail catastrophically due to SEL induced overcurrent [Allen et al., 2017].
Even for destructive SEL, in many cases, SEL can be circumvented before it results in currents
high enough to damage parts. This can allow for accumulation of sufficient statistics to estimate
SEL rates accurate to at least an order of magnitude. If the resulting rate is sufficiently low that
the probability of occurrence is negligible during the mission, then some degree of SEL
susceptibility may be acceptable for many applications. However, designers should remain
cognizant that SEL can occur at any time, even if the rate is low.
One of the most significant challenges posed by SEL is latent damage that can occur in
microscopic structures of a part even when the SEL is not destructive. Latent damage can
undermine the post-SEL reliability of a microcircuit, causing it to fail prematurely during
subsequent operation. However, because the damage is often microscopic, detecting latent
damage is difficult, time-consuming, and costly. Current guidance suggests a microscopic
examination of the entire die followed by a 1000-hour burn-in under bias while exercising the
part, and finally a full performance test [Ladbury, 2005].
9.4.3.2.2 SEB and SEGR Testing and Analysis
SEB and SEGR occur mainly in discrete transistors and diodes. SEB is a potentially destructive
effect that occurs when an ionizing particle injects sufficient charge to activate a parasitic bipolar
transistor in a discrete transistor (JFET, bipolar or MOSFET, etc.) biased at high voltage,
resulting in a high-current state. In both testing and application, catastrophic failure can usually
be avoided by limiting the current between the parasitic collector and emitter. This means that
statistics can be accumulated for the same transistor, allowing part-to-part variation to be
distinguished from Poisson fluctuations on fluence to failure. It also means that current limiting
can mitigate SEB in some applications.
Unfortunately, the SEB mechanism is more complicated than that for nondestructive SEE or
SEL. SEB susceptibility depends on the voltages applied to the transistor, as well as on the ion’s
LET, species, energy, and angle of incidence, and the exact dependences depend on the transistor
geometry and technology. This has several important implications for SEB testing and analysis.
First, it means that rate estimation is unreliable, difficult, and often requires uneconomical

80
amounts of testing. The lack of reliable rate estimates favors adoption threat avoidance as the
primary risk mitigation approach. As such, testing is usually carried out for worst-case
conditions—with heavy ions of sufficiently high atomic number (Z), energy/LET such that
maximum charge is generated in the SV. The product of SEB testing is a safe operating area
designating the voltages where burnout risk is acceptably low (see Figure 9.4-4).
Figure 9.4-4. Destructive SEE Data for Power MOSFET Safe Operating Area Determination
In contrast to SEB, SEGR is inherently destructive. Thus, not only does susceptibility have
similar dependence on ion characteristics and applied voltages to SEB, it is not possible to
accumulate statistics for the same part and thus disentangle part-to-part and Poisson variability.
This means that the only real option for risk management for SEGR is threat avoidance, either by
avoiding susceptible parts or by avoiding gate-to-source (VGS) and drain-to-source voltages
(VDS), where gate rupture is likely to occur. The safe operating area for SEGR is determined in
a manner similar to that for SEB. A heavy ion with sufficiently high Z and energy is used to
irradiate the parts, usually at normal incidence to the die, although worst-case conditions may
vary depending on the MOSFET’s geometry. For a constant VGS, VDS is increased until failure
is observed. Usually, this is repeated for at least three parts, with the spread of onset VDS giving
a measure of part-to-part variation. Then VGS is changed (negatively for N-channel and
positively for P-channel), and the process is repeated.
SEGR is often the dominant failure mode for radiation hardened MOSFETs, while SEB tends to
dominate for commercial MOSFETs. Some COTS MOSFETs have exhibited significant part-to-
part variation in SEB susceptibility [George et al., 2017]. As illustrated in Figure 9.4-4, different
ions may have the same LET but may produce very different SEB or SEGR risks. For this
reason, projects often derate off the safe operating curve, much as they derate off-rated voltages
for reliability reasons. A common derating for ensuring reliability requires the VDS for the part
to be no higher than 70% of the rated value. Thus, if the project required parts to be immune to
81
SEB/SEGR for ions with LET ≤ 40 MeVcm2/mg, even if they only had access to the data for
bromine (Br), then the application would also be immune to the more penetrating and damaging
silver (Ag) ions as long as the off gate-to-source voltage VGS was not below –7 V (70% of 100
V = 70 V). In addition, design rules for limiting SEB/SEGR susceptibility suggest that the off
voltage, either for an N-channel or P-channel MOSFET, be as close as possible to 0 V
[Lauenstein et al., 2010].
Because of the difficulty of reliably bounding the rate for SEB or SEGR, testing for these failure
modes generates a safe operating area by selecting an ion that represents a sufficiently low
probability in the mission environment and determining the voltages where SEB/SEGR
probability becomes appreciable. As indicated in the figure, if the representative ion’s energy is
below the worst-case value, it will overpredict the SOA for the device, compromising its
reliability. SEB/SEGR tests delineate applied voltages where the probability of occurrence is
sufficiently small that the inability to reliably estimate rates is not important.
9.5 Prioritizing Radiation Testing Efforts
The high cost and time-consuming nature of radiation testing often means a project may lack
sufficient budget and schedule to test every device for all radiation effects to which it may be
susceptible. Moreover, independent of budget, the disruption to design efforts of an adverse
radiation test outcome means that it is advantageous to know the radiation performance of
important part types early in the design phase. As such, it is advantageous to have a procedure in
place to prioritize different radiation test and analysis efforts. Prioritization can be done
according to a variety of criteria, including the estimated risk the part poses to mission success,
the criticality of the application, or the propensity of the part to fail in its application based on its
technology and application conditions. GSN (see Section 6.3) is a useful tool for ensuring
systems critical to achieving mission requirements get the attention they deserve. Radiation
susceptibilities and system criticality can emerge during Parts Control Board meetings or other
parts approval procedures. However, these efforts will have to be coordinated at the system and
mission level to ensure radiation testing priorities reflect the priorities of the mission and its
requirements as a whole. A preliminary SEECA carried out when parts and technologies are
being selected to fulfill mission needs can serve as an important vehicle for prioritizing radiation
test and analysis efforts to maximize the probability of mission success. This is true even when
the information for the analysis remains incomplete. Indeed, the analysis can be an important
tool for identifying gaps that need to be filled by test and analysis.
9.6 References
Allen, G. R., et al., "2017 Compendium of Recent Test Results of Single Event Effects
Conducted by the Jet Propulsion Laboratory's Radiation Effects Group," 2017 IEEE
Radiation Effects Data Workshop (REDW), New Orleans, LA, pp. 1–14, 2017.
George, J. S., et al., “Response Variability in Commercial MOSFET SEE Qualification,” IEEE
Trans. Nucl. Sci., Vol. 64, No. 1, pp. 317–324, 2017.
Gorelick, J. L. and Ladbury, R., “Proton, Neutron, and Gamma Degradation of Optocouplers,”
IEEE Transactions on Nuclear Science, Vol. 51, No. 6, December 2004.
“Ionizing Dose and Neutron Hardness Assurance Guidelines for Microcircuits and
Semiconductor Devices,” MIL-STD 814, February 1994.

82
Ladbury, R. “Statistical Properties of SEE Rate Calculation in the Limit of Large and Small
Event Counts,” IEEE Trans. Nucl. Sci., Vol. 54, No. 6, pp. 2113–2119, December 2007.
Ladbury, R. L., Benedetto, J., McMorrow, D., Buchner, S. P., LaBel, K. A., Berg, M. D., Kim,
H. S., Sanders, A. B., Friendlich, M. R., and Phan, A. TPA Laser and Heavy-ion SEE
Testing: Complementary Techniques for SDRAM Single-Event Evaluation,” IEEE Trans.
Nucl. Sci.,
Vol. 56, No. 6, 2009, pp. 3334–3340.
Ladbury, R., “Latent Damage, Best Test and Analysis Practice for Managing Risks,” GSFC
NASA Advisory NA-GSFC-2005-05, August 29, 2005.
Lauenstein, J.-M., et al., “Interpreting Space-Mission LET Requirements for SEGR in Power
MOSFETs,” IEEE Trans. Nucl. Sci., Vol. 57, No. 6, pp. 3443–3449, 2010.
Marshall, C. J., Marshall, P. W., Waczynski, A., Polidan, E. J., Johnson, S. D., Kimble, R. A.,
Reed, R. A., Delo, G., Schlossberg, D., Russell, A. M., Beck, T., Wen, Y., Yagelowich, J.,
and Hill, R. J., “Hot Pixel Annealing Behavior in CCDs irradiated at –84°C,” IEEE Trans.
Nucl. Sci., Vol. 52, No. 6, 2005, pp. 2672–2677.
Petersen, E. L., “Soft Error Results Analysis and Error Rate Prediction,” paper presented at the
Nuclear and Space Radiation Effects Conference Short Course, 2008.
Poivey, C., “TNID Total Non-Ionizing Dose or DD Displacement Damage,” ESA–CERN–SCC
Workshop, CERN, May 9–10, 2017. Available at:
https://indico.cern.ch/event/635099/contributions/2570676/attachments/1456363/2249942/4_
Radiation_Effects_and_RHA_ESA_Internal_Course_4_10_May_2017_DD_CP.pdf
Schaefer, J. J., Owen, R. S., Rutt, P. M., and Miller, C., Observations from the Analysis of On-
Orbit Data from DRAMs Used in Space Systems,” paper presented at the 2009 IEEE
Radiation Effects Data Workshop, 2009.
9.6.1 Useful Standards and Additional References for Radiation Testing and Analysis
“Ionizing Radiation (Total Dose) Test Procedure,” MIL-STD-883, Test Method 1019.
“Neutron Irradiation,” MIL-STD-883, Test Method 1017.
“Single Event Effects Test Method and Guidelines,” ESCC 25100.
“Standard Guide for the Measurement of Single Event Phenomena (SEP) Induced by Heavy Ion
Irradiation of Semiconductor Devices,” ASTM F1192, 2018.
“Test Methods for Semiconductor Devices,” MIL-STD 750E.
“Test Procedure for the Management of Single-Event Effects in Semiconductor Devices from
Heavy Ion Irradiation,” JESD-57A, 2017.
“Total Dose Steady-State Irradiation Test Method,” ESCC 22900.

83
10.0 Operational Monitoring for Radiation Effects
Return to Main
10.1 Section Summary
Although radiation engineers focus their efforts mainly on the formulation and development
phases of project execution, the proof of the efficacy of those efforts is measured by mission
success during the project’s operational phase(s). Moreover, not only is it the operational phase
that validates the space climatological, device, and radiation mechanism models, data gathered
during this phase can form the basis for new and improved models of these phenomena, just as
past operational data are coupled with experimental measurements to form the basis of current
models. Important activities for radiation engineers during a project’s operational phase include:
1. Measuring daily and seasonal space weather events to augment the historical record upon
which space climate models are based. Although such models are usually based on statistics
accumulated over several decades and multiple solar cycles, new data can still fill in gaps in
the model or illuminate variability (e.g., the behavior of emissions from the sun during the
past and current low-activity solar cycles or the recent changes in radiation levels in the SAA
due to changes in the geomagnetic field). Also of interest are the ways in which solar
emissions, including solar flares, solar energetic particles, and coronal mass ejections interact
with GCRs. These particle fields may also interact with planets, moons, planetary
magnetospheres, in addition to ground- and space-based human-made systems, potentially
disrupting technologies and infrastructures [Droegemeier & Kontos, 2019]. Information on
the environment can come from sources that range from purpose-built dosimeters and
particle detectors to daily tallies of SEUs from sensitive devices on the satellite.
2. Anomaly resolution is often the most likely route by which radiation engineers become
involved with project operational phases. Such investigations provide an opportunity to
investigate and validate assumptions of radiation environment analyses as well as models for
mechanisms or propagation of radiation effects in affected devices. In some cases, such
devices may require extra testing to fully resolve the root cause of the anomaly.
3. Another common avenue of involvement occurs early in the operational phase, before
operational personnel are fully acquainted with expected radiation (e.g., the incidence of
correctable SEU, occasional resets, etc.). While these interactions are mainly a learning
process for operational staff, they offer an opportunity to form relationships and
collaborations to monitor critical systems that may yield important information on the
spacecraft’s radiation environment or assumptions made in the radiation analysis. As with all
collaborations, these efforts must be pushed actively if the time series of data is to be
complete. In some cases, contact may be renewed by the operational staff if a change is
noted. This change could be as simple as an increase in a GCR-induced SEE rate brought
84
about by the onset of solar minimum, where GCR fluxes are higher than during solar
maximum.
The models, test procedures, analysis methodologies, and other best practices that radiation
engineers use to ensure that systems will meet their availability and reliability requirements for a
given mission, environment, application, and lifetime are built on a foundation of existing data
and past experiences, both successes and failures, accumulated over the past 70 years. Improving
these practices and validating common assumptions requires increasing knowledge of space
weather and its effects on the ever-changing technologies and designs used or spacecraft.
[Minow et al., 2020; Kwasnick et al., 2019; Kwasnick et al., 2017]. Improved in-situ space
environment measurements and enhanced housekeeping data capture will not only improve
system reliability and improve the odds of mission success, they will also accelerate the pace of
exploration and the infusion of requisite technologies.
Section Highlights and Takeaways
• To the extent practicable, leverage advances in the space weather architecture to augment the
historical record upon which space climate models are based. As indicated in Minow, Parker,
et al. [2020] this may require developing additional capabilities and measurement capacity.
In this respect, civil space missions have insufficient operational monitoring capabilities.
• Anomaly resolution is often the most likely route by which radiation engineers become
involved with project operational phases. Anomaly attribution and root cause investigations
can be difficult or impossible without sufficient engineering performance data and in-situ
space radiation environment measurements.
• Operational monitoring of systems, whether ad hoc or by design, can help validate existing
engineering models and be used to develop new ones.
10.2 Best Practices
Tracking the radiation performance of electronics during mission operations falls into two
categories:
1. Nominal performance tracking to correlate RHA methods (e.g., analysis, environment
margins, testing, model prediction techniques, etc.) to actual performance.
2. Investigation of anomalous conditions (e.g., unexpected events or determination of root
cause(s) of an event).
Tracking operational radiation effects in individual electronic devices or systems is challenging
for several reasons. If the mission does not have in-situ environment monitoring that can be used
for correlation, extrapolating the space environment from one place and moment in time to
another is fraught with issues due to the dynamic nature of the environment, adding uncertainty
to the correlation factors. This difficulty was demonstrated clearly in discussions at community
workshops for the Living With a Star (LWS) Space Environment Testbed mission [LWS, 2020].
The Space Environment Testbed space experiment was specifically designed for correlating
radiation models with actual in-flight performance. Results from SET predecessor experiments
and missions (e.g., the Advanced Photovoltaic Experiment (APEX), the Combined Release and
Radiation Effects Satellite (CRRES), the Cosmic Ray Upset Experiment (CRUX), the Long
Duration Exposure Facility (LDEF), and the Microelectronics and Photonics Test Bed (MPTB))
similarly demonstrated the importance of in situ environmental monitoring. More recently, the
Van Allen Probes mission highlight many of the same issues [Van Allen Probes, 2020], as

85
discussed in a recent series of meetings for the Space Environment Engineering and Science
Applications Workshop (SEESAW) [SEESAW, 2017]. Expanding on this topic, the NASA
Engineering and Safety Center (NESC) recently completed a report titled, “Space Weather
Architecture Options to Support Human and Robotic Deep Space Exploration,” which directly
addresses the need for more widespread and sophisticated in-situ environment measurements
[Minow et al., 2020].
Another confounding factor in attempts to extract space environment or part performance from
on-orbit nominal performance is the coarseness of telemetry available for such engineering
purposes. For example, if power consumption on a single device is due to TID, it may not be
discernible because the affected device is one of a larger number (e.g., 50) on a single power bus
and the rise in current may not be sufficient to be noted in engineering telemetry, even though it
is significant for that individual device. This is just one example, but considerations related to all
radiation effects are in play.
Yet another confounding factor is that one may not have insight into the root cause of an effect
(e.g., spacecraft charging effects often mimic SEEs on electronics). While it is out of scope for
this document, this must be considered when tracking performance or anomaly resolution.
The following best practices are intended to ensure that the most information is gleaned from
performance monitoring and anomaly investigation.
Radiation Performance Tracking
Nominal assumptions:
• System was analyzed for radiation performance, and appropriate documentation of expected
degradation (MTTF and MTBF modes) is included as a baseline for comparison to on-orbit
performance.
• Engineering telemetry data exist that allow for monitoring (at least on some level).
• Power consumption (at least to some level).
• System calibration status (e.g., tracking telemetry for “within expectations”).
• System operating mode (e.g., safehold, nominal, etc.).
• Orbital position and time tag, ideally at a rate sufficient to localize anomaly positions
relative to important space environment features.
• Temperature near electronics of concern.
• Event counts (e.g., memory errors and processor resets).
• Some systems have had daily event counts sufficiently high that they could be used to
monitor solar activity [Croley, 1995; Campbell, 2002].
• Ideally, correlative environment data (e.g., dose rate, energetic particle levels).
• Failing in-situ environment data, the use of environment models as specified in the
DSNE and tracking environment activity information (e.g., from the GOES satellites)
may be used.
The overall goal of in-flight tracking is to ensure mission performance in the presence of the
NSE and provide lessons on effectiveness of RHA approaches for future mission applications.

86
Anomaly Investigation Process
Although most missions meet their required performance, unexpected issues arise, and
determining the root cause can be essential for maintaining confidence in the system’s
performance and health. Previous experience has given rise to several documents from NASA
Centers detailing best practices and lessons learned that should be consulted for guidance. For
example:
• GSFC-HDBK-8700 (Guideline for Forming and Operating Failure Review Boards and
Anomaly Review Boards).
• GPR 5340.5 (On-Orbit Anomaly Reporting and Tracking).
• See also the 2011 NSREC short course by Robert Ecoffet, “On-Orbit Anomalies:
Investigations and Root Cause Determination” [Ecoffet, 2011].
While anomaly investigation uses the same engineering telemetry as nominal performance
tracking, the purpose is to resolve an unexpected issue as opposed to determining the
effectiveness of an RHA process overall (i.e., “Are MTTF and MTBF radiation expectations
being met?”). Generally, the process looks like this:
• Determine orbital location and time of event.
• Look for the obvious (e.g., solar events or the SAA).
• Review electronic parts lists for potential sensitive devices.
• Review identified devices in specific circuit applications.
• Consider factors such as duty cycle, operating speed, voltage levels, etc.
• Obtain existing SEE, dose, and displacement damage data, or gather new data if required.
• Compare flight circuit applications with those of ground test data.
• Perform ground testing if needed.
• Determine risk probabilities.
• Additional ground testing.
• SEE rates, etc.
• Failure potential, including dose rate effects.
• Examine the relative probabilities of radiation-related and other causes to determine the most
likely origin of the anomaly.
• Recommend mitigative action(s) if possible (operational).
Past anomaly investigations and anomaly summaries have yielded a rough picture of the relative
importance of different causes [Koons, 1999; LaBel, 2018; NAS, 2018; Poivey, 2002].
10.3 References
Clowdsley, M., Nealy, J., Wilson, J., Anderson, B., Anderson, M., and Krizan, S. “Radiation
Protection for Lunar Mission Scenarios,” In Space 2005, American Institute of Aeronautics
and Astronautics, 2005.
Ecoffet, R., “On-Orbit Anomalies: Investigations and Root Cause Determination,” Paper
presented at the Nuclear and Space Radiation Effects Conference Short Course, Las Vegas,
Nevada, 2011.

87
Kwasnick, R., Gartler, H., Boelter, J., Holm, J., Surisetty, S., Im, C., Polasam, P., and Zonensain,
O., “Telemetry for System Reliability,” Paper presented at the 2019 IEEE International
Electron Devices Meeting (IEDM), December 7–11, 2019.
Kwasnick, R., Karayacoubian, P., Polasam, P., Wang, A., Biswas, A., Tayeb, J., Mattani, R., and
Arbab, B. “Telemetry for Reliability,” Paper presented at the 2017 IEEE International
Reliability Physics Symposium (IRPS), April 2–6, 2017.
LaBel, K. A., Sampson, M. J., and Pellish, J. A., “Electrical, Electronic and Electromechanical
(EEE) Parts in the New Space Paradigm: When is Better the Enemy of Good Enough?”
Paper presented at the 14th International School on the Effects of Radiation on Embedded
Systems for Space Applications, Noordwijk, The Netherlands, 2018.
“Living With a Star (LWS) Space Environment Testbeds Pre-NASA Research Announcement
Requirements Workshops,” 2020. Available at: https://lws-set.gsfc.nasa.gov/workshops.html
Poivey, C., “Radiation Hardness Assurance for Space Systems,” Paper presented at the Nuclear
and Space Radiation Effects Conference Short Course, Phoenix, Arizona, 2002.
“Space Environment Engineering and Science Applications Workshop (SEESAW),” 2017.
Available at: https://cpaess.ucar.edu/meetings/2017/seesaw-presentations
Minow, J. I., Neergaard Parker, L., Allen, J. R., Fry, D. J., Semones, E. J., Hock, R. A., et al.,
“Space Weather Architecture Options to Support Human and Robotic Deep Space
Exploration,” NESC-RP-17-01215, February 13, 2020. Also NASA/TM-2020-5000837,
2020.
Van Allen Probes, 2020. Available at: http://vanallenprobes.jhuapl.edu/
Xapsos, M. A., Summers, G. P., Barth, J. L., Stassinopoulos, E. G., and Burke, E. A.,
“Probability Model for Worst Case Solar Proton Event Fluences,” IEEE Transactions on
Nuclear Science, Vol. 46, No. 6, 1999, pp. 1481–1485.
Xapsos, M. A., Summers, G. P., Barth, J. L., Stassinopoulos, E. G., and Burke, E. A.
“Probability Model For Cumulative Solar Proton Event Fluences,” IEEE Transactions on
Nuclear Science, Vol. 47, No. 3, 2000, pp. 486-490.

88
11.0 Consolidated Reference List
“88-Inch Cyclotron Cocktails and Ions,” LBNL, 2020. Available at (last retrieved March 31,
2020): http://cyclotron.lbl.gov/base-rad-effects/heavy-ions/cocktails-and-ions
Adell, P. C., et al. “Impact of Hydrogen Contamination on the Total Dose Response of Linear
Bipolar Microcircuits,” IEEE Trans. Nucl. Sci., Vol. 54, No. 6, pp. 3354–3360, 2007.
Allen, G. R., et al., "2017 Compendium of Recent Test Results of Single Event Effects
Conducted by the Jet Propulsion Laboratory's Radiation Effects Group," 2017 IEEE
Radiation Effects Data Workshop (REDW), New Orleans, LA, pp. 1–14, 2017.
Armstrong, T. and Colborn, B., “Predictions of Secondary Neutrons and their Importance to
Radiation Effects inside the International Space Station,” Radiation Measurements, Vol. 33,
2001, pp. 229–234. DOI:10.1016/s1350-4487(00)00152-9.
Assurance Case Working Group (ACWG), “GSN Community Standard,” Report No. SCSC–
141B, 2018. Available at https://scsc.uk/r141B:1
Atwell, W., Rojdev, K., Aghara, S., and Sriprisan, S., “Mitigating the Effects of the Space
Radiation Environment: A Novel Approach of Using Graded-Z Materials,” AIAA 2013-
5385, September 2013. Available at https://doi.org/10.2514/6.2013-5385
Austin, R. A., Mahadevan, N., Sierawski, B. D., Karsai, G., Witulski, A. F., and Evans, J., “A
CubeSat-Payload Radiation-Reliability Assurance Case using Goal Structuring Notation,” in
Proc. Ann. Reliability and Maintainability Symp., January 2017, pp. 1–8. Available at
https://doi.org/10.1109/ram.2017.7889672
“Avionics Radiation Hardness Assurance (RHA) Guidelines,” NESC-RP-19-01489, April 1,
2021.
Bajaj, M., Cole, B., and Zwemer, D. (2016). Architecture to geometry - integrating system
models with mechanical design. Proc. AIAA SPACE. https://doi.org/10.2514/6.2016-5470
Barth, J. L., “Evolution of the Radiation Environments,” Paper presented at the Radiation Effects
on Components and Systems Conference Short Course, Bruges, Belgium, 2009.
Barth, J. L., “Modeling Space Radiation Environments,” Paper presented at the Nuclear and
Space Radiation Effects Short Course, Snowmass Village, CO, 1997.
“Beam Ion Species and Energies,” NASA Space Radiation Laboratory (NSRL), Brookhaven
National Laboratory, 2020. Available at (last retrieved March 31, 2020):
https://www.bnl.gov/nsrl/userguide/beam-ion-species-and-energies.php
Boruta, N., Lum, G. K., O’Donnell, H., Robinette, L., Shaneyfelt, M. R., and Schwank, J. R., “A
New Physics-Based Model for Understanding Single-Event Gate Rupture in Linear
Devices,” IEEE Transactions on Nuclear Science, Vol. 48, No. 6, December 2001.
Boscherini, M. et al., “Radiation Damage of Electronic Components in Space Environment,”
Nuclear Instruments and Methods in Physics Research, Section A: Accelerators,
Spectrometers, Detectors and Associated Equipment, Vol. 514, No. 1–3, 2003, pp. 112–116.

89
Buchner, S. P., Miller, F., Pouget, V., and McMorrow, D. P., “Pulsed-Laser Testing for Single-
Event Effects Investigations,” IEEE Transactions on Nuclear Science, Vol. 60, No. 3,
December 2013.
Buchner, S., Kanyogoro, N., McMorrow, D., Foster, C. C., O’Neill, P. M., and Nguyen, K.V.,
“Variable Depth Bragg Peak Method for Single Event Effects Testing,” IEEE Transactions
on Nuclear Science, Vol. 58, No. 6, December 2011.
Buchner, S., Marshall, P., Kniffin, S., and LaBel, K., “Proton Test Guideline Development:
Lessons Learned,” NASA Electronic Parts and Packaging (NEPP), Goddard Space Flight
Center, August 22, 2002. Available at (last retrieved April 2, 2020):
https://radhome.gsfc.nasa.gov/radhome/papers/Proton_testing_guidelines_2002.pdf
“Calculation of Radiation and its Effects and Margin Policy Handbook,” ECSS-E-HB-10-12A,
2010.
Campola, M., Ladbury, R., Austin, R., Wilcox, E., Kim, H., Pellish, J., and Label, K. “Single
Event Transient Case Study for System-Level Radiation Effects Analysis,” NSREC
Presentation, 2020. Available at: https://ntrs.nasa.gov/citations/20205009687
Cascio, E. W., “A Five-Year Compendium of Proton Test Usage Patterns at The Francis H. Burr
Proton Therapy Center,” 2018 IEEE Radiation Effects Data Workshop (REDW), 2018.
Cascio, E. W., chart presentation, 2015 SEE Symposium, unpublished.
Cherng, M., Jun, I., and Jordan, T. M., “Optimum Shielding in Jovian Radiation Environment,”
Nucl. Instrum. Methods Phys. Res. Sec. A 580, 2007, pp.633–636.
Clowdsley, M., Nealy, J., Wilson, J., Anderson, B., Anderson, M., and Krizan, S. “Radiation
Protection for Lunar Mission Scenarios,” In Space 2005, American Institute of Aeronautics
and Astronautics, 2005.
Department of Defense, “Test Method Standard, Test Methods for Semiconductor Devices,” Test
Method 1080 Single Event Burnout and Single Event Gate Rupture, MIL-STD-750E,
November 20, 2006.
DiVenti, T., “NASA’s Digital Transformation (DT) Initiative: Potential Opportunities for the
NEPP Community,” In NASA NEPP ETW 2019, Goddard, MD, June 17, 2019. Available at
https://nepp.nasa.gov/workshops/etw2019/talks/0617MON/1100%20-
%20DiVenti%20NEPP%20ETW%202019%20rev%20A.pdf
Dodds, N. A., Schwank, J. R., Shaneyfelt, M. R., Dodd, P. E., Doyle, B. L., Trinczek, M.,
Blackmore, E. W., Rodbell, K. P., Gordon, M. S., Reed, R. A., Pellish, J. A., LaBel, K. A.,
Marshall, P. W., Swanson, S. E., Vizkelethy, G., Van Deusen, S., Sexton, F. W., and
Martinez, M. J., “Hardness Assurance for Proton Direct Ionization-Induced SEEs using a
High-Energy Proton Beam,” IEEE Transactions on Nuclear Science, Vol. 61, No. 6, 2014.
Ecoffet, R., “On-Orbit Anomalies: Investigations and Root Cause Determination,” Paper
presented at the Nuclear and Space Radiation Effects Conference Short Course, Las Vegas,
Nevada, 2011.
EIA/JESD57A, “Test Procedures for the Measurement of Single-Event Effects in Semiconductor
Devices from Heavy Ion Irradiation (EIA/JEDEC Standard,” November 2017. Available at:
https://www.jedec.org/standards-documents/docs/jesd-57)

90
“Electrical, Electronic, and Electromechanical (EEE) Parts Assurance Standard,” NASA-STD-
8739.10, June 13, 2017.
Enlow, E. W., Pease, R. L., Combs, W., Schrimpf, R. D., and Nowlin, R. N., “Response of
Advanced Bipolar Processes to Ionizing Radiation,” IEEE Trans. Nucl. Sci., Vol. 38, No. 6,
1991, pp. 1342–1351. DOI:10.1109/23.124115.
Exploration Systems Development (ESD) Concept of Operations, ESD 10012.
FASTRAD, “FASTRAD, A Radiation Analysis Software,” by TRAD, Toulouse, France.
Available at: http://www.trad.fr/FASTRADSoftware.html
Fleetwood, D. M., “A First-Principles Approach to Total-Dose Hardness Assurance,” Paper
presented at the Nuclear and Space Radiation Effects Conference Short Course, Madison,
WI, 1995.
FLUKA. Available at: http://www.fluka.org/fluka.php
Foster, C. C., O’Neill, P. M., Reddell, B. D., Nguyen, K. V., Jones, B. H., Roche, N. J-M.,
Warner, J., and Buchner, S., “Certification of Parts for Space with the Variable Depth Bragg
Peak Method,” IEEE Transactions on Nuclear Science, Vol. 59, No. 6, December 2012.
García Alía, R., CERN, Personal Communication, 2020.
Gates, M. and LaBel, K., "A Systems Engineering Approach to the Design of Survivable
Electronics for the Natural Space Ionizing Radiation Environment," AIAA Paper 95-0843,
January 1995.
Geant4, “Geant4 (Geometry and Tracking), A Platform for Particle Transport Simulation using
Monte Carlo Methods.” Available at https://geant4.web.cern.ch/
“General Specification for Hybrid Microcircuits,” MIL-PRF-38534, retrieved from
https://www.dla.mil/LandandMaritime/.
“General Specification for Integrated Circuits (Microcircuits) Manufacturing,” MIL-PRF-38535,
(https://www.dla.mil/LandandMaritime/).
“General Specification for Semiconductor Devices,” MIL-PRF-19500, retrieved from
https://www.dla.mil/LandandMaritime/.
George, J. S., Clymer, D. A., Turflinger, T. L., Manson, L. W., Stone, S., Koga, R., Beach, E.,
Huntington, K., Lauenstein, J.-M., Titus, J., and Sivertz, M., “Response Variability in
Commercial MOSFET SEE Qualification,” IEEE Trans. Nucl. Sci., Vol. 64, No. 1, pp. 317–
324, 2017.
Gonzales, O., “Guidelines for Verification Strategies to Minimize RISK Based on Mission
Environment, Application and Lifetime (MEAL),” Available at:
https://ntrs.nasa.gov/archive/nasa/casi.ntrs.nasa.gov/20180007514.pdf
Gorelick, J. L. and Ladbury, R., “Proton, Neutron, and Gamma Degradation of Optocouplers,”
IEEE Transactions on Nuclear Science, Vol. 51, No. 6, December 2004.
Groen, F. J., Evans, J. W., and Hall, A. J., “A Vision for Spaceflight Reliability: NASA’s
Objectives Based Strategy,” Proc. Ann. Reliability and Maintainability Symp. (RAMS), 2015.
Avialable at https://doi.org/10.1109/rams.2015.7105106

91
“GSN Community Standard Version 2,” the Assurance Case Working Group (ACWG) Std.
SCSC-141B, January 2018.
Guertin, S. M., “Board Level Proton Testing for NASA Electronic Parts and Packaging
Commercial-off-the Shelf Book of Knowledge,” JPL Publication 17-7, NASA NEPP, 2017.
Available at (last retrieved May 4, 2020): https://nepp.nasa.gov/files/29179/NEPP-BOK-
2017-Proton-Testing-CL18-0504.pdf
“Guidelines for Verification Strategies to Minimize RISK Based On Mission Environment,
Application and Lifetime (MEAL),” NESC-RP-16-01117, April 5, 2018, and NASA/TM-
2018-220074, April 2018.
Hales, J. M., Khachatrian, A., Buchner, S., Roche, N. J.-H., Warner, J., Fleetwood, Z. E.,
Ildefonso, A., Cressler, J. D., Ferlet-Cavrois, V., and McMorrow, D., “Experimental
Validation of an Equivalent LET Approach for Correlating Heavy-Ion and Laser-Induced
Charge Deposition,” IEEE Transactions on Nuclear Science, Vol. 65, No. 8, August 2018.
Hansen, D. L., “Design-of-Experiments and Monte-Carlo Methods in Upset Rate-Calculations,”
IEEE Transactions on Nuclear Science, Vol. 67, No. 1, 2020.
“Heavy ion Beams, Revised March 2020,” Texas A&M University Cyclotron Institute, 2020.
Available at (last retrieved March 31, 2020):
https://cyclotron.tamu.edu/ref/images/heavy_ion_beams.pdf
Heilbronn, L., Borak, T., Townsend, L., Tsai, P., Burnham, C., and McBeth, R., “Neutron Yields
and Effective Doses Produced by Galactic Cosmic Ray Interactions in Shielded
Environments in Space,” Life Sciences in Space Research, Vol. 7, November 2015, pp. 90–
99. Available at https://doi.org/10.1016/j.lssr.2015.10.005.
Hiemstra, D. M. and Blackmore, E. W., “LET Spectra of Proton Energy Levels From 50 to 500
MeV and Their Effectiveness for Single Event Effects Characterization of Microelectronics,”
IEEE Transactions on Nuclear Science, Vol. 50, No. 6, December 2003.
Ibarmia, S., Eck, J., Ivanchenko, V., et al., "Experimental Dose Enhancement in Multi-Layer
Shielding Structures Exposed to High-Energy Electron Environments," IEEE Transactions
on Nuclear Science, Vol. 60, No. 4, August 2013, pp. 2486–2493.
ICRU Report 49. Available at: https://icru.org/home/reports/stopping-power-and-ranges-for-
protons-and-alpha-particles-report-49
Instructions for EEE Parts Selection, Screening, Qualification, and Derating,” EEE-INST-002,
April 2008. Also NASA/TP—2003-212242, April 2008. Retrieved from
https://nepp.nasa.gov/.
International Council on Systems Engineering (INCOSE), “System Engineering Vision 2020,”
Report No. INCOSE-TP-2004-004-02, 2007.
“Ionizing Dose and Neutron Hardness Assurance Guidelines for Microcircuits and
Semiconductor Devices,” MIL-STD 814, February 1994.
Johnston, A. H., Rax, B. G., and Lee, C. I., “Enhanced Damage in Linear Bipolar Integrated
Circuits at Low Dose Rate,” IEEE Trans. Nucl. Sci., Vol. 42, No. 6, 1995, pp. 1650–1659.
DOI:10.1109/23.488762.

92
Johnston, A. H., Swift, G. M., and Rax, B. G., Total Dose Effects in Conventional Bipolar
Transistors and Linear Integrated Circuits,” IEEE Trans. Nucl. Sci., Vol. 41, No. 6, 1994,
pp. 2427–2436. DOI:10.1109/23.340598.
Jordan, T. M., “An Adjoint Charged Particle Transport Method,” IEEE Trans. Nucl. Sci.,
Vol. NS-23, No. 6, December 1976, pp. 1857–1861.
Jordan, T. M., “NOVICE a Radiation Transport/Shielding Code,” Experimental and
Mathematical Physics Consultants, Rep.EMP.L82.001. 2982. Available at https://empc.com/
“JSC Design and Procedural Standards,” Johnson Space Center, Engineering Directorate, JSC-
STD-8080, Standard E-22 Ionizing Radiation Effects on Electronics, October 2011.
Available at: https://ntrs.nasa.gov/archive/nasa/casi.ntrs.nasa.gov/20120015984.pdf
Jun, B., Zhu, B. X., Martinez-Sierra, L. M., and Jun, I. “Intercomparison of Ionizing Doses from
Space Shielding Analyses Using MCNP, Geant4, FASTRAD, and NOVICE,” IEEE Trans.
Nucl. Sci., Vol. 67, No. 7, 2020, pp. 1629–1636. DOI:10.1109/TNS.2020.2979657.
Jun, I. and McAlpine, W., “Displacement Damage in Silicon due to Secondary Neutrons, Pions,
Deuterons, and Alphas from Proton Interactions with Materials,” IEEE Transactions on
Nuclear Science, Vol. 48, No. 6, 2001, pp. 2034–2038.
Jun, I., “Benchmark Study for Energy Deposition by Energetic Electrons in Thick Elemental
Slabs: Monte Carlo Results and Experiments,” IEEE Trans. Nucl. Sci., Vol. 50, No. 5,
October 2003, pp. 1732–1739.
Jun, I., “Effects of Secondary Particle on the Total Dose and the Displacement Damage in Space
Proton Environments,” IEEE Transactions on Nuclear Science, Vol. 48, No. 1, 2001, pp.
162–175.
Jun, I., Kang, S., Santin, G., and Nieminen, P., Shielding Code Comparison: A Simple
Benchmark Problem,” EJSM Instrument Workshop, Noordwijk, Netherlands, January 8–10,
2010. Available at https://sci.esa.int/documents/34530/36042/1567253749508-
EJSM3IW_06_ESA_Instrument_WS_Shielding_v15.pdf.
Kai, N., Zhang, E. X., Samsel, I. K., Schrimpf, R. D., Reed, R. A., Fleetwood, D. M., Sternberg,
A. L., McCurdy, M. W., Ren, S., Ma, T.-P., Dong, L., Zhang, J. Y., and Ye, P. D., “Charge
Collection Mechanisms in GaAs MOSFETs,” IEEE Transactions on Nuclear Science, Vol.
62, No. 6, December 2015.
Krieg, J., et al., “Hardness Assurance Implications of Bimodal Total Dose Response in a Bipolar
Linear Voltage Comparator,” IEEE Trans. Nucl. Sci., Vol. 46, No. 6, pp. 1627–1632, 1999.
Kwasnick, R., Gartler, H., Boelter, J., Holm, J., Surisetty, S., Im, C., Polasam, P., and Zonensain,
O., “Telemetry for System Reliability,” Paper presented at the 2019 IEEE International
Electron Devices Meeting (IEDM), December 7–11, 2019.
Kwasnick, R., Karayacoubian, P., Polasam, P., Wang, A., Biswas, A., Tayeb, J., Mattani, R., and
Arbab, B. “Telemetry for Reliability,” Paper presented at the 2017 IEEE International
Reliability Physics Symposium (IRPS), April 2–6, 2017.
LaBel, K. A. and Gates, M. M., “Single-Event-Effect Mitigation from a System Perspective,”
IEEE Transactions on Nuclear Science Special Edition, Vol. 43, No. 2, April 1996.

93
LaBel, K. A., “Proton Single Event Effects (SEE) Guideline,” NASA Electronic Parts and
Packaging (NEPP), August 2009. Available at (last retrieved April 2, 2020):
https://nepp.nasa.gov/files/18365/Proton_RHAGuide_NASAAug09.pdf
LaBel, K. A., “Radiation Requirements and Requirements Flowdown: Single Event Effects
(SEEs) and Requirements,” HEART Short Course, March 12, 2003.
LaBel, K. A., Sampson, M. J., and Pellish, J. A., “Electrical, Electronic and Electromechanical
(EEE) Parts in the New Space Paradigm: When is Better the Enemy of Good Enough?”
Paper presented at the 14th International School on the Effects of Radiation on Embedded
Systems for Space Applications, Noordwijk, The Netherlands, 2018.
Label, K. and Berg, M., “Complex Parts, Complex Data: Why You Need to Understand What
Radiation Single Event Testing Data Does and Doesn't Show and the Implications Thereof,”
GOMAC Presentation, 2005. Available at:
https://ntrs.nasa.gov/archive/nasa/casi.ntrs.nasa.gov/20150004129.pdf
Label, K., Johnston, A. H., Barth, J. L., Reed, R. A., and Barnes, C. E. “Emerging Radiation
Hardness Assurance (RHA) Issues: A NASA Approach for Space Flight Programs,” IEEE
Transactions on Nuclear Science, Vol. 45, 1999, pp. 2727–2736. DOI:10.1109/23.736521.
Ladbury, R. “Statistical Properties of SEE Rate Calculation in the Limits of Large and Small
Event Counts,” IEEE Trans. Nucl. Sci., Vol. 54, No. 6, pp. 2113–2119, December 2007.
Ladbury, R. L. and Campola, M. J., “Statistical Modeling for Radiation Hardness Assurance:
Toward Bigger Data,” IEEE Transactions on Nuclear Science, Vol. 62, No. 5, 2015.
Ladbury, R. L. and Campola, M. J., “Bayesian Methods for Bounding Single-Event Related Risk
in Low-cost Satellite Missions,” IEEE Trans. Nucl. Sci., Vol. 60, No. 6, 2013, pp. 4464–
4469.
Ladbury, R. L. and Triggs, B., “A Bayesian Approach for Total Ionizing Dose Hardness
Assurance,” IEEE Transactions on Nuclear Science, Vol. 58, No. 6, 2011, pp. 3004–3010.
Ladbury, R. L., Benedetto, J., McMorrow, D., Buchner, S. P., LaBel, K. A., Berg, M. D., Kim,
H. S., Sanders, A. B., Friendlich, M. R., and Phan, A. TPA Laser and Heavy-ion SEE
Testing: Complementary Techniques for SDRAM Single-Event Evaluation,” IEEE Trans.
Nucl. Sci., Vol. 56, No. 6, 2009, pp. 3334–3340.
Ladbury, R., “Latent Damage, Best Test and Analysis Practice for Managing Risks,” GSFC
NASA Advisory NA-GSFC-2005-05, August 29, 2005.
Ladbury, R., “Radiation Hardening at the System Level,” 2007 IEEE NSREC Short Course,
2007.
Ladbury, R., “Risk Methodology for SEE Caused by Proton-Induced Fission of High-Z
Materials in Microelectronics Packaging,” IEEE Transactions on Nuclear Science, 2020 (in
print).
Ladbury, R., “Strategies for SEE Hardness Assurance: From Buy-It-And-Fly-It to Bullet Proof,”
presented at the 2017 IEEE Nuclear and Space Radiation Effects Conference (NSREC), New
Orleans, LA, July 17-21, 2017. Available at:
https://ntrs.nasa.gov/archive/nasa/casi.ntrs.nasa.gov/20170006865.pdf

94
Ladbury, R., Gorelick, J. L., McClure, S. S., “Statistical Model Selection for TID Hardness
Assurance,” IEEE Trans. Nucl. Sci., Vol. 56, No. 6, pp. 3354–3360, 2009.
Ladbury, R., Lauenstein, J.-M., and Hayes, K. P., “Use of Proton SEE Data as a Proxy for
Bounding Heavy-Ion SEE Susceptibility,” IEEE Transactions on Nuclear Science, Vol. 62,
No. 6, December 2015.
Lauenstein, J.-M., et al., “Interpreting Space-Mission LET Requirements for SEGR in Power
MOSFETs,” IEEE Trans. Nucl. Sci., Vol. 57, No. 6, pp. 3443–3449, 2010.
Li, Z., “Beam Delivery Techniques: Passive Scattering Proton Beams,” PTCOG49 Educational
Workshop, NIRS, Chiba & GHMC, Maebashi, Japan, May 2010.
“Living With a Star (LWS) Space Environment Testbeds Pre-NASA Research Announcement
Requirements Workshops,” 2020. Available at: https://lws-set.gsfc.nasa.gov/workshops.html
Lomax, T., “State-of-the-Art Proton Therapy: The Physicist’s Perspective,” PTCOG47,
Jacksonville, FL, May 2008.
Lum, G. K., “Hardness Assurance for Space Systems,” Paper presented at the Nuclear and Space
Radiation Effects Conference Short Course, Atlanta, GA, 2004.
Lum, G. K., Boruta, N., Baker, J. M., Robinette, L., Shaneyfelt, M. R., Schwank, J. R., Dodd, P.
E., and Felix, J. A., “New Experimental Findings for Single-Event Gate Rupture in MOS
Capacitors and Linear Devices,” IEEE Transactions on Nuclear Science, Vol. 51, No. 6,
December 2004.
Lum, G. K., O’Donnell, H., and Boruta, N., “The Impact of Single Event Gate Rupture in Linear
Devices,” IEEE Transactions on Nuclear Science, Vol. 47, No. 6, December 2000.
Mangeret, R., Carriere, T., Beaucour, J., and Jordan, T., “Effects of Material and/or Structure on
Shielding of Electronic Devices,” IEEE Transactions on Plasma Science, Vol. 43, No. 6,
1996.
Marec, R., “TID Radiation Hardness Confirmation Procedure for Electronic Components and
Systems in Europe and USA,” Paper presented at the Radiation Effects on Components and
Systems Short Course, Moscow, Russia, 2015.
Marshall, C. J., “Proton Effects and Test Issues for Satellite Designers: Displacement Effects,” in
NSREC Short Course, 1999, pp. 1–62.
Marshall, C. J., Marshall, P. W., Waczynski, A., Polidan, E. J., Johnson, S. D., Kimble, R. A.,
Reed, R. A., Delo, G., Schlossberg, D., Russell, A. M., Beck, T., Wen, Y., Yagelowich, J.,
and Hill, R. J., “Hot Pixel Annealing Behavior in CCDs irradiated at –84°C,” IEEE Trans.
Nucl. Sci., Vol. 52, No. 6, 2005, pp. 2672–2677.
Martina, G., Christoph, S., Uli, W., Marta, R., Giovanni, S., John, W. N., Emanuele, T.,
Alessandra, M., Luca, B., Cesare, L., Marco, D., and Chiara La, T., “Accelerator-Based Tests
of Shielding Effectiveness of Different Materials and Multilayers using High-Energy Light
and Heavy Ions,” Radiation Research, Vol. 190, No. 5, August 2018, pp. 526-537.
Massengill, L.W., Kerns, D. V., Jr., Kerns, S. E., and Alles, M. L., “Single-Event Charge
Enhancement in SOI Devices,” IEEE Electron Device Letters, Vol. 11, No. 2, February 1990.

95
McClure, S., Pease, R. L., Will, W., and Perry, G., “Dependence of Total Dose Response of
Bipolar Linear Microcircuits on Applied Dose Rate,” IEEE Trans. Nucl. Sci., Vol. 41, No. 6,
1994, pp. 2544–2549. DOI:10.1109/23.340614.
McLean, F. B. and Oldham, T. R., “Basic Mechanisms of Radiation Effects on Electronic
Materials, Devices, and Integrated Circuits,” Paper presented at the Nuclear and Space
Radiation Effects Short Course, Snowmass, CO, 1987.
McMorrow, D., Melinger, J. S., Knudson, A. R., Buchner, S., Tran, L. H., and Campbell, A. B.,
“Charge-Enhancement Mechanisms of GaAs Field-Effect Transistors: Experiment and
Simulation,” IEEE Transactions on Nuclear Science, Vol. 45, No. 3, June 1998.
“Measurement and Reporting of Alpha Particles and Terrestrial Cosmic Ray-Induced Soft Errors
in Semiconductor Devices,” JEDEC Solid State Technology Association, JEDEC Standard
JESD89, August 2001.
Mertens, C., Meier, M. M., Brown, S., Norman, R. B., and Xu, X., “NAIRAS Aircraft Radiation
Model Development, Dose Climatology, and Initial Validation,” Space Weather, Vol. 11, pp.
603–635, 2013. DOI:10.1002/swe.20100.
“Methods for the Calculation of Radiation Received and its Effects, and a Policy for Design
Margins,” ECSS‐E‐ST‐10‐12C, 2010.
Minow, J. I., Neergaard Parker, L., Allen, J. R., Fry, D. J., Semones, E. J., Hock, R. A., et al.,
“Space Weather Architecture Options to Support Human and Robotic Deep Space
Exploration,” NESC-RP-17-01215, February 13, 2020. Also NASA/TM-2020-5000837,
2020.
MNCP, “MCNP User’s Manual Code,” Version 6.2, LA-UR-17-29981, 2017.
Mutuel, L. H., “Single Event Effects Mitigation Techniques Report,” Federal Aviation
Administration, Report No. DOT/FAA/TC-15/62, February 2016.
NASA Langley Research Center, “CertWare,” (n.d.). Available at
https://nasa.github.io/CertWare/
NIST pstar. Available at: https://physics.nist.gov/PhysRefData/Star/Text/PSTAR.html
Norbury, J. W., Slaba, T. C., Sobolevskyb, N., and Redell, B., “Comparing HZETRN, SHIELD,
FLUKA and GEANT Transport Codes,” Life Science in Space Research, Vol. 14, 2017, pp.
64-73, 2017. Available at https://doi.org/10.1016/j.lssr.2017.04.001
O’Bryan, M. V., et al., “Compendium of Recent Single Event Effects for Candidate Spacecraft
Electronics for NASA,” in Proceedings of the IEEE Radiation Effects Data Workshop
(REDW), San Francisco, CA, July 2013, pp. 22–29.
O’Neill, P. M., Badhwar, G. D., and Culpepper, W. X., “Risk Assessment for Heavy Ions of
Parts Tested with Protons,” IEEE Transactions on Nuclear Science, Vol. 44, No. 6,
December 1997.
Office of Safety and Mission Assurance (OSMA), “NASA Reliability and Maintainability
(R&M) Standard for Spaceflight and Support Systems,” NASA-STD-8729.1A, 2017.
Available at: https://standards.nasa.gov/standard/nasa/nasa-std-87291

96
Office of the Assistant Secretary of Defense for Command, Control, Communications, and
Intelligence, “Data Standardization Procedures,” Department of Defense Report No. DoD
8320.1-M-1, April 1998. Available at https://apps.dtic.mil/dtic/tr/fulltext/u2/a343735.pdf
Oldham, T. R. and McLean, F. B., “Total Ionizing Dose Effects in MOS Oxides and Devices,”
IEEE Trans. Nucl. Sci., Vol. 50, No. 3, 2003, pp. 483–499. DOI:10.1109/tns.2003.812927.
“Particle Therapy Facilities in Clinical Operation,” Particle Therapy Co-Operative Group
(PTCOG), last updated February 2020. Available at (last retrieved March 31, 2020):
https://www.ptcog.ch/index.php/facilities-in-operation
Pease, R. L., “Microelectronic Piece Part Radiation Hardness Assurance for Space Systems,”
Paper presented at the Nuclear and Space Radiation Effects Conference Short Course,
Atlanta, GA, 2004.
Pease, R. L., et al., "Mechanisms for Total Dose Sensitivity to Preirradiation Thermal Stress in
Bipolar Linear Microcircuits,” IEEE Trans. Nucl. Sci., Vol. 45, pp. 1425–1430, June 1998.
Pease, R. L., Turfler, R. M., Platteter, D., Emily, D., & Blice, R., “Total Dose Effects in
Recessed Oxide Digital Bipolar Microcircuits,” IEEE Trans. Nucl. Sci., Vol. 30, No. 6, 1983,
pp. 4216-4223. DOI:10.1109/TNS.1983.4333111.
Pellish, J. A., Xapsos, M. A., Stauffer, C. A., Jordan, T. M., Sanders, A. B., Ladbury, R. L., . . .
Rodbell, K. P., Impact of Spacecraft Shielding on Direct Ionization Soft Error Rates for Sub-
130 nm Technologies. IEEE Trans. Nucl. Sci., 57(6), 2010, pp. 3183-3189.
Petersen, E. L., “Single-Event Data Analysis,” IEEE Transactions on Nuclear Science, Vol. 55,
No. 6, December 2008.
Petersen, E. L., “Soft Error Results Analysis and Error Rate Prediction,” paper presented at the
Nuclear and Space Radiation Effects Conference Short Course, 2008.
Petersen, E. L., Koga, R., Shoga, M. A., Pickel, J. C., and Price, W. E., “The Single Event
Revolution,” IEEE Transactions on Nuclear Science, Vol. 60, No. 3, June 2013.
Petersen, E. L., Pickel, J. C., Adams, J. H., and Smith, E. C., “Rate Predictions for Single Event
Effects – A Critique,” IEEE Transactions on Nuclear Science, Vol. 39, No. 6, December
1992.
Petersen, E., Single Event Effects in Aerospace, Wiley, 2011.
Poivey, C., “European Cooperation for Space Standardization (ECSS) Radiation Hardness
Assurance (RHA) Standard,” Paper presented at the Radiation Effects on Components and
Systems Conference Short Course, Seville, Spain, 2011.
Poivey, C., “Radiation Hardness Assurance for Space Systems,” Paper presented at the Nuclear
and Space Radiation Effects Conference Short Course, Phoenix, Arizona, 2002.
Poivey, C., “TNID Total Non-Ionizing Dose or DD Displacement Damage,” ESA–CERN–SCC
Workshop, CERN, May 9–10, 2017. Available at:
https://indico.cern.ch/event/635099/contributions/2570676/attachments/1456363/2249942/4_
Radiation_Effects_and_RHA_ESA_Internal_Course_4_10_May_2017_DD_CP.pdf

97
Poivey, C., Buchner, S., Howard, J., LaBel, K., and Pease, R., “Testing and Hardness Assurance
Guidelines for Single Event Transients (SETs) in Linear Devices,” October 24, 2005.
Available at: https://radhome.gsfc.nasa.gov/radhome/papers/SET_Linear05.pdf
Poivey, C., “Total Ionizing and Non-Ionizing Dose Radiation Hardness Assurance,” Paper
presented at the Nuclear and Space Radiation Effects Conference Short Course, New
Orleans, LA, 2017.
Pourrouquet, P., Varotsou, A., Sarie, L., Thomas, J-C., Chatry, N., Standarovski, D., Rolland, G.,
and Barillot, C., “Comparative Study between Monte-Carlo Tools for Space Applications,”
Proceedings of the16th Eur. RADECS, Conference paper number C1, September 19–23,
2016.
“Radiation Single Event Effects (SEE) Impact on Complex Avionics Architecture Reliability,”
NASA/TM-2019-220269, NESC-RP-17-01211, April 2019. Available at (last retrieved May
1, 2020): https://ntrs.nasa.gov/archive/nasa/casi.ntrs.nasa.gov/20190002742.pdf
“Recommendations on Use of Commercial-Off-The-Shelf (COTS) Electrical, Electronic, and
Electromechanical (EEE) Parts for NASA Missions – Phase I Report,” NESC Final Report
NESC-RP-19-01490, October 27, 2020.
Reed, R., Weller, R. A., Akkerman, A., Barak, J., Culpepper, W., et al., “Anthology of the
Development of Radiation Transport Tools as Applied to Single Event Effects,” IEEE
Transactions on Nuclear Science, Vol. 60, 2013, pp. 1876–1911.
Roberts, B. C., “Cross-Program Design Specification for Natural Environments (DSNE),”
SLS-SPEC-159, Revision G, NASA Marshall Space Flight Center, Huntsville, Alabama,
2019. Retrieved from https://ntrs.nasa.gov/
Roche, N. J-H., Buchner, S. P., Foster, C. C., King, M. P., Dodds, N. A., Warner, J. H.,
McMorrow, D., Decker, T., O’Neill, P. M., Reddell, B. D., Nguyen, K. V., Samsel, I. K.,
Hooten, N. C., Bennett, W. G., and Reed, R. A., “Validation of the Variable Depth Bragg
Peak Method for Single-Event Latchup Testing Using Ion Beam Characterization,” IEEE
Transactions on Nuclear Science, Vol. 61, No. 6, December 2014.
Ronald, T. W. L., Kensek, P., Franke, B. C., Crawford, M. J., and Valdez, G. D., “ITS Version
6.4: The Integrated TIGER Series of Monte Carlo Electron/Photon Radiation Transport
Codes,” ANS RPSD 2014, 18th Topical Meeting of the Radiation Protection and Shielding
Division of the American Nuclear Society, Knoxville, TN, LaGrange Park, IL, September
14–18, 2014.
Sahu, K., “Instructions for EEE Parts Selection, Screening, Qualification, and Derating,” EEE-
INST-002, NASA/TP—2003-212242, (2003, original document; April 2008, revision to
incorporate addendum 1).
Santin, G. Kamg, S. Jun, I., Nieminen, P., et al., “A Radiation Transport Code Benchmarking
Study for the EJSM Mission,” IEEE Nuclear Science Symposium & Medical Imaging
Conference, 10.1109/NSSMIC.2010.5873852, November 2010.
Sawyer, D. M., and Vette, J. I., “AP-8 Trapped Proton Environment for Solar Maximum and
Solar Minimum,” National Space Science Data Center (NSSDC), 1976.

98
Schaefer, J. J., Owen, R. S., Rutt, P. M., and Miller, C., Observations from the Analysis of On-
Orbit Data from DRAMs Used in Space Systems,” paper presented at the 2009 IEEE
Radiation Effects Data Workshop, 2009.
Schwank, J. R., Shaneyfelt, M. R., and Dodd, P. E., “Radiation Hardness Assurance Testing of
Microelectronic Devices and Integrated Circuits: Test Guideline for Proton and Heavy Ion
Single-Event Effects,” Sandia National Laboratories Document SAND 2008-6983P, 2008.
“SEAM (System Engineering and Assurance Modeling).” Available at:
https://modelbasedassurance.org
Seltzer, S. M., “Updated Calculations for Routine Space-Shielding Radiation Dose Estimates:
SHIELDOSE-2,” Technical Report PB95-171039, National Institute of Standards and
Technology, Gaithersburg, MD, December 1994.
Shaneyfelt, M. R., Schwank, J. R., Witczak, S. C., Fleetwood, D. M., Pease, R. L., Winokur, P.
S., . . . Hash, G. L., “Thermal-Stress Effects and Enhanced Low Dose Rate Sensitivity in
Linear Bipolar ICs,” IEEE Trans. Nucl. Sci., Vol. 47, No. 6, 2000, pp. 2539–2545.
DOI:10.1109/23.903805.
“Single Event Effect Criticality Analysis,” NASA HQ/Code QW, GSFC, Greenbelt, MD, Tech.
Rep. 431-REF-000273, February 1996. Available at:
https://radhome.gsfc.nasa.gov/radhome/papers/seecai.htm
“Single Event Effects Test Method and Guidelines,” European Space Agency, European Space
Components Coordination, ESCC Basic Specification No. 25100, October 2014.
Slaba, T. C., Bahadori, A. A., Reddell, B. D., Singleterry, R. C., Clowdsley, M. S., and Blattnig,
S. R., “Optimal Shielding Thickness for Galactic Cosmic Ray Environments,” Life Sciences
in Space Research, Vol. 12, February 2017, pp. 1–15.
Slopsema, R., “Dosimetric Comparison of Proton Delivery Techniques: Double‐Scattering and
Uniform‐Scanning,” International Journal of Medical Physics Research and Practice, July
2008.
“Space Environment Engineering and Science Applications Workshop (SEESAW),” 2017.
Available at: https://cpaess.ucar.edu/meetings/2017/seesaw-presentations
“Space Product Assurance Derating - EEE Components,” European Cooperation for Space
Standardization, ECSS-Q-ST-30-11C Rev 1, October 3, 2011.
“Space Product Assurance Radiation Hardness Assurance - EEE Components,” European
Cooperation for Space Standardization, ECSS-Q-ST-60-15C, October 1, 2012.
SRIM. Available at: http://www.srim.org/
Srour, J. R. and Palko, J. W., “Displacement Damage Effects in Devices,” in NSREC Short
Course, 2013, pp. 48–102.
Srour, J. R., Marshall, C. J., and Marshall, P. W., “Review of Displacement Damage Effects in
Silicon Devices,” IEEE Trans. Nucl. Sci., Vol. 50, No. 3, 2003, pp. 653–670.
“Standard Guide for the Measurement of Single Event Phenomena (SEP) Induced by Heavy Ion
Irradiation of Semiconductor Devices,” ASTM International, ASTM F1192 – 11, reapproved
2018.

99
Stassinopoulos, E. G., and Brucker, G. J., “Shortcomings in Ground Testing, Environment
Simulations, and Performance Predictions for Space Applications,” Paper presented at the
Radiation Effects on Components and Systems Short Course, La Grande Motte, France,
1991.
Summers, G. P., Burke, E. A., and Xapsos, M. A., “Displacement Damage Analogs to Ionizing
Radiation Effects,” Radiat. Meas., Vol. 24, No. 1, 1995, pp. 1–8.
Summers, G. P., Burke, E. A., Shapiro, P., Messenger, S. R., and Walters, R. J., “Damage
Corellations in Semiconductors Exposed to Gamma, Electron and Proton Radiations,” IEEE
Trans. Nucl. Sci., Vol. 40, No. 6, 1993, pp. 1372–1379.
“Technical Requirements for Electronic Parts, Materials, and Processes used in Space Vehicles,”
USAF Space Command, Space and Missile Systems Center Standard, SMC-S-010, April 12,
2013.
“Test Procedures for the Measurement of Single-Event Effects in Semiconductor Devices from
Heavy Ion Irradiation,” JEDEC Solid State Technology Association, JEDEC Standard
JESD57A, November 2017.
“Test Standard for the Measurement of Proton Radiation Single Event Effects in Electronic
Devices,” JEDEC Solid State Technology Association, JEDEC Standard JESD234, October
2013.
“Testing at the Speed of Light: The State of U.S. Electronic Parts Space Radiation Testing
Infrastructure,” National Academies of Sciences, Engineering, and Medicine, Washington,
DC, The National Academies Press, 2018. Available at: https://doi.org/10.17226/24993
Titus, J. L., “An Updated Perspective of Single Event Gate Rupture and Single Event Burnout in
Power MOSFETs,” IEEE Transactions on Nuclear Science, Vol. 60, No. 3, June 2013.
Turflinger, T. L., Clymer, D. A., Mason, L. W., Stone, S., George, J. S., Koga, R., Beach, E., and
Huntington, K., “Proton on Metal Fission Environments in an IC Package: An RHA
Evaluation Method,” IEEE Trans. Nucl. Sci., Vol. 64, No. 1, 2017, pp. 309-316.
DOI:10.1109/TNS.2016.2626960.
Turflinger, T. L., Clymer, D. A., Mason, L. W., Stone, S., George, J. S., Savage, M., Koga, R.,
Beach, E., and Huntington, K., “RHA Implications of Proton on Gold-Plated Package
Structures in SEE Evaluations,” IEEE Trans. Nucl. Sci., Vol. 62, No. 6, November 2015, pp.
2468–2475. DOI:10.1109/TNS.2015.2496288.
Van Allen Probes, 2020. Available at: http://vanallenprobes.jhuapl.edu/
Vette, J. I., “The AE-8 Trapped Electron Model Environment,” National Space Science Data
Center (NSSDC), 1991.
Wilson, J. W., Slaba, T. C., Badavi, F. F., Reddell, B. D., and Bahadori, A. A., “Advances in
NASA Radiation Transport Research: 3DHZETRN,” Life Sci. Space Res., Vol. 2, 2014, pp.
6–22.
Xapsos, M. A., “Modeling the Space Radiation Environment,” Paper presented at the Nuclear
and Space Radiation Effects Conference Short Course, Ponte Vedra Beach, FL, 2006.

100
Xapsos, M. A., Stauffer, C., Gee, G. B., Barth, J. L., Stassinopoulos, E. G., and McGuire, R. E.
“Model for Solar Proton Risk Assessment,” IEEE Trans. Nucl. Sci., Vol. 51, No. 6, 2004, pp.
3394–3398.
Xapsos, M. A., Stauffer, C., Jordan, T., Barth, J. L., and Mewaldt, R. A., “Model for Cumulative
Solar Heavy Ion Energy and Linear Energy Transfer Spectra,” IEEE Trans. Nucl. Sci., Vol.
54, No. 6, 2007, pp. 1985-1989.
Xapsos, M. A., Stauffer, C., Jordan, T., Poivey, C., Haskins, D. N., Lum, G., . . . LaBel, K. A.,
“How Long Can the Hubble Space Telescope Operate Reliably? A Total Dose Perspective,”
IEEE Trans. Nucl. Sci., Vol. 61, No. 6, 2014, pp. 3356–3362.
DOI:10.1109/TNS.2014.2360827.
Xapsos, M. A., Stauffer, C., Phan, A., McClure, S. S., Ladbury, R. L., Pellish, J. A., . . . LaBel,
K. A., “Inclusion of Radiation Environment Variability in Total Dose Hardness Assurance
Methodology,” IEEE Trans. Nucl. Sci., Vol. 64, No. 1, 2017, pp. 325–331.
DOI:10.1109/tns.2016.2607021.
Xapsos, M. A., Summers, G. P., Barth, J. L., Stassinopoulos, E. G., and Burke, E. A.,
“Probability Model for Worst Case Solar Proton Event Fluences,” IEEE Transactions on
Nuclear Science, Vol. 46, No. 6, 1999, pp. 1481–1485.
Xapsos, M. A., Summers, G. P., Barth, J. L., Stassinopoulos, E. G., and Burke, E. A.
“Probability Model For Cumulative Solar Proton Event Fluences,” IEEE Transactions on
Nuclear Science, Vol. 47, No. 3, 2000, pp. 486-490.
Yen, L., “An Introduction to the Bootstrap Method,” January 26, 2019. Available at (last
accessed December 2, 2020): https://towardsdatascience.com/an-introduction-to-the-
bootstrap-method-58bcb51b4d60

101
Appendix A. Ray Trace/Shielding Analysis Checklist for NOVICE
RMC Simulations
Return to Main
A.1 Section Summary
The guidance discussed below applies to using CAD files with the NOVICE MC radiation
transport tools. The details are based on many lessons learned. Due to the process complexity of
moving a 3D model between software platforms, it is worthwhile to establish a similar checklist
to reduce technical errors and maintain efficiency.
A.1.1 Computer-aided Design (CAD) File Preparation and Export Guidelines
• Export CAD model as a STEP file. PTC Creo CAD software is preferred, but other software
can also be used, such as SolidWorks.
• CAD models are typically organized with a base assembly that references other
assemblies and parts.
• Add solid cubes (any size, but typically between 1 and 5 mm on a side) to the model at
locations where radiation doses are to be calculated from the ray trace.
• The local coordinate system for each cube should have its origin located at the center of
the cube. These “RadDet” cubes should each have a unique name less than 24 characters
long and meaningful to the project and contain “RadDet” or “RD” within their name. For
example: CDH-Brd1-RadDet1, CDH-Brd1-RadDet2, CDH-Brd2-RadDet3, etc. or
HVPS-RadDet1, LVPS-RadDet1, etc. The ray trace dose result table will use these
names, and they are also required to find the objects in the converted NOVICE (ray trace)
geometry model. Each of these “RadDet” cubes is essentially a separate Pro/E part (i.e.,
geometry) that is a solid cube placed into the CAD model at the desired location and
having a unique name.
• It is helpful to provide a list of these RadDet names in an Excel file.
• Gather (from the project cognizant engineers) densities for any parts in the CAD model that
are not aluminum.
• It is assumed that all parts not otherwise specified are aluminum (the default density for
aluminum is 2.6989 g/cc in the ray trace). These densities should be listed in an easily
readable file type (e.g., comma-separated value, Excel, etc.) with the CAD model part
name in one column and its density (e.g., g/cm3) in another.

102
• Call out any honeycomb panels in the model and designate them in the Excel file along with
an appropriate density for simulation.
• These panels are typically aluminum, but the honeycomb structure is never implemented
in the CAD model and is typically a solid aluminum panel in the CAD model that has
been assigned a density much lower than that of aluminum since honeycomb panels
contain a lot of “empty” space.
• Ensure there are no “holes” that lead from outside the instrument/system/vehicle to the
inside.
• This typically happens with Dsub connectors since they have holes through them. In the
final flight instrument, these “holes” are usually covered with a connector shroud and are
not a problem. If such holes are present, it leads to a direct line-of-sight from the space
environment to the inside of their instrument, which causes an artificially high dose
during the ray trace calculation.
• The area surrounding the connector and the connector cutout can also be a problem
because of a small gap between them where the only material thickness seen is the
thickness of the flange on the Dsub connector. Again, in the final flight model, connector
shrouds typically cover this, but if those connector shrouds are not in place in the STEP
file output, the resulting calculated doses can be artificially high.
• Purge holes or vent holes can be a problem as well if there is a line-of-sight path from
outside the instrument to inside.
• The instrument boxes should be light tight (except optically via a lens). If a beam of light
can get through the box, for example, at the seam between two box walls, then so can
radiation from the space environment.
• Pay particular attention to curved or rendered geometries when moving between CAD
file structures (e.g., .stp to .vrml). Resolution of tessellated surfaces can sometimes leave
missing information or material (when approximating curved surfaces), allowing for
miscalculations.

103
Appendix B. Generating Radiation Requirements
Return to Main
B.1 Section Summary
This appendix provides an overview of requirements generation for radiation effects, with
rationale of the requirement origins. The topics are not meant to be exhaustive, but provide
atypical examples and can be applied to other mechanisms, technologies, or mission
requirements with supporting data and information. This section does not cover the requirements
for testing.
Section Highlights and Takeaways
• A sufficient requirements framework defines both bottom-up piece-part obligations (e.g.,
TID levels, SEE rates, etc.) and a means of incorporating necessary top-down system
allocations (e.g., availability and reliability resources, etc.). The two approaches (bottom-up
and top-down) must reconcile and trade the costs of success with size, weight, power, and
performance.
• Requirements must be verifiable, and as the event requirements change or evolve, radiation
engineers need adequate traceability to parent requirements to understand where and how
potential impacts will manifest, since such changes can impact shielding analyses, SEECAs,
etc.
• Verifying compliance with requirements occurs via analysis, often based on data from
representative test parts. Representative traceability in this context refers to materials and
processes and may constrain how requirements address mission needs across the spectrum of
piece-part and component quality levels.
B.2 Requirements Generation by Mechanism
Sections 8, 9, and 10 give explanation to the mechanisms and underlying physics associated with
radiation effects in EEEE devices. Each section explores the concept of radiation effects
categories that have unique definitions. Both ionizing and non-ionizing radiation incident on
components will have adverse effects on nominal operation of active semiconductors; thus, there
is a need for requirements that take into account the mission strategies of either screening for or

104
identifying susceptibilities. Table B-1 below shows the takeaways from Sections 5.0, 6.0, and
7.0, including what happens once the incident particle deposits charge or energy into the device,
whether the effect is cumulative or instantaneous, and which features from the mission
environment are of interest with respect to each mechanism.
Table B-1. Mechanisms Tied to Mission Environment
Radiation Effects Mechanism Time Dependence Mission Environment Parameters
of Interest
TID
Charge trapping
in oxides and at
interfaces
Cumulative
Total mission fluences for all
particle sources encountered
(trapped, solar)
TNID Displacement of
the lattice Cumulative
Total mission fluences for all
particle sources encountered
(dominant contribution by
protons)
Single Event
Local energy
deposition along
particle tracks
Instantaneous
Flux predictions for all possible
mission events (e.g., solar events,
radiation belt transits, passing
through SAA, etc.)
These mechanisms leading to radiation response then rely on the environment models and their
fidelity before a requirement can be derived.
B.3 Requirements Generation by Technology or Device Type
Technologies exhibit specific physics of failure, and it is not easy to group them all. When
writing requirements for radiation, the goal is requirements statements that have an impact that
varies given the device technology [Bosherini et al., 2003; LaBel & Gates, 1996; Ladbury &
Triggs, 2011; Ladbury & Campola, 2013]. Establishing the radiation requirements by part family
will allow quick categorization of risk and will lend itself to a targeted analysis. There are no
rules of thumb, only the physics of failure that can be attributed to device process and
architecture. The following are some of the known risks to given technologies, in a notional
order of risk to the part operation. It is up to the mission requirements and design to determine
the risk to the intended system operation:
• DSEEs: parts can fail to either short or open (family of effects that permanently damage the
device and result in its being inoperable).
• TID/DDD: part shows degradation beyond device specifications, looks like early wear-out
mechanisms.
• SETs: Temporal response to charge injection. Can be rail-to-rail voltage or current changes
that damage downstream or peripheral components.
• SEFIs: require intervention, depending on part type may need a reset signal or a full power
cycle.
• MBUs/MCUs: error detection cannot correct, refresh, rewrite, or power cycle may be needed.
• SETs with error rates so high that information is lost or communications need reset.
• SEUs can change the state of memory cells or switch the state of logic level devices. There
are hard errors where loss of cell use may occur, masking these upset cells or the
blocks/pages that contain them, and may keep the remainder of the memory usable.
105
Key factors that need to be considered are the criticality and availability of the EEEE part in its
application. In every available opportunity, ask how a part response will affect the devices that
are connected or share failure modes. Ask what impact the typical device response would have at
the subsystem or system level. For a discrete transistor, would a gain degradation lead to science
loss? Or would the device continue to function as a switch? Simply stating that if a part failure is
a single string and whether it is critical can determine the path to mission success.
In specific device types or for a given technology, engineers benefit from detailed information
based on lessons learned through either on-orbit use or ground-based testing and investigation.
The radiation effects may be less prevalent given device applications, and this may be best
shown in the example of SEGR, where the effect is tied to an electric field across a thick gate
within. The example requirements might then follow:
********************************************************************
Destructive Events (SEBs and SEGRs)
Power MOSFETs shall be derated to 75% of their maximum survival drain-source voltage (VDS)
as determined by SEGR testing at 133% of the worst-case circuit-application gate-source turnoff
voltage, unless all of the following conditions apply:
• The application gate-source turnoff voltage is within a diode-drop of 0 V.
• The worst-case application drain-source voltage is no more than 30 V.
• The device is rated to at least 100-V drain source.
The survival voltage (VDS) shall be established from exposure to a minimum fluence of 5E+5
ions/cm2 with a minimum LET of 37 MeV-cm2/mg throughout the sensitive charge-collection
region (epilayer(s)) of the device.
Testing shall be performed at normal beam incidence and at room ambient temperature.
Part types that are susceptible to SEB shall not be used at a level higher than 75% of the
maximum survivable voltage as determined in SEB testing.
The survival voltage (VCE, VR, or VDS) shall be established from exposure (at normal beam
incidence) to a minimum fluence of 5E+5 ions/cm2 of an ion with a minimum LET of 37
MeV-cm2/mg throughout the depletion depth of the device when at its maximum voltage.
**********************************************************************
B.4 Translating Mission, Environment, Application, and Lifetime (MEAL)
Requirements to Radiation Requirements
Requirements for each mission will have to be tailored such that the environment, application,
and lifetime are taken into account [NESC, 2018]. In this example, radiation considerations are
addressed for a mission intended for lunar orbit, on a system that has already flown in LEO
(specifically low altitude, low inclination). Mission requirements for success may not change
from the previous mission for some disciplines. For radiation, changes would show up in two
realms: environment and lifetime (see Figure B-1).

106
Figure B-1. Going from LEO to Lunar: Application may be the same, but Environment and
Lifetime are More Severe
Due to these changes, a reevaluation of the radiation environment is necessary. To do so,
collection of the mission environment contributors and the mission phases in their presence will
give the aggregate TID/DDD throughout the mission, and a mission phase/profile based
description of the SEE contributors is needed to derive the new requirements. Based on
Table B-2, adapted from SLS_SPEC-159, this includes the transfer/transit orbit and the lunar
orbit.
Table B-2. Major Radiation Environment Contributors
Radiation
Effects LEO Lunar
TID Solar + trapped protons Solar protons
TNID Solar + trapped protons Solar protons
Single Event Trapped protons in SAA No geomagnetic shield for solar
particle events and GCR
With new environment information captured, the analysis can be revisited to look for parts that
do not meet the previous requirements outright. If the application information or captured
assumptions address the hazard, then parts use can be revisited and approved/disapproved based
on the new environment information. Note that this includes different SEE rate estimations,
including all environment contributors.
When translating from mission to radiation:
• Identify MEAL or mission requirements on reliability and availability.
• Example: increased lifetime in new environment, same reliability.
• Actions: check on wear-out mechanisms (TID/TNID) for increased mission length/dose.
• Identify impact to radiation hazard:
• Example: Higher TID/DDD, higher SEE rates for “soft” parts, higher likelihood of
destructive effects.
• Actions: recategorize likelihood vsersus consequence for risk.
• Identify impact to previously used evidence or test data:
• Example: same application, increased likelihood of SEEs.
• Actions: revisit rate calculations versus availability.
• Note: Appendix A in NESC-RP-16-01117 [2018] provides information that testing at
higher than part level will reduce the fidelity in our experimental results.

107
B.5 References
Boscherini, M. et al., “Radiation Damage of Electronic Components in Space Environment,”
Nuclear Instruments and Methods in Physics Research, Section A: Accelerators,
Spectrometers, Detectors and Associated Equipment, Vol. 514, No. 1–3, 2003, pp. 112–116.
LaBel, K. A. and Gates, M. M., “Single-Event-Effect from a System Perspective,” IEEE Trans.
Nucl. Sci., Vol. 43, No. 2, 1996.
Ladbury, R. L. and Campola, M. J., “Bayesian Methods for Bounding Single-Event Related Risk
in Low-cost Satellite Missions,” IEEE Trans. Nucl. Sci., Vol. 60, No. 6, 2013, pp. 4464–
4469.
Ladbury, R. L. and Triggs, B., “A Bayesian Approach for Total Ionizing Dose Hardness
Assurance,” IEEE Transactions on Nuclear Science, Vol. 58, No. 6, 2011, pp. 3004–3010.
“Guidelines for Verification Strategies to Minimize RISK Based On Mission Environment,
Application and Lifetime (MEAL),” NESC-RP-16-01117, April 5, 2018, and NASA/TM-
2018-220074, April 2018.
B.5.1 Useful Standards and Additional References for Generating Radiation
Requirements
https://radhome.gsfc.nasa.gov/radhome/papers/Proton_RHAGuide_NASAFinal.pdf
https://radhome.gsfc.nasa.gov/radhome/papers/HEART08_LaBel_pres.pdf

108
Appendix C. Goal Structuring Notation (GSN) and Model-Based
Mission Assurance (MBMA)
Return to Main
C.1 Section Summary
This appendix will give an overview of GSN and how it fits into a MBMA process. Examples
will be given for the different types of radiation effects. GSN is one tool that can be used to
digitally “connect the dots” of the RHA process.
Section Highlights and Takeaways
• MBMA enables tracing of RHA to both the system design and across the project lifecycle.
• GSN allows the logic of the assurance argument to be analyzed, especially when deviating
from standard RHA approaches, either for a specific part or the entire system.
• GSN and MBMA can capture different types of criticality analyses, including SEECA and
those related to TID and TNID, and emphasize how to maximize return on investment when
trying to connect to the system design and with other engineering disciplines.
• GSN and MBMA can help uncover whether radiation requirements are in fact traceable and
verifiable.
C.2 GSN
GSN is a graphical notation standard used to explicitly document an assurance case [ACWG,
2018]. An assurance case is a reasoned and compelling argument supported by sufficient
evidence that a system will operate as intended for a given, defined environment. An argument is
a connected series of claims that support an overall claim. Assurance cases and, by extension, a
GSN model are the only means of documenting an argument and do not establish the truth of the
argument. Acceptance of the case requires the argument to be reviewed by stakeholders of the
system. GSN provides a way of documenting the assurance case that allows others to discuss,
challenge, and review the assurance case. GSN was created at the University of York in the
1990s and has been used in a variety of safety and security assurance cases [Austin et al., 2017;
CertWare, 2011].
GSN provides a structure to indicate how claims are supported by sub-claims. The elements of
this structure are summarized in Figure C-1. Claims in GSN are represented as goals. An

109
example goal is “System does not fail from TID-induced failures during the mission lifetime.” A
sub-claim, or child goal, is “Part will survive the radiation environment.” The goals for each of
the electronic parts to pass the TID requirement together support the claim that several of the
parts in the system pass the TID requirement. The assertion of evidence to support the truth of a
goal is represented by a solution. An example solution is “Part radiation test results.” The
stakeholders reviewing the assurance case would then decide whether the test result is evidence
enough to support the goal of “Part will survive the radiation environment.” When documenting
the reasoning between goals and child-goals, strategy elements are used. An example strategy is
“Assess part TID hardness level through existing test reports and/or test campaign,” which
provides the task that specifies why the parent goal, “System does not fail from TID-induced
failures during the mission lifetime,” is completed by the child goal, “Part will survive the
radiation environment.” Goals, strategies, and solutions make up the base of the GSN structure
and are connected with solid arrows that indicate inferential and evidential relationships. In
summary, goals and strategies are alternately refined until the goal is specific enough to be
supported by a solution element, which links to the results of parts tests, system tests, simulations
and analysis, literature review, etc. A simple assurance case arguing for the TID hardness of the
system by evaluating each part’s hardness is shown in Figure C-2.
Figure C-1. Elements of GSN

110
Figure C-2. GSN Argument for Part-level Evaluation of TID Susceptibility
An assurance case is made within a certain environment. For a mission, the environment can
include radiation, thermal profile, budget, and development time. There are several ways in GSN
to show how the environment interacts with the assurance case. The first way is with a context
element, which provides information on how a goal or strategy should be interpreted. An
example context is “Expected TID for mission is 75 krad(Si),” which provides information for
the goal “System does not fail from TID-induced failures during the mission lifetime.” Details
about the radiation environment are needed to ensure the system functionality system will not be
compromised.
The second way of indicating the effect of the environment on the argument is through
assumption elements. Assumptions are premises that need to be true for the goal or strategies to
be valid. For example, the assumption “Radiation tests are applicable to parts with the same part
number and manufacturer (not lot testing)” is an assumption for the goal “System and its
elements are designed to withstand nominal and extreme loads and stresses (radiation) for the life
of the mission.” This is part of the argument for the RHA of a CubeSat mission. Because of cost
and risk tolerance for the mission, lot testing is not possible. The assumption captures that all of
the radiation tests for this system will not be lot testing. During the review of the argument, this
assumption captures a deviation from best practices and additional scrutiny that should be placed
on the argument. Assumptions are valid for all of the child strategies and goals further down the
evidential path from the point where the strategy or goal of the assumption first appears.

111
The last way of indicating the effect of the environment on the argument is through a
justification element. Justifications explain why a goal or strategy is acceptable. For example, the
justification “Heavy-ion SEL tests were not performed because the heavy-ion environment does
not significantly contribute to the radiation environment and there are system-level latch-up
mitigation schemes” is an explanation for the strategy “Perform proton SEL characterization
tests on system parts,” as shown in Figure C-3. A reviewer might ask why heavy-ion SEL testing
was not completed, as it is a part of standard RHA activities, and this explicitly states the
reasoning for that decision. The GSN argument that includes the assumption and justification
example can be found in Figure C-4. Assumptions, justifications, and context are connected to
goal, strategies, and solutions with dotted arrows to indicate contextual relationships. In
summary, assumptions, justifications, and context about the argument are linked to appropriate
strategies or goals to further clarify the assurance case. In Figure C-1, all of the elements of GSN
are presented.
Figure C-3. Argument for SEL Assessment for Sub-D Class Mission

112
Figure C-4. First Phase of GSN Argument for Destructive SEE Hardness
C.2.1 GSN throughout the Lifecycle
As seen throughout this guideline, there are many pieces to track when developing and
implementing an RHA plan, regardless of the class of mission or the severity of the environment.
MBMA can improve the tracking and analysis required for the RHA process. One part of this
process that could be aided by MBMA is the derivation and verification of part-level radiation
requirements. To demonstrate this process, the derivation and verification of an SEB requirement
is modeled throughout the NASA project lifecycle. The requirement is, “The probability of
failure from SEB shall be less than 1%.” This requirement will drive design and test decisions
and needs to be verified. The final product of the RHA activities may be summarized in a
requirement verification matrix where the result is “Probability of failure of 2% at derating of
50% with current shielding,” but by using GSN, all of the activities, results, assumptions, and
justifications are captured.
At the beginning of Phase B, generic goals are generated for the GSN argument from part
assurance templates, and these provide a framework for planning RHA activities. For example,
the requirement RAD1 in Figure C-5 implies there is a goal that the components in the system
survive SEB. To meet that goal, the components in the system that are susceptible to SEB must
be identified, and their probability of failure must be calculated. To make these calculations, the
mission environment needs to be estimated, radiation tests need to be found or performed, and
then the susceptibility of the component can be evaluated by calculating a probability of failure.
These activities happen throughout Phase B.
During Phase B, the mission length, orbit, and nominal shielding are provided by the project and
system engineers. These are inputs into the environment prediction tools. Next, how the sensitive
components are used in the system needs to be determined. For SEB, this includes bias voltages

113
and duty cycle. The component use determines test conditions and what will be considered
failure for a component. Then, radiation tests are found or performed. The results of the tests are
attached to the solution in the GSN model. Figure C-5 shows the GSN argument at the end of
Phase B.
Figure C-5. GSN Argument for Destructive SEE Hardness after Evidence is Collected
Using MBMA to capture RHA activities enables concurrent engineering of reliability and
design. It shows how requirements are derived and verified throughout the project. These
requirements are both intelligent and mission-specific—one of the driving forces behind the new
R&M standard. Requirements can be defined as more about the implementation of mission
objectives is known, and then mission assurance activities that are performed are tailored to the
system design and mission objectives.
C.2.2 Reliability and Maintainability (R&M) Hierarchy and the Digital Transformation
The NASA Office of Safety and Mission Assurance (OSMA) created the NASA R&M hierarchy
to require that R&M activities and decisions for a mission be presented in a graphical format
[Groen et al., 2015]. In addition to simplifying the evaluation of system reliability, the R&M
hierarchy accommodates reliability evaluation of systems developed within the Model-based
System Engineering (MBSE) paradigm. MBSE is the application of models to support activities
related to system requirements, design, analysis, verification, and validation through the entire
lifecycle of a system [International Council on Systems Engineering (INCOSE), 2007], where a
model is defined as a physical, mathematical, or otherwise logical representation of a system,
entity, phenomenon, or process [Office of the Assistant Secretary of Defense for Command,
Control, Communications, and Intelligence, 1998]. The R&M hierarchy became NASA-STD-
8729.1A [OSMA, 2017].
The R&M hierarchy is one piece of the increase in modeling at all levels of design and analysis
as part of NASA’s digital transformation [DiVenti, 2019]. Evaluating the risk of radiation to the
system requires knowledge of the component’s use in the system. The more that information can
be captured and kept up to date in a model-based environment, the quicker and easier the
information can be used by the engineers that need that information, as described in Bajaj et al.

114
[2016]. While there can be a big investment at the beginning to create and support model-based
engineering, the investment is quickly returned when changes in the mission and system are
made.
C.3 References
Assurance Case Working Group (ACWG), “GSN Community Standard,” Report No. SCSC–
141B, 2018. Available at https://scsc.uk/r141B:1
Austin, R. A., Mahadevan, N., Sierawski, B. D., Karsai, G., Witulski, A. F., and Evans, J., “A
CubeSat-payload Radiation-reliability Assurance Case using Goal Structuring Notation,”
Proc. Ann. Reliability & Maintainability Symp. (RAMS), 2017, pp. 1–8. Available at
https://doi.org/10.1109/ram.2017.7889672
Bajaj, M., Cole, B., and Zwemer, D. (2016). Architecture to geometry - integrating system
models with mechanical design. Proc. AIAA SPACE. https://doi.org/10.2514/6.2016-5470
NASA Langley Research Center, “CertWare,” (n.d.). Available at
https://nasa.github.io/CertWare/
DiVenti, T., “NASA’s Digital Transformation (DT) Initiative: Potential Opportunities for the
NEPP Community,” In NASA NEPP ETW 2019, Goddard, MD, June 17, 2019. Available at
https://nepp.nasa.gov/workshops/etw2019/talks/0617MON/1100%20-
%20DiVenti%20NEPP%20ETW%202019%20rev%20A.pdf
Groen, F. J., Evans, J. W., and Hall, A. J., “A Vision for Spaceflight Reliability: NASA’s
Objectives Based Strategy,” Proc. Ann. Reliability and Maintainability Symp. (RAMS), 2015.
Avialable at https://doi.org/10.1109/rams.2015.7105106
International Council on Systems Engineering (INCOSE), “System Engineering Vision 2020,”
Report No. INCOSE-TP-2004-004-02, 2007.
Office of the Assistant Secretary of Defense for Command, Control, Communications, and
Intelligence, “Data Standardization Procedures,” Department of Defense Report No. DoD
8320.1-M-1, April 1998. Available at https://apps.dtic.mil/dtic/tr/fulltext/u2/a343735.pdf
Office of Safety and Mission Assurance (OSMA), “NASA Reliability and Maintainability
(R&M) Standard for Spaceflight and Support Systems,” NASA-STD-8729.1A, 2017.
Available at: https://standards.nasa.gov/standard/nasa/nasa-std-87291

115
Appendix D. Proton Testing at Medical Therapy Facilities
Return to Main
D.1 Section Summary
Since the closure of the Indiana University Cyclotron Facility (IUCF) in 2014, where a large
percentage of domestic high-energy proton SEE testing was performed, there has been increasing
use of medical proton therapy facilities (MPTF) for SEE testing with protons in the 200 MeV or
greater regime. This appendix covers some of the unique features and considerations for using
MPTF. The emphasis is on those facilities that are new to SEE testing rather than those that
provided protons prior to and since the IUCF shutdown. Additional information on SEE proton
testing and references is contained in the SEE and test sections.
D.2 Pretest Considerations
There are numerous items to consider prior to any SEE MPTF test trip that cover some of the
logistics and technical areas of interest. Many of these topics can be recognized from traditional
SEE test sites; however, there are nuances for a MPTF. All these items should be discussed with
the MPTF in advance and preferably documented in the test plan.
D.2.1 Logistics
What Facilities are Available?
Table D-1 is a snapshot of known North American proton SEE test sites (>200 MeV) with
current points of contacts (POCs). This is an evolving and changing list and should be considered
a snapshot only. New MPTFs are being commissioned and built, and changes are being made to
the business models at existing MPTFs, where access increases or decreases. It is a volatile

116
industry. The old-guard MPTFs and Tri-University Meson Facility (TRIUMF) are included as
well.
Table D-1. Domestic High-energy Proton Test Facilities as of September 2020
Selling
Time Organization Location POC(s) Email(s)
Yes
James M. Slater MD
Proton Treatment &
Research Center
Loma Linda,
Yes Northwestern Medicine
Chicago Proton Center
Warrenville,
IL Steven Laub [email protected]
Yes
The MGH Francis H. Burr
Proton Beam Therapy
Center
Boston, MA Ethan Cascio [email protected]
Yes TRIUMF Proton
Irradiation Facility
Vancouver,
CAN
Ewart
Blackmore,
Mike
Trinczek
Yes Provision CARES Proton
Therapy Center
Knoxville,
TN
Candace
Davis, Jewell
Overton
candace.davis@
provisionhealthcare.com;
jewell.overton@
pronovasolutions.com
Yes
Proton Therapy at
University of Cincinnati
Medical Center
Liberty
Township,
OH
Abram
Gordon,
Anthony
Mascia
Limited Hampton University
Proton Therapy Institute
Hampton,
VA
Vahagn
Nazaryan
vahagn.nazaryan@
hamptonu.edu
Limited Mayo Clinic Proton Beam
Facility – Rochester
Rochester,
MN
Nicholas
Remmes [email protected]
Limited MD Anderson Proton
Therapy Center Houston, TX
Limited Mayo Clinic Proton Beam
Facility – Phoenix Phoenix, AZ
Daniel
Robertson [email protected]
Scheduling
When reaching out to the POC at the MPTF, be aware that there are a variety of scheduling
models being used, including:
• Weekends
• One day or both days
• Two weekends a month, three out of four weekends a month
• 6, 12, or 16 hours each day
• Evenings
• After patient treatments end for the day
• 4 to 8 hours (SEE testers are used to 24/7 operations)
• Interleaving during the patient treatment hours
• Lowest priority patient model

117
• Assumes “isolation” from patient area (dedicated research room)
• ~15 minutes of beam per hour (in 2- to 3-minute blocks)
• 15 to 20 minutes of beam per hour is a usual sweet spot for users
This model changes if no patients are being treated with a machine (dedicated time available).
Contracts
While MPTFs are used to either direct payment or medical insurance, many are now taking
purchase orders or other contract vehicles. This is not universal, however. Be aware of potential
concerns on items like “indemnity clauses” or government Federal Acquisition Regulations
(FARs) that might delay finalizing contracts.
Shipping and Storage of Equipment
It is important to make sure the MPTF understands that organizations typically either ship
equipment in advance or drive equipment to the site. The size and weight of the shipment (e.g.,
crates, boxes, etc.) and the facility’s ability to handle and store equipment prior to testing is
important, as well as the ability to manage return shipping logistics.
Rooms/Areas
Advance knowledge of the staging area (where testers initially unpack equipment and set up their
test systems pre-target room installation), user areas (where the tester sits during the actual test
runs), and the target room (where the DUT is being irradiated) is useful. The staging/user areas
can vary between facilities: some have dedicated rooms, while others use hallways. It is a good
idea to check on availability of electrical power outlets/options in all locations, especially if other
than standard 110 V outlets are needed.
A related target (treatment) room issue is beam orientation for testing. MPTFs often have two
flavors for beam orientation: fixed gantry (i.e., the beam is either fixed in a vertical or horizontal
position) or rotating gantry (i.e., the beam rotates around the patient). The target is usually
desired to be mounted perpendicular to the beam direction. Knowing the orientation (i.e.,
horizontal, vertical) prior to developing a test jig reduces headaches upon test installation.
Cabling Distances/Options
While this a universal consideration for all SEE test facilities, the variance between MPTFs and
the cabling distance between the DUT in the beam and the user area has been noted to be
between 50 and 125 ft depending on the facility. It may be quite a labyrinth, and bringing safety
tape or similar is a good idea. Some MPTFs do have patch panels with a few feedthrough
connectors (these are often the ones with an actual research room).
Internet and Amenities
Nearly all sites have access to the basic amenities such as wireless internet, bathrooms, break
room/kitchenette, electrical power, and so on. These new MPTFs and their amenities tend to be
much nicer than pre-2000 facilities, primarily due to their medical/patient connections.
D.2.2 Technical
Available Beam Characteristics (i.e., energy, intensity, structure, spot size)
It is important to note that unless the MPTF is familiar with SEE testing and has been used
previously, medical physicists and radiation test personnel often use different terms and

118
conversion; understanding between both sides is needed. It is important to note what the planned
target types are:
• The DUT or system under test (SUT) can be:
• A single IC – DUT
• Often surrounded by support circuits (non-irradiated)
• A board/assembly of ICs – SUT
• May irradiate part or all of assembly
Proton Energy
The MPTF, like most test facilities, is usually able to change energies either through tuning or
degrading processes. In addition, it should be clear the energy of interest is at the surface of the
DUT/target. Providing desired energies for test prior to arrival helps the medical physics staff.
Beam Intensity
Medical physics use dose/dose rate metrics in either tissue or water, while SEE testers use
dose/dose rate in a semiconductor material as well particle rates (flux, fluence) normalized to a
cm2. To complicate matters, most MPTFs use a secondary means of tracking irradiation levels
known as monitor units (MUs) or monitor counts. These depend on the equipment manufacturer,
their control system, and the energy being used. Translating these factors for both setting
irradiation levels and dosimetry purposes is required.
Beam Structure
General Comments
For SEE, there are two main considerations for how the beam is being delivered:
• Spatial or geometric coverage.
• Temporal characteristics.
Spatial refers to having both a uniform and a random probability of interacting with a specific
portion of the DUT/SUT. In other words, there is a random nature similar to a shotgun blast
dispersion that provides this characteristic. To accomplish this, the proton beam is a fixed point,
often with either a single or double scatter to provide a uniform field on the target.
Just as an equal chance of hitting any target within a DUT geometrically is desired, the same
uniform randomness over time is also desired. That is, equal probability of particle interarrival
time occurring during any operational state (or within a state). This requires a beam that is
relatively continuous (uniform) in time (i.e., minimal “dead time” between particle interarrival
times on the DUT/SUT).
• Cyclotrons provide this structure of particle delivery.
• Synchrotrons do not provide this structure of particle delivery: they have a beam spill
structure with a pulse of particles followed by dead time. This difference does not make
synchrotrons unusable for SEE testing; it simply adds another factor in developing test plans,
performance, and data analysis.
For either spatial or temporal considerations, one must induce the widest coverage of possible
error signatures that can occur during a test run, which the IUCF provided. The IUCF structure
was a fixed point/scatter structure. In other words, the beam itself was stationary, and the

119
particles were randomly spaced over a fixed target size, often using a scattering foil with
uniformity across the spot (usually >90%). This is the “old school” proton method (see
Figures D-1 and D-2.)
Figure D-1. Single Scattering Proton Beam Profile [reprinted from Li, 2010]
Figure D-2. Double Scattering Passive Proton Beam Delivery System for Proton Therapy
[reprinted from Slopsema, 2008]

120
Newer facilities use more advanced scanning techniques for the proton beam, having transitioned
from a uniform/wobble (raster-scan like) beam to the newer pencil-beam scanning that is similar
to a 3D printer for spot-to-spot energy and dose changes within a treated tumor (see Figure D-3).
While such a beam structure could be used, it would require a patient treatment plan (or similar)
that is time-consuming to develop by the medical physicist. The good news is that the motion
can be set either to zero (stationary beam) or to a service/maintenance mode that has a fixed
beam position that mimics the desired and traditional fixed spot size. Some facilities may have
the ability to adjust the spot size prior to its exit from the beam nozzle as well, but not all.
Figure D-3. Uniform or Wobble Beam Operation for Proton Therapy
[reprinted from Slopsema, 2008]
The MPTFs are also a mix of cyclotrons (continuous beam structure), synchrotrons (pulsed beam
structure), or hybrids (pulsed, but may have less dead time between pulses or beam spills). See
Figure D-4. This provides two factors to consider:
• Instantaneous flux: the flux for each pulse/spill versus the usual average flux for a continuous
beam. Note that dialing down the instantaneous flux would increase typical run times
significantly. This is only an issue for extremely proton sensitive DUTs, where “beam
pileup” may occur due to overlapping/multiple events during a beam spill.
• Dead time between pulses: this must be considered for operational circuitry, such as when
there is a serial data stream (bit error rates would need to be normalized to “active beam”
time) or for ensuring randomization of operational state coverage (often called state-space).
The higher the operating frequency and the more SEE sensitive a DUT is, the more the
pulsed structure needs to be included in data analyses.
There are multiple manufacturers of the proton accelerators that are used domestically. For
reference, they are Hitachi, IBA, Mevion, ProNova, Sumitomo, and Varian. If the SEE tester is
familiar with working with an IBA machine, for example, other MPTFs that have an IBA
machine are very similar to use.

121
Figure D-4. Beam Structure Timing comparing Cyclotron (continuous wave) versus Synchrotron
(beam spill, or “pulsed”)
Beam Spot Size/Collimation
Once the beam is fixed, it exits the beam nozzle and spreads out as function of the radial distance
(1/r2) from the nozzle. DUT/target location should be set such that either the spot at that location
matches the beam size or if a larger irradiation area is needed (or mounting distance method is
unavailable), a scattering foil may be used to widen the spot. Be aware that many facilities may
NOT have scattering foils available, albeit they may have another means of increasing spot size
prior to nozzle exit. In addition, scattering foils (and most materials that are under irradiation)
increase the background neutron levels from the proton-material interactions. This should be
discussed with the MPTF at length. Background neutrons scattered through the target room may
cause damage to sensitive test equipment (e.g., power supplies) or set off background neutron
monitors. Polyethylene blocks or boxes of borax are often used to reduce neutron exposures for
test equipment of peripheral electronics. Some MPTFs may have polyethylene blocks available.
In some cases, the beam at the DUT/target location is larger than needed, such as when there are
multiple DUTs and the size has been set to the largest DUT. In these cases, the beam may be
shrunk using brass collimators. Note that while the facility may have some collimators, the test
group may have to provide their own and take them into account for mounting. Brass will
become activated with sufficient proton exposure.
Beam Control
Who and how the beam is controlled varies significantly across different MPTFs. It is important
to discuss in advance the general practices for starting/stopping the beam, setting flux and
desired fluence or run time variables, and so on. It is important to be clear that SEE tests usually
have one of three stopping points: cumulative fluence/dose level, TBD number of events (e.g.,
cell upsets), or anomalous condition (e.g., SEL, SEFI, etc.). The latter usually requires a manual
intervention and should be discussed with the MPTF on how best to handle.
122
Caveat: Radiation Test Levels
Many facilities, to protect their own equipment and dosimetry systems (and potentially not set
neutron monitor alarms off), may limit the dose/fluence allowed in a given time period (e.g., per
hour). The cumulative levels during an irradiation campaign may also be limited to reduce risk of
activation of materials from the beam. A fluence level of 1×10¹¹ p/cm2 is an example of an
“acceptable” hourly level for some facilities.
DUT/Target Mounting
While the MPTF may have a mounting fixture available, many simply provide a rolling cart or
robotic patient sled or other for user-provided DUT/target mounting hardware. This implies that
the user may need to bring stands, clamps, risers, benchtop jacks, and so on.
The robotic patient sled is usually a SOTA piece of equipment that costs >>$100 K; some
facilities may have specific concerns on its use.
Dosimetry and Secondary Particles
First the good news: these are patient treatment facilities. The dose and location of the irradiation
is very precise, and their dosimetry checks are designed to validate these. Unfortunately, their
measurement equipment focuses on the dose being delivered and not on particle counting
equipment used at heavy ion or research proton facilities. Providing a detailed test plan with
desired spot size(s), test energies, and flux/dose rates allows the physics staff at the MPTF to
determine appropriate mounting locations for test performance. Alternately, the MPTF may have
some preset locations for a limited set of available parameters. Measurements at the actual
DUT/target location are a good idea for validation before irradiation test runs begin.
Proton therapy facilities generally use a calibrated ion chamber and a readout with a recycling
integrator to serve as a continuous monitor of the beam flux during radiation exposures. The
readout is in MUs. They measure the energy of the proton beam by stopping it in water. In
proton therapy treatments, dose and dose rate in water (e.g., Gy(H2O) and Gy(H2O)/s) delivered
to the patient as the beam stops are the quantities of interest. In radiation effects testing, the
number of protons/cm2-s, called flux, and the number of protons/cm2, called fluence, for an
exposure in which the protons pass through a DUT, are the quantities of interest.
For radiation effects testing at a MPTF, using any beam delivery system (e.g., single scatter,
double scatter, uniform beam, etc.), the test team needs the facility to provide the following:
• Dose in water per monitor unit or count, Gy(H2O)/MU or monitor count.
• Dosimetry calibration.
• Proton energy at the DUT location.
The proton therapy community uses the SI unit gray (Gy) for absorbed dose, where 1 Gy = 1
joule/kg. However, the radiation effects community frequently uses the deprecated CGS unit rad,
where 1 rad = 100 ergs/g = 1 cGy. Like grays, it needs to be defined as a function of the target
material (e.g., Gy(Si) or rad(Si)). This supporting document shows how to take Gy(H2O)/MU,
MU rate, and the energy at the DUT to calculate the fluence and flux at DUT.
Dose is defined as the energy absorbed per unit mass and is the product of the fluence and the
LET, which is a function of the kinetic energy of the incident particles, the target material the
energy is transferred to, and the particle species. LET is well-known for protons and can be
obtained from Stopping and Range of Ions in Matter (SRIM) [SRIM] or the National Institute of
123
Standards and Technology (NIST) pstar tool [NIST pstar]. For convenience, the NIST pstar web-
based tool is recommended, which relies on ICRU Report 49 [ICRU 49]. There are known small
differences in LET values from these sources:
Test case example:
• 200 MeV protons at the DUT location
• Dosimetry calibration = 6.54×10⁻⁴ Gy(H2O)/MU at DUT
• Exposed at 500 MU/s for 20 s
Conversions and constants:
• 1 Gy = 6.2414×10⁶ MeV/mg = 0.1 krad
• 1 krad = 6.2414×10⁷ MeV/mg
• Charge of proton = 1.6022×10⁻¹⁹ C
• LET(H2O, p, 200 MeV) = 4.491×10⁻³ MeV-cm2/mg
• LET(Si, p, 200 MeV) = 3.627×10⁻³ MeV-cm2/mg
Convert calibration from Gy to MeV/mg:
• 6.54×10⁻⁴ Gy(H2O)/MU × 6.2414×10⁶ MeV/mg = 4080 MeV/mg(H2O)-MU
• Calculate fluence/MU:
• fluence/MU = 4080 MeV/mg(H2O)-MU/4.491×10-3 MeV-cm2/mg = 9.08×10⁵
protons/cm2-MU
• Calculate flux/MU/s:
• flux/MU/s = 9.08×10⁵ protons-s/cm2-s-MU
• For the example, there are 500 MU for 20 s, or 10000 MU total for the exposure.
• So, the fluence is 1×104 MU × 9.08×105 protons/cm2-MU or 9.08×10⁹ protons/cm2 and the
flux is (500 MU/s) * (9.08×10⁵ protons-s/cm2-s-MU) = 4.54×10⁸ protons/cm2-s
• The dose in water is 6.54×10⁻⁴ Gy(H2O)/MU * 10000 MU = 6.54 Gy(H2O)
• The dose in silicon is fluence (protons/cm2) * LET(Si, p, 200 MeV) MeV-cm2/mg =
9.08×10⁹ protons/cm2 * 3.627×10-3 MeV-cm2/mg = 3.29×10⁷ MeV/mg or (3.29×10⁷
MeV/mg) / (6.2414×10⁷ MeV/mg/krad) = 0.527 krad(Si) or 587 rad(Si).
While secondary particles (e.g., neutrons) typically have a low background level in most MPTFs,
any additional material (e.g., scattering foils, collimators, test hardware) in the beam path
increases the secondaries throughout the room, especially high-Z targets.
Beam Stop
Patient treatment uses what is known as the spread-out Bragg peak (SOBP) method: using the
Bragg Peak to place the precise near end of range proton energy in the tumor. The tumor, in
essence, is the beam stop. Proton SEE testing wants to stay away from the Bragg peak knee
(sharply varying energy around the peak of the Bragg curve); thus, the beam must “go through
the patient” (i.e., the DUT/target). Depending on the facility, a beam stop may be needed for this
exiting beam.

124
Table D-2. Summary of MPTF Irradiation Considerations (medical versus space electronics)
Patient Electronics (Typical)
Measurement: dose in tissue/water Measurement: dose (material – Si, SiO2, GaAs, etc.) and
particle rates (fluence – protons/cm2 and flux – protons/cm2/s).
Beam penetration: use Bragg peak to stop
the beam in the patient
Beam penetration: beam goes through the target with a beam
stop behind the target
Exposure stop: cumulative dose Exposure stop: cumulative dose, fluence, number of recorded
events, degradation, or an unanticipated event/failure. When an
unanticipated event occurs, the beam stop may be manual,
automatic, or via verbal command such as “stop.” Coordinating
“beam on” with DUT operation is important as well.
Target size: tumor Target size: single device/chip (1 cm × 1 cm) to a full assembly
(20 cm × 20 cm or larger).
Beam delivery: pencil beam, wobble,
uniform scan, or fixed point/scatter
Beam delivery: prefer fixed point/scatter.
Beam timing structure: less important Beam timing structure: when particle arrives versus electronics
operation can be important, but not always.
Patient exposure: a few minutes Target exposure: flexible, seconds to minutes, depending on
stop criteria. There are often many exposures (test runs) per
target (10 to 100 s).
Beam movement: gantry or fixed Beam movement: fixed.
D.3 Checklists
D.3.1 Arriving at the Facility (test day minus 1)
While test teams usually prefer to arrive the day prior to beam availability, this may not be
possible based on patient treatments and MPTF protocols.
Entrance Area/HIPAA
All MPTFs are focused primarily on the patient needs, rights, security of information, and
privacy. The Health Insurance Portability and Accountability Act (HIPAA) enacted in 1996 is a
common patient treatment consideration. Some MPTFs may require HIPAA forms to be signed
upon entry for SEE testers.
The time when you are allowed to arrive at the MPTF is usually defined by the medical
processes at the facility to protect these patient rights. It varies from the day before, the evening
before, to the morning of. This depends on two factors:
• Is there a separate entrance that isolates the test team from the patients, or is the main lobby
entrance used?
• Will you be there during patient treatment hours?
As a note, many MPTFs will require each test team member to sign a HIPAA form to confirm
that the team will respect patient rights.
Radiation Safety/Personal Dosimetry
This varies significantly from facilities that have detailed briefings and require each team
member to wear a personal dosimeter to those that have a short briefing and may require some of
the team members to have a personal dosimeter (shared dosimetry).
125
Unpacking Equipment and Test Setup Validation
Self-explanatory.
Power (Outlets)
It is important to note if you need a wall power supply other than 120 V/60 Hz. It is always a
good idea to bring protected power strips, UPS bricks, and power regulators to ensure clean
sources for sensitive test equipment.
D.3.2 Test Performance
The following sections are simply representative checklists for test performance and provide
some rough guidance for timelines.
Setting Up (Test Day or Sometimes Test Day-1):
• Dosimetry check.
• Mounting the test fixture.
• Beam area/collimation.
• Cabling.
• User area.
• Training on entry/exit from beam room and beam control.
Preparing to Irradiate (Test Day):
• Setting beam parameters for the test run(s) (e.g., energy, flux, fluence, time, etc.).
• Converting MUs or dose to flux/fluence.
• Start/stop methods (fluence, time, event).
• Beam control.
Typical Test Run Protocol (Test Day):
• Verify electrical test operation.
• Verify beam parameters (check that run numbers are the same on test system and beam
control).
• Start test system.
• Start beam.
• Stop beam (on set time, fluence, or event).
• Log test results; log run dosimetry.
• Repeat or modify as needed.
Changing Things (Test Day):
• Replacing parts or new boards.
• Activation check and irradiated part storage.
• Proton exposure will activate materials (metals). Work with the facility on proper
protocol for surveying irradiated hardware prior to removal from the beamline. This includes
changing out socketed devices.
• A proper location for storage of activated hardware should be discussed with the MPTF.
• Changing energy, flux, etc.
• Changing angles (usually not necessary for standard proton SEE testing).

126
Post-Test (Test Day or Post-Test Day):
• Confirm all logs are stored and saved (backups are good).
• Check hardware activation.
• Return shipping coordinated with facility (paid by user).
• While the half-life of the typical SEE test hardware may be short (overnight to return to
background levels), some hardware (e.g., custom collimators) may stay activated longer
and require safe storage. Shipping is contingent on ensuring appropriate radiation safety
practices.
D.3.3 Some Good Ideas
• Canary test.
• Have a part with known susceptibility to check for consistency with other test sites.
• “Blank” test.
• Point beam at “empty” spot for a test run (i.e., not on DUT or on any test electronics).
This either looks for issues with secondary neutrons or coupled power noise.
• Have backup plans.
• Generally, a good idea. Some test fixtures are finicky, or the errors being observed are
not as expected. When this happens, debugging while in the target area wastes resources;
having a backup test to swap out test articles should be considered.
D.4 References
ICRU Report 49. Available at: https://icru.org/home/reports/stopping-power-and-ranges-for-
protons-and-alpha-particles-report-49
Li, Z., “Beam Delivery Techniques: Passive Scattering Proton Beams,” PTCOG49 Educational
Workshop, NIRS, Chiba & GHMC, Maebashi, Japan, May 2010.
Lomax, T., “State-of-the-Art Proton Therapy: The Physicist’s Perspective,” PTCOG47,
Jacksonville, FL, May 2008.
NIST pstar. Available at: https://physics.nist.gov/PhysRefData/Star/Text/PSTAR.html
Slopsema, R., “Dosimetric Comparison of Proton Delivery Techniques: Double‐Scattering and
Uniform‐Scanning,” International Journal of Medical Physics Research and Practice, July
2008.
SRIM. Available at: http://www.srim.org/

127
Appendix E. Impact of Sample Size on Radiation Testing and
Analysis
Return to Main
E.1 Section Summary
Determination of sample size represents one of the most challenging aspects for Design of
Experiments in RHA, involving tradeoffs between confidence and statistical rigor on one hand,
and cost, schedule, and skilled labor on the other. If the failure distributions for a part are well
behaved, then validation of required performance with high confidence can be obtained with
small sample sizes (~5 to 10 parts for TID and ~3 to 5 for TNID and SEE). In many cases,
especially when parts are expensive or difficult to obtain or where parametric measurements are
labor intensive, it may be impractical to test larger sample sizes, making evidence that failure
distributions are well behaved especially valuable.
Unfortunately, failure distributions for some parts are pathological, and allowing such parts to be
treated with standard statistical analyses that ignore such pathologies can introduce systematic
errors, leading to significant underestimate of failure probability. Moreover, if testing is
conducted with small test samples, it is unlikely that such distribution pathologies would even be
detected. This appendix discusses the types of distribution pathologies that occur in radiation
tests, the limited information on potential causes, and the types of data that can alert an analyst to
potential distribution pathologies. It concludes with a brief discussion of what is known and/or
expected for COTS devices.

128
Section Highlights and Takeaways
• Determining appropriate sample size is one of the most challenging aspects of Design of
Experiments for RHA, because the sample size required depends on the variability in the
parent population, which may not be known, as well as the application’s tolerance for failure.
• Although it is difficult to estimate population variability a priori (e.g., without a large-sample
characterization test), some types of data may provide indicators:
• Historical and similarity data—if a part type has exhibited significant variation in
previous lots, or if there is a high degree of variability between lots or if similar parts
fabricated in the same process have been highly variable, then caution (in the form of an
increased sample size) may be warranted.
• Understanding of the mechanisms and conditions responsible for augmented variability in
some parts can allow the analyst to be observant for conditions that may be present in
other parts.
• Extreme variability may result from inadequate margins in the design of the part. As
such, parts that exhibit anomalous behavior when tested at the extremes of their
operability range may merit large-sample radiation characterization as a matter of
caution.
• Because of competing effects and the diverse nature of COTS electronics, it is not possible to
predict whether variability in this class of electronics will be greater than or less than
variability in past generations of electronics.
• Large-sample testing will provide more value as generic data across the radiation effects
community, so individual investments should consider this given that radiation testing often
expends large amounts of nonrecurring engineering, and recurring engineering during data
collection is relatively small.
E.2 Variability, Sampling, and all that Stuff
The need for representative samples in radiation testing raises the importance of sampling errors
and, therefore, part-to-part variability in the parent population. Variability is most problematic
for TID degradation because many part types exhibit significant variability not just from lot to
lot, but also from part to part within a lot. However, a recent study of SEB susceptibility in
commercial TrenchFETs [George, 2017] found pathological variation in onset VDS for SEB.
Variability has also been reported for other power devices (e.g., GaN FETs), although to date no
systematic study has been undertaken, so the evidence remains anecdotal.
Pathological variability can manifest in several ways. Figure E-1 shows three types of
problematic variability, all of which have the same average: 1) wide distributions (blue curve
shows a lognormal curve with lognormal standard deviation = 0.7), for example, where the
standard deviation is commensurate with the mean; 2) bimodal distributions, where the failure
distribution has two peaks (orange curve shows a distribution where the lower mode is 25% as
large as the upper mode); and 3) thick-tailed distributions, where the tail of the distribution
decreases roughly according to a power law rather than an exponential far from the peak of the
distribution.

129
Figure E-1. Examples of Pathological Distributions occurring in RHA
All three types of pathologies occur in TID testing, as shown in Figure E-2. The ADI OP484
shown in the upper plot of the figure exhibits highly variable TID response both from part to part
and from lot to lot. Most lots exhibit either high degradation or low degradation. However, a few
seem to have parts from both high- and low-degradation modes. Since part-to-part and lot-to-lot
variation are roughly commensurate, taking an aggregate distribution over multiple lots helps to
define the high mode and low modes, making it easier to see intra-lot bimodality. In contrast,
degradation for New England 2N5019 JFETs (lower plot) that fall outside the main mode do not
coalesce into additional modes, instead having finite probabilities extending far from the peak
(here, 3 orders of magnitude). Other devices have also exhibited bimodal [Krieg, 1999] and
thick-tailed responses [Ladbury, Gorelick, & McClure, 2009].

130
Figure E-2. Examples of Distribution Pathologies from Actual TID Test Data
E.3 Dealing with Different Pathological Variabilities
Different types of variability demand different approaches.
E.3.1 Broad Distributions
In the least pernicious type of variability, the failure distribution is unimodal and the tails
decrease exponentially as one moves away from the mode, but the distribution is wide (large
standard deviation) compared with the mean. A conventional measure if this variability is the
coefficient of variation, defined as the ratio of the distribution’s standard deviation s to its mean
m: CV = s/m. For a lognormal distribution with lognormal standard deviation ,
CV = . Since increasing the sample size decreases errors on estimates of both s and
m, this is the most effective way of ensuring TID failure estimates are bounding. The
conventional approach to bounding failure probability uses one-sided tolerance limits. Figure E-3
illustrates how these limits can prevent overestimation of TID hardness assurance due to

131
sampling errors. For this figure, 10,000 MC runs were generated, each with a sample of five data
points drawn from the parent distribution (yellow). The data in the figure represent the run that
most overestimated the hardness of the parts worse than 90% of the other runs (90% confidence
level). For the dose where 99% of parts would pass (vertical blue line) for this 90% WC
distribution, ~14% of parts from the parent distribution (yellow) would fail. On the other hand,
the dose determined by KTL corresponding to 99% of parts passing with 90% confidence
(vertical red dashed line) coincides almost exactly with the Ps = 99% for the parent distribution.
For a test sample of n parts with mean failure dose m and standard deviation s, to ensure with
confidence CL and probability of at least Ps that a part chosen from the parent population will
remain functional at the end of the mission, one must ensure that the mission dose is less than the
KTL estimate of the dose:
D(n,Ps, CL) = m – KTL(n,Ps, CL)*s (Eq. E-1)
This can be rewritten as:
D(n,Ps, CL) = m(1 – KTL(n,Ps, CL)*CV) (Eq. E-2)
Thus, for the failure dose to be positive, a sample size n must be selected for which KTL<1/CV.
CV can be estimated by looking at TID test data for historical data for the same part type, or CV
can be bound by looking at data for similar parts. For a five-part test sample, to obtain Ps = 99%
with CL = 90%, the KTL value (multiplier for the standard deviation) is 4.67. Thus, one would
require CV<1/KTL(n = 5, Ps = 99%, CL = 90) = 1/4.67 = 0.21. (Note that even for lognormal
statistics, the same bound would apply since the dose would be determined by taking exponential
of the right-hand side of equation, and if the exponent is less than or equal to 0, then the
bounding dose<1 krad(Si).)
Figure E-3. 90% WC from 10,000-run MC Simulation: How wrong can you be due to Sampling
Errors?
E.3.2 Thick-Tailed and Bimodal Distributions
While the main issue with wide distributions is the risk of underpredicting the standard
deviation, thick-tailed and bipolar distributions pose the additional risk that the pathology of the

132
distribution may not even be detected. This has important implications. First, failure estimation
for pathological distributions requires an entirely different hardness assurance protocol, with
much larger test sample sizes and different statistical analyses. Assuming the distribution is
normal when it is pathological results in systematic errors and dramatically underestimated
failure rates.
As an illustration of this risk, consider the standard Gaussian and standard Cauchy distributions
shown in Figure E-4. Although these distributions look drastically different in the tails, the
differences are much smaller in the peaks—and it is much more probable to draw test samples
from the peaks than the tails. This makes it difficult to detect distribution pathologies with small
sample sizes. Table E-1 shows the results for samples of 5, 10, and 20 parts drawn from
simulated standard Gaussian and Cauchy distributions. To reliably detect pathological
distributions with a small sample (five parts), one must allow a large false-positive probability.
The situation improves significantly if the test sample is doubled to 10 parts, and by the time the
sample is doubled again (20 parts), detection of pathological distributions can be done reliably
without an unacceptably high false-positive rate. Both the false negative (failure to detect
pathology) and the false positive rate have important consequences for hardness assurance. If a
pathological distribution is treated as if it is normal, failure probabilities are significantly
underestimated (e.g., at the level where the standard normal distribution predicts 1% failures, the
Cauchy distribution has a 13.7% failure probability).
In contrast, if a well-behaved distribution is falsely identified as pathological, it forces one to
either carry out hardness assurance in a much more rigorous and costly manner or to accept a
much lower level of assurance that parts will meet the requirements. In the absence of any
knowledge of the distribution, rigorous testing requires testing sample size to be determined
using a “distribution-free” model (e.g., binomial sampling). Using binomial sampling, if a
22-part sample does not fail at a dose D, then there is 90% confidence that any thick tail or
second mode with failures below D must constitute less than 10% of the parts.
Figure E-4. Standard Gaussian versus Standard Cauchy Distribution

133
Table E-1. Probability of Detecting Cauchy Distribution for a Given False Positive for
Identifying Gaussian Distribution as Cauchy
Unfortunately, a binomial test reveals nothing about the efficacy of increased RDM for
increasing confidence or success probability, and doing so in the absence of assumptions about
the failure distribution is a difficult proposition. If the standard deviation s of the parent
distribution is known, then it can be shown that probability must fall faster than the inverse
square of the number of standard deviations from the mean (Chebyshev’s inequalities):
P(X > ks) < 1/k2 (Eq. E-3)
Thus, fewer than 1% of parts are 10 standard deviations above or below the mean. However,
usually only the sample standard deviation will be known, and the sample standard deviation
may differ significantly from the population standard deviation, especially if the population
standard deviation is large or the sample size is small. In general, the wider the parent
distribution and the thicker its tails, the larger the errors on the sample standard deviation, and
these errors will decrease roughly only as the square root of the sample size.
E.4 Looking for Evidence of Pathology
Because of the significantly increased expense of hardness assurance in the absence of
constraints on the failure distribution, there is strong incentive to understand the causes of
pathological variability.
E.4.1 Looking for Pathologies by Design
The most general and straightforward approach to detecting and understanding distribution
pathologies is to carry out a test designed to characterize the failure distribution well into its tails.
In the absence of assumptions about the characteristics of the failure distribution, samples should
be determined using binomial sampling. Table E-2 gives the percentage of parts likely to be in
the main mode for confidence levels CL and sample size n if no outliers for that mode are
detected.
Table E-2 shows that unless sample sizes are large, the probability and confidence that there are
no pathologies in the distribution remains modest, and such large samples are usually impractical
for most RHA efforts.

134
Table E-2. Percentage of Parts in Main Mode with Confidence CL for n Parts with no Outliers
Characterization tests are also often carried out on a one-time basis to determine worst-case test
conditions (e.g., dose rate/ELDRS susceptibility and bias dependence). Although such tests are
usually carried out with small test samples (e.g., five parts per test condition), they require
independent samples for each of several test conditions. As such, if the part-type failure
distribution has a pathology, then the chances that it would be sampled for one or more test
conditions may be good. This would likely manifest as an outlier for the subsample. As an
example, an ELDRS characterization typically tests parts for high and low dose rates (HDR and
LDR) in biased and unbiased conditions with five samples per test condition recommended. If
one of the parts in the unbiased LDR group is an outlier compared with the other parts in the
group, it is likely an indication of a pathology affecting at least that condition. If no outliers are
found (again comparing each part’s performance to the mean for its group), it does not
definitively rule out pathological response for all test conditions, but it does increase confidence
that the failure distributions will be well behaved. If none of the 20 parts in an ELDRS
characterization are outliers, then it could indicate that any pathology encompasses less than 11%
of the parent population.
E.4.2 Mechanisms for Pathological Variability
Because testing with large samples is costly, several studies have tried to determine the causes of
pathological variability in semiconductor devices. Most have focused on TID variability.
Because TID degradation depends on the propensity of device dielectrics to trap charge, the
studies have focused on factors that affect the qualities of these dielectrics. More than anything
else, these studies highlight the complexity of TID degradation mechanisms, which depend on a
range of processes that modulate the densities of charge traps and trapped charge in the bulk
dielectric and at the interface of the dielectric and semiconductor. The fact that interface traps
often compensate charge trapped in the bulk means that competing effects can result in
counterintuitive behavior (e.g., ELDRS). It also means that TID response depends not just on the
fabrication process, but also on factors that can occur even for packaged parts. In particular,
hydrogen content in the package and the thermal history of the part can affect whether a part
exhibits pathological variability [Adell et al., 2007; Pease et al., 1998] by modulating the charge
traps at the Si/SiO2 interface. Hydrogen may explain the thick-tailed response of the ADI
AD590, although not the bimodality of the OP484 op amp. In general, a “burn-in” type exposure
to high temperature prior to irradiation decreases degradation, variability, and ELDRS response.
It also decreased SEB onset VDS variation for some TrenchFET types but not others. In general,

135
determining the origin of a particular part’s pathological variation is challenging and costly, and
determining whether unfamiliar parts suffer from similar effects is difficult if not impossible.
E.4.3 Historical and Similarity Data
As noted above, detecting pathological variability requires sampling from the pathological
feature (e.g., the thick tail or second, lower-probability mode). This is unlikely with the small
samples typical for radiation lot acceptance testing (RLAT) and most other radiation tests.
However, as noted in Section 1.4.1, combining information from multiple test samples—either
subgroups for a characterization or multiple RLAT samples—can alert the analyst to the
presence of distribution pathologies even if no single sample exceeds five parts. If 3 RLAT
samples are available, then it may be possible to model the part-to-part and lot-to-lot variation,
making it easier to identify outliers. However, if modeling is impractical, results for each part
can be compared with the average to assess whether it is a credible outlier. This can be done by
bootstrapping the n-part sample and comparing the results for the n resulting (n – 1) part samples
[Yen, 2019].
Likewise, data for similar parts fabricated in the same process can also provide indications that
parts in the process pose higher risk and should be tested with larger test samples. As with
historical data, such “similarity” data can be used to model part-to-part, lot-to-lot, and part-type-
to-part-type variation. These models can in turn be used to better identify outliers. Although
failure to find evidence of pathological variation in any of several similar parts does not
guarantee that the part under consideration is well behaved, it provides increased confidence, and
finding evidence of pathology for any similar part would indicate that a cautious approach with
increased sample sizes is prudent.
E.4.4 Part Performance for Extreme Conditions and Overtest
The performance of a part type at the extremes of its operating range may provide indications of
whether its design margins are narrow enough that normal processing variations could manifest
as pathological variation in radiation response. For example, marginal performance at low
temperature could indicate low design margins for gain. Also, if bimodality is likely to be an
issue, it is more likely to manifest first when the part is current- or voltage-starved, whereas the
pathology would manifest for normal operating conditions only at higher doses. In a similar
manner, overtest of a part may not just establish radiation design margin. It may also detect
pathological variation in radiation response in the test part that could manifest at lower doses for
other parts drawn from the population (e.g., flight parts).
E.5 Pathological Variability in COTS Devices and Technologies
To date, most of the part types that have exhibited pathological variability have been of older
technologies. Indeed, many of the parts that have exhibited the most extreme variability have
been discrete semiconductors. While some of this trend toward pathological variability may be
intrinsic to such older (especially discrete) technologies, at least part of it is likely due to the fact
that the technologies have a long history of use, and the low cost and simplicity of such parts
make high-part-count testing viable. Moreover, some studies [George, 2017] and anecdotal
evidence suggest that the possibility of pathological variability should not be ignored for COTS
parts.
Assessing variability in COTS parts poses challenges for several reasons. They may be
expensive, making large sample sizes prohibitively costly. Data assessing the degradation and

136
failure modes is often complex, making it difficult to assess for outliers. Moreover, the profusion
of COTS solutions and relatively short COTS product life cycle make it unlikely that multiple
test datasets will exist even for parts that are popular with designers.
Additionally, the question of whether to expect greater or lesser pathological variation with
COTS parts is difficult because there are conflicting trends affecting susceptibility (see
Figure E-5). Certainly, if the flight and test parts are not traceable to the same wafer diffusion lot,
then there is no reason to expect that the parent population from which they are drawn will have
a well-behaved radiation failure distribution—or even that the test sample response will be
representative for the flight parts. However, even if parts are entirely traceable from wafer
through packaging, the situation remains uncertain. Unquestionably, semiconductor fabrication
techniques have improved, and most vendors produce products that are consistent from part to
part and lot to lot. In general, susceptibility to TID degradation has decreased as gate dielectrics
have thinned. At the same time, fabrication of deep-submicron devices poses inherent
challenges. For example, fluctuations in dopant concentration are inherent to the process when
the drain area of a transistor contains only a few dozen dopant atoms on average. Also, while
thinning of gate oxides has reduced their contribution to TID susceptibility, field oxides still pose
threats. Finally, the demands of a SOTA COTS part often stretch the capabilities of the
fabrication process to its limits. DDRx SDRAMs have long been on the leading edge of CMOS
technology, and even prior to irradiation the distribution of retention time is broad even for cells
in the same memory. This can cause some bits to fail at low doses, especially if the part is not
being operated at the maximum refresh rate.
Figure E-5. How Does it Balance? Factors that Increase and Decrease Variability as
Microelectronics Technologies Shrink
In addition, the work done by George et al. [2017] demonstrates that TID is not the only
radiation threat where pathological variability makes testing with larger samples prudent. The
mechanism for this variability in SEB is not well understood. However, given that SEB depends
on the properties of the parasitic bipolar transistor in the MOSFET structure and that parasitic
properties are not tightly regulated, the variability is perhaps not surprising. This suggests that
SEL and perhaps SEGR could also be similarly variable for some COTS parts.
E.6 References
Adell, P. C., et al. “Impact of Hydrogen Contamination on the Total Dose Response of Linear
Bipolar Microcircuits,” IEEE Trans. Nucl. Sci., Vol. 54, No. 6, pp. 3354–3360, 2007.

137
George, J. S., et al., “Response Variability in Commercial MOSFET SEE Qualification,” IEEE
Trans. Nucl. Sci., Vol. 64, No. 1, pp. 317–324, 2017.
Krieg, J., et al., “Hardness Assurance Implications of Bimodal Total Dose Response in a Bipolar
Linear Voltage Comparator,” IEEE Trans. Nucl. Sci., Vol. 46, No. 6, pp. 1627–1632, 1999.
Ladbury, R., Gorelick, J. L., McClure, S. S., “Statistical Model Selection for TID Hardness
Assurance,” IEEE Trans. Nucl. Sci., Vol. 56, No. 6, pp. 3354–3360, 2009.
Pease, R. L., et al., "Mechanisms for Total Dose Sensitivity to Preirradiation Thermal Stress in
Bipolar Linear Microcircuits,” IEEE Trans. Nucl. Sci., Vol. 45, pp. 1425–1430, June 1998.
Yen, L., “An Introduction to the Bootstrap Method,” January 26, 2019. Available at (last
accessed December 2, 2020): https://towardsdatascience.com/an-introduction-to-the-
bootstrap-method-58bcb51b4d60

REPORT DOCUMENTATION PAGE
Standard Form 298 (Rev. 8/98) Prescribed by ANSI Std. Z39.18
Form Approved OMB No. 0704-0188
The public reporting burden for this collection of information is estimated to average 1 hour per response, including the time for reviewing instructions, searching existing data sources, gathering and maintaining the data needed, and completing and reviewing the collection of information. Send comments regarding this burden estimate or any other aspect of this collection of information, including suggestions for reducing the burden, to Department of Defense, Washington Headquarters Services, Directorate for Information Operations and Reports (0704-0188), 1215 Jefferson Davis Highway, Suite 1204, Arlington, VA 22202-4302. Respondents should be aware that notwithstanding any other provision of law, no person shall be subject to any penalty for failing to comply with a collection of information if it does not display a currently valid OMB control number. PLEASE DO NOT RETURN YOUR FORM TO THE ABOVE ADDRESS.
2. REPORT TYPE 3. DATES COVERED (From - To)
4. TITLE AND SUBTITLE 5a. CONTRACT NUMBER
5b. GRANT NUMBER
5c. PROGRAM ELEMENT NUMBER
5d. PROJECT NUMBER
5e. TASK NUMBER
5f. WORK UNIT NUMBER
6. AUTHOR(S)
7. PERFORMING ORGANIZATION NAME(S) AND ADDRESS(ES) 8. PERFORMING ORGANIZATIONREPORT NUMBER
10. SPONSOR/MONITOR'S ACRONYM(S)
11. SPONSOR/MONITOR'S REPORTNUMBER(S)
9. SPONSORING/MONITORING AGENCY NAME(S) AND ADDRESS(ES)
12. DISTRIBUTION/AVAILABILITY STATEMENT
13. SUPPLEMENTARY NOTES
14. ABSTRACT
15. SUBJECT TERMS
16. SECURITY CLASSIFICATION OF:a. REPORT b. ABSTRACT c. THIS PAGE
17. LIMITATION OFABSTRACT
18. NUMBEROFPAGES
19a. NAME OF RESPONSIBLE PERSON
19b. TELEPHONE NUMBER (Include area code)
1. REPORT DATE (DD-MM-YYYY)
07/08/2021 Technical Memorandum
Avionics Radiation Hardness Assurance (RHA) Guidelines
Hodson, Robert F.; Pellish, Jonathan A.; Austin, Rebekah A.; Campola, Michael J.; Ladbury, Raymond L.; LaBel, Kenneth A.; Allen, Gregory R.; Gaza, Razvan; Willis, Emily M.
NASA Langley Research Center Hampton, VA 23681-2199
National Aeronautics and Space Administration Washington, DC 20546-0001
860921.01.23.01.01
NASA
NASA/TM-20210018053
Unclassified - Unlimited Subject Category Space Transportation and Safety Availability: NASA STI Program (757) 864-9658
Based on the need to develop and adopt timely and up-to-date guidance to ensure that natural space radiation environment threats do not compromise mission success, the NASA Engineering and Safety Center (NESC) was solicited to develop and publish guidance for deriving radiation hardness assurance (RHA) requirements and for evaluating avionics hardware elements with respect to total ionizing dose, total non-ionizing dose, and single event effects. This document contains the outcome of the NESC assessment.
Ionizing Dose; NASA Engineering and Safety Center; Radiation Hardness Assurance; Guidelines
U U U UU 149
STI Help Desk (email: [email protected])
(443) 757-5802