aviation weather capability assessment · aviation weather capability . assessment . michael...
TRANSCRIPT

Aviation Weather Capability Assessment Michael Konyak, FAA ANG-C41 Mark Thuli, CSSI, Inc. Loretta DiDonato, CSSI, Inc. Rebecca Stanley, Hi-Tec Systems, Inc. April 2014 DOT/FAA/TC-TN14/9

[THIS PAGE IS INTENTIONALLY LEFT BLANK]
ii

NOTICE
This document is disseminated under the sponsorship of the U.S. Department of Transportation in the interest of information exchange. The United States Government assumes no liability for the contents or use thereof. The United States Government does not endorse products or manufacturers. Trade or manufacturer's names appear herein solely because they are considered essential to the objective of this report. This document does not constitute FAA certification policy.
iii

[THIS PAGE IS INTENTIONALLY LEFT BLANK]
iv

Technical Report Documentation Page 1. Report No. DOT/FAA/TC-TN14/9
2. Government Accession No. 3. Recipient’s Catalog No.
4. Title and Subtitle
Aviation Weather Capability Assessment
5. Report Date April 2014 6. Performing Organization Code ANG-C41
7. Author(s)
Michael Konyak, FAA ANG-C41; Mark Thuli, CSSI, Inc.; Loretta DiDonato, CSSI, Inc.; Rebecca Stanley, Hi-Tec Systems, Inc.
8. Performing Organization Report No.
9. Performing Organization Name and Address U. S. Department of Transportation Federal Aviation Administration, William J. Hughes Technical Center Atlantic City International Airport, NJ 08405
10. Work Unit No. (TRAIS) 11. Contract or Grant No.
12. Sponsoring Agency Name and Address U. S. Department of Transportation Federal Aviation Administration 800 Independence Avenue, SW Washington, DC 20591
13. Type of Report and Period Covered Technical Note 14. Sponsoring Agency Code ANG-C64
15. Supplementary Notes 16. Abstract The focus of this document is to summarize the relevant information on the key weather products used in the National Airspace System today that are within scope of the Federal Aviation Administration Concept Analysis Branch’s (ANG-C41) Weather Requirements Validation Methodology. The document identifies and describes these products and their context to air traffic management. It is a preliminary input to the development of simulation scenarios to evaluate the impact of these technologies in the NAS.
17. Key Words aviation weather aviation forecasting flight planning
18. Distribution Statement This report is approved for public release and is on file at the William J. Hughes Technical Center, Aviation Security Research and Development Library, Atlantic City International Airport, New Jersey 08405. This document is available to the public through the National Technical Information Service, Springfield, Virginia, 22161.
19. Security Classif. (of this report) Unclassified
20. Security Classif. (of this page) Unclassified
21. No. of Pages 37
22. Price
Form DOT F 1700.7 (8-72) Reproduction of completed page authorized
v

[THIS PAGE IS INTENTIONALLY LEFT BLANK]
vi

Executive Summary As part of the Federal Aviation Administration’s (FAA’s) transformation to NextGen, the FAA Aviation Weather Division, NextGen Operations and Planning Branch (ANG-C64) is developing performance requirements for weather products that detect and forecast the weather phenomena that impact the operations of the National Airspace System (NAS). ANG-C64 enlisted the services of the FAA Concepts Analysis Branch, ANG-C41, for validating the requirements, a critical step in requirements development. ANG-C41 has proposed using computer modeling and simulation to achieve this objective. ANG-C41 has established a methodology for the validation of these requirements. As detailed in this methodology, the validation of requirements via modeling and simulation requires the development of simulation scenarios. An important step in the development of simulation scenarios is an assessment of the current technical capabilities in detecting and forecasting the weather phenomena that impact air traffic management. This document serves as a report of the Capability Assessment portion of the Aviation Requirements Validation. This Capability Assessment provides a survey of the current technical capabilities in the detection and forecasting of weather phenomena that impact air traffic management. This survey will investigate the technologies used, the users that use them, and the scenarios under which they are used. The survey includes observation technologies such as satellite radar, Doppler radar, and airborne and surface in situ atmospheric measurements. It includes a description of the reports transmitted to pilots and flight operators that they use for flight planning and tactical decision making. It includes descriptions of the analysis tools used for forecasting and Air Traffic Management decision support. It also includes descriptions of the Air Traffic Management and operator groups involved in weather mitigation and planning strategies. ANG-C41 expects that the knowledge gained from this survey will aid the development of simulation scenarios in the pending tasks of the overall Aviation Weather Requirements Validation effort.
1

TABLE OF CONTENTS
LIST OF ACRONYMS AND ABBREVIATIONS .................................................................................. 3
1 INTRODUCTION ............................................................................................................................... 6
1.1 PURPOSE ........................................................................................................................................ 6 1.2 BACKGROUND ............................................................................................................................... 6 1.3 APPLICATIONS OF THIS CAPABILITY ASSESSMENT ...................................................................... 7
2 A SUMMARY OF CURRENT AVIATION WEATHER TECHNOLOGIES ............................. 7
2.1 OBSERVATIONS ............................................................................................................................. 8 2.1.1 Satellite Observations ........................................................................................................... 8 2.1.2 Surface Radar ....................................................................................................................... 8 2.1.3 Atmospheric Measurements .................................................................................................. 9
2.2 MODELS ...................................................................................................................................... 13 2.3 REPORTS ...................................................................................................................................... 15
2.3.1 METAR ................................................................................................................................ 15 2.3.2 SIGMET .............................................................................................................................. 15 2.3.3 Convective SIGMET ............................................................................................................ 15 2.3.4 AIRMET .............................................................................................................................. 16 2.3.5 SPECI .................................................................................................................................. 16 2.3.6 PIREP ................................................................................................................................. 16
2.4 AVIATION WEATHER FORECAST PRODUCTS .............................................................................. 17 2.4.1 TAF ..................................................................................................................................... 17 2.4.2 GTG ..................................................................................................................................... 17
2.5 TRAFFIC FLOW MANAGEMENT TOOLS ....................................................................................... 17 2.5.1 ITWS .................................................................................................................................... 18 2.5.2 CIWS ................................................................................................................................... 18 2.5.3 CCFP .................................................................................................................................. 19 2.5.4 RAPT ................................................................................................................................... 19 2.5.5 CCSD .................................................................................................................................. 20 2.5.6 WARP .................................................................................................................................. 21
2.6 COCKPIT WEATHER SYSTEMS ..................................................................................................... 21
3 USERS OF AVIATION WEATHER TECHNOLOGIES ............................................................ 22
3.1 ARTCC ....................................................................................................................................... 22 3.1.1 CWSU .................................................................................................................................. 22 3.1.2 FAA TMU ............................................................................................................................ 22 3.1.3 TMI ...................................................................................................................................... 23
3.2 TRACON .................................................................................................................................... 23 3.3 ATCT .......................................................................................................................................... 23 3.4 ATCSCC ..................................................................................................................................... 24 3.5 FLIGHT OPERATORS .................................................................................................................... 24 3.6 AIRCRAFT METEOROLOGICAL DATA RELAY – AMDAR ........................................................... 24
4 SUMMARY ....................................................................................................................................... 25
REFERENCES .......................................................................................................................................... 27
APPENDIX – TYPES OF TRAFFIC MANAGEMENT INITIATIVES (TMI) ................................. 30
2

LIST OF ACRONYMS AND ABBREVIATIONS
4-D Four Dimensional AAR Airport Acceptance Rate AIRMET Airmen's Meteorological Information AMDAR Aircraft Meteorological Data Relay ANG-C41 FAA Advanced Operational Concepts Division, Concept Development & Validation Branch ANG-C64 FAA Aviation Weather Division, NextGen Operations and Planning Branch ARTCC Air Route Traffic Control Center ARTS Automated Radar Terminal System ASOS Automated Surface Observing Systems ASR Airport Surveillance Radar ATC Air Traffic Control ATCSCC Air Traffic Control System Command Center ATCT Air Traffic Control Towers AWC Aviation Weather Center AWIPS NWS Weather Workstation C Celsius CARTS Common Automated Radar Terminal System CCFP Collaborative Convective Forecast Product CCSD Common Constraint Situation Display CIP Current Icing Potential CIWS CONUS Integrated Weather System cm Centimeter ConOps Concept of Operations CONUS Continental United States CoSPA Consolidated Storm Prediction for Aviation CWA Center Weather Advisory CWSU Center Weather Service Unit CWAM Convective Weather Avoidance Model DASR Digital Airport Surveillance Radar dBZ Decibels relative to Z DCS Derecho-producing Convective System DOC Department of Commerce DOD Department of Defense DOT Department of Transportation DSR Display System Replacement ECMRF European Center for Medium Range Weather Forecasting ETMS Enhanced Traffic Management System F Fahrenheit FAA Federal Aviation Administration FDIO Flight Data Input/Output
3
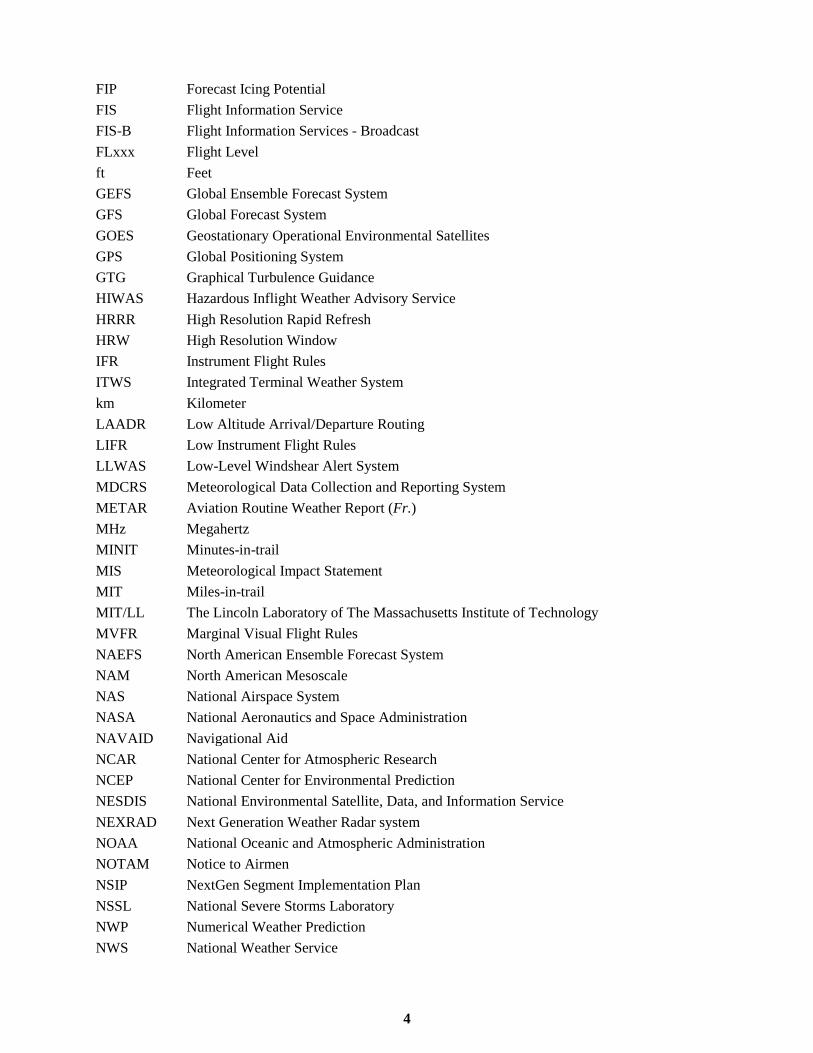
FIP Forecast Icing Potential FIS Flight Information Service FIS-B Flight Information Services - Broadcast FLxxx Flight Level ft Feet GEFS Global Ensemble Forecast System GFS Global Forecast System GOES Geostationary Operational Environmental Satellites GPS Global Positioning System GTG Graphical Turbulence Guidance HIWAS Hazardous Inflight Weather Advisory Service HRRR High Resolution Rapid Refresh HRW High Resolution Window IFR Instrument Flight Rules ITWS Integrated Terminal Weather System km Kilometer LAADR Low Altitude Arrival/Departure Routing LIFR Low Instrument Flight Rules LLWAS Low-Level Windshear Alert System MDCRS Meteorological Data Collection and Reporting System METAR Aviation Routine Weather Report (Fr.) MHz Megahertz MINIT Minutes-in-trail MIS Meteorological Impact Statement MIT Miles-in-trail MIT/LL The Lincoln Laboratory of The Massachusetts Institute of Technology MVFR Marginal Visual Flight Rules NAEFS North American Ensemble Forecast System NAM North American Mesoscale NAS National Airspace System NASA National Aeronautics and Space Administration NAVAID Navigational Aid NCAR National Center for Atmospheric Research NCEP National Center for Environmental Prediction NESDIS National Environmental Satellite, Data, and Information Service NEXRAD Next Generation Weather Radar system NOAA National Oceanic and Atmospheric Administration NOTAM Notice to Airmen NSIP NextGen Segment Implementation Plan NSSL National Severe Storms Laboratory NWP Numerical Weather Prediction NWS National Weather Service
4

PIREP Pilot Report POES Polar Operational Environmental Satellites RAP Rapid Update RAPT Route Availability Planning Tool RUC Rapid Update Cycle RVR Runway Visual Range SREF Short Range Ensemble Forecast SIGMET Significant Meteorological Information SPO Strategic Plan of Operations STARS Standard Terminal Automation Replacement System SWAT Severe Weather Warning Applications and Technology Transfer TAF The Aerodrome Forecast TAMDAR Tropospheric Airborne Meteorological Data Reporting TDWR Terminal Doppler Weather Radar TFMS Traffic Flow Management System TMC Traffic Management Coordinator TMI Traffic Management Initiatives TMU Traffic Management Unit TRACON Terminal Radar Approach Control Facility U.S. United States (of America) UCAR University Corporation for Atmospheric Research UHF Ultra High Frequency UTC Coordinated Universal Time VFR Visual Flight Rules VHF Very High Frequency WAF Weather Avoidance Field WARP Weather and Radar Processor WMO World Meteorological Organization WSP Weather System Processor WRF Weather Research and Forecast WVSS Water Vapor Sensing System WW3 Wave Watch 3
5

1 INTRODUCTION As part of the Federal Aviation Administration’s (FAA’s) transformation to NextGen, the FAA Aviation Weather Division, NextGen Operations and Planning Branch (ANG-C64) is developing performance requirements for weather products that detect and forecast the weather phenomena that impact National Airspace System (NAS) operations. ANG-C64 enlisted the services of the FAA Concepts Analysis Branch, ANG-C41, for validating the requirements (via modeling and simulation), a critical step in requirements development. ANG-C41 has established a methodology for the validation of these requirements. The complete process for this requirements validation task is detailed in Weather Requirements Validation Methodology (Konyak, 2013). As detailed in this methodology, the validation of requirements via modeling and simulation requires the development of simulation scenarios. An important step in the development of simulation scenarios is an assessment of the current technical capabilities in detecting and forecasting the weather phenomena that impact air traffic management.
1.1 PURPOSE This document serves as a report of the Capability Assessment portion of the Aviation Requirements Validation. The reader is referred to Konyak (2013) for a complete description of the methodology for the validation. This Capability Assessment provides a survey of the current technical capabilities in the detection and forecasting of weather phenomena that impact air traffic management. This survey will investigate the technologies used, the users that use them, and the scenarios under which they are used. Advisory Circular 00-45G (FAA, 2010) provides a comprehensive explanation of the aviation weather products and services in the United States. It details the interpretation and application of the various advisories and reports that service the NAS and its users. The much older Advisory Circular 00-6A (FAA, 1975) provides the general background on weather theory and its application to the aviation community. The focus of this document is to summarize the relevant information on the key weather products used in the NAS today that are within scope of the Weather Requirements Validation Methodology (Konyak, 2013). The capability assessment shall identify and describe these products and their context to air traffic management as a preliminary input to develop simulation scenarios to evaluate the impact of these technologies in the NAS.
1.2 BACKGROUND The requirements developed by ANG-C64 are set forth in the NextGen Midterm Operation Capability Performance Criteria (FAA, in press) and are based on the NextGen Segment Implementation Plan (NSIP) 5.0 (FAA, 2013) and the The National Airspace System Concept of Operations, Compilation of Strategic Planning References (FAA, 2012b). In the interest of limiting the scope of this task, ANG-C64 has established that the focus for this task is on five weather elements that are critical to air traffic management: convection, ceiling, visibility, wind shift, and freezing/frozen precipitation (FAA, in press). These weather elements impact air traffic management by causing reroutes, altitude changes, delays, cancellations, and runway and airport reassignments. The impacts of some of the weather elements on NAS operations in the terminal environment are assessed in the Aviation Weather Division’s Core 30 Impact Assessment (FAA/ANG-C64, 2013). Other impacts in the terminal and en route environments are assessed in Flathers, Fronzak, Huberdeau, & McKnight (2013), Fronzak & McKnight (2013), and Kee & Wang (2013). Flathers, et al. and Fronzak & McKnight also identify some shortfalls of current aviation weather technologies in the interest of gaining a better understanding of the needs of aviation weather technologies for the future.
6

1.3 APPLICATIONS OF THIS CAPABILITY ASSESSMENT ANG-C41 will use the information from this capability assessment in developing simulation scenarios that will be used to validate the weather requirements. While the weather detection and forecasting technologies of the future may involve different users and use cases, an understanding of the current users and use cases is important in the development of these simulation scenarios. A simulation scenario is defined in this study as a model of a real event or sequence of events in the NAS that is scoped so that it can be adequately reproduced in a computer simulation environment. This usually imposes constraints in time, spatial environment, and simulation objects (such as weather objects, aircraft, users, etc.). The overall goal of the validation methodology in Konyak (2013) is to validate the aviation weather requirements using computer simulation. To build accurate computer simulations to achieve this goal, the scenarios are defined to clearly illustrate the sequence of events and user interactions involved in utilizing the aviation weather detection and forecasting technologies.
2 A SUMMARY OF CURRENT AVIATION WEATHER TECHNOLOGIES Aviation weather forecasting products use data from Doppler radar, satellite radar, and atmospheric measurements from airborne and surface observation stations. Atmospheric data consist of pressure, temperature, humidity, dew point, and winds. Surface observation stations can also report visibility, cloud cover, and ceiling. These data are fed into graphics display tools, alerting tools, and forecasting tools, which, in turn, supply the needed data to aviation weather experts that make strategic decisions in air traffic management. The conceptual illustration below demonstrates the relationships between observation, processing, and planning technologies and Air Traffic Control (ATC). In the interest of simplicity, the diagram was not intended to capture all relationships.
7

2.1 OBSERVATIONS The following subsections shall present the various technologies utilized today to capture the weather observations.
2.1.1 Satellite Observations Operating the country's system of environmental satellites is one of the major responsibilities of the National Oceanic and Atmospheric Administration's (NOAA's) National Environmental Satellite, Data, and Information Service (NESDIS). NESDIS operates the satellites and manages the processing and distribution of the millions of bits of data and images these satellites produce daily. The primary customer is NOAA's National Weather Service (NWS), which uses this satellite data to create forecasts for the public, television, radio, weather advisory services, and, most importantly for the purposes of this paper’s assessment, the Aviation Weather Center (AWC). NOAA's operational weather satellite system is composed of two types of satellites: geostationary operational environmental satellites (GOES) for short-range warning and "now-casting" and polar-orbiting satellites for longer-term forecasting. Both types of satellite are necessary for providing a complete global weather monitoring system. A new series of GOES and polar-orbiting satellites has been developed for NOAA by the National Aeronautics and Space Administration (NASA). The new GOES-R series provides higher spatial and temporal resolution images and full-time operational soundings (vertical temperature and moisture profiles of the atmosphere). The newest polar-orbiting meteorological satellites, the National Polar Operational Environmental Satellites (POES), will provide improved atmospheric temperature and moisture data in all weather situations. This new technology will help provide the NWS with the most advanced weather forecast system in the world (NOAA, 2014b).
2.1.2 Surface Radar The FAA uses a network of radar systems that provide useful weather information. This sub-section will discuss some of the systems that use radar systems for aviation weather applications. NEXRAD The Next Generation Weather Radar (NEXRAD) system comprises over 150 WSR-88D Doppler Weather Radars throughout the United States and select overseas locations. This system is a joint effort of the United States Departments of Commerce (DOC), Defense (DOD), and Transportation (DOT). The controlling agencies are the FAA, the NWS, and Air Force Weather Agency. The radars are designed specifically to detect precipitation and the speed of movement out to about 124 nm from the radar site. Data is provided at approximately four to six minute intervals. Ice and Saxion (2012) have predicted that data and signal processing improvements can keep the WSR-88D delivering useful data throughout the NextGen midterm. The implication is that these improvements will result in improved report and forecast quality that will meet midterm requirements for the accuracy of convective and precipitation reports and forecasts. As a consequence, modeling of current Doppler radar capabilities (with requisite improvements in accuracy) in this project’s simulation scenarios will be suitable to capture midterm capabilities for the pending aviation weather requirements validation simulations. TDWR The Terminal Doppler Weather Radar (TDWR) is a high quality, dedicated meteorological surveillance radar deployed near many of the larger airports in the U.S. The FAA installed TDWRs near the largest airports that were vulnerable to wind shear conditions (thunderstorms, frontal passages, etc.). The range resolution of the TDWR is finer than what is available in the WSR-88D. The angular (azimuth) resolution of the TDWR is nearly twice what is available in the WSR- 88D (FAA Order 1812.9 - NOAA, 2014a).
8

As of 2011, all were in-service with 45 operational radars, some covering multiple airports in major metropolitan locations, across the United States & Puerto Rico. Funded by the FAA, TDWR was developed in the early 1990s at MIT Lincoln Laboratory to assist terminal air traffic controllers by providing real-time wind shear detection and high-resolution precipitation data. The primary advantage of TDWR over previous weather radars is that it has a finer range resolution—meaning it can see smaller areas of the atmosphere. Weber, Cho, Robinson, & Evans (2007) conducted a study on alternatives to TDWR and recommended that the FAA seek to increase the already high operational benefit provided by this radar by continuing to improve its availability, the quality of its precipitation and wind measurements and the end-user services to which it contributes. They enumerated a number of significant terminal-area capability enhancements to which TDWR would contribute substantially. The National Severe Storms Laboratory (NSSL) has a program of development and improvement of radar products extracted from data obtained from TDWR and NEXRAD radars. The Severe Weather Warning Applications and Technology Transfer group is sponsored by the NWS and the FAA. It is working on better filtering of non-weather echoes, better de-aliasing algorithms of velocities, and techniques to extract the horizontal component of the wind field from one or multiple radars. NSSL has been providing TDWR data to NWS office since the late 1990s. The pending simulation scenario development activities of this task can capture these projected TDWR improvements simply by assuming increased accuracy of the observations. ASR Airport Surveillance Radar (ASR-11) is an integrated primary and secondary radar system that has been deployed at terminal air traffic control sites. It interfaces with both legacy and digital automation systems and provides six-level national weather service calibrated weather capability that provides enhanced situational awareness for both controllers and pilots. ASR data is displayed on the Automated Radar Terminal System (ARTS), Common Automated Radar Terminal System (CARTS), and Standard Terminal Automation Replacement System (STARS) display consoles in control towers and Terminal Radar Approach Control (TRACON) rooms. CARTS is planned to be replaced with STARS at all TRACONs. The primary surveillance radar uses a continually rotating antenna mounted on a tower. The system can measure the distance of an aircraft from the radar antenna and the azimuth, or direction, of the aircraft in relation to the antenna. The primary radar also provides data on six levels of rainfall intensity. The secondary radar uses a second radar antenna attached to the top of the primary radar antenna to transmit and receive area aircraft data for barometric altitude, identification code, and emergency conditions. Military, commercial and some general aviation aircraft have transponders that automatically respond to a signal from the secondary radar by reporting an identification code and altitude. The air traffic controller uses this system to verify the location of aircraft within a 60-mile radius of the radar site. The beacon radar also provides rapid identification of aircraft in distress. For further information the reader is referred to the FAA ASR web site at http://www.faa.gov/air_traffic/technology/asr-11/.
2.1.3 Atmospheric Measurements While there are many commercial and private organizations that make atmospheric measurements, whether from an airborne or surface observation station, only those that are used in federally funded tools are mentioned here. Airborne Observations - Radiosonde Advisory Circular 00-45G (FAA, 2010) and NOAA’s web pages (NWS, 2014) provide information on the NWS weather balloons. The NWS releases weather balloons into the atmosphere to obtain upper air
9

weather information twice a day at nearly 900 stations around the world. Under the helium or hydrogen-filled balloon a radiosonde dangles on a string broadcasting continuous weather data back to the launch site. The radiosonde is a small, expendable instrument package that is suspended below a six-foot-wide balloon filled with hydrogen or helium. As the radiosonde rises at about 1,000 ft/minute sensors on the radiosonde measure profiles of pressure, temperature, and relative humidity. Through international agreements, data are exchanged between countries. The radiosonde consists of a radio transmitter, GPS, temperature sensor (called a thermistor), humidity sensor (called a hygristor), and pressure sensor. The winds aloft are computed from the measured elevations and location of the radiosonde at a given pressure. The height of the balloon is also calculated. So, from this simple instrument, the complete temperature, moisture, wind and pressure field in the vicinity of the launch station can be obtained during its two hour journey to nearly 100,000 ft up into the atmosphere and drift more than 125 miles (200 km) from the release point. During the flight, the radiosonde is exposed to temperatures as cold as -130°F (-92°C) and an air pressure only few thousandths of what is found on the earth's surface. Many of the forecasting and reporting tools covered in this report use radiosonde observations as input. Radiosonde data are used over a broad spectrum of efforts including the following, which in themselves provide data for simulations in five weather elements which are the subject of this assessment:
● Input for mesoscale1 models and computer-based weather prediction models, ● Local severe storm, aviation, and marine forecasts, ● Weather and climate change research, ● Input for air pollution research, and ● Ground truth for satellite data
Airborne Observations - MDCRS ARINC's Meteorological Data Collection and Reporting System (MDCRS) is designed to support improved weather forecasting, particularly for upper-air wind and severe weather. First developed for the FAA and the NWS in 1991, the system collects and organizes over 450,000 real-time, automated position and weather reports per day from a fleet of over 3000 aircraft from 38 partner airlines. Observations are down-linked from the aircraft to MDCRS. This data is then properly formatted and transmitted to the NWS for use in weather modeling and forecasting as well as to the respective airline to assist with operations. MDCRS is the U.S. Government contribution to the World Meteorological Organization’s (WMO) Aircraft Meteorological Data Relay (AMDAR) program for the collection of meteorological observations from participating airlines by the NWS. (ARINC, 2014; Martin, Wolfson, & Hallowell, 1993). Daniels, Moninger, & Mamrosh (2006) performed a study on improvements to mesoscale modeling (eg, RUC, NAM) that would result from an increase in upper atmosphere measurements from programs like MDCRS. They concluded that increased measurements and improved data reliability will improve mesoscale modeling, addressing the midterm needs of the NAS. The pending simulation scenario development for this project can capture these improvements in mesoscale modeling by assuming an increase in accuracy. Daniels, et al. further provided an overview of a modification of the ARINC MDCRS to include icing and turbulence called the Tropospheric Airborne Meteorological Data Reporting (TAMDAR) project.
1 Mesoscale meteorology is the study of weather systems smaller than synoptic scale systems but larger than microscale systems. Horizontal dimensions generally range from around 5 kilometers to several hundred kilometers.
10

Although NOAA has not adopted this project, the improvements are still being sought for future research with the following needs addressed: These suggestions are made with the goal of improving the system’s features to address aviation weather needs in the National Aerospace System. Specific research endeavors include:
• Development and implementation of an algorithm to prevent data loss during de-icing. • Development and evaluation of new or improved mesoscale models that feature reduced grid
spacing and cycle time and use of metadata. • Development and evaluation of uplinked weather products for both tactical and strategic flight
deck display. This would entail flight deck display studies, human factors research on pilot utilization, resolution of data display issues, and collaborative weather decision making studies.
• Development and evaluation of new and/or updated aviation weather products derived from mesoscale upper-air data such as TAMDAR. The FAA Aviation Weather Research Program develops new weather products, some of which could benefit from the inclusion of mesoscale upper-air data.
• Development of Flight Service Station user requirements and evaluation of enhanced displays for collaborative decision-making; also, the evaluation of electronic Pilot Reports (PIREPs) disseminated to flight service stations and weather briefers.
Mesoscale reports of in-situ water vapor (see WVSS-II below) will significantly improve weather model forecasts and forecast products generated at local offices. Future observation systems must incorporate effective controls or mechanisms to manage and limit the collection of data within specified temporal and spatial requirements. These needs necessarily fall into categories based on end-user requirements. In particular, numerical weather prediction model requirements for meteorological accuracy are more stringent than those of the NWS local forecasters. The concept of “good enough” as a criterion for observation acceptance should be considered. Ultimately, measurement accuracy versus cost will be a key driver in this decision.
Airborne Observations - WVSS-II According to Helms et al. (2005), through a partnership with the FAA, University Corporation for Atmospheric Research (UCAR), United Parcel Service, and SpectraSensors, NOAA has developed a water vapor sensor that can fly along with the packages and passengers of many of the nation's commercial air carriers. The Water Vapor Sensing System (WVSS II) sensor consists of a diode laser that samples the air and reports environmental humidity to meteorologists every six seconds. WVSS will provide the first operational, climate quality, water vapor sensor information available routinely in between the 12 hour intervals when NOAA launches its radiosonde weather balloons. This weather sensor development activity is part of NOAA's contribution to the Global Earth Observation System of Systems. The UCAR designed and patented external Air Sampler is mounted on the outer skin of the aircraft to continuously collect air through a low profile, low drag inlet port. The WVSS-II Air Sampler is specifically designed to minimize the impact externally mounted components may have on flight operations. The Air Sampler has proven to be effective in collecting a representative air sample for the measurement of atmospheric water vapor. Adjustments are made for the effects of changing air pressures and temperatures. Surface Observations - ASOS The Automated Surface Observing Systems (ASOS) program is a joint effort of the NWS, the FAA, and the DOD. The ASOS program serves as the nation's primary surface weather observing network. ASOS is designed to support weather forecast activities and aviation operations and, at the same time, support the needs of the meteorological, hydrological, and climatological research communities.
11

With the largest and most modern complement of weather sensors, ASOS has significantly expanded the information available to forecasters and the aviation community. The ASOS network has more than doubled the number of full-time surface weather observing locations. ASOS works non-stop, updating observations every minute, 24 hours a day, every day of the year. Getting more information on the atmosphere, more frequently and from more locations is the key to improving forecasts and warnings. Thus, ASOS information helps the NWS increase the accuracy and timeliness of its forecasts and warnings--the overriding goal of the NWS modernization. The primary concern of the aviation community is safety and weather conditions often threaten that safety. A basic strength of ASOS is that critical aviation weather parameters are measured where they are needed most: airport runway touchdown zone(s). ASOS detects significant changes, disseminating hourly and special observations via the networks. Additionally, ASOS routinely and automatically provides computer-generated voice observations directly to aircraft in the vicinity of airports, using FAA ground-to-air radio. These messages are also available via a telephone dial-in port. ASOS observes, formats, archives and transmits observations automatically. ASOS transmits a special report when conditions exceed preselected weather element thresholds, e.g., the visibility decreases to less than 3 miles.
● Sky condition: cloud height and amount (clear, scattered, broken, overcast) up to 12,000 ft, ● Visibility (to at least 10 statute miles), ● Basic present weather information: type and intensity for rain, snow, and freezing rain, ● Obstructions to vision: fog, haze, ● Pressure: sea-level pressure, altimeter setting, ● Ambient temperature, dew point temperature, ● Wind: direction, speed and character (gusts, squalls), ● Precipitation accumulation, and ● Selected significant remarks including- variable cloud height, variable visibility, precipitation
beginning/ending times, rapid pressure changes, pressure change tendency, wind shift, peak wind. However, like all technology, there are limitations as to what the equipment can do. The main limitation is its ability to see around the horizon. Its eyes see only directly overhead. Should there be a storm front moving in with darkening conditions, ASOS will not detect it until the storm begins to move over the sensors. Likewise, ASOS cannot see patchy fog that is not located directly at the station location. Therefore, weather around the airport that has not encountered the sensors will not be measured. The system is not designed to report clouds above 12,000 ft, virga, tornadoes, funnel clouds, ice crystals, snow pellets, ice pellets, drizzle, freezing drizzle, blowing obstructions such as snow, dust, or sand, snow fall and snow depth. Many of these elements will be provided by other sources. New sensors are being added to measure some of these weather elements. As a result, many of the ASOS stations, with staffed air traffic control towers, are monitored and human observers can edit or augment the automated observations (NWS, 2014b). Surface Observations – RVR In the United States, the Runway Visual Range (RVR) value is determined by instruments located alongside and approximately 14 ft higher than the centerline of the runway, based on standard calibrations. This represents the horizontal distance a pilot can expect to see down the runway, based on sighting either the High Intensity Runway Lights or the visual contrast of other targets, whichever yields the greater visual range. RVR, in contrast to prevailing or runway visibility, is based on what a pilot in a moving aircraft should see looking down the runway. RVR is horizontal visual range, not slant visual range.
12
Currently, there are still transmissometer-type RVR systems in use at many airports. These systems utilize an incandescent lamp projector and receiver that provide RVR readings as low as 600 ft, and report in 200-foot increments from 600 RVR to 3,000 RVR. Transmissometer RVR systems are no longer being installed in the United States. However, the relevant standard installation drawings contain information concerning longitudinal and lateral projector and receiver locations. Newer RVR systems using scatter-effect technology are replacing older transmissometer systems. The new systems have low maintenance costs, eliminate the use of steel and concrete structures on the airport surface, and provide RVR readings as low as 0 ft. The new systems utilize an infrared projector and receiver and report data in 100-foot increments below 800 ft, in 200-foot increments between 800 ft and 3,000 ft, and in 500-foot increments between 3,000 ft and 6,500 ft (Order 6560.10C - FAA 2011b). LLWAS The Low-Level Windshear Alert System (LLWAS) measures wind speed and direction at remote sensor station sites situated around the airport terminal. Currently, each airport may have as few as 6 or as many as 32 remote stations. The remote sensor data received is transmitted to a master station, which generates warnings when windshear or microburst conditions are detected. Current wind data and warnings are displayed for approach controllers in the TRACON and for ground controllers in the Air Traffic Control Tower. Air Traffic Controllers relay the LLWAS runway specific alerts to pilots via voice radio communication. LLWAS alerts assist pilots during critical times when they must determine whether to attempt to land or take off in hazardous weather conditions. Wind Profilers Wind profilers are Doppler radars that most often operate in the VHF or UHF frequency bands. Data from wind profilers are used in AWC reports and forecasts. There are three primary types of radar wind profilers in operation in the U.S. today. The NOAA Profiler Network profiler operates at a frequency of 404 MHz. A second type of profiler, used by NOAA and outside agencies, is the 915-MHz boundary-layer profiler. The 404-MHz profilers are more expensive to build and operate, but they provide the deepest coverage of the atmosphere. The 915-MHz profilers are smaller and cheaper to build and operate, but they lack height coverage much above the boundary layer. A third type of profiler that operates at 449 MHz (the so-called 1/4-scale 449-MHz profilers) combines the best sampling attributes of the other two systems. Wind profilers transmit pulses of electromagnetic radiation vertically and in at least two slightly off-vertical directions in order to resolve the three-dimensional vector wind. A small amount of the energy transmitted in each direction is reflected or backscattered to the radar. The backscatter returns are Doppler shifted by the motion of the scattering media. Profilers receive backscatter returns from atmospheric features (turbulence, clouds, precipitation) and non-atmospheric features (insects, birds, trees, airplanes, radio frequency interference). The challenge in signal processing is to avoid the returns from non-atmospheric scattering targets and focus on the atmospheric returns. Signal processing algorithms identify multiple peaks and use pattern recognition to determine which peaks are most likely to be the result of atmospheric returns.
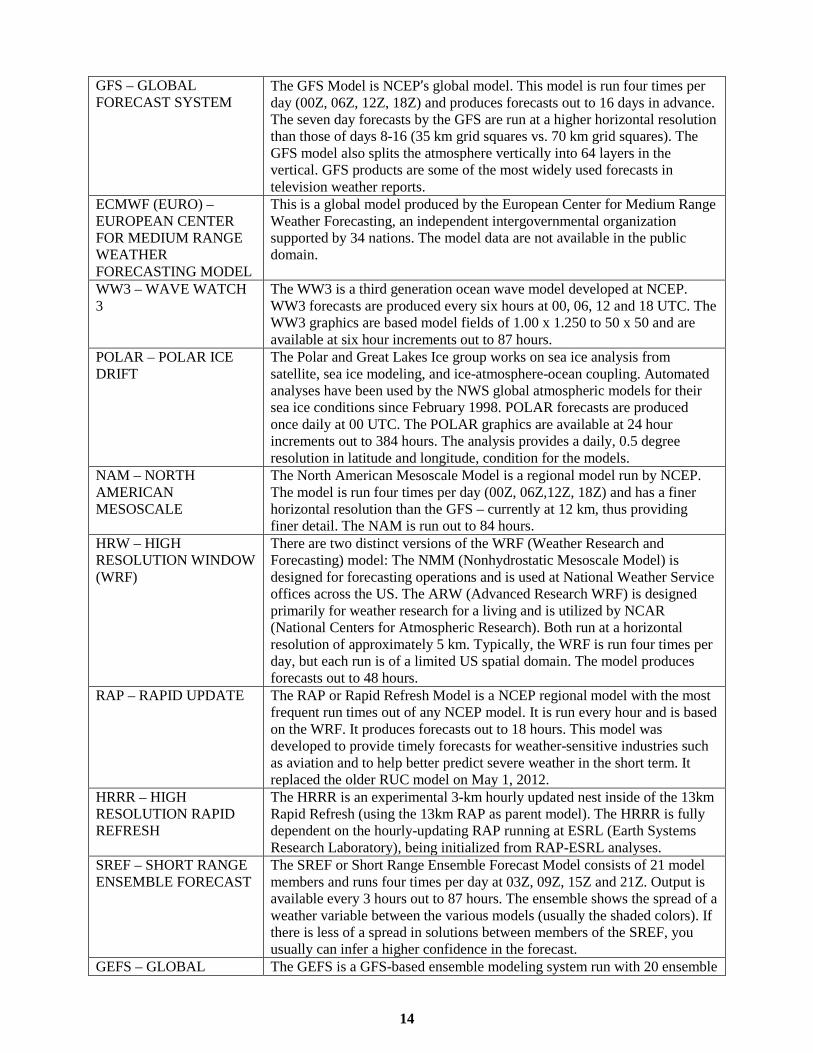
2.2 MODELS The table below is a compendium of weather models used in the US, including all models of the National Center for Environmental Prediction (NCEP). Most serve as inputs to the forecasting tools described in this report and virtually all use the data of the observation products described in Section 2.1 Observations. The information in the table is compiled from The Weathergeek Guide (Hurricane Baby, 2011).
13
GFS – GLOBAL FORECAST SYSTEM
The GFS Model is NCEP’s global model. This model is run four times per day (00Z, 06Z, 12Z, 18Z) and produces forecasts out to 16 days in advance. The seven day forecasts by the GFS are run at a higher horizontal resolution than those of days 8-16 (35 km grid squares vs. 70 km grid squares). The GFS model also splits the atmosphere vertically into 64 layers in the vertical. GFS products are some of the most widely used forecasts in television weather reports.
ECMWF (EURO) – EUROPEAN CENTER FOR MEDIUM RANGE WEATHER FORECASTING MODEL
This is a global model produced by the European Center for Medium Range Weather Forecasting, an independent intergovernmental organization supported by 34 nations. The model data are not available in the public domain.
WW3 – WAVE WATCH 3
The WW3 is a third generation ocean wave model developed at NCEP. WW3 forecasts are produced every six hours at 00, 06, 12 and 18 UTC. The WW3 graphics are based model fields of 1.00 x 1.250 to 50 x 50 and are available at six hour increments out to 87 hours.
POLAR – POLAR ICE DRIFT
The Polar and Great Lakes Ice group works on sea ice analysis from satellite, sea ice modeling, and ice-atmosphere-ocean coupling. Automated analyses have been used by the NWS global atmospheric models for their sea ice conditions since February 1998. POLAR forecasts are produced once daily at 00 UTC. The POLAR graphics are available at 24 hour increments out to 384 hours. The analysis provides a daily, 0.5 degree resolution in latitude and longitude, condition for the models.
NAM – NORTH AMERICAN MESOSCALE
The North American Mesoscale Model is a regional model run by NCEP. The model is run four times per day (00Z, 06Z,12Z, 18Z) and has a finer horizontal resolution than the GFS – currently at 12 km, thus providing finer detail. The NAM is run out to 84 hours.
HRW – HIGH RESOLUTION WINDOW (WRF)
There are two distinct versions of the WRF (Weather Research and Forecasting) model: The NMM (Nonhydrostatic Mesoscale Model) is designed for forecasting operations and is used at National Weather Service offices across the US. The ARW (Advanced Research WRF) is designed primarily for weather research for a living and is utilized by NCAR (National Centers for Atmospheric Research). Both run at a horizontal resolution of approximately 5 km. Typically, the WRF is run four times per day, but each run is of a limited US spatial domain. The model produces forecasts out to 48 hours.
RAP – RAPID UPDATE The RAP or Rapid Refresh Model is a NCEP regional model with the most frequent run times out of any NCEP model. It is run every hour and is based on the WRF. It produces forecasts out to 18 hours. This model was developed to provide timely forecasts for weather-sensitive industries such as aviation and to help better predict severe weather in the short term. It replaced the older RUC model on May 1, 2012.
HRRR – HIGH RESOLUTION RAPID REFRESH
The HRRR is an experimental 3-km hourly updated nest inside of the 13km Rapid Refresh (using the 13km RAP as parent model). The HRRR is fully dependent on the hourly-updating RAP running at ESRL (Earth Systems Research Laboratory), being initialized from RAP-ESRL analyses.
SREF – SHORT RANGE ENSEMBLE FORECAST
The SREF or Short Range Ensemble Forecast Model consists of 21 model members and runs four times per day at 03Z, 09Z, 15Z and 21Z. Output is available every 3 hours out to 87 hours. The ensemble shows the spread of a weather variable between the various models (usually the shaded colors). If there is less of a spread in solutions between members of the SREF, you usually can infer a higher confidence in the forecast.
GEFS – GLOBAL The GEFS is a GFS-based ensemble modeling system run with 20 ensemble
14

ENSEMBLE FORECAST SYSTEM
members per cycle plus one control at T126. GEFS forecasts are produced up to 28 levels every six hours at 00Z, 06Z, 12Z, and 18Z. All runs are shown out to 384 hrs at 6-hour intervals. Data is interpolated to 1°x1° resolution from 0 to 384 forecast hours.
NAEFS – NORTH AMERICAN ENSEMBLE FORECAST SYSTEM
The NAEFS is a global weather modeling system run jointly by the Meteorological Service of Canada (MSC) and the U.S. National Weather Service (NWS) to provide numerical weather prediction probabilistic products to weather forecasters in both countries (and around the world) for a forecast period that runs out 16 days. The NAEFS combines the Canadian global forecast model ensemble and the NWS GEFS. NAEFS forecasts are produced every six hours at 00, 06, 12 and 18 UTC.
2.3 REPORTS The reports described in this sub-section provide the NAS operators with textual and graphical weather information to aid in their operational decisions.
2.3.1 METAR Information on the METAR is available from the Aeronautical Information Manual (FAA, 2013a). The METAR is the Aviation Routine Weather Report. It is now the standard international format for periodic (typically one hour or less) aviation weather reports. METARs consist of weather observations for the identified site including winds, visibility with runway visual range where available, barometric pressure, current weather conditions, air temperature, dew point temperature, cloud heights and extent of their coverage and remarks. The ASOS is the primary weather sensor for METARs at many airports. METARs are broadcast as part of the Hazardous Inflight Weather Advisory Service (HIWAS), the Flight Information Services - Broadcast (FIS-B), and are available online with the Aviation Digital Data Service at http://www.aviationweather.gov/adds. A Graphical METAR is a visualization applied to the cloud coverage and visibility values contained in the METAR/ SPECI data. The product provides an overall view of areas where low cloud ceilings and/or reduced visibility exist. Two rectangles atop each other depict the ceiling height (if any is present) with the visibility underneath. Colors are used to depict Visual Flight Rules (VFR), Marginal Visual Flight Rules (MVFR), Instrument Flight Rules (IFR) or Low Instrument Flight Rules (LIFR) conditions.
2.3.2 SIGMET Information on the SIGMET is available from the Aeronautical Information Manual (FAA, 2013a). SIGMETs (SIGnificant METeorological Information) are advisories issued by the AWC of meteorological conditions, other than convective activity, which is potentially hazardous to all aircraft. SIGMETs are issued when one of the following situations is expected to occur within two hours over a widespread area: • Severe icing, • Severe or extreme turbulence, • Dust storms and sand storms lowering visibilities to less than three miles, and • Volcanic ash SIGMETs are broadcast as part of the HIWAS and the FIS-B, and are available online with the Aviation Digital Data Service at http://www.aviationweather.gov/adds.
2.3.3 Convective SIGMET Information on the Convective SIGMET is available from the Aeronautical Information Manual (FAA, 2013a). Convective SIGMETs are issued in the conterminous U.S. for any of the following:
● Severe thunderstorm due to:
15

● surface winds greater than or equal to 50 knots ● hail at the surface greater than or equal to 3/4 inches in diameter ● tornadoes
● Embedded thunderstorms ● Line of thunderstorms ● Thunderstorms greater than or equal to VIP2 level 4 affecting 40% or more of an area at least
3000 square miles Any Convective SIGMET implies severe or greater turbulence, severe icing, and low level wind shear. A Convective SIGMET may be issued for any convective situation that the forecaster feels is hazardous to all categories of aircraft. Warning areas or lines appear in red, outlooks appear as light green polygons. (FAA 2013a). Convective SIGMETs are broadcast as part of the HIWAS and the FIS-B, and are available online with the Aviation Digital Data Service at http://www.aviationweather.gov/adds.
2.3.4 AIRMET Information on the AIRMET is available from the Aeronautical Information Manual (FAA, 2013a). AIRMETs are advisories of significant weather phenomena but describe conditions at intensities lower than those that require the issuance of SIGMETs. AIRMETs are intended for dissemination to all pilots in the preflight and en route phase of flight to enhance safety. AIRMET information is issued on a scheduled basis every 6 hours. Unscheduled updates and corrections are issued as necessary. AIRMETs contain details about IFR, extensive mountain obscuration, turbulence, strong surface winds, icing, and freezing levels. AIRMETs are broadcast as part of the HIWAS and the FIS-B, and are available online with the Aviation Digital Data Service at http://www.aviationweather.gov/adds.
2.3.5 SPECI A SPECI is a METAR that is issued off schedule due to changing conditions. Information on the SPECI is available from the Aeronautical Information Manual (FAA, 2013a). A SPECI is an Aviation Selected Special Weather Report and is, essentially, a supplemental METAR, issued as needed to update a previous METAR due to significant and/or rapid changes in conditions at the observation site. An ASOS special report is a SPECI. SPECIs are broadcast as part of the HIWAS and the FIS-B, and are available online with the Aviation Digital Data Service at http://www.aviationweather.gov/adds.
2.3.6 PIREP Information on the Pilot Reports (PIREPs) is available from the Aeronautical Information Manual (FAA, 2013a). These are reports of prevailing conditions experienced by pilots while airborne including icing, turbulence, winds, cloud structure, etc. They include the time of the report, location using nearby airports or NAVAIDs for reference, aircraft type, altitudes, and conditions experienced by the pilot or flight crew. When displaying PIREPS, urgent reports (if present) are highlighted in yellow on the 'REPORTS AVAILABLE IN AREA' line. FAA air traffic facilities solicit PIREPs when the following conditions are reported or forecast: ceilings at or below 5,000 ft; visibility at or below 5 miles (surface or aloft); thunderstorms and related phenomena; icing of light degree or greater; turbulence of moderate degree or greater; wind shear and reported or forecast volcanic ash clouds. Pilots are urged to cooperate and promptly volunteer reports of these conditions and other atmospheric data such as: cloud bases, tops and layers; flight visibility; precipitation; visibility restrictions such as haze, smoke and dust; wind at altitude; and temperature aloft. PIREPs are broadcast as part of the HIWAS and the FIS-B, and are available online with the Aviation Digital Data Service at http://www.aviationweather.gov/adds.
2 Video Integrator and Processor, which contours radar reflectivity (in dBZ) into six VIP levels.
16
2.4 AVIATION WEATHER FORECAST PRODUCTS These subsections describe basic aviation weather forecasting products. For information on weather modeling, refer to section 2.2 Models. For information on weather analysis products, refer to section 2.5 Traffic Flow Management Tools.
2.4.1 TAF The Aerodrome Forecast (TAF) is the standard aviation forecast issued for a specific site. The forecast is typically valid for 24 hours, but they could be valid for as little as six hours or as much as 30 hours (in certain locations). The terminology used is very similar to that of METARs. This is the primary forecasting tool for local meteorological conditions, most notably, ceiling and visibility. For further information, the reader is referred to the Aeronautical Information Manual (FAA, 2013a). Allan, DeLaura, Martin, Clark, & Gross (2004) performed an analysis of the potential for improvements in the TAF. They recommended the processing and packaging of existing ceiling and visibility forecasts to better serve the air traffic management decision-making process. There is opportunity for improvement in the delivery of this information, both in terms of presentation and timeliness. Air traffic managers rely on this information to be conveyed via conference or briefing with meteorological staff or aviation weather services. The timeliness in receiving amended information during rapidly changing conditions is hindered by both the latency in generating the amendment, as well as the additional time required to deliver the information to the end users. These issues may be allayed by automatic generation, delivery, and update of a graphical ceiling and visibility product based on the existing text-based forecast (Allan et al.). The pending development of simulation scenarios for requirements validation can capture projected improvements in TAF latency in the NextGen midterm time frame with the simple assumption that latency is improved.
2.4.2 GTG The Graphical Turbulence Guidance (GTG) is an automatically-generated turbulence product that predicts the location and intensity of turbulence over the continental United States. The GTG was developed by the NCAR Turbulence Product Development Team, sponsored by the FAA's Aviation Weather Research Program, and implemented by the NWS AWC as a supplement to turbulence AIRMETs and SIGMETs. It uses some of the latest atmospheric prediction models from NCEP to produce an upper-level clear air turbulence prediction. A turbulence diagnostic is computed from numerical weather prediction output at the assimilation time. The algorithm then maps each of the diagnostics to a common turbulence intensity scale. The diagnostic values are then compared to other available observations (PIREPs) within a time window around the assimilation time and above some altitude cutoff (20,000 ft). The skill scores are then combined with the weights to get the GTG forecast. The weights are then subsequently used to produce the 3, 6, 9, & 12 hour GTG forecasts. (NOAA, 2014c) While forecasting of clear air turbulence is a developing improvement for strategic and tactical trajectory routing, it is not expected to be part of the pending simulation scenarios for weather requirements validation. The Current Icing Potential / Forecast Icing Potential (CIP/FIP) product models are both operational. The reader is referred to the NOAA website: http://www.aviationweather.gov/adds/icing/icing_nav.php.
2.5 TRAFFIC FLOW MANAGEMENT TOOLS These subsections describe aviation weather planning tools used in the NAS today to aid Traffic Flow Management.
17
2.5.1 ITWS The Integrated Terminal Weather System (ITWS) provides automated weather information for use by air traffic controllers, supervisors, pilots, and airline dispatch in airport terminal airspace. It provides products that require no meteorological interpretation to air traffic controllers, air traffic management systems, pilots, and airlines. ITWS provides a comprehensive current weather situation and highly accurate forecasts of expected weather conditions for 30 minutes in the future. The ITWS achieves this through integration of data and information from FAA and NWS sensors such as the TDWR, NEXRAD, airport surveillance radar, LLWAS, automated weather and surface observing systems, lightning detection systems, NWS weather models and MDCRS. Automated weather products produced by the ITWS for ATC include wind shear and microburst detection and predictions, storm cell intensity and direction, lightning information and detailed data of the winds in the terminal area. The graphic and textual display of these products provides an easy-to-use interface that does not need meteorological interpretation. Weber, Cho, Robinson, & Evans (2007) recommended that the terminal weather processing architecture currently represented by ITWS be modernized to allow for insertion of new sensor data, efficient implementation of new algorithms, and easy interface to Traffic Flow Management decision support tools. This will facilitate improvements to terminal area decision-making needed in the NextGen midterm time frame.
2.5.2 CIWS The CONUS Integrated Weather System (CIWS) is an automated weather analysis and forecasting system designed to support the development and execution of convective weather impact mitigation plans for congested en route airspace. The CIWS combines data from all NEXRAD radars in the contiguous US as well as bordering Canadian radar with satellite data, surface observations, and numerical weather models. It provides precipitation information as well as echo tops. A federal effort to reduce duplication and streamline research efforts has stimulated a need to combine the best capabilities from the weather community into one cohesive system. The Consolidated Storm Prediction for Aviation (CoSPA) is a collaborative effort between government, universities and private organizations whose aim is to integrate and evaluate existing prototype products such as CIWS, ITWS, CCFP, Convective SIGMETS, and other forecast products. Pinto, Dupree, Weygandt, Wolfson, Benjamin & Steiner (2010) conducted studies on the Consolidated Storm Prediction for Aviation (CoSPA) and found that a research prototype version of CoSPA builds upon a blending of heuristic extrapolation (e.g., tracking and trending) and initiation forecasts with high-resolution numerical weather prediction forecasts that show promising skill at predicting aviation-specific weather information. Such studies demonstrate promise in improvement of convective forecasts. This leads the authors to believe that convective forecasts in the NextGen midterm can realize projected improvements. The pending development of simulation scenarios for requirements validation will draw from sources like Pinto (2010) for a better understanding of improved convective forecast accuracy. From DeLaura, Lin, Jordan, Venuti, Evans (2011), addressing forecast deficiencies will significantly improve the ability of forecasts (e.g., CoSPA) to provide decision support for congestion resolution in convective weather. They also found that the operational environment associated with NAS Northeast traffic management in convective weather is virtually impossible to simulate in the laboratory, at least at the time of their study. This portends difficulty for the pending simulation and scenario development of this requirements validation effort; but, it certainly would benefit the validation team to study the recent simulations of convective events in an operational environment to gain from their experiences.
18

2.5.3 CCFP Using several different types of weather sensing equipment (satellite and Doppler radar and airborne and surface observations), the AWC, in collaboration with Meteorological Service of Canada, Center Weather Service Units, and meteorological offices of airlines and service providers, produce a weather forecasting tool called Collaborative Convective Forecast Product (CCFP). Information on the CCFP comes from Advisory Circular 00-45G, Change 1 (FAA, 2010). The CCFP is a graphical representation of expected convective occurrence at 4-, 6-, and 8-hours after issuance time. Convection for the purposes of the CCFP forecast is defined as a polygon of at least 3000 square miles that contains:
● A coverage of at least 25% with echoes of at least 40 dBZ composite reflectivity; and ● A coverage of at least 25% with echo tops of FL250, or greater; and ● A forecaster confidence of at least 25%.
The purpose of the CCFP is to aid in the reduction of air traffic delays, reroutes, and cancellations influenced by significant convective events. From a user’s perspective the CCFP is designed to be used for strategic planning of air traffic flow management during the en route phase of flight. It is not intended to be used for traffic flow control in the airport terminal environment, nor for tactical traffic flow decisions. From a producer’s perspective, the CCFP itself is designed to address two major purposes:
● An accurate representation of the convection of most significance for strategic decisions of air traffic flow management, and
● A common forecast baseline, as consistent as possible, shared among all meteorological organizations responsible for providing forecasts of convection to the air traffic managers within the FAA and/or within commercial aviation organizations.
The CCFP is a convective weather forecast product for collaboratively developing a Strategic Plan of Operations (SPO). The SPO is finalized during the collaborative teleconference hosted by the Strategic Planning Team of the FAA Traffic Management Units and conducted approximately every 2 hours immediately following the issuance of the CCFP. Once the final product is produced, each CCFP is posted on the Traffic Situation Display, Common Constraint Situation Display (CCSD) and AWC’s website. The accuracy, precision and consistency of each forecast are verified by the NOAA Forecast Systems Laboratory. Weather forecast verification for NWS products is completed after the forecast products are issued and disseminated to users. For both routine and warning products issued from operational forecasters at national centers and weather forecast offices, verification techniques comparing observed conditions to the forecast conditions are applied to obtain the verification results. In other words, the forecast is compared, or verified, against a corresponding observation of what actually occurred, or some good estimate of the true outcome. The verification can be qualitative ("Does it look right?") or quantitative ("How accurate was it?"). In either case it should give information about the nature of the forecast errors. The CCFP is produced seasonally, March 1st through October of each year.
2.5.4 RAPT The Route Availability Planning Tool (RAPT) is an automated decision support tool intended to determine which departure routes will be affected by operationally significant convective weather up to 90 minutes into the future (a 30 minute planning window plus 60 minutes flight time). It helps air traffic managers and airlines improve airport departure rates and alleviate long departure queues during convective weather. RAPT provides a timeline that shows the departure route status as a function of departure time. The route status is derived from three inputs: convective weather forecast from CIWS, an echo top forecast calculated from the CIWS echo tops field, and 4-D flight trajectories for jets on each
19

departure route. The most common reported benefit of RAPT is opening a route early, or averting a route stoppage. Airlines have been using it to brief pilots, who have taxied out, on the status of their filed routes and what can be expected within the following hour. (Allan, 2004). RAPT is used by Air Traffic Managers (Traffic Management Coordinators, Supervisory TMCs (STMCs), and Area Supervisors) only and is not provided to controllers. RAPT uses the Convective Weather Avoidance Model (CWAM) developed by MIT/LL and NASA to determine the probability of deviation along each of the flight routes given the weather along the route. This output, referred to as a Weather Avoidance Field (WAF), is a translated weather forecast that could be ingested by many decision support tools. As a result, the WAF and similar translated forecasts will be critical weather elements in the NEXTGEN mid-term and far-term requirements. RAPT has demonstrated its traffic management benefits in Chicago and New York installations. DeLaura, Klingle-Wilson, Robinson, Ferris, Underhill, & Rodriguez (2011) provided recommendations for site adaptation and procedure management that could lead to further improvements. And DeLaura, Lin, et al. (2011) studied an integration of CoSPA and RAPT, recommending the alternative, “arrival RAPT.” For the purposes of this compilation survey, since RAPT is a planning tool, there is little that it can do to address requirements for weather element accuracy. Subsequent studies (DeLaura, Robinson, and Underhill, 2009) identified benefits such as reopening closed departure routes efficiently after weather impacts had cleared, and resulted in a more focused concept of operations and slight changes in the RAPT route blockage algorithms, display and training. Those changes led to a tripling of benefits due to RAPT use in 2009 (DeLaura, Lin, et al., 2011).
2.5.5 CCSD According to the CCSD User Manual (Volpe, 2007), the Common Constraint Situation Display (CCSD) facilitates collaborative decision making between airlines, aviation business and the FAA. CCSD allows these stakeholders to view a graphical display of information that they can use to monitor the state of the NAS and to manage their operations. The CCSD is a web-based tool that can be accessed over the internet. The CCSD displays the following types of dynamic data.
● It shows the Enhanced Traffic Management System (ETMS) predictions of air traffic demand for the next fifteen hours and highlights the particular airports, sectors, and fixes where excess demand is forecast.
● It shows selected weather information such as the current intensity of precipitation. ● It shows flow-constrained areas, which are volumes of airspace that are expected to be special
trouble spots, possibly because of severe weather. ● It shows the reroutes that have been issued by the Air Traffic Control System Command
Center (ATCSCC). ● It shows the CCFP, used by the FAA and NAS users for traffic flow management strategic
planning. In addition, to help the user interpret this data, the CCSD allows the user to display static data such as airports, NAVAIDs, fixes, and political boundaries. The data displayed on the CCSD comes from the ETMS, which is the main automation system that the FAA uses for traffic flow management. The data shown on the CCSD is exactly the same data that is seen by the FAA traffic flow managers that use ETMS, except that data on sensitive flights, lightning data, and aircraft icons are omitted. What is notable about the CCSD is that it provides access to this data in an inexpensive and easily supported way since a CCSD user only needs a browser and connectivity to the ATCSCC, which hosts the CCSD web server. The user does not need any special software that needs to be installed or maintained.
20

2.5.6 WARP The in-house Air Route Traffic Control Centers (ARTCC) weather processing software is called the Weather and Radar Processor (WARP). WARP ingests raw radar data from NEXRAD and creates base and composite reflectivity mosaics for use in ARTCCs by Traffic Management Coordinators (TMC) within the ARTCC Traffic Management Unit (TMU). WARP also provides the radar to the DSR. CWSU meteorologists use WARP as one of their primary briefing tools. The system also provides Briefing Terminals which are located in each of the ARTCC specialty areas. Specialty areas are how the ARTCC is divided up for their area of responsibility and each specialty is further sub-divided into sectors. Part of the daily routine for the CWSU meteorologist is to provide a "stand-up" briefing during the shift change for the supervisors of each specialty. The meteorologist prepares graphical briefing materials on the meteorologist workstation portion of the WARP. This graphical information outlining local or regional aviation weather hazards are also broadcast throughout the facility to each specialty's Briefing Terminal. It is also important to note the specialty can tailor the products received on their Briefing Terminal in order to ensure they are getting detailed satellite, lightning, PIREPS and radar information as well as the graphical forecast products from the CWSU. Briefing Terminals may also display AIRMETs, SIGMETs, Severe Weather Watches and Warnings as well as Center Weather Advisories (CWA).
2.6 COCKPIT WEATHER SYSTEMS Aircraft typically have systems that measure ambient conditions (pressure, temperature, humidity) and remote phenomena (precipitation, lightning). Additionally, weather services exist that communicate local weather observations and forecasts to on-board display systems. These systems assist the flight crew with strategic and tactical routing. Higdon (2008) conducted a useful survey of cockpit weather tools. Onboard Doppler radar and radio atmospheric displays allow a more current view of local precipitation, storm clouds, and lightning. Many aircraft avionics products exist that detect radio atmospheric signals (commonly known as “spherics”) and display the locations of the sources in the cockpit. A radio atmospheric signal is a broadband electromagnetic impulse and is usually a result of atmospheric lightning discharges, indicating the presence of thunderstorms and turbulence. Additionally, data-link weather services exist that detect these signals and communicate their source locations to subscriber aircraft. The benefit over on-board systems is increased coverage and sensitivity; although there may be some latency in the reports. Onboard Doppler radar has limitations on how it portrays strong storms in close proximity to the antenna. Weather imagery delivered via data-link is constrained by the system of collection and processing needed to deliver the image to the cockpit. Data-linked weather radar images are always a few minutes old, reducing their viability for tactical use. Lightning-strike graphics from data-link systems suffer with time limitations similar to the weather radar images delivered by the same service via the same hardware. Still, data-link systems give pilots access to storm information unavailable from onboard radar. FIS For the Honeywell Data Link Weather Flight Information Service (FIS) system, individual site radar outputs and a graphic depicting current radar coverage are composed into a single national presentation called a mosaic (FAA, 2013a & FAA, 2010). The Honeywell FIS system currently provides the NEXRAD Base Reflectivity product from the family of NEXRAD radar products available. The Base Reflectivity product is derived from the initial scan of a NEXRAD radar site. Overlapping coverage exists to provide returns directly over the radar site. If
21

overlapping coverage is unavailable, weather directly over the site, or well above the elevation angle of the radar beam may not be shown. Fortunately, most of the U.S. east of the Rocky Mountains has highly redundant NEXRAD coverage (Crum, Alberty & Burgess, 1993; Kelleher, et al., 2007)). On board an aircraft, pilots can get weather radar from their cockpit systems (airborne radar) or from FIS-B (NEXRAD). Airborne radar range is typically much more limited than NEXRAD, since the power levels, antenna size, and receiver sensitivity are much less than ground-based systems. Additionally, the national NEXRAD mosaic provides strategic coverage of weather phenomena at any desired range along the aircraft route. Since the airborne radar update rate is nearly instantaneous, nearby weather depicted is likely to be much more accurate in terms of position. The FIS system has delays in delivery of NEXRAD product, from a few minutes to 15 or 20 minutes. This time delay may result in an inaccurate representation of nearby weather. The airborne radar will likely also provide a more accurate depiction of nearby weather in the vertical dimension, since the airborne antenna is aimed directly outward from the aircraft, as opposed to the upward looking antenna of the NEXRAD site. However, the airborne radar is often "fooled" by nearby heavy precipitation causing attenuation shadows. Ground-based radar can assist by providing another perspective to "fill in" those shadowed areas. It should be noted that the Honeywell FIS NEXRAD product only depicts precipitation levels similar to airborne radars. The precipitation shown may or may not correspond to the highest turbulence or other threats to the aircraft. The FIS NEXRAD should not under any circumstances be used for tactical avoidance of nearby convective activity.
3 USERS OF AVIATION WEATHER TECHNOLOGIES This section provides a description of the various operators or users of the various aviation weather technologies. Knowledge of the users’ roles, factors in decision making, and processes is important for the future computer simulation to validate the performance requirements discussed in Section 1.3.
3.1 ARTCC The ARTCC, or specifically, the ARTCC’s TMU relies on its Center Weather Service Unit (CWSU) to provide awareness of weather conditions and forecasts affecting the ARTCC service area.
3.1.1 CWSU The Center Weather Service Unit (CWSU) assists the FAA with strategic and tactical decision making, providing hazardous aviation weather advisories/forecasts and acting as liaison between the FAA and NWS operational community. CWSU uses multiple sources of data to create a forecast such as; NEXRAD, SIGMETs, AIRMETs, PIREPs, upper wind data, radiosonde data, MDCRS and TAMDAR data. They also use the WARP Meteorologist Workstation (aka, Briefing Terminals) and the NWS weather workstation (AWIPS), which contains a full complement of weather models, forecasts and observations. Blending this information with past experience and local knowledge (i.e. terrain, moisture, fronts, known radar obstructions), the CWSU meteorologists create an area specific forecast. CWSUs are responsible for issuing Center Weather Advisories (CWA) and Meteorological Impact Statements (MIS) in addition to the twice-daily briefings. These two impact briefings are held at each ARTCC. These briefings let the CWSU convey a variety of weather information, including the current ARTCC forecast to the TMU. This forecast is used to prepare the Center staff for any anticipated weather events that could impact air traffic safety and efficiency.
3.1.2 FAA TMU Unlike the tactical air traffic control conducted in towers, TRACON facilities, and ARTCCs, traffic management is a strategic function taking a longer term, larger area approach to maintaining an optimal flow of aircraft across the nation. FAA TMUs are located in all ARTCCs and in larger TRACONs and towers, where Traffic Management Coordinators monitor the airborne and planned flights, weather
22

patterns, and special use airspace to evaluate potential problems and implement solutions within their areas of responsibility. The mission of the traffic management system is to balance air traffic demand with system capacity to ensure the maximum efficient utilization of the NAS. At least twice daily, TMU will conduct briefings; CWSU will provide meteorological conditions (present and forecasted), Front Line Managers provide staffing information, TMU presents information provided by the primary airports such as; runways in use, Airport Acceptance Rate (AAR), and Traffic Management Initiatives (TMI) (present and anticipated). TMU will also provide facility equipment status information along with any anticipated impact.
3.1.3 TMI Traffic Management Initiatives (TMI)s are used to mitigate flow constraints as a result of all types of weather (ceiling and visibility, convective, winter storms and volume). These TMIs and the impact the forecasts have on the TMIs are the backbone of the NAS performance for weather. The more efficiently and effectively TMIs are used to mitigate weather impacts, the less delay we see in the system. Almost all strategic decision making in the NAS as related to weather, results in the implementation, modification, or removal of a TMI. The Appendix provides an overview of most TMIs. For further information, the reader is referred to FAA Order 7210.3X (FAA, 2012a). CWSU will communicate this at one of the daily briefings. The weather briefing will include the area of impact, time and duration of the event, and a confidence rank. With this information, TMU will assess the impact to the NAS and, if necessary, put a plan in place to balance the arriving and departing aircraft with the AAR. TMU will select one of the TMI based on the overall impact to the NAS. To maintain the integrity of the air traffic system, facility traffic management personnel must employ the least restrictive methods available to minimize delays and maintain system integrity Once all of the information has been evaluated and an operational plan is in place, it is then up to the air traffic controller to ensure that the traffic management initiatives and programs are enforced within their area of responsibility. However, TMIs do not have priority over maintaining separation of aircraft or maintaining procedural integrity of the sector. Alternatively, the system users may elect to reroute their own aircraft prior to reaching a weather event. Once a TMI has been established and coordinated with the ATCSCC coordination will be effected with all impacted parties. This may include facility management, ARTCCs, air traffic controllers, system users, and others.
3.2 TRACON TRACONs have a live radar feed of convective activity from TDWR and LLWAS systems as well as weather data from ASOS and ITWS. Forecasts, reports (eg, PIREPS) and weather planning and alerts come via the FDIO (Flight Data Input/Output) Terminal Server from the remote sites (i.e., the ARTCCs) so that they are aware of what to expect through the day.
3.3 ATCT While many Air Traffic Control Towers (ATCT) have limited weather resources, the busier ones have a live radar feed of convective activity and wind profiles and alerts, typically from ASR, TDWR, RVR, and LLWAS systems. Most also have live weather data from ASOS and ITWS. Forecasts, reports (eg, PIREPS) and weather planning and alerts come via the FDIO (Flight Data Input/Output) Terminal Server from the remote sites (i.e., the ARTCCs) and from public sources so that towers are aware of what to expect through the day. Ultimately, ATCT controllers use voice reports from pilots and their own senses to evaluate local weather conditions.
23

The authority to close a runway belongs to the airport operator, whether due to weather, or otherwise. In this case, the airport operator issues a Notice to Airmen (NOTAM), which advises aircraft of hazards to their flight plans. In response, the local ARTCC is likely to issue a TMI that affects other airports (likely a Ground Stop or Ground Delay Program) to help manage traffic in the region. In general though, the ATCT communicates runway status to the TRACONs and ARTCCs so that they are prepared to navigate aircraft approaches to the airport appropriately.
3.4 ATCSCC The ATCSCC is the Air Traffic Strategic Operations facility responsible for monitoring and managing the flow of air traffic throughout the NAS, producing a safe, orderly, and expeditious flow of traffic while minimizing delays. To effectively manage the flow of aircraft through the NAS, the ATCSCC maintains current knowledge of any weather event that may impact the NAS. The ATCSCC has no direct contact with aircraft. For example, thunderstorms commonly create a major disruption to the normal movement of air traffic and increase the workload in affected facilities. The ATCSCC has set aside a cadre of specialists to deal directly and independently with problems caused by severe weather. When the potential for severe weather exists, the ATCSCC severe weather specialists will implement procedures designed to optimize the use of the available airspace. Air Traffic facilities will be called upon to accept and favor traffic that is not normally routed through their area in order to balance traffic flows and minimize delays. All facilities are expected to participate and cooperate when called upon. The ATCSCC and all collaborating stakeholders use the same weather product (CIWS) when preparing a strategic plan. CIWS is only used in the 2 hour time frame to prepare the strategic plan (SPO). CCFP is the primary product for the 4, 6, and 8 hour timeframe. Each stakeholder may have their own interpretation of the weather presented; therefore, part of the collaborative process is to come to a consensus prior to implementing a strategic weather plan. The day following significant weather events, stakeholders review the forecast and strategic plan for lessons-learned.
3.5 FLIGHT OPERATORS Airline weather managers compare their own data with that of the NWS. They evaluate the potential for operational disruptions and meet with the dispatch to brief them on the conditions. They also collaborate with AWC, ARTCC CWSUs, and ATCSCC to help develop the best weather product that is safe, efficient, and economical. Pilots use the broadcast reports (METARs, SIGMETs, PIREPs, etc.), onboard weather information, controller input, and visual observations to make their strategic routing decisions. Airline flight plans, known in the industry as ‘canned flight plans’, are produced weeks in advance of the actual flight. Any weather related changes to the canned flight plan prior to the flight are generally coordinated through a collaborative effort including the ATCSCC, impacted ARTCC’s, and NAS users. When a preflight reroute has been established the appropriate ARTCC will coordinate with the respective Terminal facilities that issue the new route during verbal clearance delivery. The pilots will enter the new route into their Flight Management System prior to departure. Any enroute route changes are issued to the pilots with a clearance from ARTCC controllers.
3.6 AIRCRAFT METEOROLOGICAL DATA RELAY – AMDAR The global Aircraft Meteorological Data Relay (AMDAR) program was initiated by the WMO and its Members, in cooperation with aviation partners and has led to the development of the AMDAR observing system. The AMDAR observing system is a sub-system of the WMO Integrated Global Observing System and the Global Observing System, which is defined and maintained under the WMO World Weather Watch Program.
24

The AMDAR system utilizes predominantly existing aircraft onboard sensors, computers and communications systems to collect, process, format and transmit meteorological data to ground stations via satellite or radio links. Once on the ground, the data is relayed to National Meteorological and Hydrological Services, where it is processed, quality controlled and transmitted on the WMO Global Telecommunications System. The data collected is used for a range of meteorological applications, including, public weather forecasting, climate monitoring and prediction, early warning systems for weather hazards and, importantly, weather monitoring and prediction in support of the aviation industry.
4 SUMMARY The purpose of this study was to gain insight into the current technical capabilities in the area of aviation weather observations and forecasting towards developing simulation scenarios and a simulation capability to allow the verification of aviation weather requirements for the NextGen midterm. A summary of the current capabilities follows. Observations from satellite and surface remote observation systems (e.g., radar) and from airborne and surface in situ observation stations serve as inputs to aviation weather forecasting tools. Observations are compared to prior forecasts and historical trends. All serve as the input to the forecasting tools (eg, CCFP, CIWS, and AWC products - AIRMETs, SIGMETs, TAFs). It is the duty of the National Weather Service's Aviation Weather Center to issue the fundamental aviation weather advisories: METARs, SIGMETs, AIRMETs, etc. Pilots and flight operators use these reports for flight planning, but ultimately it is up to the ARTCCs and the ATCSCC to manage the flow of air traffic in their centers and throughout the NAS, so they are the final authority on how conditions and forecasts affect air traffic flow. Each ARTCC has their own Center Weather Service Unit that develops a forecast for the center based on the information provided by the Aviation Weather Center, CCFP, WARP, and CIWS, and each center's weather experts provide their own knowledge and expertise on the nuances of local weather patterns to develop the center forecast. (Note: these local expert interpretations will be the most difficult to capture in automated simulations for requirements validation.) METARs, SIGMETs, AIRMETs, and PIREPs from the Aviation Weather Center are used to update and verify the forecast. The forecast is provided to the ARTCC's Traffic Management Unit, who presides over a teleconference with impacted operators (eg, airlines) to negotiate TMIs and flow patterns for the center. ATCSCC steps in when the impact exceeds certain guidelines or when other centers are necessarily impacted as well.
At the terminal, observation and alerting tools (RVR, ASOS, TDWR, LLWAS, NEXRAD) keep the towers and TRACONs apprised of conditions so they can manage flow into and out of the airports. ITWS and RAPT are decision support tools to aid them. But the local ARTCC's TMU may have already issued a TMI that imposes restrictions on their operations. En route, the ARTCCs and TRACONs use traffic and weather displays (CCSD as well as graphic depictions on STARS and DST terminals) to manage tactical decisions. The TMU will have already made controllers aware of pending meteorological impacts. NEXRAD is the primary radar tool, providing a mosaic of WSR-88D images that keep en route controllers apprised of convective activity. In the cockpit, pilots must receive the AWC's products as part of their flight planning prior to take-off. Once airborne, on-board Doppler radar and spherics systems can provide the pilot with a view of local precipitation and storms. Many aircraft have data-linked systems and displays that inform pilots of SPECIs, NEXRAD's mosaic, compiled storm views, and current meteorological reports. Aircraft without
25

such equipment receive updates via the VOR transmission (HIWAS) or from radio communications from ASOS or directly from ATC and Flight Services. Any adjustments a pilot wishes to make due to weather updates must be cleared with ATC. These are the many tools that aid the air traffic controllers and flight operators with strategic and tactical handling of meteorological events. This compilation will allow us to proceed into simulation scenario development, with an eye towards improvements that might be realized or expected in the NextGen midterm time frame.
26

REFERENCES
Allan, S., DeLaura, R., Martin, B., Clark, D., and Gross, C. (2004). Advanced Terminal Weather Products Demonstration in New York, 11th Conference on Aviation, Range, and Aerospace Meteorology (ARAM). American Meteorological Society.
ARINC. (2014). Meteorological Data Collection and Reporting System. Retrieved from http://www.arinc.com/sectors/aviation/aircraft_operations/commercial_aviation/inflight_apps/deck/weather/mdcrs.html.
Cole, R.E. and Todd, R.F. A Comparative Performance Study of TDWR/LLWAS 3 Integration Algorithms for Wind Shear Detection. MIT Lincoln Laboratory. Retrieved from http://www.ll.mit.edu/mission/aviation/publications/publication-files/ms-papers/Cole_1996_WSAS_MS-12066_WW-18698.pdf.
Crum, T.D., Alberty, R.L., and Burgess, D.W. (1993). Recording, Archiving, and Using WSR-88D Data. Bulletin of the American Meteorological Society 74, 645.
Daniels, T.S., Moninger, W. R., and Mamrosh R. D. (2006). Tropospheric Airborne Meteorological Data Reporting (TAMDAR) Overview. 10th Symposium on Integrated Observing and Assimilation Systems for the Atmosphere, Oceans, and Land Surface (IOAS-AOLS). American Meteorological Society. Retrieved from http://ral.ucar.edu/projects/tamdar/references/IOASAOLS06_Daniels.htm.
DeLaura, R. A., Klingle-Wilson, D. L., Robinson, M., Ferris, R. F., Underhill, N. K., and Rodriguez, Y. G. (2011). Making Departure Management Weather Impact Models Airspace-Adaptable: Adapting the New York Route Availability Planning Tool (RAPT) to Chicago Departure Airspace. MIT/Lincoln Laboratory Document ATC-378. Retrieved from https://www.ll.mit.edu/mission/aviation/publications/publication-files/atc-reports/DeLaura_2011_ATC-378_WW-21658.pdf.
DeLaura, R. A., Lin, Y.H., Jordan, R. K., Venuti, J. C., Evans, J. E. (2011). Evaluation of Consolidated Storm Prediction for Aviation (CoSPA) 0–8 Hour Convective Weather Forecast Using the Airspace Flow Program Blockage-based Capacity Forecast ("The Matrix"). MIT/Lincoln Laboratory Document ATC-385. Retrieved from https://www.ll.mit.edu/mission/aviation/publications/publication-files/atc-reports/DeLaura_2001_ATC-385_WW-23618.pdf.
DeLaura, R. A., Robinson, M, Todd, R, MacKenzie, K. (2008). Evaluation Of Weather Impact Models in Departure Management Decision Support: Operation Performance of the Route Availability Plannig Tool (RAPT) Prototype. MIT/Lincoln Laboratory, Lexington, MA. Retrieved from http://www.ametsoc.org/AMS.
Evans, J. E. and Ducot, E. R. (2006). Corridor Integrated Weather System. MIT Lincoln Laboratory Journal Volume 16, Number 1, Retrieved from http://www.ll.mit.edu/publications/journal/pdf/vol16_no1/16_1_4EvansDucot.pdf.
FAA/ANG-C64. (2013). Evaluation of Air Traffic Impacts Associated with Terminal Weather at Core 30 Airports. Washington, DC: Federal Aviation Administration.
Federal Aviation Administration. (1987). Order 1812.9.System Requirements Statement for the Terminal Doppler Weather Radar System. Retrieved from http://www.faa.gov/documentLibrary/media/Order/1812.9.pdf.
Federal Aviation Administration. (2010). Advisory Circular 00-45G, Change 1. Aviation Weather Services. Retrieved from http://www.faa.gov/documentLibrary/media/Advisory_Circular/AC-0045G_chg1_fullDocument.pdf.
27

Federal Aviation Administration. (2011a). NextGen Mid-Term Concept of Operations for the National Airspace System (Version 2.2). (FAA Internal Document). Washington, DC
Federal Aviation Administration. (2011b). Order 6560.10C. Runway Visual Range (RVR). Retrieved from http://www.faa.gov/documentLibrary/media/Order/6560.10C.pdf.
Federal Aviation Administration. (2012a). Order 7210.3X. Facility Operation and Administration. Retrieved from http://www.faa.gov/documentLibrary/media/Order/FAC.pdf.
Federal Aviation Administration. (2012b). The National Airspace System Concept of Operations, Compilation of Strategic Planning References. (Version 0.1). FAA. Washington, DC
Federal Aviation Administration. (2013a). Aeronautical Information Manual Change 3. Retrieved from http://www.faa.gov/air_traffic/publications/atpubs/aim/index.htm.
Federal Aviation Administration. (2013b). National Airspace System Segment Implementation Plan. (Version 5.0). (FAA Internal Document).
Federal Aviation Administration. (in press). NextGen Midterm Operational Capability, Airspace Categories for Weather Support and Midterm Operational Capability Performance Criteria (Version 3.0). Washington, DC.
Flathers, B., Fronzak, M., Huberdeau, M., McKnight, C. (2013) Preliminary Non-validated Results – Operational Weather Requirements Analysis (OWRA) of NAS Segment Implementation Plan (NSIP) Version 5.0 Collaborative Air Traffic Management (CATM) Increments. The MITRE Corporation. Mclean, VA.
Fronzak, M., and McKnight, C. (2013). Preliminary Results – Operational Weather Needs Analysis of National Airspace System Segment Implementation Plan, Version 5.0, Non-Collaborative Air Traffic Management Increments. The MITRE Corporation. Mclean, VA.
Helms, D., Fellows, W., Roberts, T., Schrab, K., Toepfer, F., Ballish, B., Baker, R., Fleming, R. J., May, R.,Petersen, R. A., and Moninger, W. A. (2005). NOAA's Deployment of the Water Vapor Sensor System (WVSS II). National Oceanic and Atmospheric Administration. Retrieved from http://www.nws.noaa.gov/ost/wvss/AMS_NWP-WVSSII_Poster_JUL05.pdf.
Higdon, D. (2008). A Buyer’s Guide: Weather Detection and Avoidance. Pilot’s Guide to Avionics, 2008-2009. 36-42. Aircraft Electronics Association.
Hurricane Baby, LLC. (2011). Weathergeek’s Guide To Numerical Models version 2.3.
Ice, R. and Saxion, D. (2012). Enhancing the Foundational Data From the WSR-88D: Part II, The Future. 35th Conference on Radar Meteorology, American Meteorological Society.
Kee, J. and Wang, M. (2013). Validation of Performance Requirements for Weather Information, Propose Framework and Key Considerations. (MITRE deliverable for FAA Contract: DTFAWA-10-C-00080).
Kelleher, K., Droegemeir, K., Levit, J., Sinclar, C., Jahn, D., Hill, S. D., Mueller, L., Qualley, G., Crum, T. D., Smith, S. D., Del Greco, S. A., Lakshmivarahan, S., Miller, L., Ramamurthy, M., Domenico, B. and Fulker, D. (2007). PROJECT CRAFT - A Real-time Delivery System for NEXRAD Level II Data Via the Internet. Bulletin of the American Meteorology Society.
Konyak, M. (2013). Weather Requirements Validation Methodology (Document #: DOT/FAA/TC-TN#). Washington, DC: Federal Aviation Administration.
Martin, R.C., Wolfson, M.M., and Hallowell, R.G. (1993). MDCRS: Aircraft Observations Collections and Uses. MIT Lincoln Laboratory. Retrieved from http://www.ll.mit.edu/mission/aviation/publications/publication-files/ms-papers/Martin_1993_AWS_MS-10478_WW-18698.pdf.
28

McKinney, M., Fellner, W., Wolfson, M. M., and Evans, J. E. (2008). CIWS, CoSPA, and RAPT/Providing Benefits Now and Building Technology for the Next Generation, The Journal of Air Traffic Control, Volume 50, No. 4.
National Oceanic and Atmospheric Administration, (2014a). Terminal Doppler Weather Radar Information. National Oceanic and Atmospheric Administration. Retrieved from http://www.erh.noaa.gov/gsp/tdwr/info/specs.html.
National Oceanic and Atmospheric Administration. (2014b). NOAA Satellite and Information Service. Retrieved from http://www.nesdis.noaa.gov.
National Oceanic and Atmospheric Administration. (2014c). Graphical Turbulence Guidance (GTG) Help. Retrieved from http://aviationweather.gov/exp/gtg/info.php.
National Weather Service. (1998). Automated Surface Observing System (ASOS) User’s Guide. Retrieved from http://www.nws.noaa.gov/asos/pdfs/aum-toc.pdf.
National Weather Service. (2014a). NOAA National Weather Service Radiosonde Observations. Retrieved from http://www.ua.nws.noaa.gov/factsheet.htm.
National Weather Service. (2014b). NWS ASOS Program. Retrieved from http://www.nws.noaa.gov/asos/.
Pinto, J., Dupree, W., Weygandt, S., Wolfson, M., Benjamin, S., and Steiner, M. (2010). Advances in the Consolidated Storm Prediction for Aviation (CoSPA), 14th Conference on Aviation, Range, and Aerospace Meteorology (ARAM), American Meteorological Society.
Robinson, M., DeLaura, R. and Underhill N.(2009). The Route Availability Planning Tool (RAPT): Evaluation of Departure Management Decision Support in New York during the 2008 Convective Weather Season. 8th USA/Europe Air Traffic Management Research and Development Seminar (ATM2009). The ATM Seminar.
Volpe National Transportation Systems Center. (2007). Common Constraint Situation Display User Manual Version 8.4. U.S. Department of Transportation. Retrieved from http://cdm.fly.faa.gov/products/ccsd_docs/CCSD_RM_8.4.pdf.
Weber, M.E., Cho, J.Y., Robinson, M., and Evans, J.E. (2007). Analysis of Operational Alternatives to the Terminal Doppler Weather Radar (TDWR). MIT Lincoln Laboratory ATC-332. Retrieved from http://www.ll.mit.edu/mission/aviation/publications/publication-files/atc-reports/Weber_2007_ATC-332_WW-13779.pdf.
29

APPENDIX – TYPES OF TRAFFIC MANAGEMENT INITIATIVES (TMI) 1) Altitude.
a) Utilized to segregate different flows of traffic, or to distribute the number of aircraft requesting access to a specified geographic region.
b) Colloquialisms: i) Tunneling- Term to indicate traffic will be descended prior to the normal descent
point at the arrival airport to remain clear of an airspace situation; e.g., holding. ii) Capping- Term to indicate aircraft will be cleared to an altitude lower than their
requested altitude until they are clear of a particular airspace. Capping may apply to the initial segment of the flight or for the entire flight.
c) Low Altitude Arrival/Departure Routing (LAADR). A set of routings with altitude expectations for usage in times of severe weather constraints on the system. LAADR may apply to the departure or the arrival phase of flight. LAADR requires a written agreement with the customers prior to implementing.
2) Miles-in-trail (MIT). The number of miles required between aircraft that meet a specific criteria. The criteria may be separation, airport, fix, altitude, sector, or route specific. MIT are used to apportion traffic into manageable flows, as well as, provide space for additional traffic (merging or departing) to enter the flow of traffic.
3) Minutes-in-trail (MINIT). The number of minutes required between successive aircraft. It is normally used in a non-radar environment, when transitioning to a non-radar environment, or when additional spacing is required due to aircraft deviating around weather.
4) Fix balancing. Assigning an aircraft a fix other than in the filed flight plan in the arrival or departure phase of flight to equitably distribute demand.
5) Airborne holding. Planned holding of aircraft may be utilized. This is normally done when the operating environment supports holding and the weather conditions are expected to improve shortly; this ensures aircraft are available to fill the capacity at the airport.
6) Sequencing Programs. These programs are designed to achieve a specified interval between aircraft; they may be software generated or determined by Traffic Management personnel. Different types of programs accommodate different phases of flight. a) Departure Sequencing Program - Assigns a departure time to achieve a constant flow of
traffic over a common point. Normally, this involves departures from multiple airports. b) En route Sequencing Program - Assigns a departure time that will facilitate integration in
the en route stream. c) Arrival Sequencing Program - Assigns fix crossing times to aircraft destined to the same
airport. d) Center TRACON Automation System Traffic Management Advisor - Assigns meter
fix/arc crossing times to aircraft to manage airport arrival demand. 7) Reroutes:
a) 1. Reroutes are ATC routings other than the filed flight plan. They are issued to: i) Ensure aircraft operate with the flow of traffic. ii) Remain clear of special use airspace. iii) Avoid congested airspace. iv) Avoid areas of known weather or where aircraft are deviating or refusing to fly.
b) Operators should file new flight plans when they are more than 45 minutes from departure.
c) Sources for route information:
30

i) Airport/Facility Directory. ii) Preferential Route Information in facilities. iii) Route Management Tool. iv) North American Route Notice. v) Federal Air Regulations. vi) Notices to Airmen. vii) Advisories issued by ATCSCC. (These are listed on the Operational Information
System.) d) More information on routes is contained in Section 17, Coded Departure Routes, Section
18, Route Advisories, and Section 20, National Playbook. 8) Ground Delay Programs. (See FAAO 7210.2X, Chapter 17, Section 9, Ground Delay
Programs.) 9) Airspace Flow Programs. (See FAAO 7210.2X, Chapter 17, Section 10, Airspace Flow
Programs (AFP).) 10) Ground Stops. (See FAAO 7210.2X, Chapter 17, Section 11, Ground Stop(s).)
EXCEPTION: The above list is not all-inclusive and does not preclude the innovation and application of other procedures that will result in improved customer service. TMI’s are continually monitored and modified or cancelled as soon as safely possible in order to maintain the integrity and efficiency of the NAS. Note: The ATCSCC is the approval authority for all en route and designated terminals inter-facility TMIs, except TMIs within their area of jurisdiction (underlying terminals) that do not cause reportable delays and MIT restrictions of ten (10) miles or less.
31