aviation activity forecasts...aviation activity forecasts draft (8/ 9/2019) aspen pitkin county...
TRANSCRIPT
D R A F T T E C H N I C A L M E M O R A N D U M
AVIATION ACTIVITY FORECASTS Aspen/Pitkin County Airport
Prepared for
Pitkin County Aspen, Colorado
August 2019

Aviation Activity Forecasts Draft (8/9/2019) Aspen/Pitkin County Airport i
ASE
CONTENTS
Page
CHAPTER 1 INTRODUCTION AND SUMMARY ........................................................... 1
1.1 Forecast Approach ..................................................................... 1
1.2 Enplaned Passengers .................................................................. 1
1.3 Aircraft Operations ..................................................................... 2
1.4 Air Cargo ..................................................................................... 3
1.5 Airport Service Region ................................................................ 4
CHAPTER 2 ECONOMIC BASIS FOR AIRLINE TRAFFIC ................................................ 9
2.1 Comparison of Destination Markets .......................................... 9
2.2 Aspen Visitor Industry ................................................................ 12
2.2.1 Skier Visits ...................................................................... 12
2.2.2 Aspen Visitor Spending .................................................. 14
2.2.3 Aspen Region Recreation ............................................... 14
2.2.4 Lodging Infrastructure .................................................... 16
2.3 Historical and Forecast Economic Activity ................................. 19
2.3.1 Population ...................................................................... 19
2.3.2 Total Employment .......................................................... 19
2.3.3 Average Annual Wages .................................................. 19
2.3.4 Total Employment by Industry Sector ............................ 21
2.3.5 Annual Wages by Industry Sector .................................. 21
2.3.6 Regional Housing Market ............................................... 22
2.4 Economic Outlook ...................................................................... 23
2.4.1 U.S. Economy .................................................................. 24
2.4.2 Colorado Economy ......................................................... 24
2.4.3 Aspen/Pitkin County Economy ....................................... 24
CHAPTER 3 HISTORICAL PASSENGER AIRLINE TRAFFIC ............................................. 26
3.1 Airlines Serving Aspen ................................................................ 26
3.2 Historical Passenger Trends ....................................................... 27
3.3 Airline Shares of Enplaned Passengers ...................................... 29
3.4 Monthly Trends in Passengers ................................................... 30
3.5 Origin-Destination Markets and Airline Service ......................... 30
3.6 Airfares ....................................................................................... 32
CHAPTER 4 HISTORICAL AIRCRAFT OPERATIONS AND BASED AIRCRAFT ................. 33
4.1 Total Aircraft Operations ............................................................ 33
4.2 Based Aircraft ............................................................................. 33

Aviation Activity Forecasts Draft (8/9/2019) Aspen/Pitkin County Airport ii
ASE
CONTENTS (continued)
Page
CHAPTER 5 AVIATION ACTIVITY FORECASTS ............................................................. 35
5.1 Forecast Approach ..................................................................... 35
5.2 Enplaned Passengers .................................................................. 36
5.2.1 Economic Drivers ............................................................ 36
5.2.2 Cost of Travel Drivers ..................................................... 37
5.2.3 Resort Destination Drivers ............................................. 39
5.2.4 Representative Model .................................................... 39
5.2.5 Enplaned Passenger Forecast Assumptions ................... 40
5.2.6 Enplaned Passenger Forecasts ....................................... 41
5.3 Air Cargo ..................................................................................... 41
5.4 Based Aircraft ............................................................................. 45
5.5 Total Aircraft Operations Forecasts ........................................... 45
5.5.1 Passenger Airline Departures ......................................... 46
5.6 Aircraft Fleet Forecasts .............................................................. 47
CHAPTER 6 COMPARISON WITH THE FAA 2018 TAF ................................................ 58

Aviation Activity Forecasts Draft (8/9/2019) Aspen/Pitkin County Airport iii
ASE
TABLES
Page
1-1 Comparison of Commercial Passenger Airline Service at Aspen and Selected
Colorado Airports................................................................................................. 4
1-2 Potential Airport Service Region Population in 2017 .......................................... 8
2-1 Comparison of Ski Resort Metrics for Selected Destination Markets ................. 15
2-2 Historical and Projected Socioeconomic Data ..................................................... 20
2-3 Comparison of Average Annual Wages by Industry Sector ................................. 22
3-1 Historical Passenger Airline Activity .................................................................... 28
3-2 Domestic Passenger Origin-Destination Patterns and Airline Service ................ 31
4-1 Historical Aircraft Operations .............................................................................. 34
5-1 Aviation Activity Forecasts ................................................................................... 42
5-2 Forecasts of Aircraft Fleet Mix by Airplane Design Group .................................. 48
6-1 FAA TAF Forecast Comparison ............................................................................. 59
6-2 Summary of ASE Planning Forecasts Using FAA Template .................................. 60

Aviation Activity Forecasts Draft (8/9/2019) Aspen/Pitkin County Airport iv
ASE
FIGURES
Page
1-1 Forecasts of Enplaned Passengers ................................................................................. 2
1-2 Forecasts of Total Aircraft Operations........................................................................... 3
1-3 Airport Service Region ................................................................................................... 5
2-1 Estimated Skier Visits for Selected Destination Markets in 2018 ................................. 9
2-2 Enplaned Passengers for Selected Destination Markets in 2018 .................................. 10
2-3 Trends in Monthly Enplaned Passengers for Selected Destination Markets in 2018 ... 11
2-4 Average Daily Scheduled Passenger Airline Departures for Selected Destination
Markets in 2018 ............................................................................................................. 12
2-5 Aspen Skier Visits ........................................................................................................... 13
2-6 Lodging and Sales Tax Revenue ..................................................................................... 14
2-7 Traditional Lodging Trends ............................................................................................ 16
2-8 Rentals By Owner ........................................................................................................... 17
2-9 Historical Monthly Occupancy for Traditional Lodging ................................................. 18
2-10 Trends in Total Employment .......................................................................................... 21
2-11 Recent Housing Price Trends ......................................................................................... 23
3-1 Passenger Airlines Serving Aspen .................................................................................. 26
3-2 Historical Enplaned Passengers ..................................................................................... 27
3-3 Airline Shares of Enplaned Passengers .......................................................................... 29
3-4 Monthly Enplaned Passengers ....................................................................................... 30
3-5 Domestic Average Airfares ............................................................................................ 32
5-1 Forecast Approach ......................................................................................................... 35
5-2 Economic Drivers Historical and Predicted Enplaned Passengers ................................ 37
5-3 Cost of Travel Historical and Predicted Enplaned Passengers ...................................... 38
5-4 Resort Destination Drivers Historical and Predicted Enplaned Passengers .................. 39
5-5 Representative Model Historical and Predicted Enplaned Passengers ......................... 40
5-6 Forecasts of Enplaned Passengers ................................................................................. 45
5-7 Historical and Forecast Total Aircraft Operations ......................................................... 46
5-8 Forecasts of Passenger Airline Aircraft Operations ....................................................... 47

Aviation Activity Forecasts Draft (8/9/2019) Aspen Pitkin County Airport 1
ASE
CHAPTER 1
INTRODUCTION AND SUMMARY
This technical memorandum presents forecasts of aviation activity for Aspen/Pitkin County
Airport (the Airport or ASE). Forecasts are presented for enplaned passengers, air cargo, and
aircraft operations, including passenger, all-cargo, general aviation, and military operations,
and aircraft fleet mix. Using calendar year 2018 as the base year, annual forecasts are
prepared for five future demand years—2023, 2028, 2033, 2038, and 2048. In addition, an
estimate for 2019 is presented based on actual data for January through March 2019 and
advance airline schedules for April through December 2019. U.S. Department of
Transportation (USDOT) records were used as the basis for the enplaned passenger, air cargo,
and commercial airline aircraft operations forecasts. Federal Aviation Administration (FAA),
Air Traffic Activity System (ATADS) data were used as the basis for the total aircraft
operations forecasts.
The forecasts presented in this memorandum are “unconstrained” and, therefore, do
not include specific assumptions about physical, regulatory, environmental or
other impediments to aviation activity growth. The unconstrained forecasts are the
“preferred” forecasts recommended for Federal Aviation Administration (FAA) approval.
1.1 FORECAST APPROACH
The forecasts for the Airport were based on: (1) a review of previous forecasts prepared for
the Airport, including the FAA 2018 Terminal Area Forecasts (TAF) for the Airport; (2) the
collection and analysis of data related to economic and tourism trends in the Aspen region;
(3) input from the airlines currently serving the Airport on future airline schedules and fleet
mix, (4) a review of historical enplaned passengers and passenger airline operations at ASE
and other airports in the region; (4) the development of statistical models to identify
historical causal factors; and (5) coordination with representatives of the Airport and the
FAA.
1.2 ENPLANED PASSENGERS
Figure 1-1 presents historical and forecast enplaned passengers for 2000 through 2048,
compared with the FAA 2018 TAF for the Airport. The ASE enplaned passenger forecasts are
based on 2018 data and are within 15.9% of the FAA 2018 TAF in 2023 and 20.8% in 2028.*
The enplaned passenger forecast growth rate of 1.5% per year between 2018 and 2048 is
higher than the rate forecast by the FAA in its 2018 TAF for the Airport (an average of 0.8%
per year) from Federal Fiscal Year (FFY) 2018 to FFY 2045.** A detailed comparison of the ASE
enplaned passenger forecasts and the FAA 2018 TAF is presented in Chapter 6.
*U.S. Department of Transportation, Federal Aviation Administration, Forecasting Aviation Activity by Airport,
July 2001, and Review and Approval of Aviation Forecasts, June 2008, http://www.faa.gov.
**The Federal Fiscal Year begins on October 1 and ends on September 30.

Aviation Activity Forecasts Draft (8/9/2019) Aspen Pitkin County Airport 2
ASE
Figure 1-1
Forecasts of Enplaned Passengers
Aspen/Pitkin County Airport
CAGR = Compound average growth rate
Sources: Historical—U.S. Department of Transportation, T100 online database, accessed July 2019.
Forecast—LeighFisher, July 2019.
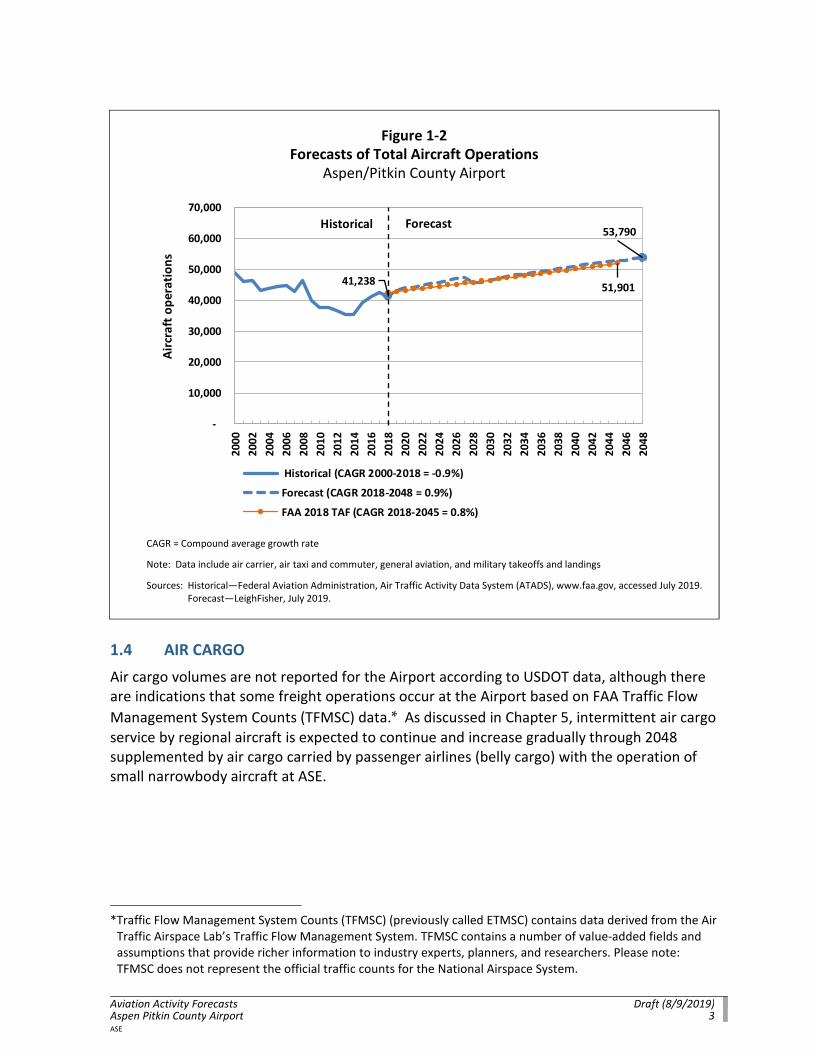
1.3 AIRCRAFT OPERATIONS
Figure 1-3 presents historical and forecast total aircraft operations for 2000 through 2048,
compared with the FAA 2018 TAF for the Airport. Total aircraft operations include air carrier,
air taxi and commuter, general aviation, and military takeoffs and landings. The aircraft
operations forecasts are based on 2018 data and are within 2.7% of the FAA 2018 TAF in
2023 and 0.1% in 2028. The forecast average growth rate in total aircraft operations of 0.9%
per year between 2018 and 2048 is slightly higher than the rate forecast by the FAA in its
2018 TAF for the Airport (an average of 0.8% per year) from FFY 2019 to FFY 2045. A detailed
comparison of the ASE aircraft operations forecasts and the FAA 2018 TAF is presented in
Section 6.
283,877
449,100
340,172
-
100,000
200,000
300,000
400,000
500,000
600,000
20
00
20
02
20
04
20
06
20
08
20
10
20
12
20
14
20
16
20
18
20
20
20
22
20
24
20
26
20
28
20
30
20
32
20
34
20
36
20
38
20
40
20
42
20
44
20
46
20
48
En
pla
ne
d p
ass
en
gers
Historical (CAGR 2000-2018 = 2.0%)
Forecast (CAGR 2018-2048 = 1.5%)
FAA 2018 TAF (CAGR 2018-2045 = 0.8%)
Historical Forecast
Aviation Activity Forecasts Draft (8/9/2019) Aspen Pitkin County Airport 3
ASE
Figure 1-2
Forecasts of Total Aircraft Operations
Aspen/Pitkin County Airport
CAGR = Compound average growth rate
Note: Data include air carrier, air taxi and commuter, general aviation, and military takeoffs and landings
Sources: Historical—Federal Aviation Administration, Air Traffic Activity Data System (ATADS), www.faa.gov, accessed July 2019.
Forecast—LeighFisher, July 2019.
1.4 AIR CARGO
Air cargo volumes are not reported for the Airport according to USDOT data, although there
are indications that some freight operations occur at the Airport based on FAA Traffic Flow
Management System Counts (TFMSC) data.* As discussed in Chapter 5, intermittent air cargo
service by regional aircraft is expected to continue and increase gradually through 2048
supplemented by air cargo carried by passenger airlines (belly cargo) with the operation of
small narrowbody aircraft at ASE.
*Traffic Flow Management System Counts (TFMSC) (previously called ETMSC) contains data derived from the Air
Traffic Airspace Lab’s Traffic Flow Management System. TFMSC contains a number of value-added fields and
assumptions that provide richer information to industry experts, planners, and researchers. Please note:
TFMSC does not represent the official traffic counts for the National Airspace System.
41,238
53,790
51,901
-
10,000
20,000
30,000
40,000
50,000
60,000
70,000
20
00
20
02
20
04
20
06
20
08
20
10
20
12
20
14
20
16
20
18
20
20
20
22
20
24
20
26
20
28
20
30
20
32
20
34
20
36
20
38
20
40
20
42
20
44
20
46
20
48
Air
cra
ft o
pe
rati
on
s
Historical (CAGR 2000-2018 = -0.9%)
Forecast (CAGR 2018-2048 = 0.9%)
FAA 2018 TAF (CAGR 2018-2045 = 0.8%)
Historical Forecast

Aviation Activity Forecasts Draft (8/9/2019) Aspen Pitkin County Airport 4
ASE
1.5 AIRPORT SERVICE REGION
As shown on Figure 1-3, Pitkin County is the primary area served by the Airport. According to
the U.S. Department of Commerce, Bureau of the Census, the population of Pitkin County
was 17,950 in 2018. Because economic growth and activity within this area stimulate a
significant portion of passenger demand at the Airport, statistics for Pitkin County were used
to evaluate certain long-term and future airline traffic trends at the Airport.
The secondary area served by the Airport, which includes parts of the counties surrounding
Pitkin County, is defined by the location of and driving distance to other commercial service
airports, as well as by the availability, price, and quality of airline service at those other
airports.
• Figure 1-3 presents 50- and 75-mile radii from ASE to illustrate the potential Airport
service region in terms of the location of and driving distance to other commercial
service airports.
• Table 1-1 presents a comparison of the commercial passenger airline service at
selected airports during the winter and summer seasons in terms of the frequency of
daily flights, the number of destinations served, and the average airfare paid.
Table 1-1
Comparison of Commercial Passenger Airline Service
at Aspen and Selected Colorado Airports
2018
2019 Average daily
nonstop departures
2019 Number of
destinations served
2018 Average one-way
domestic airfare paid
City/Airport
Enplaned
passengers
Winter
season
Summer
season
Winter
season
Summer
season
Winter
season
Summer
season (a)
Aspen 283,850 30 20 10 10 $292 $317
Denver 31,373,862 771 (b) 932 (b) 186 204 136 146
Colorado Springs 837,478 26 (b) 34 (b) 10 13 149 163
Grand Junction 221,945 12 (b) 14 (b) 5 8 227 228
Eagle 172,677 16 (b) 4 (b) 13 2 281 315
Montrose 133,762 11 (b) 10 10 5 250 278
Hayden 99,804 11 (b) 3 15 1 227 306
Gunnison 36,086 3 (b) 3 3 2 233 284
Note: Winter season = January through March
Summer season = July and August, except as noted
(a) Includes July, August, and September because the data are reported by quarter.
(b) Includes narrowbody aircraft service.
Sources: OAG Aviation Worldwide Ltd, online database, and U.S. Department of Transportation, Origin-Destination
Survey of Airline Passenger Traffic, Domestic, online database, accessed July 2019.

Aviation Activity Forecasts Draft (8/9/2019) Aspen/Pitkin Airport 5
ASE
Figure 1-3
Airport Service Region
Aspen/Pitkin County Airport

Aviation Activity Forecasts Draft (8/9/2019) Aspen/Pitkin County Airport 6
ASE
Of the eight Colorado airports shown in Table 1-1 and Figure 1-2, six (including ASE) are
commuter service airports characterized primarily by regional aircraft service to the
connecting hubs of major airlines. The location of these five other commuter service
airports, relative to ASE in terms of driving distance, is one of the factors that defines the
outer boundaries of ASE’s service region. Other factors that define the secondary area
include the number of average daily flights and the destinations served as well as the average
airfares at these five other airports, as shown in Table 1-1. The five other commuter service
airports include:
• Vail/Eagle County Airport (EGE), located approximately 65 road miles from the Airport,
is the closest commercial service airport. Although EGE has fewer average daily flights
than ASE, 11 of its 16 flights during the winter season are provided with narrowbody
aircraft with a greater number of seats than the regional aircraft serving ASE. EGE’s
passenger airline service is considerably reduced during the summer season, with
average one-way airfares higher in summer than in winter. Similar to ASE, all
commercial airline service at EGE is provided to the connecting hub airports of major
U.S. airlines.
• Grand Junction Regional Airport (GJT), 124 road miles from the Airport, is the next
closest commercial service airport. During the winter season, GJT provides an average
of 12 daily flights with regional jet aircraft to 5 destinations and weekly service with
narrowbody aircraft by Allegiant Air, an ultra low cost carrier (ULCC). GJT’s service
increases during the summer season to an average of 14 daily flights.
• Montrose Regional Airport (MTJ) is 129 road miles from the Airport. During the winter
season, 2 of MTJ’s 11 daily flights are operated with narrowbody aircraft; the
remainder with regional jet aircraft. MTJ’s service decreases during the summer
season to an average of 10 daily flights.
• Gunnison/Crested Butte Regional Airport (GUC) is 150 road miles from the Airport and
is in the secondary area of ASE’s Airport service region. Due to the driving distance
and terrain, ASE may not be accessible to Gunnison during all seasons. An average of
three daily flights are operated at GUC during the winter and summer seasons.
• Hayden/Yampa Valley Regional Airport (HDN) is 159 road miles from the Airport.
During the winter season, 5 of HDN’s 11 daily flights are operated with narrowbody
aircraft; the remainder with regional jet aircraft. HDN’s service decreases during the
summer season to an average of 3 daily flights.

Aviation Activity Forecasts Draft (8/9/2019) Aspen/Pitkin County Airport 7
ASE
In addition to these five commuter service airports, ASE is bordered to the east by:
• Denver International Airport (DEN), a large-hub airport as defined by the FAA,* a
connecting hub for United Airlines, and a focus city for Southwest Airlines, a low cost
carrier (LCC), and Frontier Airlines, an ultra low cost carrier
• Colorado Springs Airport (COS), a small-hub airport as defined by the FAA, with service
primarily to the connecting hubs of major U.S. airlines
Although DEN and COS are located the furthest from ASE (187 and 170 miles, respectively),
both airports offer lower average airfares than ASE and the other commuter service airports
due to presence of LCCs and ULCCs and provide significantly more connectivity and frequency
of flights, as shown on Table 1-1.
In addition, the secondary area includes five general aviation airports, as shown on Figure 1-3.
• Buena Vista-Central Colorado Regional Airport (AEJ), 49 miles from ASE, supports 13
based aircraft and handles an average of 10,000 aircraft operations per year, according
to the FAA’s 2018 Terminal Area Forecast (TAF)**
• Leadville-Lake County Airport (LXV), 61 miles from ASE, supports 5 based aircraft and
handles an average of 5,000 aircraft operations per year
• Rifle-Garfield County Airport (RIL), 63 miles from ASE, supports 50 based aircraft and
handled 14,561 aircraft operations in 2018
• Salida-Harriet Alexander Airport (ANK), 91 miles from ASE, supports 27 based aircraft
and handles an average of 4,000 aircraft operations per year
• Delta-Blake Field (AJZ), 116 miles from ASE, supports 42 based aircraft and handles an
average of 3,000 aircraft operations per year
As shown on Figure 1-3, Pitkin County is bordered by the counties of Eagle, Garfield, and
Gunnison. Portions of the populations of these counties are likely served at ASE due to their
proximity, the frequency of service, and the availability of seats. As shown on Table 1-2,
more than 40% of the population of the four counties listed is unincorporated area which
makes it difficult to assess their airport choice. However, based on the available information
and the guidelines of a 50- to 75-mile driving radius, the potential population served by ASE
ranged from 33,267 to 45,907 in 2017. As mentioned earlier, statistics for Pitkin County were
used to evaluate certain long-term and future airline traffic trends at the Airport.
*A large-hub airport is defined by the Federal Aviation Administration (FAA) as one that enplanes 1% or more
of annual nationwide passenger boardings; a medium-hub airport enplanes between 0.5% and 1% of
nationwide passenger boardings; and a small-hub airport enplanes between 0.25% and 0.5% of nationwide
passenger boardings.
**Federal Aviation Administration, Terminal Area Forecast, 2018, released February 2019, www.faa.gov.

Aviation Activity Forecasts Draft (8/9/2019) Aspen/Pitkin County Airport 8
ASE
Table 1-2
Potential Airport Service Region Population in 2017
Potential ASE service region
population Total Population Driving miles from the municipality (listed far left) to:
County/Municipality origin
50 miles or
less
75 miles or
less 2017
Percent
of total Aspen Eagle
Grand
Junction Gunnison Hayden Montrose
Colorado
Springs Denver
PITKIN COUNTY
Aspen 6,879 6,879 6,879 38% -- 73 128 145 175 136 264 198
Basalt (Part) 1,011 1,011 1,011 6% 18 55 110 157 157 118 247 180
Snowmass Village 2,903 2,903 2,903 16% 10 71 126 156 162 137 166 167
Unincorporated area 7,082 7,082 7,082 40% -- -- -- -- -- -- -- --
Total--Pitkin County 17,875 17,875 17,875 100%
EAGLE COUNTY
Avon 6,587 12% 93 21 138 154 92 193 172 106
Basalt (Part) 3,189 3,189 3,189 6% 18 55 110 157 157 118 247 180
Eagle 1,712 (a) 6,849 13% 73 -- 118 175 109 173 192 126
Gypsum 1,799 (a) 7,195 13% 66 8 111 181 99 164 201 133
Minturn 1,056 2% 99 27 144 147 98 199 171 103
Red Cliff 280 1% 107 36 153 139 107 206 180 112
Vail 5,495 10% 102 30 147 161 119 202 163 97
Unincorporated area
El Jebel 3,801 3,801 3,801 7% 22 51 106 149 152 117 243 176
Dotsero 353 (b) 705 1% 59 14 105 186 104 158 206 139
Other unincorporated areas -- -- 19,505 36% -- -- -- -- -- -- -- --
Total--Eagle County 6,990 10,854 54,662 100%
GARFIELD COUNTY
Carbondale 3,413 3,413 (b) 6,826 12% 29 45 99 145 147 109 235 170
Glenwood Springs 4,989 4,989 (b) 9,977 17% 46 32 87 157 134 140 223 157
New Castle 2,411 4,821 8% 54 44 77 193 121 131 237 170
Parachute 1,109 2% 83 74 44 164 123 100 266 199
Rifle 4,733 (b) 9,465 16% 68 58 61 181 107 116 249 183
Silt 1,561 (b) 3,121 5% 61 51 68 187 115 122 244 177
Unincorporated area -- -- 23,848 40% -- -- -- -- -- -- -- -- Total--Garfield County 8,402 17,107 59,167 100%
GUNNISON COUNTY
Crested Butte 1,656 10% 103 202 152 28 293 92 199 228
Gunnison 6,443 38% 145 175 124 -- 245 65 171 200
Marble 71 (b) 141 1% 58 72 111 130 174 94 265 198
Mount Crested Butte 850 5% 177 206 120 32 276 96 198 233
Pitkin 71 0% 196 177 153 27 248 92 170 205
Unincorporated area -- -- 7,710 46% -- -- -- -- -- -- -- --
Total--Gunnison County -- 71 16,871 100%
TOTAL--FOUR COUNTIES 33,267 45,904 148,575
(a) Population served by ASE and EGE; assumed 25% served by ASE.
(b) Population served by ASE and EGE; assumed 50% served by ASE
Sources: 2017 Population--Colorado Department of Local Affairs (DOLA), www.colorado.gov/dola, accessed May 2019. Driving miles--Travelmath.com.

Aviation Activity Forecasts Draft (8/9/2019) Aspen/Pitkin County Airport 9
ASE
CHAPTER 2
ECONOMIC BASIS FOR AIRLINE TRAFFIC
Although the economy of an airport service region is typically a major factor affecting long-
term airline traffic at the airport serving the region, destination markets such as the Aspen
region are more directly influenced by the numbers of visitors, the level of airline service, the
number of hotel rooms, and other infrastructure supporting the visitor base. The Aspen
region is a destination market for skiing, visiting parks and historic landmarks, and
participating in a range of outdoor recreational activity. The following sections present (1) a
comparison of selected destination markets, (2) a summary of the Aspen visitor industry, and
(3) a review of historical and forecast economic activity in the Aspen region.
2.1 COMPARISON OF DESTINATION MARKETS
The Aspen region is a destination market for skiing and a range of outdoor recreational
activity. In 2018, Aspen ranked second among U.S. ski resorts with an estimated 1.6 million
skier visits, following Vail, as shown in Figure 2-1.
Figure 2-1
Estimated Skier Visits for Selected Destination Markets in 2018
Ranked by 2018 skier visits
Note: A skier visit is the purchase of a lift ticket for a full or partial day. It includes season-pass use. Vail Resorts: Vail Mountain, Beaver Creek, Breckenridge, Keystone and Crested Butte Aspen Ski Company: Aspen Mountain, Aspen Highlands, Snowmass, and Buttermilk Bozeman: Big Sky Resort, Bridger Bowl, and Moonlight Basin Kalispell: Whitefish Mountain Resort and Blacktail Mountain Ski Area Missoula: Snowbowl, Discovery, Lookout Pass, and Lost Trail Population data are for the county shown in 2018.
Sources: U.S. Census Bureau, Population Division, Annual Estimates of the Resident Population: April 1, 2010 to July 1, 2018, December 2018, www.census.gov, U.S. Department of Agriculture (USDA) Forest Service, Northern Region and individual ski areas as reported by the University of Montana, Institute for Tourism and Recreation Research, www.tourismresearchmt.org, Travel and Leisure, “America's Most-Visited Ski Resorts,” www.travelandleisure.com and regional press releases.
55
18
32 26
112
23
8
102
23
119
-
20
40
60
80
100
120
140
0
200
400
600
800
1,000
1,200
1,400
1,600
1,800
2,000
Vail/Eagle Aspen/
Pitkin
Mammoth/
Inyo and
Mono
Steamboat
Springs/
Routt
Bozeman/
Gallatin
Jackson
Hole/ Teton
Telluride/
San Miguel
Kalispell/
Flathead
Sun Valley/
Blaine
Missoula/
Missoula
20
18
Po
pu
latio
n (th
ou
san
ds)
20
18
/20
19
Sk
ier
vis
its
(th
ou
san
ds)
Destination market/ County
Skier visits Population

Aviation Activity Forecasts Draft (8/9/2019) Aspen/Pitkin County Airport 10
ASE
It is important to note that the resident population of the selected resort locations was less
than 120,000 in 2018, with Aspen accounting for the smallest population (17,950) and
Missoula the largest (118,791). The relationship between the number of skier visits and the
relatively small population bases underlines the importance of the numbers of visitors and
the role of these resort locations as destination markets.
As shown in Figure 2-2, a ranking of the selected destination markets in terms of enplaned
passengers in 2018 differs from a ranking of skier visits presented in Figure 2-1. The airport
at Yellowstone National Park in Bozeman, Montana accounted for the largest number of
enplaned passengers in 2018 but ranked fifth in the number of 2018 skier visits, reflecting a
peak number of visitors during the summer months, as shown in Figure 2-3. ASE ranked
second in terms of skier visits in 2015 and fifth in enplaned passengers, including a second
seasonal peak during the summer months, as shown in Figure 2-3. Ski resorts such as Aspen
and Telluride are being increasingly used for summer activities and vacations (e.g., mountain
biking, hiking, and fishing).
Figure 2-2
Enplaned Passengers for Selected Destination Markets in 2018
Ranked by 2018 enplaned passengers
Note: Vail Resorts: Vail Mountain, Beaver Creek, Breckenridge, Keystone and Crested Butte
Aspen Ski Company: Aspen Mountain, Aspen Highlands, Snowmass, and Buttermilk
Bozeman: Big Sky Resort, Bridger Bowl, and Moonlight Basin.
Kalispell: Whitefish Mountain Resort and Blacktail Mountain Ski Area.
Missoula: Snowbowl, Discovery, Lookout Pass, and Lost Trail.
Sources: U.S. Department of Transportation, Schedule T100, online database, accessed April 2019 and U.S.
Census Bureau, Population Division, Annual Estimates of the Resident Population: April 1, 2010 to
July 1, 2018, December 2018, www.census.gov.
6.0
3.6
16.5
3.0
15.8
3.1
16.3
3.9 4.1
0.7
0
2
4
6
8
10
12
14
16
18
-
100
200
300
400
500
600
700
800
Bozeman/
Yellowstone
International
Missoula/
Missoula
International
Jackson
Hole/
Jackson Hole
Kalispell/
Glacier
National Park
Aspen/ Pitkin
County
Vail/ Eagle
County
Telluride/
Montrose
Steamboat
Springs/
Yampa Valley
Sun Valley/
Friedman
Memorial
Mammoth/
Mammoth
Yosemite
20
18
Av
era
ge
pa
ssen
ge
r airlin
e trip
s pe
r pe
rson
20
18
En
pla
ne
d p
ass
en
ge
rs (
tho
usa
nd
s)
Destination market/ Airport
Enplaned passengers Average passenger airline trips per person

Aviation Activity Forecasts Draft (8/9/2019) Aspen/Pitkin County Airport 11
ASE
The average number of passenger airline trips per person underlines the role of each resort
location as a destination market. As shown in Figure 2-2, Aspen accounted for the third
largest number of trips per person in 2018 with an average of 15.8, after Jackson Hole and
Telluride, with 16.5 and 18.3, respectively. Bozeman and Sun Valley ranked fourth and fifth,
with 6.0 and 4.1, respectively. Mammoth had the lowest number of trips per person in 2018,
with 0.7, reflecting the limited level of passenger airline service (less than 2 daily departures
in 2018 as shown on Figure 2-4).
Figure 2-3
Trends in Monthly Enplaned Passengers
for Selected Destination Markets in 2018
Note: Square markers indicate that the summer is the peak season.
Jackson Hole Airport is 21 road miles from Grand Teton National Park and 57 road miles from
Yellowstone National Park.
Source: U.S. Department of Transportation, Schedule T100, online database, accessed April 2019.
As shown on Figure 2-3, five of the selected destination markets have peak seasons in the summer—Bozeman, Kalispell, Jackson Hole, Missoula, and Sun Valley, with four of the five airports being within driving distance of national parks popular during the summer.
A comparison of selected destination markets to the Aspen region suggests that the primary
driver of passenger traffic at airports has historically been trips by visitors from outside the
region rather than the size of the population base. The destination markets selected for this
comparison also provide a view of the evolution of passenger traffic at destination airports in
the future.
0%
5%
10%
15%
20%
25%
J F M A M J J A S O N D
Pe
rce
nt
of
20
18
en
pla
ne
d p
ass
en
gers
Month
Aspen/Pitkin County
Bozeman/ Yellowstone International
Vail/Eagle County
Kalispell/Glacier National Park
Steamboat Springs/ Yampa County
Jackson Hole/ Jackson Hole
Missoula/ Missoula International
Telluride/ Montrose
Sun Valley/ Friedman Memorial
Mammoth/ Mammoth Yosemite

Aviation Activity Forecasts Draft (8/9/2019) Aspen/Pitkin County Airport 12
ASE
Figure 2-4
Average Daily Scheduled Passenger Airline Departures
for Selected Destination Markets in 2018
Note: Vail Resorts: Vail Mountain, Beaver Creek, Breckenridge, Keystone and Crested Butte
Aspen Ski Company: Aspen Mountain, Aspen Highlands, Snowmass, and Buttermilk
Bozeman: Big Sky Resort, Bridger Bowl, and Moonlight Basin.
Kalispell: Whitefish Mountain Resort and Blacktail Mountain Ski Area.
Missoula: Snowbowl, Discovery, Lookout Pass, and Lost Trail.
Source: U.S. Department of Transportation, Schedule T100, online database, accessed April 2019.
2.2 ASPEN VISITOR INDUSTRY
The visitor industry is an important driver of the economies of the Aspen region. Visitors to
the Aspen region include leisure travelers originating from both domestic and international
locations.
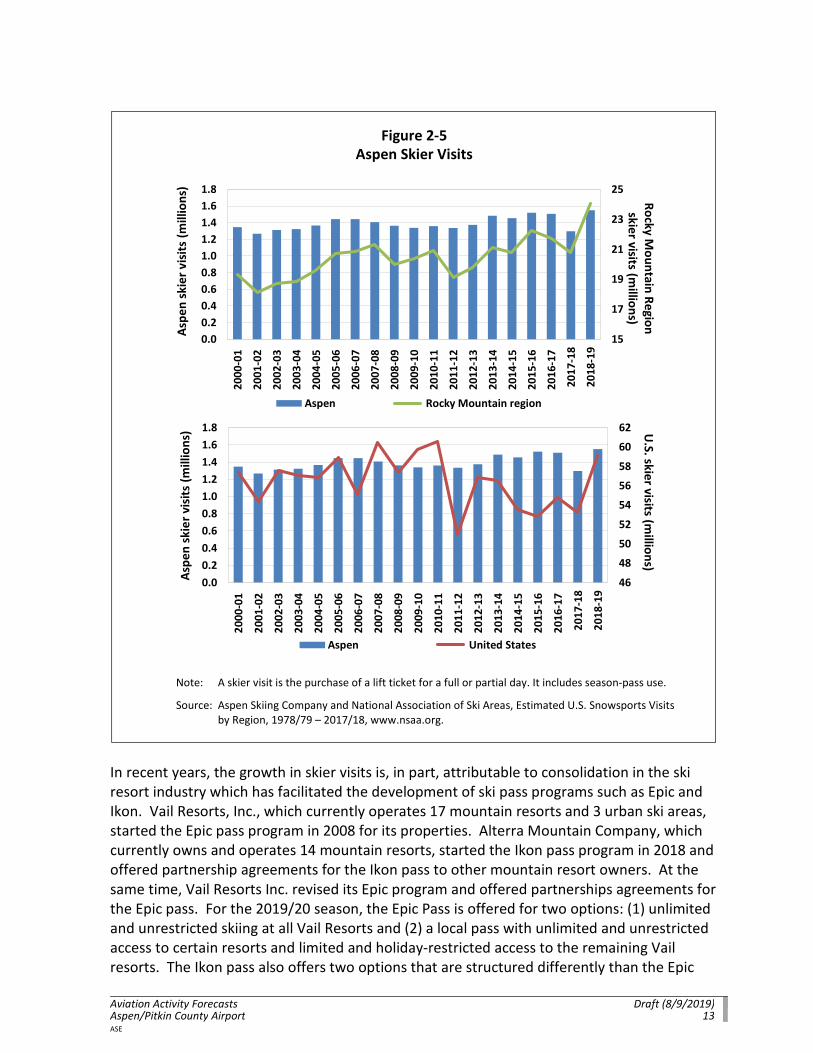
2.2.1 Skier Visits
According to the National Association of Ski Areas, the 2018-19 ski season is one of the best
on record in terms of skier visits. The number of skier visits at Aspen resorts increased 19.8%
in 2019, compared with increases of 15.6% in the Rocky Mountain Region and 11.0% in the
United States. As shown in Figure 2-5, the increase in the 2018-19 season reflects a lower
than average 2017-18 season and an abundant snowfall, which was up 31% nationwide from
the 2017-18 season.
The historical trend in skier visits at Aspen resorts follows that for the Rocky Mountain Region
which reported a record of 24 million skier visits in 2018-19. Between 2000 and 2019, the
number of skier visits at Aspen increased an average of 0.7% per year, faster than that for the
nation as a whole (0.2% per year) but slower than that for the Rocky Mountain Region (1.2%
per year). Historical trends in U.S. skier visits vary from year while Aspen and the Rocky
Mountain Region appear to be on a gradually increasing trend.
79
43
67 66
83
50
73
43 48
41
-
10
20
30
40
50
60
70
80
90
100
-
5
10
15
20
25
30
Bozeman/
Yellowstone
International
Aspen/
Pitkin County
Missoula/
Missoula
International
Kalispell/
Glacier
National
Park
Jackson
Hole/
Jackson Hole
Telluride/
Montrose
Vail/ Eagle
County
Sun Valley/
Friedman
Memorial
Steamboat
Springs/
Yampa
Valley
Mammoth/
Mammoth
Yosemite
20
18
En
pla
ne
d p
asse
ng
ers p
er d
ep
artu
re
20
18
Av
era
ge
da
ily
de
pa
rtu
res
Destination market/Airport
Average daily departures Enplaned passengers per departure
Aviation Activity Forecasts Draft (8/9/2019) Aspen/Pitkin County Airport 13
ASE
Figure 2-5
Aspen Skier Visits
Note: A skier visit is the purchase of a lift ticket for a full or partial day. It includes season-pass use.
Source: Aspen Skiing Company and National Association of Ski Areas, Estimated U.S. Snowsports Visits
by Region, 1978/79 – 2017/18, www.nsaa.org.
In recent years, the growth in skier visits is, in part, attributable to consolidation in the ski
resort industry which has facilitated the development of ski pass programs such as Epic and
Ikon. Vail Resorts, Inc., which currently operates 17 mountain resorts and 3 urban ski areas,
started the Epic pass program in 2008 for its properties. Alterra Mountain Company, which
currently owns and operates 14 mountain resorts, started the Ikon pass program in 2018 and
offered partnership agreements for the Ikon pass to other mountain resort owners. At the
same time, Vail Resorts Inc. revised its Epic program and offered partnerships agreements for
the Epic pass. For the 2019/20 season, the Epic Pass is offered for two options: (1) unlimited
and unrestricted skiing at all Vail Resorts and (2) a local pass with unlimited and unrestricted
access to certain resorts and limited and holiday-restricted access to the remaining Vail
resorts. The Ikon pass also offers two options that are structured differently than the Epic
15
17
19
21
23
25
0.0
0.2
0.4
0.6
0.8
1.0
1.2
1.4
1.6
1.8
20
00
-01
20
01
-02
20
02
-03
20
03
-04
20
04
-05
20
05
-06
20
06
-07
20
07
-08
20
08
-09
20
09
-10
20
10
-11
20
11
-12
20
12
-13
20
13
-14
20
14
-15
20
15
-16
20
16
-17
20
17
-18
20
18
-19
Ro
cky
Mo
un
tain
Re
gio
n
skie
r visits (m
illion
s)A
spe
n s
kie
r v
isit
s (m
illi
on
s)
Aspen Rocky Mountain region
46
48
50
52
54
56
58
60
62
0.0
0.2
0.4
0.6
0.8
1.0
1.2
1.4
1.6
1.8
20
00
-01
20
01
-02
20
02
-03
20
03
-04
20
04
-05
20
05
-06
20
06
-07
20
07
-08
20
08
-09
20
09
-10
20
10
-11
20
11
-12
20
12
-13
20
13
-14
20
14
-15
20
15
-16
20
16
-17
20
17
-18
20
18
-19
U.S
. skie
r visits (m
illion
s)
Asp
en
sk
ier
vis
its
(mil
lio
ns)
Aspen United States

Aviation Activity Forecasts Draft (8/9/2019) Aspen/Pitkin County Airport 14
ASE
pass: (1) the Base Pass includes unlimited and unrestricted access to 14 resorts but limits
access to up to 7 days at the remaining resorts and (2) the Ikon Base Pass includes unlimited
access with restricted blackout dates to 12 resorts but limits access to up to 5 days at the
remaining resorts. For the 2019/2020 season, the Epic and Ikon ski passes are expected to
include 37* and 39 resorts, respectively.
2.2.2 Aspen Visitor Spending
Visitor spending is another measure of the level and growth of visitors to the Aspen region.
As shown on Figure 2-6, the City of Aspen’s lodging and sales tax revenues increased an
average of 7.7% and 6.2% per year, respectively, between 2012 and 2019.
Figure 2-6
Lodging and Sales Tax Revenue
City of Aspen
Note: City of Aspen lodging tax = 1.5%; City of Aspen sales tax = 2.1%
Data for 2019 are estimated based on actual revenue for January through May.
Source: City of Aspen, Consumption Tax Report, December 2018 and May 2019.
2.2.3 Aspen Region Recreation
Aspen region recreation includes visiting the four Aspen ski resorts, White River National
Forest, and numerous hiking trails.
2.2.3.1 Aspen Ski Resorts
The Aspen ski resorts include Aspen Highlands, Aspen Mountain, Buttermilk, and Aspen
Snowmass. As shown in Table 2-1, the four Aspen resorts have a combined 5,317 skiable
acres, second only to Big Sky in Bozeman, Montana; a summit elevation of 12,510 feet,
*Includes 20 ski resorts from the 2018-2019 season and 17 additional acquired in 2019. Epic Pass, Vail Resorts
to Acquire Peak Resorts, Owner of 17 U.S. Ski Areas, July 22, 2019, www.epicpass.com.
-
2
4
6
8
10
12
14
16
18
0.0
0.5
1.0
1.5
2.0
2.5
3.0
3.5
2012 2013 2014 2015 2016 2017 2018 2019
City o
d A
spe
n sa
les ta
x reve
nu
e
(millio
ns)
Cit
y o
f A
spe
n lo
dgi
ng
tax
reve
nu
e
(mil
lio
ns)
City of Aspen lodging tax City of Aspen sales tax

Aviation Activity Forecasts Draft (8/9/2019) Aspen/Pitkin County Airport 15
ASE
second among the selected ski resorts; and 41 lifts, second only to Big Sky in Bozeman,
Montana. The average driving distance from the Aspen ski resorts to ASE is no more than 7
miles, the lowest of the selected airports.
Table 2-1
Comparison of Ski Resort Metrics for Selected Destination Markets
Ski resort Nearest airport(s)
Miles from
nearest
airport
Estimated
snowfall
Skiable
areas
(acres)
Summit
elevation Lifts
Aspen
Aspen Highlands Pitkin County 4 300 1,040 12,392 5
Aspen Mountain Pitkin County 4 300 675 11,212 8
Buttermilk Pitkin County 1 200 470 9,900 8
Snowmass Pitkin County 7 300 3,132 12,510 20
Bozeman (Big Sky) Bozeman Yellowstone 52 400 5,850 11,166 36
Jackson Hole Jackson Hole 13 459 2,500 10,450 11
Kalispell/Glacier National Park
Whitefish Mountain Glacier National Park 19 300 3,000 6,817 14
Blacktail Mountain Ski Area Glacier National Park 37 250 1,000 6,780 4
Mammoth Mountain Mammoth Yosemite/Bishop 13/45 400 3,500 11,053 28
Missoula (Snowbowl) Missoula 12 300 950 7,600 4
Telluride Montrose 70 280 2,000 13,150 17
Vail Eagle County 36 354 5,289 11,570 31
Steamboat Springs Yampa County 26 375 2,965 10,568 18
Sun Valley Friedman Memorial 15 200 2,154 9,150 18
Note: Vail Resorts: Vail Mountain, Beaver Creek, Breckenridge, Keystone and Crested Butte
Aspen Ski Company: Aspen Mountain, Aspen Highlands, Snowmass, and Buttermilk
Bozeman: Big Sky Resort, Bridger Bowl, and Moonlight Basin
Kalispell: Whitefish Mountain Resort and Blacktail Mountain Ski Area
Missoula: Snowbowl, Discovery, Lookout Pass, and Lost Trail
Sources: Colorado Ski Country USA, www.coloradoski.com, and individual ski resort websites, accessed April 2019.
2.2.3.2 National Parks and Trails
The Aspen region borders White River National Forest and numerous trails such as the
Hunter Creek Trail, Smuggler Mountain, and Sunnyside Trail. According to the U.S. Forestry
Service, the 2.3 million acres in the White River National Forest includes 11 ski resorts, 8
Wilderness areas, and 2,500 miles of trails and is the most visited national forest in the
nation. The Maroon Bells-Snowmass Wilderness area includes the Marron Bells Scenic Area
near Aspen which is a major access point to the wilderness trails. The Black Canyon of the
Gunnison National Park and the Rocky Mountain National Park are 112 miles and 164 miles,
respectively, from Aspen.

Aviation Activity Forecasts Draft (8/9/2019) Aspen/Pitkin County Airport 16
ASE
2.2.4 Lodging Infrastructure
In 2018, an estimated 4,000 lodging units were in Aspen and Snowmass Village, relatively
unchanged from 2009 levels, as shown on Figure 2-7. Of the fixed structures, condos
accounted for 50% of total, followed by hotel, motel, and lodge units with 38%, and private
homes with 12%.
Figure 2-7
Traditional Lodging Trends
Aspen and Snowmass
Note: Includes traditional lodging, professional managed short-term rental units, and fractional ownership
units; excludes rentals by owner (RBO).
Source: DestiMetrics, Stay Aspen Snowmass Transient Inventory Study, July 2018.
In addition, the number of rentals by owner (RBO) has supplemented traditional lodging units with more
than 2,000 additional listings, as shown on Figure 2-8. Occupancy rates for RBOs averaged 53% in
2018, lower than the average for traditional lodging units (59%). The monthly trends in occupancy
rates are similar for RBOs and traditional lodging, with the occupancy rates peaking during the peak
winter season (January through March) and in the summer (June through August), as shown on Figure
2-9.
17
19 18
19
-
5
10
15
20
25
0.0
0.5
1.0
1.5
2.0
2.5
3.0
3.5
4.0
4.5
5.0
2009 2012 2015 2018
Pillo
ws (th
ou
san
ds)
Un
its
(th
ou
san
ds)
Units Pillows
Condo
50%
Hotel/
Lodge
38%
Private
home
12%
2018

Aviation Activity Forecasts Draft (8/9/2019) Aspen/Pitkin County Airport 17
ASE
Figure 2-8
Rentals By Owner
Aspen and Snowmass
Note: RBO = Rentals by owner; includes RBO listings on Airbnb, HomeAway, and VRBO.
Source: AIRDNA, April 2019.
0%
10%
20%
30%
40%
50%
60%
70%
-
500
1,000
1,500
2,000
2,500
3,000
J J A S O N D J F M A M J J A S O N D J F M
2017 2018 2019
RB
O o
ccup
an
cy rate
RB
O l
isti
ngs
Booked Listings Not booked Occupancy rate

Aviation Activity Forecasts Draft (8/9/2019) Aspen/Pitkin County Airport 18
ASE
Figure 2-9
Historical Monthly Occupancy for Traditional Lodging
Aspen and Snowmass
Note: Occupancy numbers are from the new reporting tool structure RRC Associates and are not
forecasts or projections; the ACRA is providing current reservations on the books to assist
businesses in their staffing and inventory needs. It should be noted that last minute
reservations can be made after the occupancy report is released which would increase the
actual occupancy.
Source: Aspen Area Resort Association.
New construction of lodging facilities in the Aspen region includes:
• W Aspen and The Sky Residences at W Aspen opened in July 2019 providing 88
guestrooms and 11 W-branded fractional residences. Located at the base of Aspen
Mountain, the development will also feature a 12,000 sq. ft. rooftop bar and pool,
which is open to the public with expansive views of Aspen Mountain.*
• The design and planning of a 107,000-square-foot Lift One Lodge, which will add 34
fractional and six full-interest condominiums, and the 64,000-square-foot, 81-room
Gorsuch Haus luxury hotel.**
• Base 1 lodge, a mixed-use project in downtown Aspen with hotel rooms and retail and
restaurant space
*Aspen Chamber Resort Association, News from Aspen for the Summer/Fall 2019 Season,
www.aspenchamber.org.
**Post Independent, It will take at least two years before construction on Aspen’s Lift One begins, March 7,
2019, www.postindependent.com.
75% 75% 74%
28%32%
66%
82%
73%
64%
47%
28%
61%
0%
10%
20%
30%
40%
50%
60%
70%
80%
90%
100%
Jan Feb Mar Apr May Jun Jul Aug Sep Oct Noc Dec
Pe
rce
nt
of
tota
l
2018
2019

Aviation Activity Forecasts Draft (8/9/2019) Aspen/Pitkin County Airport 19
ASE
2.3 HISTORICAL AND FORECAST ECONOMIC ACTIVITY
The economy of the Aspen region (represented by data for Pitkin County) is an important
determinant of long-term passenger demand at the Airport. The development of the
economic base of an airport service region is important to passenger traffic growth at the
airport serving that region. This is particularly true where the industries in the region rely on
the airport for passenger and cargo service. The Aspen region is a national and international
travel resort destination.
2.3.1 Population
As shown in Table 2-2, the population of Pitkin County increased an average of 1.1% per year
between 2001 and 2018, with the strongest growth between 2001 and 2010 (an average
increase of 1.5% per year). The Colorado Department of Local Affairs (DOLA) projects
population in Pitkin County to increase an average of 0.5% per year between 2018 and 2048,
equal to that of the nation but slower than that for the State (an average increase of 1.1% per
year) during the same period.
2.3.2 Total Employment
Total employment in Pitkin County increased an average of 0.3% per year between 2001 and
2018, with the strongest growth between 2010 and 2018 (an average increase of 1.1% per
year). DOLA projects total employment in Pitkin County to increase an average of 0.5% per
year between 2018 and 2048, slower than the State (an average increase of 1.2% per year)
and the nation (an average increase of 0.7% per year).
2.3.3 Average Annual Wages
From 2001 to 2018, average annual wages (in 2018 constant dollars) in Pitkin County
increased an average of 0.4% per year, with the strongest growth between 2010 and 2018
(an average increase of 0.9% per year), as shown in Table 2-2. In 2018, Pitkin County’s
average annual wages were $52,715, 10.6% lower than the State and 7.9% lower than the
nation. DOLA projects average annual wages in Pitkin County to increase an average of 0.9%
per year between 2018 and 2048.

Aviation Activity Forecasts Draft 87/9/2019) Aspen/Pitkin County Airport 20
ASE
Table 2-2
Historical and Projected Socioeconomic Data
Population (thousands) Total employment (thousands) Average annual wages (2018 dollars)
Pitkin County
State of
Colorado
United
States Pitkin County
State of
Colorado
United
States Pitkin County
State of
Colorado
United
States
Historical
2001 15 4,426 284,969 20 2,707 136,933 49,549 53,812 51,354
2010 17 5,029 308,746 19 2,787 139,064 49,088 55,123 53,837
2011 17 5,122 311,580 20 2,834 139,869 48,331 54,792 53,632
2012 17 5,194 313,874 20 2,893 142,469 48,830 55,300 53,908
2013 17 5,270 316,058 20 2,970 143,929 48,413 54,836 53,688
2014 18 5,351 318,386 21 3,064 146,305 49,075 55,925 54,482
2015 18 5,452 320,743 20 3,161 148,834 53,470 57,403 56,089
2016 18 5,541 323,071 21 3,232 151,436 52,993 57,192 56,101
2017 18 5,616 325,147 21 3,309 153,337 52,198 58,304 56,742
2018 18 5,696 327,167 21 3,389 155,761 52,715 58,942 57,265
Projected
2020 18 5,696 327,167 22 3,534 159,871 53,411 59,838 58,276
2030 19 6,569 348,661 23 4,015 169,516 58,044 65,677 65,280
2038 20 7,175 362,082 24 4,348 178,749 63,071 71,932 73,077
2048 21 8,012 379,588 25 4,805 191,000 69,973 80,597 84,147
Annual percent increase (decrease)
2010-2011 0.2% 1.8% 0.9% 1.2% 1.7% 0.6% (1.5%) (0.6%) (0.4%)
2011-2012 0.7 1.4 0.7 1.0 2.0 1.9 1.0 0.9 0.5
2012-2013 1.0 1.5 0.7 2.0 2.7 1.0 (0.9) (0.8) (0.4)
2013-2014 1.5 1.5 0.7 4.1 3.2 1.7 1.4 2.0 1.5
2014-2015 1.3 1.9 0.7 (2.9) 3.2 1.7 9.0 2.6 3.0
2015-2016 0.1 1.6 0.7 1.6 2.2 1.7 (0.9) (0.4) 0.0
2016-2017 (0.1) 1.4 0.6 1.3 2.4 1.3 (1.5) 1.9 1.1
2017-2018 0.0 1.4 0.6 1.0 2.4 1.6 1.0 1.1 0.9
Compound annual percent increase
Historical
2001-2010 1.5% 1.4% 0.9% (0.4%) 0.3% 0.2% (0.1%) 0.3% 0.5%
2010-2018 0.6 1.6 0.7 1.1 2.5 1.4 0.9 0.8 0.8
2001-2018 1.1 1.5 0.8 0.3 1.3 0.8 0.4 0.5 0.6
Projected
2018-2020 0.1 0.0 0.0 1.4 2.1 1.3 0.7 0.8 0.9
2020-2030 0.6 1.4 0.6 0.5 1.3 0.6 0.8 0.9 1.1
2030-2038 0.4 1.1 0.5 0.4 1.0 0.7 1.0 1.1 1.4
2038-2048 0.4 1.1 0.5 0.4 1.0 0.7 1.0 1.1 1.4
2018-2048 0.5 1.1 0.5 0.5 1.2 0.7 0.9 1.0 1.3
Note: Pitkin County is defined as the primary area of the Airport Service Region.
Sources: Historical: U.S. Department of Commerce, Bureau of the Census, www.census.gov and U.S. Department of Labor, Bureau of Labor Statistics, Quarterly Census of Employment and Wages,
www.bls.gov; accessed July 2019. Wage data are adjusted to constant 2018 dollars using the U.S. Department of Labor, Consumer Price Index for Urban Consumers (1982-84 = 100), www.bls.gov.
Projected: Colorado Department of Local Affairs (DOLA), Economic Forecasts, December 2018, www.dola.colorado.gov. Pitkin County annual wage growth is assumed to increase at slightly slower
rates than for Colorado since separate forecasts for Pitkin County are not available.

Aviation Activity Forecasts Draft (8/9/2019) Aspen/Pitkin County Airport 21
ASE
2.3.4 Total Employment by Industry Sector
Figure 2-10 shows a comparative distribution of total employment by industry sector for
Pitkin County in 2010 and in 2018, and for the State and the nation in 2018. Employment in
leisure and hospitality (39.1%), professional and business services (11.6%), and trade,
transportation, and utilities (10.9%) accounted for 61.6% of total employment in Pitkin
County in 2018. The large share of leisure and hospitality employment reflects the role of the
visitor industry in the regional economy and the role of Aspen as a destination market.
Figure 2-10
Trends in Total Employment
Note: Pitkin County is defined as the primary area of the Airport Service Region.
(a) Includes information, manufacturing, natural resources and mining, and other services.
Source: U.S. Department of Labor, Bureau of Labor Statistics, Quarterly Census of Employment and Wages,
www.bls.gov; accessed July 2019.
2.3.5 Annual Wages by Industry Sector
As noted in Figure 2-10, the leisure and hospitality sector in Pitkin County accounted for the
largest share of total employment in 2018, with 39.1%, more than three times the shares for
the State and the nation. As shown in Table 2-3, average annual wages in the leisure and
hospitality sector are the lowest of all industry sectors in Pitkin County, but are significantly
higher than the State and the nation by 36% and 40%, respectively. The education and health
services and construction sectors in Pitkin County are also account for higher average annual
wages in 2018 than the State and the nation, by 17% and 13% respectively.
6.9% 7.0%13.3% 15.3%5.0% 4.3%
6.6% 5.1%7.4% 8.4%
5.6% 5.1%9.5% 9.3%6.2% 5.6%
9.1% 9.4%
21.2% 23.5%10.2% 10.9%
18.2% 19.6%
13.6% 11.6%
15.9% 14.4%38.2% 39.1%
12.9% 11.4%
0%
10%
20%
30%
40%
50%
60%
70%
80%
90%
100%
2010 2018 2018 2018
Pitkin County Colorado United States
Ind
ust
ryse
cto
r sh
are
Leisure and hospitality
Professional and business services
Trade, transportation, and utilities
Education and health services
Financial activities
Public administration
Construction
Other (a)

Aviation Activity Forecasts Draft (8/9/2019) Aspen/Pitkin County Airport 22
ASE
Table 2-3
Comparison of Average Annual Wages by Industry Sector
In 2018 dollars
Pitkin County United
Percent difference
from Pitkin
County
Industry sector 2010 2018
CAGR
2010-2018
Colorado
2018
States
2018 Colorado
United
States
Leisure and hospitality $30,906 $40,397 3.4% $25,844 $24,343 -36% -40%
Professional and business services 49,804 68,677 4.1% 81,439 75,083 19% 9%
Trade, transportation, and utilities 40,012 45,887 1.7% 50,723 48,361 11% 5%
Education and health services 51,342 61,453 2.3% 50,970 51,269 -17% -17%
Financial activities 56,548 67,238 2.2% 84,463 95,353 26% 42%
Public administration 52,771 59,779 1.6% 64,550 65,649 8% 10%
Construction 55,025 71,713 3.4% 62,440 62,498 -13% -13%
Other (a) 45,562 53,703 2.1% 72,151 67,120 34% 25%
All sectors 42,561 52,651 2.7% 58,942 57,265 12% 9%
CAGR = Compound average growth rate
(a) Includes information, manufacturing, natural resources and mining, and other services.
Source: U.S. Department of Labor, Bureau of Labor Statistics, Quarterly Census of Employment and Wages,
www.bls.gov; accessed July 2019.
2.3.6 Regional Housing Market
Trends in the housing market in a region generally follow economic cycles and are typically an
indicator of overall economic activity and personal income levels. In contrast, home prices in
Pitkin County are more indicative of a luxury resort destination and high levels of personal
wealth. As shown on Figure 2-11, the median sales price of single-family homes in Pitkin
County was $3.7 million for the 12-months ended June 2019, more than 9 times the median
price for a home in Garfield County. As a result, a large share of the work force in Pitkin
County resides in the adjacent counties of Garfield, Gunnison, and Eagle. The rural bus rapid
transit system operated by the Roaring Fork Transportation Authority (RFTA), known as
VelociRFTA, provides an extensive network throughout the Roaring Fork Valley.

Aviation Activity Forecasts Draft (8/9/2019) Aspen/Pitkin County Airport 23
ASE
Figure 2-11
Recent Housing Price Trends
For the 12-months ended June 2019
Source: Colorado Association of Realtors, Local Market Update, www.coloradorealtors.com,
accessed July 2019.
2.4 ECONOMIC OUTLOOK
The economic outlook for the United States, the State of Colorado, and Pitkin County forms a
basis for anticipated growth in airline traffic at the Airport. Economic activity in Pitkin County
and the State is directly linked to the production of goods and services in the world and the
rest of the United States. Both airline travel and the movement of cargo through the Airport
depend on the economic linkages between and among the regional, State, national, and
global economies. The economic and other assumptions underlying the forecasts of
enplaned passengers are based on a review of national, State, and regional economic
outlooks as well as an analysis of historical socioeconomic trends and airline traffic trends, as
presented in Chapter 3 titled “Historical Passenger Airline Traffic.”
$0.0
$0.5
$1.0
$1.5
$2.0
$2.5
$3.0
$3.5
$4.0
Pitkin Eagle Gunnison Garfield
Me
dia
n s
ale
s p
rice
County
Single family
Townhouse/Condo

Aviation Activity Forecasts Draft (8/9/2019) Aspen/Pitkin County Airport 24
ASE
2.4.1 U.S. Economy
The U.S. economy has grown at a slow to moderate pace since the 2008-2009 economic
recession, with U.S. GDP growth averaging 2.2% per year between 2009 and 2018. In January
2019, the Congressional Budget Office (CBO) projected U.S. economic growth, as measured
by U.S. GDP in constant dollars, to increase 2.7% in 2019 and 1.9% in 2020, for an overall
growth rate of 1.8% per year between 2018 and 2029.* IHS Markit, an internationally
recognized economic forecasting firm, forecasts U.S. GDP, in constant dollars to increase an
average of 1.8% between 2018 and 2039.** Since the 2008-2009 economic recession, U.S.
unemployment rates (seasonally adjusted) have decreased from 9.5% in July 2009 to 3.4% in
May 2019. The CBO projects an average unemployment rate of 3.8% in 2018, 3.4% in 2019,
increasing to 4.7% to 4.8% by 2029.*** For purposes of this forecast, it is assumed that U.S.
GDP growth will average 2.0% per year through 2048.
2.4.2 Colorado Economy
Colorado’s economy continues to outperform the nation and remains among the top states for
GDP growth. In 2018, Colorado GDP increased 3.5% and tied for the fifth fastest in the nation
(following the states of Washington, Utah, Idaho, and Arizona). Contributions to growth
continue to be broad-based across most industries, with information and professional,
scientific, and technical services posting the largest contributions to the increase in Colorado’s
GDP in 2018. Colorado’s information industry and workforce continue to attract new
companies to the state and add new employees; over 4,100 technology companies are located
in Colorado. The Colorado economy is expected to continue to expand through the remainder
of 2019 and into 2020, though at a slower pace of growth as labor market tightening
constrains business activity, global economic activity slows, and trade tensions persist. ****
2.4.3 Aspen/Pitkin County Economy
The economies of Aspen and Pitkin County are dependent upon the visitor industry, particularly
ski tourism. The local economy benefited from the heavy snowfall during the 2018-19 winter
season. In addition to record high occupancy rates at Pitkin County resorts in Aspen and
Snowmass, Aspen’s nominal retail sales revenue increased 7.9% in March 2019 compared with
March 2018, to reach a record for the busy winter month. In the long-term, the Colorado
*Congressional Budget Office, The Budget and Economic Outlook: Fiscal Years 2019-2029, January 2019,
www.cbo.gov. The CBO’s report incorporates the effects of Public Law 115-97 (originally called the Tax
Cuts and Jobs Act) enacted on December 22, 2017; the Bipartisan Budget Act of 2018 (P.L. 115-123)
enacted on February 9, 2018; and the Consolidated Appropriations Act, 2018 (P.L. 115-141) enacted on
March 23, 2018. The projections do not incorporate the effects of the partial shutdown of the federal
government that started on December 22, 2018 and ended on January 25, 2019.
**As reported in Federal Aviation Administration, FAA Aerospace Forecast, Fiscal Years 2019-2039, March
2019, www.faa.gov.
***The CBO considers 4.7% to be the natural rate of unemployment.
****Colorado Legislative Council Staff, Economic and Revenue Forecast, June 2019, www.leg.colorado.gov.

Aviation Activity Forecasts Draft (8/9/2019) Aspen/Pitkin County Airport 25
ASE
Department of Local Affairs (DOLA) forecasts population and income growth to approximate
national growth, while employment growth is expected to be slower than the national average.

Aviation Activity Forecasts Draft (8/9/2019) Aspen/Pitkin County Airport 26
ASE
CHAPTER 3
HISTORICAL PASSENGER AIRLINE TRAFFIC
Historical and future passenger airline traffic is influenced by a number of factors including
(1) the diversity of airline service at an airport, (2) the passenger market shares of the airlines
providing service, (3) trends in mainline and regional airline passenger traffic, and (4)
passenger traffic at other airports in the region. In 2018, approximately 72% of ASE’s
passengers were visitors, reflecting the role of Aspen as a destination market. The remaining
28% of passengers at ASE in 2018 were residents.
3.1 AIRLINES SERVING ASPEN
As shown on Figure 3-1, scheduled passenger airline service at ASE is seasonal, with more
scheduled departures during the peak season (January through March). The three airlines
serving the Airport—American, Delta, and United—each provided year-round service in 2018
and 2019.
Figure 3-1
Passenger Airlines Serving Aspen
Aspen/Pitkin County Airport
Note: Skywest Airlines operates all scheduled flights at ASE as a regional affiliate of United, Delta, and American.
Source: OAG Worldwide Aviation Ltd, online database, accessed May 2019. Advance airline schedules are
subject to change.
0
5
10
15
20
25
30
35
40
J F M A M J J A S O N D J F M A M J J A S O N D J F M A M J J A S O N D
2017 2018 2019
Ave
rage
da
ily
sch
ed
ule
d d
ep
art
ure
s United Delta American

Aviation Activity Forecasts Draft (8/9/2019) Aspen/Pitkin County Airport 27
ASE
3.2 HISTORICAL PASSENGER TRENDS
Between 2000 and 2018, the number of destinations served nonstop at the Airport tripled,
from 3 to 10, as shown on Figure 3-2. Each of the 10 destinations served are connecting hubs
for American, Delta, and United (as shown in Figure 1-3), reflecting the role of ASE as a spoke
in airline route networks.
Figure 3-2
Historical Enplaned Passengers
Aspen/Pitkin County Airport
Source: U.S. Department of Transportation, online database, accessed April 2019.
The number of enplaned passengers at ASE increased an average of 2.0% per year between
2000 and 2018, with stronger growth between 2010 and 2018 (an average increase of 3.1%
per year), as shown in Table 3-1. The trend in seat capacity at ASE has been generally
consistent with passenger traffic growth, while average load factors (the percent of occupied
seats) have varied considerably. Aircraft size, in terms of seats per departure, has averaged
66 to 69 seats since 2010.
0
50
100
150
200
250
300
20
00
20
01
20
02
20
03
20
04
20
05
20
06
20
07
20
08
20
09
20
10
20
11
20
12
20
13
20
14
20
15
20
16
20
17
20
18
En
pla
ne
d p
ass
en
gers
(th
ou
san
ds)
Denver
Chicago O'Hare
Los Angeles LAX
Dallas/Fort Worth
Salt Lake City
Houston Intercontinental
San Francisco
Atlanta
Phoenix
Minneapolis/St. Paul
Other

Aviation Activity Forecasts Draft (8/9/2019) Aspen/Pitkin County Airport 28
ASE
Table 3-1
Historical Passenger Airline Activity
Aspen/Pitkin County Airport
Year
Enplaned
passengers Seats Departures
Load
factor
Average seats
per departure
2000 198,723 312,169 3,604 64% 87
2001 174,438 292,544 3,319 60% 88
2002 178,642 294,044 3,448 61% 85
2003 189,795 303,204 3,839 63% 79
2004 183,934 271,025 3,904 68% 69
2005 193,626 273,544 3,973 71% 69
2006 200,847 277,223 4,698 72% 59
2007 180,784 272,994 4,795 66% 57
2008 212,323 340,246 5,773 62% 59
2009 216,405 345,732 5,659 63% 61
2010 222,255 343,266 5,070 65% 68
2011 221,108 343,448 5,093 64% 67
2012 214,207 333,131 5,016 64% 66
2013 204,198 292,175 4,446 70% 66
2014 217,134 300,756 4,514 72% 67
2015 233,476 332,750 4,807 70% 69
2016 254,302 348,651 5,073 73% 69
2017 244,732 359,939 5,222 68% 69
2018 283,877 445,979 6,652 64% 67
January-March
2018 118,648 192,045 2,795 62% 69
2019 127,655 168,162 2,511 76% 67
Percent increase (decrease)
2010-2011 (0.5%) 0.1% 0.5% (0.6%) (0.4%)
2011-2012 (3.1) (3.0) (1.5) (0.1) (1.5)
2012-2013 (4.7) (12.3) (11.4) 8.7 (1.0)
2013-2014 6.3 2.9 1.5 3.3 1.4
2014-2015 7.5 10.6 6.5 (2.8) 3.9
2015-2016 8.9 4.8 5.5 4.0 (0.7)
2016-2017 (3.8) 3.2 2.9 (6.8) 0.3
2017-2018 16.0 23.9 27.4 (6.4) (2.7)
2018-2019 (a) 7.6 (12.4) (10.2) 22.9 (2.5)
Compound average percent increase (decrease)
2000-2005 (0.5%) (2.6%) 2.0 2.1 (4.5%)
2005-2010 2.8 4.6 5.0 (1.8) (0.3)
2010-2018 3.1 3.3 3.5 (0.2) (0.1)
2000-2018 2.0 2.0 3.5 0.0 (1.4)
(a) Represents the percent change for the first three months of 2019 (January through March).
Source: U.S. Department of Transportation, online database, accessed April 2019.
Aviation Activity Forecasts Draft (8/9/2019) Aspen/Pitkin County Airport 29
ASE
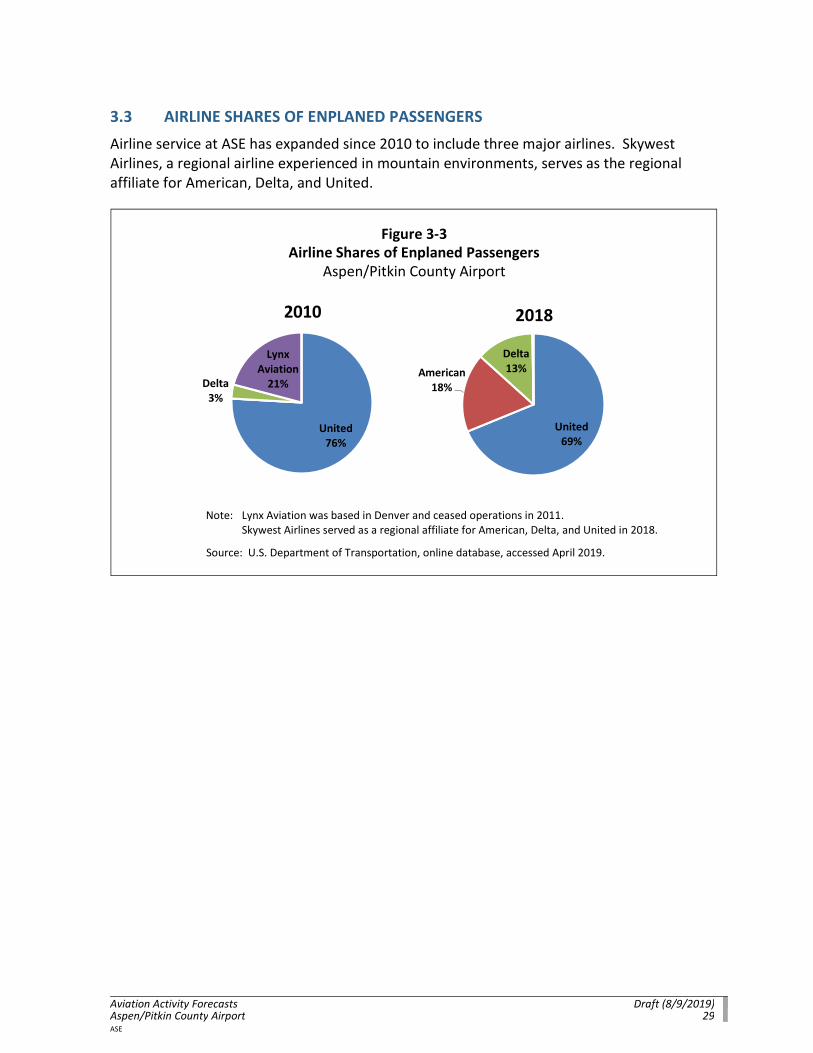
3.3 AIRLINE SHARES OF ENPLANED PASSENGERS
Airline service at ASE has expanded since 2010 to include three major airlines. Skywest
Airlines, a regional airline experienced in mountain environments, serves as the regional
affiliate for American, Delta, and United.
Figure 3-3
Airline Shares of Enplaned Passengers
Aspen/Pitkin County Airport
Note: Lynx Aviation was based in Denver and ceased operations in 2011.
Skywest Airlines served as a regional affiliate for American, Delta, and United in 2018.
Source: U.S. Department of Transportation, online database, accessed April 2019.
United
76%
Delta
3%
Lynx
Aviation
21%
2010
United
69%
American
18%
Delta
13%
2018

Aviation Activity Forecasts Draft (8/9/2019) Aspen/Pitkin County Airport 30
ASE
3.4 MONTHLY TRENDS IN PASSENGERS
Figure 3-4 shows monthly enplaned passenger data at ASE for January 2014 through March
2019. The monthly data show the seasonal variation in passenger traffic, with peak levels
occurring in January through March, and the lowest monthly activity in May, October, and
November.
Figure 3-4
Monthly Enplaned Passengers
Aspen/Pitkin County Airport
Source: U.S. Department of Transportation, online database, accessed April 2019.
3.5 ORIGIN-DESTINATION MARKETS AND AIRLINE SERVICE
Table 3-2 shows the top 20 origin-destination (O&D) markets for passengers starting or
ending their journeys at ASE in 2018. These 20 markets accounted for 75.3% of the total
outbound domestic O&D passengers at ASE in 2018.
The top three O&D markets at ASE—Los Angeles, New York, and Chicago—accounted for
13.7%, 11.0%, and 7.0%, respectively, of the outbound domestic O&D passengers in 2018.
Other major destinations include San Francisco, Houston, Dallas/Fort Worth, and Miami.
During the peak season in 2019 (January through March), eight of the top 20 O&D markets
were served nonstop at ASE, as shown on Table 3-2. During the peak season in 2018 (April
through December), six of the top 20 O&D markets were served nonstop at the Airport but
with half the number of daily departures as the peak season.
--
5
10
15
20
25
30
35
40
45
50
Jan Feb Mar Apr May Jun Jul Aug Sep Oct Nov Dec
En
pla
ne
d p
ass
en
gers
(th
ou
san
ds)
2014
2015
2016
2017
2018
2019

Aviation Activity Forecasts Draft (8/9/2019) Aspen/Pitkin County Airport 31
ASE
Table 3-2
Domestic Passenger Origin-Destination Patterns and Airline Service
Aspen/Pitkin County Airport
Percent of Average daily nonstop departures
Rank
Origin-destination
market
Air miles
from Aspen
outbound O&D
airline passengers
Peak Season (January-
March 2019)
Off Season (April-
December 2018)
1 Los Angeles (a) 737 13.7% 4 2
2 New York (b) 1,744 11.0 -- --
3 Chicago (c) 1,013 7.0 4 1
4 San Francisco (d) 848 5.8 2 1
5 Houston (e) 913 5.4 3 1
6 Dallas/Fort Worth (f) 701 4.8 3 1
7 Miami (g) 1,792 4.0 -- --
8 Washington D.C. (h) 1,574 3.8 -- --
9 Denver 125 2.9 7 6
10 Boston 1,879 2.6 -- --
11 Atlanta 1,304 2.0 1 --
12 Austin 812 1.9 -- --
13 San Diego 730 1.5 -- --
14 Philadelphia 1,681 1.4 -- --
15 Detroit 1,248 1.4 -- --
16 Phoenix 491 1.4 2 --
17 Seattle/Tacoma 960 1.3 -- --
18 Tampa 1,596 1.3 -- --
19 Minneapolis/St. Paul 802 1.2 -- --
20 Orlando 1,640 1.0 -- --
Markets listed 75.3% 26 11
Other markets 24.7 2 3
Total 100.0% 28 14
(a) Los Angeles International, Bob Hope, Ontario International, John Wayne (Orange County), and Long Beach airports.
(b) Newark Liberty International, LaGuardia, and John F. Kennedy International airports.
(c) Chicago O'Hare and Midway International airports.
(d) San Francisco, Oakland, and Mineta San Jose International airports.
(e) George Bush Intercontinental and Houston William P. Hobby airports.
(f) Dallas Fort Worth International Airport and Dallas Love Field.
(g) Miami International and Fort Lauderdale International airports.
(h) Regan Washington National, Baltimore/Washington International, and Washington Dulles International airports.
Sources: U.S. Department of Transportation, Origin-Destination Survey of Airline Passenger Traffic, Domestic, Databank
1A, online database, and U.S. Department of Transportation, online database, accessed April 2019.

Aviation Activity Forecasts Draft (8/9/2019) Aspen/Pitkin County Airport 32
ASE
3.6 AIRFARES
Recent trends in domestic one-way airfares (not adjusted for inflation) at ASE during the peak
and off-season are shown on Figure 3-5. Between 2010 and 2019, domestic airfares at ASE
during the peak season increased an average of 3.6% per year, slower than the growth in
domestic airfares during the off-season (an increase of 4.6% per year). U.S. average domestic
airfares are considerably lower than ASE and have remained relatively unchanged since 2010.
Figure 3-5
Domestic Average Airfares
Aspen/Pitkin County Airport
Note: Peak season—January through March; Off-season—April through December
Source: U.S. Department of Transportation, Origin-Destination Survey of Airline Passenger Traffic, Domestic,
Databank 1A, online database, accessed April 2019.
$-
$50
$100
$150
$200
$250
$300
$350
2010 2011 2012 2013 2014 2015 2016 2017 2018 2019
Ave
rage
on
e-w
ay
do
me
stic
air
fare
ASE Peak season ASE Off-season U.S. average
Aviation Activity Forecasts Draft (8/9/2019) Aspen/Pitkin County Airport 33
ASE
CHAPTER 4
HISTORICAL AIRCRAFT OPERATIONS AND BASED AIRCRAFT
This chapter summarizes historical aircraft operations for ASE, including air carrier, air taxi
and commuter, general aviation, and military operations. Aircraft operations data for ASE
were obtained from the FAA’s Air Traffic Activity System (ATADS).
4.1 TOTAL AIRCRAFT OPERATIONS
Table 4-1 presents total aircraft operations by type at ASE. From 2000 to 2018, total
commercial aircraft operations (air carrier and air taxi and commuter) at ASE increased from
14,831 to 21,104, an average increase of 2.0% per year. Commercial aircraft operations
accounted for 51.2% of total operations in 2018.
Total general aviation aircraft operations at ASE decreased between 2000 and 2018, from
33,748 to 19,867 (an average decrease of 2.9% per year).
Total military aircraft operations averaged 150 annual operations between 2000 and 2018.
4.2 BASED AIRCRAFT
ASE’s fixed base operator, Atlantic Aviation, conducted an inventory of based aircraft at ASE
in January 2019 and reported a total of 84 based aircraft in 2018, compared with 105 based
aircraft reported in the FAA’s 2018 TAF. Atlantic Aviation’s inventory includes detail by
aircraft type and tail number. Of the 84 based aircraft, 49 are single engine aircraft, 16 jet
aircraft, 17 multi-engine aircraft, and 2 helicopters. The forecasts of based aircraft at ASE
presented in Chapter 5 are based on Atlantic Aviation’s inventory since it is a detailed count.
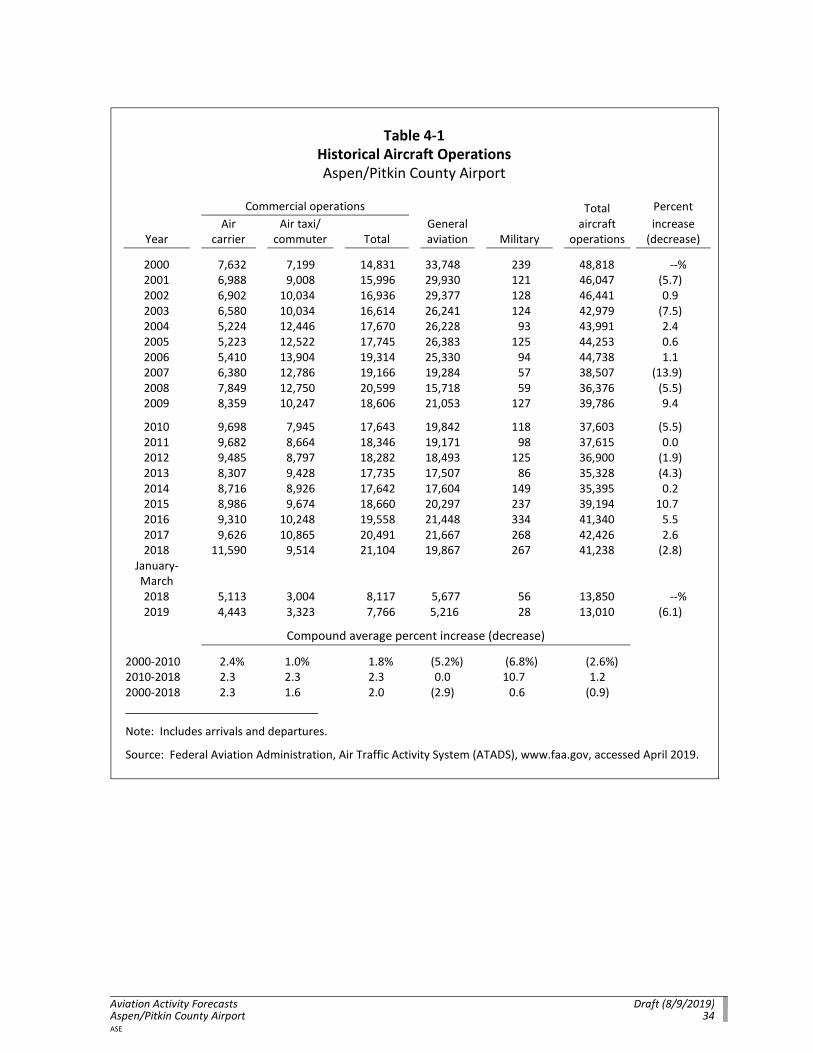
Aviation Activity Forecasts Draft (8/9/2019) Aspen/Pitkin County Airport 34
ASE
Table 4-1
Historical Aircraft Operations
Aspen/Pitkin County Airport
Commercial operations Total Percent
Year
Air
carrier
Air taxi/
commuter Total
General
aviation Military
aircraft
operations
increase
(decrease)
2000 7,632 7,199 14,831 33,748 239 48,818 --%
2001 6,988 9,008 15,996 29,930 121 46,047 (5.7)
2002 6,902 10,034 16,936 29,377 128 46,441 0.9
2003 6,580 10,034 16,614 26,241 124 42,979 (7.5)
2004 5,224 12,446 17,670 26,228 93 43,991 2.4
2005 5,223 12,522 17,745 26,383 125 44,253 0.6
2006 5,410 13,904 19,314 25,330 94 44,738 1.1
2007 6,380 12,786 19,166 19,284 57 38,507 (13.9)
2008 7,849 12,750 20,599 15,718 59 36,376 (5.5)
2009 8,359 10,247 18,606 21,053 127 39,786 9.4
2010 9,698 7,945 17,643 19,842 118 37,603 (5.5)
2011 9,682 8,664 18,346 19,171 98 37,615 0.0
2012 9,485 8,797 18,282 18,493 125 36,900 (1.9)
2013 8,307 9,428 17,735 17,507 86 35,328 (4.3)
2014 8,716 8,926 17,642 17,604 149 35,395 0.2
2015 8,986 9,674 18,660 20,297 237 39,194 10.7
2016 9,310 10,248 19,558 21,448 334 41,340 5.5
2017 9,626 10,865 20,491 21,667 268 42,426 2.6
2018 11,590 9,514 21,104 19,867 267 41,238 (2.8)
January-
March
2018 5,113 3,004 8,117 5,677 56 13,850 --%
2019 4,443 3,323 7,766 5,216 28 13,010 (6.1)
Compound average percent increase (decrease)
2000-2010 2.4% 1.0% 1.8% (5.2%) (6.8%) (2.6%)
2010-2018 2.3 2.3 2.3 0.0 10.7 1.2
2000-2018 2.3 1.6 2.0 (2.9) 0.6 (0.9)
Note: Includes arrivals and departures.
Source: Federal Aviation Administration, Air Traffic Activity System (ATADS), www.faa.gov, accessed April 2019.
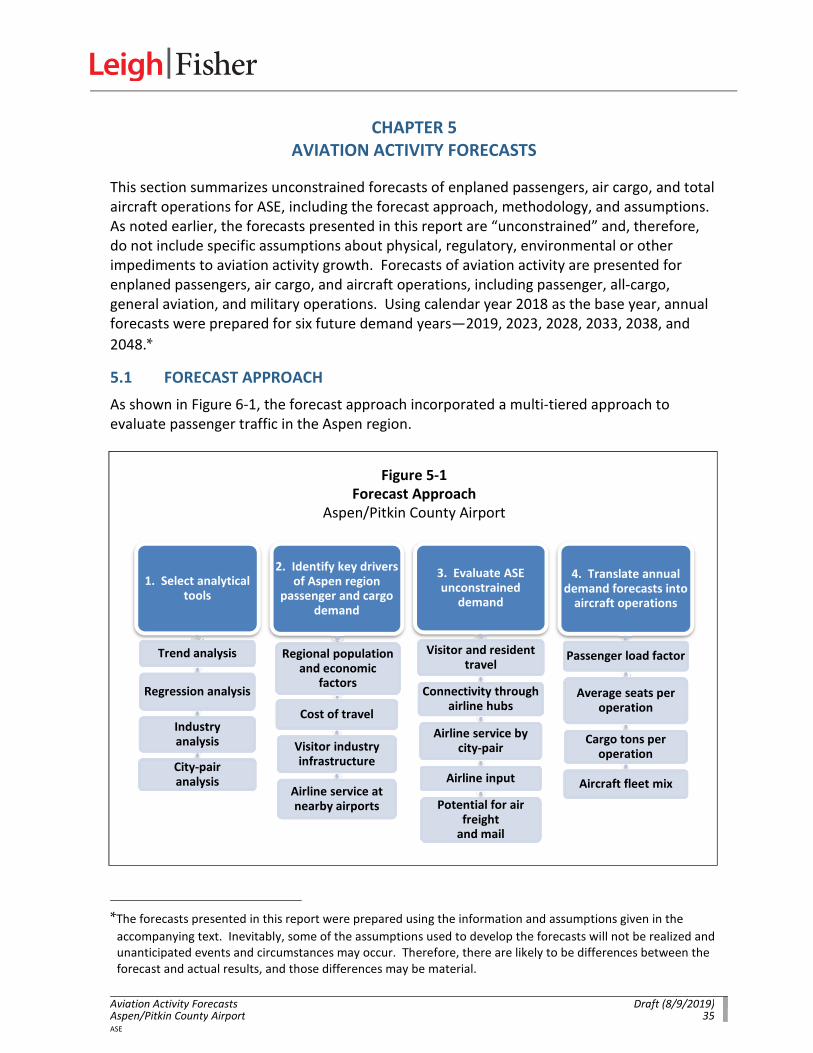
Aviation Activity Forecasts Draft (8/9/2019) Aspen/Pitkin County Airport 35
ASE
CHAPTER 5
AVIATION ACTIVITY FORECASTS
This section summarizes unconstrained forecasts of enplaned passengers, air cargo, and total
aircraft operations for ASE, including the forecast approach, methodology, and assumptions.
As noted earlier, the forecasts presented in this report are “unconstrained” and, therefore,
do not include specific assumptions about physical, regulatory, environmental or other
impediments to aviation activity growth. Forecasts of aviation activity are presented for
enplaned passengers, air cargo, and aircraft operations, including passenger, all-cargo,
general aviation, and military operations. Using calendar year 2018 as the base year, annual
forecasts were prepared for six future demand years—2019, 2023, 2028, 2033, 2038, and
2048.*
5.1 FORECAST APPROACH
As shown in Figure 6-1, the forecast approach incorporated a multi-tiered approach to
evaluate passenger traffic in the Aspen region.
Figure 5-1
Forecast Approach
Aspen/Pitkin County Airport
*The forecasts presented in this report were prepared using the information and assumptions given in the
accompanying text. Inevitably, some of the assumptions used to develop the forecasts will not be realized and
unanticipated events and circumstances may occur. Therefore, there are likely to be differences between the
forecast and actual results, and those differences may be material.
1. Select analytical tools
Trend analysis
Regression analysis
Industry analysis
City-pair analysis
2. Identify key drivers of Aspen region
passenger and cargo demand
Regional population and economic
factors
Cost of travel
Visitor industry infrastructure
Airline service at nearby airports
3. Evaluate ASE unconstrained
demand
Visitor and resident travel
Connectivity through airline hubs
Airline service by city-pair
Airline input
Potential for air freight
and mail
4. Translate annual demand forecasts into
aircraft operations
Passenger load factor
Average seats per operation
Cargo tons per operation
Aircraft fleet mix

Aviation Activity Forecasts Draft (8/9/2019) Aspen/Pitkin County Airport 36
ASE
U.S. Department of Transportation records (i.e., Schedule T100) were used as the basis for
the enplaned passenger, air cargo, and commercial airline aircraft operations forecasts.
Federal Aviation Administration, Air Traffic Activity System (ATADS) data were used as the
basis for the total aircraft operations forecasts.
It was recognized that no one approach would provide input on all key factors that affect
passenger and cargo activity in the Aspen region. For example, an econometric analysis
would provide input on the relationships between historical passengers and regional
economic conditions but little to no input on such factors as (1) the role of individual markets
in airline scheduling and service decisions, (2) recent trends in the airline industry that have
affected an airline’s decisions in route planning and aircraft acquisition, and (3) new service
development at the Airport. Input on these factors is important to the development of
reliable forecasts that can serve as the basis for planning efforts at the Airport.
5.2 ENPLANED PASSENGERS
Forecasts of enplaned passengers were developed taking into account analyses of the
economic basis for airline traffic, analyses of historical airline traffic, and an assessment of
the key factors that may affect future airline traffic, as discussed previously. The key factors
influencing the trends in enplaned passengers at ASE include:
• The role of Aspen as a destination market with visitors accounting for 72% of
passenger traffic; the remaining 28% by residents in 2018
• The strong seasonality of aviation activity with 42% of ASE’s 2018 passengers
enplaned during the peak season (January through March)
• The influence of external factors such as snowfall, the availability of lodging
accommodations, competing service at nearby airports, airline networks and regional
aircraft fleets, and the significant use of private aircraft for air travel to and from
Aspen
Econometric model was one tool that was used to evaluate the relationship between ASE’s
historical passenger trends to economic and airline industry metrics. Typically, a passenger
regression model includes an income variable (e.g., total personal income, per capita income,
or GDP—all expressed in constant dollars) and a cost of travel variable (e.g., yield or airfare—
also expressed in constant dollars). The primary objective is to represent the two key
variables that affect air travel demand, i.e., how much people have to spend and how much it
costs to travel. Other variables may be important as well, depending on the traffic market
characteristics.
5.2.1 Economic Drivers
Economic drivers such as total income, per capita personal income, population, and
employment were evaluated in relation to the historical trends in ASE enplaned passengers.
As shown in Figure 5-2, economic drivers accounted for 18% to 64% of the historical variation
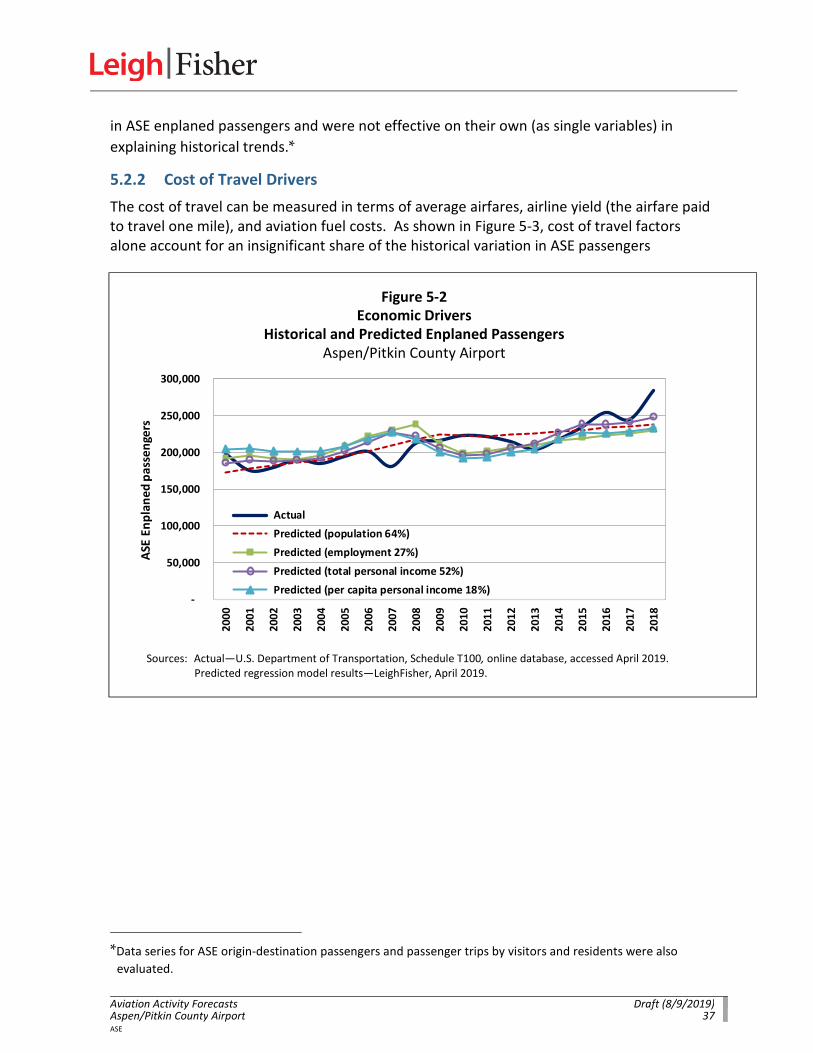
Aviation Activity Forecasts Draft (8/9/2019) Aspen/Pitkin County Airport 37
ASE
in ASE enplaned passengers and were not effective on their own (as single variables) in
explaining historical trends.*
5.2.2 Cost of Travel Drivers
The cost of travel can be measured in terms of average airfares, airline yield (the airfare paid
to travel one mile), and aviation fuel costs. As shown in Figure 5-3, cost of travel factors
alone account for an insignificant share of the historical variation in ASE passengers
Figure 5-2
Economic Drivers
Historical and Predicted Enplaned Passengers
Aspen/Pitkin County Airport
Sources: Actual—U.S. Department of Transportation, Schedule T100, online database, accessed April 2019.
Predicted regression model results—LeighFisher, April 2019.
*Data series for ASE origin-destination passengers and passenger trips by visitors and residents were also
evaluated.
-
50,000
100,000
150,000
200,000
250,000
300,000
20
00
20
01
20
02
20
03
20
04
20
05
20
06
20
07
20
08
20
09
20
10
20
11
20
12
20
13
20
14
20
15
20
16
20
17
20
18
ASE
En
pla
ne
d p
ass
en
gers
Actual
Predicted (population 64%)
Predicted (employment 27%)
Predicted (total personal income 52%)
Predicted (per capita personal income 18%)

Aviation Activity Forecasts Draft (8/9/2019) Aspen/Pitkin County Airport 38
ASE
Figure 5-3
Cost of Travel
Historical and Predicted Enplaned Passengers
Aspen/Pitkin County Airport
Sources: Actual—U.S. Department of Transportation, Schedule T100, online database, accessed April 2019.
Predicted regression model results—LeighFisher, April 2019.
-
50,000
100,000
150,000
200,000
250,000
300,0002
00
0
20
01
20
02
20
03
20
04
20
05
20
06
20
07
20
08
20
09
20
10
20
11
20
12
20
13
20
14
20
15
20
16
20
17
20
18
ASE
En
pla
ne
d p
ass
en
gers
Actual
Predicted (ASE airfares -4%)
Predicted (ASE yield -4%)
Predicted (Domestic aviation fuel cost 6%)
Predicted (System aviation fuel cost 5%)

Aviation Activity Forecasts Draft (8/9/2019) Aspen/Pitkin County Airport 39
ASE
5.2.3 Resort Destination Drivers
The influence of a ski resort destination such as Aspen can be measured in terms of the
number of skier days and average annual snowfall. As shown in Figure 5-4, resort destination
factors alone account for an insignificant share of the historical variation in ASE passengers
Figure 5-4
Resort Destination Drivers
Historical and Predicted Enplaned Passengers
Aspen/Pitkin County Airport
Sources: Actual—U.S. Department of Transportation, Schedule T100, online database, accessed April 2019.
Predicted regression model results—LeighFisher, April 2019.
5.2.4 Representative Model
The historical trend in enplaned passengers at ASE relates strongly to the predicted values
from a regression model which includes population in the Aspen region and airline yield at
ASE, in constant dollars, as shown on Figure 5-5. The forecasts of enplaned passengers at ASE
were based on projections of population in the Aspen region prepared by the Colorado
Department of Local Affairs (DOLA), presented in Table 2-1, and projections of ASE airfares
based on the FAA’s national forecasts.
-
50,000
100,000
150,000
200,000
250,000
300,000
20
00
20
01
20
02
20
03
20
04
20
05
20
06
20
07
20
08
20
09
20
10
20
11
20
12
20
13
20
14
20
15
20
16
20
17
20
18
ASE
En
pla
ne
d p
ass
en
gers
Actual
Predicted (Aspen skier days 37%)
Predicted (Snowfall 1%)

Aviation Activity Forecasts Draft (8/9/2019) Aspen/Pitkin County Airport 40
ASE
Figure 5-5
Representative Model
Historical and Predicted Enplaned Passengers
Aspen/Pitkin County Airport
Sources: Actual—U.S. Department of Transportation, Schedule T100, online database, accessed April 2019.
Predicted regression model results—LeighFisher, April 2019.
5.2.5 Enplaned Passenger Forecast Assumptions
In general, it was assumed that, in the long term, changes in airline traffic at the Airport will
occur largely as a function of the numbers of visitors, the level of airline service in terms of
available scheduled seats, the number of hotel rooms, and other infrastructure supporting
the visitor base. It was also assumed that continued development of airline service at the
Airport will not be constrained by the availability of aviation fuel, long-term limitations in
airline fleet capacity, limitations in the capacity of the air traffic control system or the Airport,
or government policies or actions that restrict growth. Also considered were recent and
potential developments in the national economy and in the air transportation industry as
they have affected or may affect airline traffic at the Airport.
For 2019 through 2048, it was assumed that:
1. The Aspen region will continue to be a premier ski resort destination and a popular
destination for outdoor recreation such as hiking, fishing, and camping.
2. Growth in lodging infrastructure in the Aspen region will be limited and may
represent a potential constraint on the growth in tourism.
3. The U.S. GDP growth will average 2.0% per year, as presented in Chapter 2,
“Economic Basis for Airline Traffic”.
-
50,000
100,000
150,000
200,000
250,000
300,0002
00
0
20
01
20
02
20
03
20
04
20
05
20
06
20
07
20
08
20
09
20
10
20
11
20
12
20
13
20
14
20
15
20
16
20
17
20
18
ASE
En
pla
ne
d p
ass
en
gers
Actual
Predicted from a regression model that explains 90% of the historical variation in
ASE enplaned passengers

Aviation Activity Forecasts Draft (8/9/2019) Aspen/Pitkin County Airport 41
ASE
4. Aviation fuel prices will increase by the end of 2019, following recent crude oil price
declines and uncertainty about global oil demand growth.* Aviation fuel prices will
increase at moderate rates but remain below the record prices reached in mid-2008,
reflecting reduced consumption levels, technological advances, and the availability of
previously unexplored resources.
5. Shortages in the number of regional airline pilots will not limit airline service at ASE
during the forecast period.
6. Any airline consolidation that may occur during the forecast period will not have a
material impact on the level of passenger activity at the Airport.
7. A generally stable international political environment and safety and security
precautions will ensure airline traveler confidence in aviation without imposing
unreasonable inconveniences.
8. There will be no major disruption of airline service or airline travel behavior as a result
of airline bankruptcies or liquidations, international hostilities, terrorist acts or
threats, or public health crises.
5.2.6 Enplaned Passenger Forecasts
As shown in Table 5-1 and on Figure 5-6, the number of enplaned passengers at ASE are
forecast to increase from 283,877 in 2018 to 449,100 in 2048, increasing an average of 1.5%
per year. Peak season passenger traffic is forecast to increase an average of 2.2% per year
between 2018 and 2048, compared with an average increase of 1.0% per year for off season
passengers. In 2048, the peak season will account for 50% of annual enplaned passengers,
compared with 42% in 2018.
5.3 AIR CARGO
According to the U.S. Department of Transportation, no air cargo data have been reported
for ASE since 2008. The FAA’s TFMSC data show a small number of freight operations in 2018
and previous years by regional aircraft such as the Beech 1900. For the purposes of this
forecast, it was assumed that:
• Intermittent air cargo service by regional aircraft will continue and increase gradually
through 2048 and that the air cargo transported will be reported to the USDOT.
• Air cargo carried by passenger airlines (belly cargo) will be added with the operation
of small narrowbody aircraft at ASE such as the A319 and A220-100.
As shown in Table 5-1, total air cargo is forecast to reach 23,383 tons in 2048.
*In its June 11, 2019 Short-Term Energy Outlook, the U.S. Energy Information Administration projected crude oil
prices, in terms of West Texas Intermediate oil, to average $59 per barrel in 2019 and $63 in 2020, down from
$65 per barrel in 2018, but up from $43 and $51 per barrel in 2016 and 2017, respectively.

Aviation Activity Forecasts Draft (8/9/2019) Aspen/Pitkin County Airport 42
ASE
Table 5-1
Aviation Activity Forecasts Aspen/Pitkin County Airport
Historical Estimated Forecast CAGR 2018-
2018 2019 (a) 2023 2028 2033 2038 2048 2048
ENPLANED PASSENGERS
Peak Season (January-March) 118,631 126,600 143,100 161,100 178,100 193,400 225,200 2.2%
Off Season (April-December) 165,219 178,400 183,900 193,200 201,700 209,200 223,900 1.0%
Total enplaned passengers 283,877 305,000 327,000 354,300 379,800 402,600 449,100 1.5%
Percent change/CAGR 7.5% 1.8% 1.6% 1.4% 1.2% 1.1%
TOTAL AIR CARGO (TONS) (b)
Passenger airlines (belly cargo) -- -- -- -- 19,878 21,624 23,062 --
All-cargo airlines -- -- 14 21 39 79 321 --
Total air cargo -- -- 14 21 19,918 21,704 23,383 --
BASED AIRCRAFT
Single 49 49 47 45 43 41 39 -0.8%
Jet 16 16 18 20 23 26 31 2.2%
Multi 17 17 18 19 20 21 23 1.0%
Helicopter 2 2 2 2 2 2 2 0.0%
Other -- -- -- -- -- -- -- --
Total based aircraft 84 84 85 86 88 90 95 0.4%
FORECAST ASSUMPTIONS
Load factor (percent of occupied seats)
Peak Season (January-March) 61.8% 75.0% 76.7% 79.2% 78.1% 78.6% 83.9% 1.0%
Off Season (April-December) 65.1% 66.2% 66.6% 67.2% 67.8% 68.3% 69.4% 0.2%
Total load factor 63.7% 70.0% 70.7% 72.2% 72.2% 72.9% 76.0% 0.6%
Average seats per operation
Peak Season (January-March) 68.8 67.6 68.8 82.9 84.9 86.8 87.5 0.8%
Off Season (April-December) 68.6 69.1 69.1 83.4 86.0 90.1 90.2 0.9%
Total average seats per operation 68.7 68.4 69.0 83.2 85.5 88.6 88.9 0.9%

Aviation Activity Forecasts Draft (8/9/2019) Aspen/Pitkin County Airport 43
ASE
Table 5-1 (page 2 of 3)
Aviation Activity Forecasts
Aspen/Pitkin County Airport
Historical Estimated Forecast CAGR
2018 2019 2023 2028 2033 2038 2048 2018-2048
FORECAST ASSUMPTIONS (continued)
Average air cargo per operation (tons)
Passenger airlines -- -- 1.750 1.750 1.750 1.750 1.750 --
All-cargo airlines -- -- 0.957 0.957 0.957 0.957 0.957 --
General aviation operations
per based aircraft 237 240 250 263 270 277 281 0.6%
AIRCRAFT OPERATIONS
Commercial operations
Air carrier
Passenger airlines
Peak Season (January-March) 5,580 5,000 5,420 4,910 5,370 5,670 6,140 0.3%
Off Season (April-December) 7,400 7,800 7,990 6,890 6,920 6,800 7,160 -0.1%
Total air carrier 12,980 12,800 13,410 11,800 12,290 12,470 13,300 0.1%
Air taxi
Unscheduled passenger operations
Peak Season (January-March) 3,106 3,170 3,420 3,720 4,020 4,290 4,760 1.4%
Off Season (April-December) 6,443 6,530 6,890 7,290 7,640 7,930 8,290 0.8%
Total passenger operations 9,549 9,700 10,310 11,010 11,660 12,220 13,050 1.0%
Air cargo 10 10 10 20 50 100 390 13.0%
Other 100 100 100 100 100 100 100 0.0%
Total air taxi 9,659 9,810 10,420 11,130 11,810 12,420 13,540 1.1%
Total commercial operations 22,639 22,610 23,830 22,930 24,100 24,890 26,840 0.6%

Aviation Activity Forecasts Draft (8/9/2019) Aspen/Pitkin County Airport 44
ASE
Table 5-1 (page 3 of 3)
Aviation Activity Forecasts Aspen/Pitkin County Airport
Historical Estimated Forecast CAGR
2018 2019 2023 2028 2033 2038 2048 2018-2048
AIRCRAFT OPERATIONS (continued)
General aviation
Itinerant
Peak Season (January-March) 4,649 4,690 4,850 5,020 5,150 5,260 5,340 0.5%
Off Season (April-December) 11,066 11,280 12,110 13,120 14,080 14,960 16,400 1.3%
Total itinerant 15,715 15,970 16,960 18,140 19,230 20,220 21,740 1.1%
Local
Peak Season (January-March) 1,028 1,050 1,130 1,240 1,340 1,450 1,640 1.6%
Off Season (April-December) 3,124 3,130 3,170 3,200 3,230 3,250 3,270 0.2%
Total local 4,152 4,180 4,300 4,440 4,570 4,700 4,910 0.6%
Total
Peak Season (January-March) 5,677 5,740 5,980 6,260 6,490 6,710 6,980 0.7%
Off Season (April-December) 14,190 14,410 15,280 16,320 17,310 18,210 19,670 1.1%
Total general aviation 19,867 20,150 21,260 22,580 23,800 24,920 26,650 1.0%
Military 267 300 300 300 300 300 300 0.4%
Total aircraft operations 42,773 43,060 45,390 45,810 48,200 50,110 53,790 0.8%
CAGR = Compound annual growth rate
(a) Based on actual data for January through March and advance published airline schedules for April through December.
(b) Data for air cargo tonnage were not reported for 2018 although freight operations occurred based on FAA TFMSC data.
Sources: Historical and Estimated--U.S. Department of Transportation, Schedule T100, online database, OAG Aviation Worldwide Ltd, online
database, Federal Aviation Administration, Air Traffic Activity System (ATADS), all accessed May through June 2019.
Forecast--LeighFisher, June 2019.

Aviation Activity Forecasts DRAFT (8/9/2019)
Aspen/Pitkin County Airport 45
ASE
Figure 5-6
Forecasts of Enplaned Passengers
Aspen/Pitkin County Airport
Source: LeighFisher, April 2019.
5.4 BASED AIRCRAFT
According to ASE’s fixed base operator, a total of 84 aircraft were based at the Airport in 2018,
including 16 jet aircraft and 17 multi-engine aircraft which together account for nearly 40% of all
based aircraft. The number aircraft based at ASE is forecast to increase an average of 0.4% per year
between 2018 and 2048, consistent with the FAA’s National Aerospace Forecasts published in
March 2019. In 2048, a total of 95 aircraft are forecast to be based at ASE.
5.5 TOTAL AIRCRAFT OPERATIONS FORECASTS
Table 5-1 and Figure 5-7 summarize the forecasts of total aircraft operations at the Airport,
including commercial, general aviation, and military aircraft operations. Total aircraft operations
are forecast to increase an average of 0.8% per year from 42,773 operations in 2018 to 53,790
operations in 2048. Commercial aircraft operations, including air carrier and air taxi operations, are
forecast to increase from 22,639 operations in 2018 to 26,840 operations in 2048, reflecting
continued gradual development of commercial passenger airline service at the Airport. In 2048,
commercial aircraft operations are forecast to account for approximately 50% of total Airport
operations.
0
100,000
200,000
300,000
400,000
500,000
600,0002
00
0
20
02
20
04
20
06
20
08
20
10
20
12
20
14
20
16
20
18
20
20
20
22
20
24
20
26
20
28
20
30
20
32
20
34
20
36
20
38
20
40
20
42
20
44
20
46
20
48
En
pla
ne
d p
ass
en
gers
Peak Season (January-March) (CAGR 2018-2048 = 2.2%)
Off Season (April-December) (CAGR 2018-2048 = 1.0%)
Historical Forecast

Aviation Activity Forecasts DRAFT (8/9/2019)
Aspen/Pitkin County Airport 46
ASE
Figure 5-7
Historical and Forecast Total Aircraft Operations Aspen/Pitkin County Airport
Note: Includes air carrier, air taxi, general aviation, and military operations.
Sources: Historical— Federal Aviation Administration, Air Traffic Activity System (ATADS),
www.faa.gov, accessed April 2019.
Forecast—LeighFisher, April 2019.
5.5.1 Passenger Airline Departures
Passenger aircraft operations include total departures and arrivals performed by regional affiliate
aircraft in the service of transporting passengers, as shown in Table 5-1. Passenger airline aircraft
operation forecasts were calculated by dividing the enplaned passenger forecasts by the estimated
number of passengers enplaned per departure. In 2018, the estimated average number of
passengers enplaned per departure for the Airport as a whole was approximately 43.8 and is
derived by multiplying the load factor by the average seats per departure (e.g., 63.7% x 68.7 =
43.8). This number is expected to increase slowly over the forecast period based on an estimated
increase in the average number of seats per aircraft and an estimated load factor, or percent of
available seats filled with passengers. The average number of passengers enplaned per departure
is expected to reach approximately 67.6 in 2048. Dividing the enplaned passenger forecasts by the
forecast number of passengers enplaned per departure yields passenger airline aircraft departure
forecasts. The forecast departures were then multiplied by two to yield passenger airline aircraft
operations for each category of activity.
0
10,000
20,000
30,000
40,000
50,000
60,0002
00
0
20
02
20
04
20
06
20
08
20
10
20
12
20
14
20
16
20
18
20
20
20
22
20
24
20
26
20
28
20
30
20
32
20
34
20
36
20
38
20
40
20
42
20
44
20
46
20
48
Air
cra
ft o
pe
rati
on
s
Military (CAGR 2018-2048 = 0.4%)
General aviation (CAGR 2018-2048 = 1.0%)
Commercial aircraft (CAGR 2018-2048 = 0.8%)
Historical Forecast

Aviation Activity Forecasts DRAFT (8/9/2019)
Aspen/Pitkin County Airport 47
ASE
Figure 5-8 presents the forecasts of passenger airline operations by airplane design group (ADG).*
Starting in 2028, narrowbody aircraft such as the A319 and A220-100 in ADG III are forecast to be
used passenger service at ASE.
Figure 5-8
Forecasts of Passenger Airline Aircraft Operations
Aspen/Pitkin County Airport
Source: LeighFisher, April 2019.
5.6 AIRCRAFT FLEET FORECASTS
Table 5-2 summarizes the passenger airline fleet mix for 2018 and for the forecast years (2019,
2023, 2028, 2033. 2038, and 2048) by Airplane Design Group (ADG).
*Airplane Design Group (ADG). A classification of aircraft based on wingspan and tail height. When the aircraft
wingspan and tail height fall in different groups, the higher group is used. FAA Advisory Circular, AC 150/5300-13A,
February 26, 2014.
-
2,000
4,000
6,000
8,000
10,000
12,000
14,000
16,000
20
14
20
16
20
18
20
20
20
22
20
24
20
26
20
28
20
30
20
32
20
34
20
36
20
38
20
40
20
42
20
44
20
46
20
48
Co
mm
erc
ial
air
cra
ft o
pe
rati
on
s
ADG III ADG II
Historical Forecast

Aviation Activity Forecasts Draft (87/9/2019)
Aspen/Pitkin County Airport 48
ASE
Table 5-2
Forecasts of Aircraft Fleet Mix by Airplane Design Group Aspen/Pitkin County Airport
Historical Estimated Forecast CAGR 2018-
2018 2019 (a) 2023 2028 2033 2038 2048 2048
COMMERCIAL OPERATIONS
(PASSENGER AND ALL-CARGO AIRLINES)
Peak Season (January-March) ADG II
CRJ700 5,580 5,000 5,420 -- -- -- -- -100.0%
Cessna 208 Caravan (cargo) -- -- -- -- -- 10 80 --
Total ADG II 5,580 5,000 5,420 -- -- 10 80 -13.2%
ADG III
A319 -- -- -- 720 800 1,050 1,210 --
A220-100 -- -- -- 310 190 210 230 --
E175 -- -- -- 3,880 4,380 4,410 4,700 --
Total ADG III -- -- 4,910 5,370 5,670 6,140 --
Total Peak Season 5,580 5,000 5,420 4,910 5,380 5,680 6,210 0.4%
Off Season (April-December) ADG II
CRJ700 7,400 7,800 7,990 2,870 460 -- -- -100.0%
Cessna 208 Caravan (cargo) 10 10 10 20 50 90 310 12.1%
Total ADG II 7,410 7,810 8,000 2,890 510 90 310 -10.0%
ADG III
A319 -- -- -- 980 1,020 1,460 1,550 --
A220-100 -- -- -- 570 580 590 630 --
E175 -- -- -- 2,470 4,850 4,740 4,970 --
Total ADG III -- -- 4,020 6,450 6,800 7,160 --
Total Off Season 7,410 7,810 8,000 6,910 6,960 6,890 7,470 0.0%

Aviation Activity Forecasts Draft (87/9/2019)
Aspen/Pitkin County Airport 49
ASE
Table 5-2 (page 2 of 10)
Forecasts of Aircraft Fleet Mix by Airplane Design Group Aspen/Pitkin County Airport
Historical Estimated Forecast CAGR
2018 2019 2023 2028 2033 2038 2048 2018-2048
COMMERCIAL OPERATIONS (CONTINUED)
Total (January-December)
ADG II
CRJ700 12,980 12,800 13,410 2,870 460 -- -- -100.0%
Cessna 208 Caravan (cargo) 10 10 10 20 50 100 390 13.0%
Total ADG II 12,990 12,810 13,420 2,890 510 100 390 -11.0%
ADG III
A319 -- -- -- 1,700 1,820 2,510 2,760 --
A220-100 -- -- -- 880 780 800 860 --
E175 -- -- -- 6,350 9,230 9,160 9,670 --
Total ADG III -- -- -- 8,930 11,830 12,470 13,290 --
Total 12,990 12,810 13,420 11,820 12,340 12,560 13,680 0.2%
Percent of commercial operations
Peak Season (January-March)
ADG II 100% 100% 100% 0% 0% 0% 1%
ADG III 0% 0% 0% 100% 100% 100% 99%
Total Peak Season 100% 100% 100% 100% 100% 100% 100%
Off Season (April-December)
ADG II 100% 100% 100% 42% 7% 1% 4%
ADG III 0% 0% 0% 58% 93% 99% 96%
Total Off Season 100% 100% 100% 100% 100% 100% 100%
Total (January-December)
ADG II 100% 100% 100% 24% 4% 1% 3%
ADG III 0% 0% 0% 76% 96% 99% 97%
Total 100% 100% 100% 100% 100% 100% 100%

Aviation Activity Forecasts Draft (87/9/2019)
Aspen/Pitkin County Airport 50
ASE
Table 5-2 (page 3 of 10)
Forecasts of Aircraft Fleet Mix by Airplane Design Group Aspen/Pitkin County Airport
Historical Estimated Forecast CAGR
2018 2019 2023 2028 2033 2038 2048 2018-2048
AIR TAXI OPERATIONS
Peak Season (January-March)
ADG I
E550 - Eclipse 550 49 49 48 49 49 48 44 -0.4%
H25B - BAe HS 125/700-800 38 37 36 36 35 33 27 -1.1%
LJ45 - Bombardier Learjet 45 33 33 31 30 29 27 20 -1.7%
Other 40 40 39 38 38 36 30 -0.9%
Total ADG I 159 159 155 154 150 143 121 -0.9%
ADG II
E55P - Embraer Phenom 300 534 545 590 644 698 747 833 1.5%
CL30 - Challenger 300 434 443 480 524 569 609 680 1.5%
C680 - Cessna Citation Sovereign 403 412 446 487 529 566 633 1.5%
C56X - Cessna Excel/XLS 379 387 419 458 497 533 596 1.5%
CL35 - Challenger 300 294 301 327 357 388 416 467 1.5%
Other 775 791 856 933 1,010 1,080 1,203 1.5%
Total ADG II 2,818 2,879 3,118 3,403 3,690 3,950 4,412 1.5%
ADG III
GLEX - BD-700 Global Express 77 80 88 97 107 117 134 1.8%
GL5T - BD-700 Global 5000 51 52 59 66 73 80 94 2.0%
Total ADG III 128 132 147 163 180 197 228 1.9%
Total Peak Season 3,106 3,170 3,420 3,720 4,020 4,290 4,760 1.4%

Aviation Activity Forecasts Draft (87/9/2019)
Aspen/Pitkin County Airport 51
ASE
Table 5-2 (page 4 of 10)
Forecasts of Aircraft Fleet Mix by Airplane Design Group Aspen/Pitkin County Airport
Historical Estimated Forecast CAGR
2018 2019 2023 2028 2033 2038 2048 2018-2048
AIR TAXI OPERATIONS (CONTINUED)
Off Season (April-December) 3,106 3,170 3,420 3,720 4,020 4,290 4,760
ADG I
E550 - Eclipse 550 113 112 110 109 107 103 100 -0.4%
C25A - Cessna Citation CJ2 77 76 72 69 64 59 54 -1.2%
E50P - Embraer Phenom 100 41 39 33 28 22 15 8 -5.4%
Other 62 61 56 52 47 41 35 -1.9%
Total ADG I 293 289 272 258 240 218 198 -1.3%
ADG II
E55P - Embraer Phenom 300 1,330 1,349 1,427 1,513 1,589 1,652 1,731 0.9%
CL30 - Challenger 300 842 855 905 961 1,011 1,052 1,104 0.9%
C56X - Cessna Excel/XLS 730 740 785 834 877 913 958 0.9%
CL35 - Challenger 300 605 614 652 693 729 760 799 0.9%
C680 - Cessna Citation Sovereign 577 586 622 662 697 726 763 0.9%
Other 1,770 1,795 1,897 2,011 2,110 2,194 2,297 0.9%
Total ADG II 5,854 5,939 6,287 6,673 7,013 7,298 7,651 0.9%
ADG III
GLEX - BD-700 Global Express 150 153 166 179 191 202 215 1.2%
GL5T - BD-700 Global 5000 137 140 152 164 176 186 198 1.2%
GLF5 - Gulfstream V/G500 8 9 14 18 23 27 32 4.6%
Total ADG III 296 303 332 362 390 415 445 1.4%
Total Off Season 6,443 6,530 6,890 7,290 7,640 7,930 8,290 0.8%
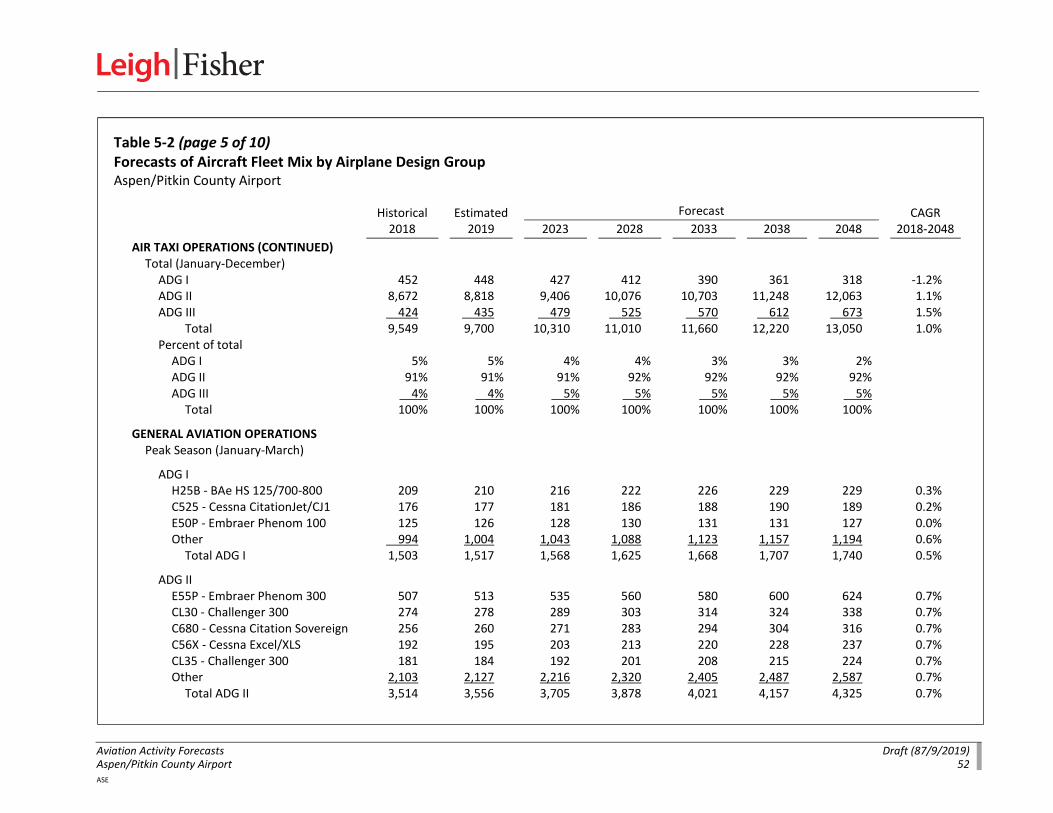
Aviation Activity Forecasts Draft (87/9/2019)
Aspen/Pitkin County Airport 52
ASE
Table 5-2 (page 5 of 10)
Forecasts of Aircraft Fleet Mix by Airplane Design Group Aspen/Pitkin County Airport
Historical Estimated Forecast CAGR
2018 2019 2023 2028 2033 2038 2048 2018-2048
AIR TAXI OPERATIONS (CONTINUED)
Total (January-December) 6,443 6,531 6,891 7,293 7,643 7,931 8,294
ADG I 452 448 427 412 390 361 318 -1.2%
ADG II 8,672 8,818 9,406 10,076 10,703 11,248 12,063 1.1%
ADG III 424 435 479 525 570 612 673 1.5%
Total 9,549 9,700 10,310 11,010 11,660 12,220 13,050 1.0%
Percent of total
ADG I 5% 5% 4% 4% 3% 3% 2%
ADG II 91% 91% 91% 92% 92% 92% 92%
ADG III 4% 4% 5% 5% 5% 5% 5%
Total 100% 100% 100% 100% 100% 100% 100%
GENERAL AVIATION OPERATIONS
Peak Season (January-March)
ADG I
H25B - BAe HS 125/700-800 209 210 216 222 226 229 229 0.3%
C525 - Cessna CitationJet/CJ1 176 177 181 186 188 190 189 0.2%
E50P - Embraer Phenom 100 125 126 128 130 131 131 127 0.0%
Other 994 1,004 1,043 1,088 1,123 1,157 1,194 0.6%
Total ADG I 1,503 1,517 1,568 1,625 1,668 1,707 1,740 0.5%
ADG II
E55P - Embraer Phenom 300 507 513 535 560 580 600 624 0.7%
CL30 - Challenger 300 274 278 289 303 314 324 338 0.7%
C680 - Cessna Citation Sovereign 256 260 271 283 294 304 316 0.7%
C56X - Cessna Excel/XLS 192 195 203 213 220 228 237 0.7%
CL35 - Challenger 300 181 184 192 201 208 215 224 0.7%
Other 2,103 2,127 2,216 2,320 2,405 2,487 2,587 0.7%
Total ADG II 3,514 3,556 3,705 3,878 4,021 4,157 4,325 0.7%

Aviation Activity Forecasts Draft (87/9/2019)
Aspen/Pitkin County Airport 53
ASE
Table 5-2 (page 6 of 10)
Forecasts of Aircraft Fleet Mix by Airplane Design Group Aspen/Pitkin County Airport
Historical Estimated Forecast CAGR
Historical Estimated Forecast CAGR
2018 2019 2023 2028 2033 2038 2048 2018-2048
GENERAL AVIATION OPERATIONS (CONTINUED)
ADG III
GLEX - BD-700 Global Express 284 287 302 320 336 352 375 0.9%
GLEX - BD-700 Global Express 181 184 194 208 220 231 250 1.1%
GLEX - BD-700 Global Express 102 104 111 121 129 138 153 1.3%
Other 93 94 101 110 118 126 141 1.4%
Total ADG III 660 669 708 759 804 847 919 1.1%
Total Peak Season 5,677 5,740 5,980 6,260 6,490 6,710 6,980 0.7%
Off Season (April-December) 5,677 5,743 5,981 6,263 6,493 6,711 6,983
ADG I
E550 - Eclipse 550 528 532 549 565 578 584 581 0.3%
C25A - Cessna Citation CJ2 387 389 397 403 406 403 386 0.0%
E50P - Embraer Phenom 100 384 386 394 400 402 400 382 0.0%
Other 2,723 2,761 2,913 3,090 3,255 3,401 3,624 1.0%
Total ADG I 4,021 4,069 4,252 4,458 4,640 4,789 4,972 0.7%
ADG II E55P - Embraer Phenom 300 941 957 1,017 1,090 1,159 1,222 1,327 1.2%
CL30 - Challenger 300 686 698 743 797 848 895 975 1.2%
C56X - Cessna Excel/XLS 644 655 697 749 797 841 916 1.2%
CL35 - Challenger 300 515 524 558 600 639 675 737 1.2%
C680 - Cessna Citation Sovereign 506 515 549 590 628 664 725 1.2%
Other 5,188 5,270 5,591 5,975 6,340 6,673 7,216 1.1%
Total ADG II 8,480 8,620 9,154 9,802 10,412 10,969 11,896 1.1%

Aviation Activity Forecasts Draft (87/9/2019)
Aspen/Pitkin County Airport 54
ASE
Table 5-2 (page 7 of 10)
Forecasts of Aircraft Fleet Mix by Airplane Design Group Aspen/Pitkin County Airport
Historical Estimated Forecast CAGR
2018 2019 2023 2028 2033 2038 2048 2018-2048
GENERAL AVIATION OPERATIONS (CONTINUED)
Off Season (April-December)
ADG III GLEX - BD-700 Global Express 624 636 684 747 809 870 979 1.5%
GL5T - BD-700 Global 5000 440 450 487 536 586 634 725 1.7%
GLF5 - Gulfstream V/G500 286 294 321 359 398 437 511 1.9%
Other 339 347 377 419 462 504 584 1.8%
Total ADG III 1,689 1,727 1,868 2,060 2,255 2,445 2,798 1.7%
Total Off Season 14,190 14,410 15,280 16,320 17,310 18,210 19,670 1.1%
Total (January-December) ADG I 5,524 5,586 5,820 6,083 6,308 6,496 6,712 0.7%
ADG II 11,994 12,176 12,859 13,680 14,433 15,127 16,221 1.0%
ADG III 2,349 2,396 2,576 2,819 3,058 3,291 3,717 1.5%
Total 19,867 20,150 21,260 22,580 23,800 24,920 26,650
Percent of total 19,867 20,158 21,255 22,583 23,799 24,914 26,649
ADG I 28% 28% 27% 27% 27% 26% 25%
ADG II 60% 60% 60% 61% 61% 61% 61%
ADG III 12% 12% 12% 12% 13% 13% 14%
Total 100% 100% 100% 100% 100% 100% 100%
MILITARY OPERATIONS
ADG I F18S - F18 Hornet 6 6 6 6 6 6 6 0.4%
LJ31 - Bombardier Learjet 31/A/B 2 3 3 3 3 3 3 0.4%
F22 - Boeing Raptor F22 4 5 5 5 5 5 5 0.4%
TEX2 - Raytheon Texan 2 11 12 12 12 12 12 12 0.4%
C172 - Cessna Skyhawk 172 4 4 4 4 4 4 4 0.4%
Other 26 30 30 30 30 30 30 0.4%
Total ADG I 53 60 60 60 60 60 60 0.4%

Aviation Activity Forecasts Draft (87/9/2019)
Aspen/Pitkin County Airport 55
ASE
Table 5-2 (page 8 of 10)
Forecasts of Aircraft Fleet Mix by Airplane Design Group Aspen/Pitkin County Airport
Historical Estimated Forecast CAGR
2018 2019 2023 2028 2033 2038 2048 2018-2048
MILITARY OPERATIONS (CONTINUED) ADG II
B350 - Beech Super King Air 350 24 27 27 27 27 27 27 0.4%
DHC6 - DeHavilland Twin Otter 10 11 11 11 11 11 11 0.4%
C560 - Cessna Citation V/Ultra/Encore 10 11 11 11 11 11 11
C750 - Cessna Citation X 6 7 7 7 7 7 7 0.4%
C550 - Cessna Citation II/Bravo 2 3 3 3 3 3 3 0.4%
Other 81 91 91 91 91 91 91 0.4%
Total ADG II 133 149 149 149 149 149 149 0.4%
ADG III
GLF5 - Gulfstream V/G500 63 71 71 71 71 71 71 0.4%
P3 - Lockheed P-3C Orion 2 2 2 2 2 2 2 0.4%
B737 - Boeing 737-700 1 1 1 1 1 1 1 0.4%
GL5T - BD-700 Global 5000 1 1 1 1 1 1 1 0.4%
Total ADG III 67 76 76 76 76 76 76 0.4%
ADG IV
C30J - C-130J Hercules 11 12 12 12 12 12 12 0.4%
C130 - Lockheed 130 Hercules 2 2 2 2 2 2 2 0.4%
C17 - Boeing Globemaster 3 2 2 2 2 2 2 2 0.4%
Total ADG IV 14 16 16 16 16 16 16 0.4%
Total military operations 267 300 300 300 300 300 300 0.4%

Aviation Activity Forecasts Draft (87/9/2019)
Aspen/Pitkin County Airport 56
ASE
Table 5-2 (page 9 of 10)
Forecasts of Aircraft Fleet Mix by Airplane Design Group Aspen/Pitkin County Airport
Historical Estimated Forecast CAGR
2018 2019 2023 2028 2033 2038 2048 2018-2048
AIRPORT TOTAL AIRCRAFT OPERATIONS
(EXCLUDING MILITARY)
Peak Season (January-March) ADG I 1,663 1,676 1,723 1,779 1,818 1,850 1,860 0.4%
ADG II 11,912 11,435 12,244 7,282 7,711 8,118 8,816 -1.0%
ADG III 788 801 855 5,832 6,354 6,713 7,286 7.7%
Total Peak Season 14,363 13,913 14,821 14,893 15,883 16,681 17,963 0.7%
Off Season (April-December)
ADG I 4,314 4,358 4,524 4,717 4,881 5,006 5,170 0.6%
ADG II 21,744 22,369 23,441 19,365 17,934 18,357 19,857 -0.3%
ADG III 1,985 2,030 2,200 6,442 9,094 9,660 10,403 5.7%
Total Off Season 28,043 28,756 30,165 30,523 31,909 33,023 35,430 0.8%
Total (January-December)
ADG I 5,977 6,034 6,247 6,496 6,699 6,856 7,030 0.5%
ADG II 33,656 33,804 35,685 26,646 25,645 26,475 28,674 -0.5%
ADG III 2,773 2,831 3,055 12,274 15,448 16,373 17,689 6.4%
Total (January-December) 42,406 42,669 44,986 45,416 47,792 49,705 53,393 0.8%
Percent of Airport total aircraft operations
Peak Season (January-March)
ADG I 12% 12% 12% 12% 11% 11% 10%
ADG II 83% 82% 83% 49% 49% 49% 49%
ADG III 5% 6% 6% 39% 40% 40% 41%
Total Peak Season 100% 100% 100% 100% 100% 100% 100%
ADG II 83% 82% 83% 49% 49% 49% 49%

Aviation Activity Forecasts Draft (87/9/2019)
Aspen/Pitkin County Airport 57
ASE
Table 5-2 (page 10 of 10)
Forecasts of Aircraft Fleet Mix by Airplane Design Group Aspen/Pitkin County Airport
Historical Estimated Forecast CAGR
2018 2019 2023 2028 2033 2038 2048 2018-2048
AIRPORT TOTAL AIRCRAFT OPERATIONS
(EXCLUDING MILITARY) (CONTINUED)
Percent of Airport total aircraft operations00) (91) (104) (94) (108) (105) (97)
Off Season (April-December)
ADG I 15% 15% 15% 15% 15% 15% 15%
ADG II 78% 78% 78% 63% 56% 56% 56%
ADG III 7% 7% 7% 21% 29% 29% 29%
Total Off Season 100% 100% 100% 100% 100% 100% 100%
Total (January-December)
ADG I 14% 14% 14% 14% 14% 14% 13%
ADG II 79% 79% 79% 59% 54% 53% 54%
ADG III 7% 7% 7% 27% 32% 33% 33%
Total (January-December) 100% 100% 100% 100% 100% 100% 100%
CAGR = Compound annual growth rate
Note: Totals may not add due to rounding.
Air taxi, general aviation, and military operations are based on the percent distribution of TFMSC operations by equipment type.
Sources: Historical and Estimated--U.S. Department of Transportation, Schedule T100, online database, OAG Aviation Worldwide Ltd, online
database, Federal Aviation Administration, Traffic Flow Management System Counts (TFMSC), Aviation System Performance Metrics (ASPM),
and Air Traffic Activity System (ATADS), all accessed May through June 2019.
Forecast--LeighFisher, June 2019.

Aviation Activity Forecasts Draft (8/9/2019) Aspen Pitkin County Airport 58
ASE
CHAPTER 6
COMPARISON WITH THE FAA 2018 TAF
Table 6-1 presents a comparison of the aviation demand forecasts prepared for Aspen/Pitkin
County Airport with the FAA 2018 TAF for the Airport. These unconstrained forecasts are the
“preferred” forecasts recommended for FAA approval and are compared for the components
of total enplaned passengers, commercial aircraft operations, and total aircraft operations.
The format of Table 6-1 is based on the template provided by the FAA for the comparison of
airport planning forecasts and the FAA TAF.* As required, the results are presented for the
base year of 2018 and forecast horizons years, which are equal to the base year plus 1, 5, 10,
and 15 years (2019, 2023, 2028, and 2033). The ASE unconstrained forecasts have been
compared graphically with the FAA 2018 TAF in the figures presented in Chapter 1 of this
report.
The key findings of the comparison of the ASE unconstrained aviation activity forecasts with
the FAA 2018 TAF are summarized below:
• The unconstrained forecasts for enplaned passengers at ASE are higher than the 2018
TAF in 2023 and 2028, as shown in Table 6-1. – In 2023, the variance is 15.9% – In 2028, the variance is 20.8% – This large variance reflects passenger traffic growth faster than forecast in 2018
and year-to-date 2019 since the FAA 2018 TAF was prepared. – In 2018, actual enplaned passengers totaled 283,877 according to USDOT data,
4.2% greater than the forecast of 272,461 in the FAA 2018 TAF – In 2019, the FAA 2018 TAF forecast a 1.0% decrease in ASE enplaned passengers,
compared with an actual increase of 7.6% during the first three months of 2019 (January through March) according to USDOT data
• The unconstrained forecast of commercial operations for ASE is greater than the 2018
TAF in 2023 but lower in 2028: – The variance is 7.1% in 2023 – The variance is -1.4% in 2028
• The unconstrained forecast of total aircraft operations for ASE is greater than the 2018
TAF in 2023 and 2028: – The variance is 2.7% in 2023 – The variance is 0.1% in 2028
• Except for the passengers forecast variance due to faster growth in 2018 and 2019, the
ASE unconstrained forecasts are similar to the FAA 2018 TAF for the Airport and “differ
by less than 10 percent in the 5-year forecast period, and 15 percent in the 10-year
forecast period,” as stipulated in the FAA forecast guidance.
*U.S. Department of Transportation, Federal Aviation Administration, Forecasting Aviation Activity by Airport,
2019 July 2001, and Review and Approval of Aviation Forecasts, June 2008, http://www.faa.gov.

Aviation Activity Forecasts Draft (8/9/2019) Aspen Pitkin County Airport 59
ASE
Table 6-2 presents a summary of the ASE unconstrained forecasts using a second template
provided by the FAA.
Table 6-1
FAA TAF Forecast Comparison
Aspen/Pitkin County Airport
2018 – 2033
Year (a)
ASE planning
forecasts
FAA 2018
TAF
ASE forecasts
vs. 2018 TAF
(percent variance)
Passenger enplanements
Base yr. 2018 283,877 272,461 4.2%
Base yr. + 5yrs. 2023 327,000 282,045 15.9%
Base yr. + 10yrs. 2028 354,300 293,413 20.8%
Base yr. + 15yrs. 2033 379,800 306,919 23.7%
Commercial operations (b)
Base yr. 2018 22,639 21,267 6.5%
Base yr. + 5yrs. 2023 23,830 22,246 7.1%
Base yr. + 10yrs. 2028 22,930 23,258 -1.4%
Base yr. + 15yrs. 2033 24,100 24,386 -1.2%
Total operations (c)
Base yr. 2018 42,773 42,222 1.3%
Base yr. + 5yrs. 2023 45,390 44,201 2.7%
Base yr. + 10yrs. 2028 45,810 45,787 0.1%
Base yr. + 15yrs. 2033 48,200 47,511 1.5%
n.a. = not available
(a) The ASE enplaned passenger forecasts were prepared on a calendar year basis and the FAA 2018
TAF was prepared on a U.S. government fiscal year basis (October through September).
(b) Commercial operations include operations by passenger airlines, all-cargo airlines, and air taxi
operators.
(c) Total operations include commercial operations plus operations by general aviation and military.
Sources: ASE planning forecasts—LeighFisher, April 2019.
FAA 2018 TAF for ASE—U.S. Department of Transportation, Federal Aviation
Administration, www.faa.gov, accessed April 2019.

Aviation Activity Forecasts Draft (8/9/2019)
Aspen/Pitkin County Airport 60
ASE
Table 6-2
Summary of ASE Planning Forecasts Using FAA Template
Aspen/Pitkin County Airport
ASE planning forecast Average annual compound growth rates
Base year
Base year
+ 1 year
Base year
+ 5 years
Base year
+ 10 years
Base year
+ 15 years
Base year to
+1 year
Base year to
+5 years
Base year to
+10 years
Base year to
+15 years
2018 2019 2023 2028 2033 2018 - 2019 2018 - 2032 2018 - 2028 2018 - 2033
Passenger enplanements (millions)
Air carrier (a) -- -- -- 105,800 113,000 -- -- -- --
Commuter (b) 283,877 305,970 327,000 248,500 266,800 7.8% 2.9% -1.3% -0.4%
Total 283,877 305,970 327,000 354,300 379,800 7.8% 2.9% 2.2% 2.0%
Aircraft operations (thousands) Itinerant
Air carrier 12,980 12,800 13,410 11,800 12,290 -1.4% 0.7% -0.9% -0.4%
Commuter/air taxi 9,659 9,810 10,420 11,130 11,810 1.6% 1.5% 1.4% 1.3%
Total commercial operations 22,639 22,610 23,830 22,930 24,100 -0.1% 1.0% 0.1% 0.4%
General aviation 15,715 15,970 16,960 18,140 19,230 1.6% 1.5% 1.4% 1.4%
Military 267 300 300 300 300 12.4% 2.4% 1.2% 0.8%
Local General aviation 4,152 4,180 4,300 4,440 4,570 0.7% 0.7% 0.7% 0.6%
Military -- -- -- -- -- -- -- -- --
Total operations 42,773 43,060 45,390 45,810 48,200 0.7% 1.2% 0.7% 0.8%
Cargo/mail (enplaned + deplaned tons) -- -- 14 21 5,149 -- -- -- --
Based Aircraft Single-engine (nonjet) 49 49 47 45 43 0.0% -0.8% -0.8% -0.9%
Multiengine (nonjet) 17 17 18 19 20 0.0% 1.1% 1.1% 1.1%
Jet engine 16 16 18 20 23 0.0% 2.4% 2.3% 2.4%
Helicopter 2 2 2 2 2 0.0% 0.0% 0.0% 0.0%
Other -- -- -- -- -- -- -- -- --
Total 84 84 85 86 88 0.0% 0.2% 0.2% 0.3%
Operational factors Average aircraft size (seats)
Air Carrier (a) -- -- -- 116 122 -- -- -- --
Commuter (b) 69 68 69 74 76 -0.5% 0.1% 0.7% 0.6%
Average enplaning load factor Air Carrier (a) -- -- -- 71% 71% -- -- -- --
Commuter (b) 71% 71% 71% 73% 73% 0.2% -0.1% 0.3% 0.2%
GA operations per based aircraft 237 240 250 263 270 1.4% 1.1% 1.1% 0.9%
Note: The ASE planning forecasts were prepared on a calendar year basis and the FAA 2018 TAF was prepared on a U.S. government fiscal year basis (October through September).
(a) Includes mainline and charter airline activity as summarized in the previous tables in this report.
(b) Includes regional affiliate airline activity, which includes flights using regional aircraft with more than 60 seats.
Sources: ASE planning forecasts—LeighFisher, April 2019. FAA 2018 TAF for ASE—U.S. Department of Transportation, Federal Aviation Administration, www.faa.gov, accessed April 2019.

Aviation Activity Forecasts Aspen/Pitkin County Airport A-1
ASE