avian predation at a southern rockhopper penguin colony on
TRANSCRIPT

AVIAN PREDATION AT A SOUTHERN ROCKHOPPER PENGUIN COLONY ON STATEN ISLAND, ARGENTINA
Marcela Liljesthröm
A Thesis Submitted to the University North Carolina Wilmington in Partial Fulfillment
Of the Requirements for the Degree of Master of Science
Department of Biology and Marine Biology
University of North Carolina Wilmington
2005
Approved by
Advisor Committee
Dr. Mark Galizio, Dr. Michael McCartney and Dr. Adrián Schiavini
Dr. Steve Emslie
Chair
Accepted by
Dr. Robert Roer Dean, Graduate School

TABLE OF CONTENTS
ABSTRACT................................................................................................................................... iv
ACKNOWLEDGMENTS ...............................................................................................................v
LIST OF TABLES......................................................................................................................... vi
LIST OF FIGURES ...................................................................................................................... vii
INTRODUCTION ...........................................................................................................................1
METHODS ......................................................................................................................................3
Study Area ..............................................................................................................................3
Nest Observations ...................................................................................................................9
Hypotheses Testing...............................................................................................................10
Statistical Analyses ...............................................................................................................12
RESULTS ......................................................................................................................................13
Predators/Scavengers Using Rockhopper Penguin Subcolonies ..........................................13
Temporal Variation in Activity Rates...................................................................................17
Weather and Activity Rates ..................................................................................................23
Predation and Nest Location.................................................................................................23
Activity Rates and Subcolony Size.......................................................................................27
Nest checks: Nest Success, Chick Mortality and Nest Predation .........................................34
DISCUSSION................................................................................................................................39
Striated Caracaras .................................................................................................................39
Other Predator/Scavengers....................................................................................................42
Activity Rate and Subcolony Size ........................................................................................43
Impact of Predation...............................................................................................................44
ii

LITERATURE CITED ..................................................................................................................50
iii

ABSTRACT
The association between avian predation on Southern Rockhopper Penguins (Eudyptes
chrysocome chrysocome) and subcolony size was examined during the chick-rearing period. In
addition, activities of various predator and scavenger species at these subcolonies was
documented and quantified for the first time. Subcolonies ranging from 69 to 1520 nests were
observed for 461 and 386 hr, respectively, during December 2003 and 2004. Striated Caracaras
(Phalocoboenus australis) were the most common predator/scavenger in all subcolonies except
for two in which Kelp Gulls (Larus dominicanus) and Dolphin Gulls (Larus scoresbii) were
dominant. The greatest numbers of predation and attempted predation events were observed on
the functional and geometric edge of the subcolony. Kelp Gulls were only observed approaching
central nests from the air. Striated Caracaras were mostly observed approaching nests on the
geometric and functional edge from peripheral and central tussocks, respectively. In both years
nest success was correlated with subcolony size. Small subcolonies in which predation was
observed had a proportionally higher predation rate (predation rate per nest) than larger
subcolonies with similar absolute predation rates, suggesting that if predation does occur,
subcolonies may lower their predation risk by a dilution effect, once they have reached some
minimum size. Subcolonies can also have zero or low predation risk when surrounded by larger
subcolonies or when part of the territory of a Striated Caracara. Within each subcolony, nests in
central locations of large subcolonies or those on the geometric edge of embankments seem to be
the most protected from predation.
iv

ACKNOWLEDGMENTS
I would like to thank my committee and advisor for their assistance and suggestions
during the thesis writing. I am especially grateful to Dr. Dargan Frierson from the Statistics
Department at UNCW for his patience and help with the statistical analyses. Special thanks to
Soledad Albanese, Carlos Cabrera, Christine Calleri, Carolina Gargiulo, Fernanda Malacrida,
and Marcelo Turus, who assisted in the field and put up with endless observation hours under
difficult weather conditions. “La Colina de la Vida” will long be remembered by all of us. I
would also like to thank Jonathan Meiburg and Andrea Raya Rey for sharing their observations
on Striated Caracaras and Rockhopper Penguins at Staten Island. The National Geographic
Society provided financial support for the field work, and the Argentinean Navy and the
“Ushuaia” tour vessel provided transportation to and from Staten Island. Finally, special thanks
go to my family and friends from Argentina for their support and encouragement along the way.
v

LIST OF TABLES Table Page 1. Mean number of nests in study subcolonies (SC1-9) during December
2003 and 2004.........................................................................................................................7
2. Predation (P) and attempted predation (AP) events on Rockhopper Penguin chicks by Striated Caracaras and Kelp Gulls at study subcolonies during 2003 and 2004 .......................................................................................25
3. Effect of subcolony size on nest success, chick mortality and nest predation in 2003 and 2004...................................................................................................35 4. Differences in nest success, chick mortality and nest predation between
large and small subcolonies and between different nest locations within large or small subcolonies in 2003 and 2004........................................................................37 5. Effect of subcolony size and nest location on nest success, chick mortality and nest predation in 2003 and 2004 .....................................................................................38
vi
LIST OF FIGURES Figure Page 1. Location of the two Rockhopper Penguin colonies (open squares) on Staten Island, Argentina.........................................................................................................4 2. Aerial photo looking over part of the Rockhopper Penguin colony at Bahía Franklin....................................................................................................................6 3. Location of the study subcolonies (SC 1-9, black circles) and camp site (black square) at Bahía Franklin .............................................................................................8 4. Percent of total activity events (searches, predation, attempts and
scavenging) by predator/scavenger species at all subcolonies combined during 2003 and 2004 ........................................................................................................14
5. Percent of total activity events (searches, predation, attempts and scavenging) at each subcolony in 2003 and 2004 for each predator/scavenger species.................................................................................................16 6. Relative importance of different activities of the four most common predator/scavenger species on the penguin subcolonies during 2003 and 2004....................................................................................................................18 7. Total activity rates (searches, predation, attempts and scavenging events/hr) of predator/scavengers with time of day...........................................................19 8. Total activity rate (searches, predation, attempts and scavenging events/hr) of the four most common predator/scavenger species with time of season, divided into 12 (7-30 December in 2003) and 9 (8-25 December in 2004) two-day intervals ............................................................21 9. Daily predation and attempted predation rates (predation and attempt events/hr) by Striated Caracaras and Kelp Gulls on Southern Rockhopper Penguin chicks during 2003 and 2004 ..........................................................22 10. Total activity rate (searches, predation, attempts and scavenging events/hr) by Kelp Gulls for wind speeds observed during 8-25 December 2004 ..................................................................................................................24 11. Percent of total predation and attempted predation events (n=25 in 2003, n=46 in 2004) on Rockhopper penguin chicks by Striated Caracaras and Kelp Gulls during 2003 and 2004 ...............................................................................26
vii

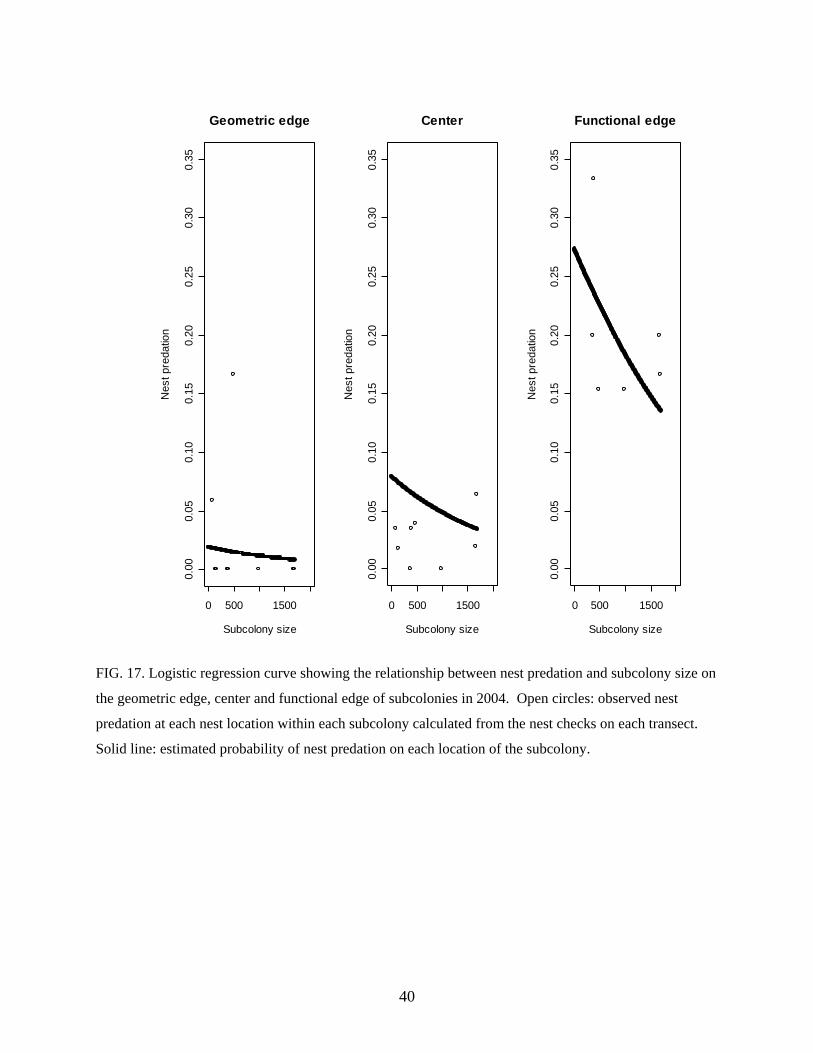
12. Encounter rate of all predator/scavenger species together on Rockhopper Penguin subcolonies in 2003 and 2004 ........................................................29 13. Individual attack rate (predation and attempt events per hr per nest) by Striated Caracaras and Kelp Gulls on Southern Rockhopper Penguin chicks ...................................................................................................................30 14. A: Observed predation rate (predation events per hr) and B: relative predation rate (predation events per hr per nest) by Striated Caracaras and Kelp Gulls on Southern Rockhopper Penguin chicks .................................................32 15. A: Estimated individual predation risk (predation events per searches per nest) Filled squares: 2003, open squares: 2004. B: Estimated individual predation risk for subcolonies in which predation events were observed .........................................................................................33 16. Logistic regression curve showing the relationship between nest success and subcolony size in 2003 and 2004 ................................................................................36 17. Logistic regression curve showing the relationship between nest predation and subcolony size on the geometric edge, center and functional edge of subcolonies in 2004 .............................................................................40
viii

INTRODUCTION
Among the proposed advantages of coloniality, reduced probability of predation is the
most widely studied. Animals living in colonies may lower rates of nest predation in several
ways: 1) by early detection of predators (given that group vigilance increases with the number of
individuals present), 2) by deterring predators through group mobbing and defense, 3) through
the “encounter effect” (decreasing the probability of detection by a predator), and/or 4) by
dilution of predation risk (“dilution effect”) either through synchronized reproduction, thus
swamping the ability of predators to exploit them, or by clustering nests to create the “selfish
herd effect” (see reviews in Wittenberger and Hunt 1985, Brown and Brown 2001). Hamilton’s
selfish herd model predicts that, if a predator always takes the prey item closest to it, prey will
seek to minimize the distance between themselves and their neighbors, and maximize the number
of neighbors (Hamilton 1971).
Several studies have shown lower predation at higher densities of prey or in larger
colonies (Spear 1993, Anderson and Hodum 1993, Hernández-Matías et al. 2003). Conversely,
other studies have shown an opposite trend (Stokes and Boersma 2000). The “selfish herd”
concept has been extended to predict the center as the optimal location for a nest in a colony.
Because peripheral nests have neighbors only on one side, individuals breeding at the edge of a
colony should suffer higher loses due to predation than individuals breeding near the center
(Tenaza 1971). In support of this concept, several authors have reported higher predation rates
on colony edges than on the center (Taylor 1962, Tenaza 1971, Spear 1993, Emslie et al. 1995,
Yorio and Quintana 1997), though others have shown the reverse (Bellinato and Bogliani 1995,
Brunton 1997) or even no differences in chick mortality between edge and central nests (Barbosa
et al. 1997).

Colonial breeding is most common among marine birds; of some 260 species, 98% nest
in colonies (Lack 1968). Effects of predators on colonial seabirds have been widely investigated
(see review by Wittenberger and Hunt, 1985). In penguins, impacts and activities of predators
have been studied in the Gentoo (Pygoscelis papua) and Adélie Penguins (Tenaza 1971, Davis
1982, Ainley et al. 1983, Young 1994, Emslie et al. 1995), King Penguin (Aptenodytes
patagonicus) (Hunter 1991, Le Bohec et al. 2003) and Chinstrap Penguin (Pygoscelis antarctica)
(Barbosa et al. 1997). These studies have provided contradictory results, indicating the
complexity of the predator-prey relationship.
Rockhopper Penguins (Eudyptes chrysocome) breed on sub-Antarctic and temperate
islands throughout the southern ocean (Williams 1995). Over the past years, the population has
undergone considerable declines at most of the islands where they nest (Woehler and Croxall
1997). The reasons for these trends are largely unknown, but some have been attributed to a drop
in sea surface temperatures, starvation prior to molt, and human activities such as commercial
fishing and pollution (see Pütz et al. 2002). This overall population decline has resulted in the
classification of Rockhopper Penguins as a vulnerable species, according to the International
Union for the Conservation of Nature (IUCN; Birdlife International 2000).
The southern subspecies (Eudyptes chrysocome chrysocome) breeds on the coasts of
southern South America and the Falkland (Malvinas) Islands, in approximately 52 locations
(Schiavini 2000). Staten Island (Isla de los Estados), east of the Tierra del Fuego archipelago,
has two of the three known breeding colonies for Argentina and, in contrast to the widespread
population decline, the population here appears to be stable or increasing with a total of 173,000
nests (27.3 % of the breeding population; Schiavini 2000).
2

Previous observations suggest that the Striated Caracara (Phalcoboenus australis) is an
important predator at Rockhopper Penguin colonies on Staten Island (J. Meiburg pers. comm.,
ML pers. obs.). The IUCN lists the Striated Caracara as Near-Threatened due to its small
numbers and restricted range (Birdlife International 2005). Its distribution includes isolated
shores and islands off southern South America (Narosky and Yzurieta 1987).
Here, I present data on the occurrence and impact of predator-scavengers associated with
Rockhopper Penguins on Staten Island to test the hypothesis that breeding in larger subcolonies
offers more protection to chicks against aerial predators than smaller ones. If so, I predict that
large subcolonies will experience less predation per individual than smaller ones and that
predation risk and nest predation will decrease with subcolony size. Additional objectives were
to document and quantify the activities of various predator and scavenger species associated with
Rockhopper Penguin subcolonies, evaluate seasonal and annual variation in these activities, and
analyze the predator- scavenger’s impact, through predation, on subcolonies of different sizes
during the chick rearing period. This information was used to determine if reduced predation is
an important advantage of colonial breeding in Rockhopper Penguins.
METHODS
Study Area
The study was conducted at Bahía Franklin, Staten Island (54° 50’ S, 64° 40.5’ W),
Argentina (Fig. 1), where the largest colony of Southern Rockhopper Penguins on the island
(167,000 breeding pairs in 102 subcolonies) is located (Schiavini 2000). Within colonies,
penguins form distinct nest aggregations or subcolonies that are easily identifiable on the ground
3

Argentina
NNN
Bahia Franklin
Island Staten
FIG. 1. Location of the two Rockhopper Penguin colonies (open squares) on Staten Island, Argentina.
4

or from aerial photos by differences in soil and vegetation modified by the bird’s activities (Fig.
2). Nests are distributed mainly on areas of tussock grass (Poa flabellata) which are found
surrounding the subcolonies (peripheral tussocks) and often scattered in the center (central
tussocks) as well.
Rockhopper Penguins arrive at the colony in late September, lay eggs in late October and
hatch chicks in late November (A. Raya Rey pers. comm.). The chick rearing period includes
the brooding or guard stage which extends from the end of November to mid December, and the
crèche stage which extends until the end of January/beginning of February. During the brooding
stage chicks are guarded at the nest mostly by the male. As chicks get older they are left
unguarded and form crèches (A. Raya Rey pers. comm.).
Eight subcolonies ranging from 69 to 1520 nests and nine subcolonies ranging from 72 to
1682 nests were observed during 7-30 December 2003 and 8-25 December 2004, respectively
(Table 1). Logistic constraints on visiting the colony prevented additional observations outside
of these time periods. Study subcolonies were chosen because of their relatively easy access
from the camp site, their near circular shape and their different sizes spread throughout the area
(Fig. 3). The size of each subcolony was estimated as the mean total number of occupied nests
(either by adults and chicks/eggs or by adults only), determined from repeated counts by
different observers during the first observation day. Subcolonies were observed for 3 hr periods
alternating periodically between 08:00-20:00 each day, by the author and three trained field
assistants.
5
Nest location was classified as geometric edge, functional edge or central. Those nests in
the most external ring of the subcolony and not completely surrounded by other nests were
considered as “geometric edge”; nests at least one nest away from the periphery of the subcolony

FIG. 2. Aerial photo looking over part of the Rockhopper Penguin colony at Bahía Franklin. The
subcolonies show up as lighter colored patches with easily identifiable limits, one of the subcolonies is
circled in red. (Photo by A. Schiavini, November 1998).
6

TABLE 1. Mean number of nests in study subcolonies (SC1-9) during December 2003 and 2004. SC9
was only observed in 2004.
year SC1 SC2 SC3 SC4 SC5 SC6 SC7 SC8 SC92003 69 506 929 1520 440 122 574 179 -2004 72 473 978 1660 386 132 361 145 1682
7

SC2
SC5
SC6
SC8
SC4
SC9
SC7
SC1
SC3
SC2
SC5
SC6
SC8
SC4
SC9
SC7SC2
SC5
SC6
SC8
SC4
SC9SC2
SC5
SC6
SC8
SC4
SC9SC2
SC5
SC6
SC8
SC4
SC9SC2
SC5
SC6
SC8
SC4
SC2
SC5
SC6
SC8
SC4
SC9
SC7
SC1
SC3
FIG. 3. Location of the study subcolonies (SC 1-9, black circles) and camp site (black square) at
Bahía Franklin.
8

and next to a tussock were considered as “functional edge”; and “central” nests were those at
least one nest away from the edge of the subcolony and not next to a tussock. Study subcolonies
< 200 nests only had geometric edge and central locations because no central tussocks were
present. Nests on the geometric edge can be accessed from a peripheral tussock, from the ground
or from the air while nests on the functional edge can be accessed from a central tussock or from
the air, and central nests can be accessed only from the air. Although nests with a functional
edge or central location could potentially be accessed from the ground, this seems unlikely since
little free ground space occurs between nests, making it difficult for a predator to land within the
subcolony. This functional definition allows study of the vulnerability of a nest to an aerial
predator’s attack.
Nest Observations
During each observation period species and activity of predators and scavengers were
recorded. Following the classification of Emslie et al. (1995), activities were classified as
searches, attempted predation, predation, scavenging and stored food retrieval. Searches were
recorded either when birds flew low (2 -11 m above the penguins) and circled slowly over the
subcolony (“search from air”), approached the subcolony near the edges on the ground (“search
from ground”) or when they stood on tussocks in the center or in the periphery of the subcolony
(“search from central or peripheral tussock”, respectively). Attempted predation occurred when
birds took and lost or attempted to take a chick and predation when a bird successfully took a
chick from the colony. It also was noted if attempts were from the air, from the ground, or from
a central/peripheral tussock. Scavenging was recorded when a predator fed on food remains in
or next to the colony; stored food retrieval was when predators took food remains stored in
9

central or peripheral tussocks back to their nests. For predation and attempted predation events,
penguins behavior and nest location within the subcolony also was recorded.
Activity rates were calculated as the number of events recorded per hour of observation.
To evaluate annual and seasonal variations in predator’s activities, these rates were determined
for each species and analyzed by year, subcolony, time of day (divided into four- 3 hr time
periods) and time of season (divided into 2-day intervals that included between 28-53 hr of
observations each and during which each subcolony had been observed at least twice). Rate
categories included total activities (searches, predation, attempts and scavenging) and searches
either by each species or for all species together. Predation and attempted predation events were
rare and were only observed for Striated Caracaras and Kelp Gulls (Larus dominicanus), thus
they were pooled and analyzed for both species together. Because predation rates may vary in
different weather conditions (Young 1994), and in 2003 it was observed that activity rates
seemed to vary with wind speed, wind speeds were recorded during all observations in 2004.
Hypotheses Testing
The encounter effect hypothesis, which predicts that the probability of encountering a
group is independent of group size, was tested using methods similar to Uetz and Hieber (1994).
An encounter was considered to occur each time a predator or a scavenger arrived at the
subcolony and searched for vulnerable or dead prey. Observed encounter rates (search rates by
all species together) at each subcolony were compared to the expected values obtained by
multiplying the encounter rate for the smallest subcolony by the size of each subcolony.
10

The impact of predation as a function of subcolony size was analyzed by using observed
activity events at each subcolony to calculate the following measures: predation rate as the total
number of predation events by all predators per hr, relative predation rate as the predation rate
divided by subcolony size, individual attack rate as the total number of attacks (predation and
attempted predation events by all predators) per hr divided by subcolony size, and individual
predation risk as the number of predation events by all predators divided by search events by all
predators divided by subcolony size. A double log plot of individual predation risk versus group
size yields a slope of -1, a result to be expected assuming a dilution effect with the probability of
attack per individual being inversely related to group size (Inman and Krebs 1987). Thus, the
predictions of the dilution effect hypothesis (a decrease of each individual’s probability of being
captured by being in a group) were tested by comparing the slope of the relationship between the
observed individual predation risk and subcolony size to the expected slope of - 1 (Uetz and
Hieber 1994).
A second approach to comparing the strategies of large vs. small subcolonies from the
viewpoint of the prey consisted of monitoring a sample of nests in each subcolony (except for
subcolonies < 140 nests, where all nests were monitored). Since the study was restricted to the
chick-rearing period, the only breeding variable recorded was the number of chicks surviving at
each nest during this period. At each subcolony, nests along a radial transect were plotted on a
map and monitored every 3 days in 2003 and every other day in 2004 until the crèche period.
Nest monitoring was completed by one observer with 8x10 binoculars from outside each
subcolony to minimize disturbances. The cause of chick death was listed as predation based on
observed predator attacks (which happened only once) or when chicks were missing from the
nest; if chicks were found dead next to the nest it was assumed that they had died by other causes
11

because during observed predation events chicks were always taken away from the nest by the
predator.
Nest monitoring data was used to estimate nest success (number of nests that had at least
one chick divided by the total number of nests on the transect), chick mortality (number of
chicks lost to predation or other causes divided by the total number of chicks on the transect) and
nest predation (number of nests that suffered chick predation divided by the total number of nests
on the transect that had a chick). For subcolonies < 140 nests, denominators in the above indices
were calculated using whole subcolony totals. These indices were estimated for each subcolony
and for the different nest locations within each subcolony (in the latter case they were calculated
with respect to the total number of nests/chicks on that nest location in the transect).
The effect of breeding in the geometric edge/functional edge/center of large subcolonies
or breeding in the functional edge/center of small subcolonies was compared by testing
differences in the three breeding variables between these different nest locations. Subcolonies
were classified as ‘large’ when > 200 nests (all of which also had central tussocks) or as ‘small’
when < 200 nests (none had central tussocks).
Statistical Analyses
Two-way ANOVAs without replication were used to analyze diurnal patterns in total
activity rates (with predator and time period as the main effects and predator mean activity rate
as a single replicate) and patterns in predation and attempted predation rates (with year and time
period as the main effects and predation and attempted predation rate as a single replicate).
Wilcoxon test was used to examine seasonal variations in activity rates. The correlations of
12

activity rates, wind speed, and subcolony size were tested using Spearman’s correlation
coefficient. Exact Chi-square tests were used to examine the proportion of observed predation
and attempted predation events and nest success, nest predation and chick mortality obtained
from transects for different nest locations. Effects of subcolony size, year and presence of
central tussocks on the occurrence of predation were examined by means of logistic regression
with predation outcome (no predation event observed or at least one predation event observed) as
a binary dependent variable. Logistic regression was also applied to quantify the relationships
between subcolony size and nest success, chick mortality and nest predation. Results from both
years were pooled when appropriate. A significance level of P < 0.05 was used for all statistical
tests. All analyses were completed using SAS 9.1 and JMPIN 3.2.6 software.
RESULTS
A total of 461 and 386 hr of observation were completed during the study periods of 2003
and 2004, respectively. Approximately equal numbers of observations were made in each of the
four time periods and similar numbers of observation periods were obtained for all subcolonies
each year (although there were some differences due to bad weather conditions).
Predator/Scavengers Using Rockhopper Penguin Subcolonies
The predator/scavenger community associated with Rockhopper Penguin subcolonies at
Staten Island included Striated Caracaras, Kelp Gulls, Dolphin Gulls (Larus scoresbii), Turkey
Vultures (Cathartes aura), Southern Giant Petrels (Macronectes giganteus), Chilean Skuas
(Catharacta chilensis) and Crested Caracaras (Polyborus plancus). In both years almost 50% of
the total activity events at all subcolonies combined were by Striated Caracaras (Fig. 4). Kelp
13

0
10
20
30
40
50
60
Sriated Caracara
Kelp Gull
Dolphin Gull
Turkey Vulture
Giant Petrel
Chilean Skua
Crested Caracara
N=2923 2003
0
10
20
30
40
50
60
Predator/scavenger species
Tota
l act
ivity
eve
nts
(%))
N=2025
202004
FIG. 4. Percent of total activity events (searches, predation, attempts and scavenging) by
predator/scavenger species at all subcolonies combined during 2003 and 2004.
14

Gulls, Dolphin Gulls and Turkey Vultures were the second most common species with 10-20 %
of the total activity events. Chilean Skuas, Giant Petrels and Crested Caracaras were rarely seen
and accounted for less than 5% of the total activity events. Striated Caracaras were the most
active predators in both years at all subcolonies except for subcolonies 8 (SC8) and 2 (SC2)
where Kelp Gulls and Dolphin Gulls dominated, respectively (Fig. 5). SC8 was the most
isolated from the other subcolonies (Fig. 3), the most exposed to the wind, the closest to the
water, and bordered a 10-15 m cliff on which Kelp Gulls nest. Subcolonies SC1, SC3, SC5, and
SC7 and subcolonies SC2, SC6 and SC9 were in close proximity to each other (Fig. 3) in an area
generally occupied by groups of adult/juvenile Striated Caracaras, Turkey Vultures and Crested
Caracaras. SC4 was about 400 m away from these last subcolonies and, instead, was part of the
feeding territory of a breeding pair of Striated Caracaras who would chase away any other
Striated Caracaras trying to approach the subcolony. The percent of total activities by Striated
Caracaras in consecutive years did not decrease significantly at SC 1, SC3, SC7 and SC8 (X2
test, all P > 0.05 and df = 1); but did so by 10-20 % at SC2, SC 5 and SC6 (X2 test, all P < 0.05
and df = 1). SC4 experienced a significant decrease of about 30% in Striated Caracara’s
activities from 2003 to 2004 (X2 = 82.831, P < 0.001, df = 1). In 2003 this subcolony was
occupied by a very active single adult breeding pair of Striated Caracaras, whose nest with three
chicks was next to the subcolony. In 2004 their nest was in the same location, but had only one
chick and one egg which disappeared between 12-14 December. Subsequently, activities of the
breeding pair at SC4 decreased considerably compared to previous days and to 2003.
In both years, considering all subcolonies together, searching was the predominant
predator-scavenger activity recorded. For Kelp Gulls, Dolphin Gulls and Turkey Vultures, as
well as for the less common species (which were not analyzed), searching from the air was the
15

0
20
40
60
80
100
1_03
1_04
2_03
2_04
3_03
3_04
4_03
4_04
5_03
5_04
6_03
6_04
7_03
7_04
8_03
8_04
9_03
9_04
Subcolony_year
Tota
l act
ivity
eve
nts
(%))
others
Giant Petrel
Turkey Vulture
Dolphin Gull
Kelp Gull
Striated Caracara
FIG. 5. Percent of total activity events (searches, predation, attempts and scavenging) at each subcolony
in 2003 and 2004 for each predator/scavenger species (1_03: SC 1 in 2003, etc). ’Others’ includes Crested
Caracara and Chilean Skua. (SC 9 was only observed in 2004).
16

predominant activity, accounting for over 85 % of their total activities (Fig. 6). Only in SC8
were Kelp Gulls occasionally observed searching from periphery tussocks. This subcolony had
only a few, very short tussocks compared to the rest of the subcolonies. For Striated Caracaras,
searches from the air and from peripheral tussocks were the most predominant activity
accounting for 30-50 % of their total activities, followed by searches from central tussocks which
comprised ~ 10 % of the total activities (Fig. 6). Striated Caracaras spent much of their time
perched on peripheral tussocks, possibly searching for dead or unattended chicks. Generally,
they would spend several minutes searching from a single or several peripheral tussocks before
moving to a central or peripheral tussock for their predation attempt. Average time spent on a
tussock before their attempt was 5 min, but some were observed remaining up to 25 min and
even 55 min on one occasion. Predation and attempted predation events were rare and were only
observed for Kelp Gulls (four attempts and one predation) and Striated Caracaras (32 attempts
and 34 predations).
Temporal Variation in Activity Rates
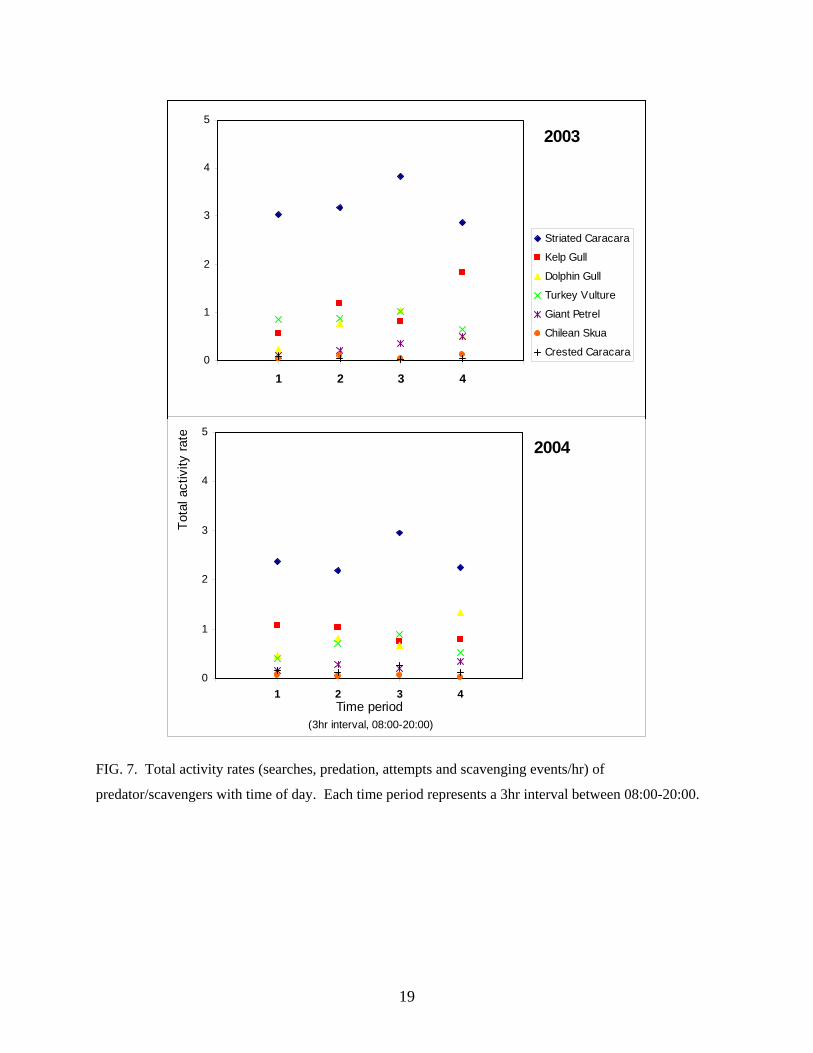
Total activity rates for Striated Caracaras were highest in the afternoon (time period 3,
14:00-17:00) however, there was no significant diurnal pattern in total activity rates for any of
the species (2003: F3,18 = 1.35, P = 0.29; 2004: F3,18 = 0.57, P = 0.64; Fig. 7). There was,
however, a significant species effect (2003: F6,18 = 53.57, P < 0.001; 2004: F6,18= 51.12, P <
0.001). In both years Striated Caracaras had a higher total activity rate than all other species
(Tukey comparisons, minimum significant difference: 0.7043 in 2003 and 0.5352 in 2004, both
years P < 0.05). Overall predation and attempted predation rate was higher in 2004 (0.119
events/hr) than in 2003 (0.054 events/hr). Predation and attempted predation rate did not vary
17

0
20
40
60
80
100
StriatedCaracara
Kelp Gull Dolphin Gull Turkey Vulture
SA
SCT
SPT
SG
P&AP
S
2003N=1513 N=504 N=316 N=398
0
20
40
60
80
100
StriatedCaracara
Kelp Gull Dolphin Gull Turkey Vulture
Act
ivity
eve
nts
(%))
2004N=944 N=355 N=299 N=252
FIG. 6. Relative importance of different activities of the four most common predator/scavenger species
on the penguin subcolonies during 2003 and 2004 (SA: search from air, SCT: search from central tussock,
SPT: search from peripheral tussock, SG: search from ground, P&AP: predation and attempted predation,
S: scavenging).
18
0
1
2
3
4
5
0 1 2 3 4 5
Striated Caracara
Kelp Gull
Dolphin Gull
Turkey Vulture
Giant Petrel
Chilean Skua
Crested Caracara
2003
0
1
2
3
4
5
0 1 2 3 4 5Time period
(3hr interval, 08:00-20:00)
Tota
l act
ivity
rate
2004
FIG. 7. Total activity rates (searches, predation, attempts and scavenging events/hr) of
predator/scavengers with time of day. Each time period represents a 3hr interval between 08:00-20:00.
19

throughout the day (F3,3 = 3.13, P = 0.19), but there was a significant year effect (F1,3 = 18.87, P
= 0.022).
Total activity rates by Striated Caracaras and Turkey Vultures showed no significant
seasonal variation in either year (Wilcoxon test, both years P > 0.05; Fig. 8). However, total
activity rates by Kelp Gulls and Dolphin Gulls were higher during the last week of the study,
once penguin crèches had formed, than during the first weeks. This increase throughout the
season was only significant for Dolphin Gulls (Wilcoxon test, 2003: P = 0.22 for Kelp Gulls, P =
0.042 for Dolphin Gulls; 2004: P = 0.053 for Kelp Gulls, P = 0.035 for Dolphin Gulls; Fig. 8).
Early in the breeding season activity by gulls was low. Later in the season, as crèches formed
and both penguin parents were foraging, the open ground space between nests increased and the
number of gulls also increased. Gulls continually searched the subcolonies from the air, on
occasion landing and walking inside the subcolony attempting to take unattended small chicks,
dead chicks or abandoned eggs. Even though scavenging rates were too low for statistical
analysis, scavenging events by gulls were not observed until after 24 December in 2003 (n = 4)
and 18 December in 2004 (n = 15).
In 2003 total predation and attempted predation rate by Striated Caracaras and Kelp Gulls
was not correlated with time of season (r = - 0.2044, P = 0.36; Fig. 9); however, in 2004 it
showed a significant negative correlation (r = - 0.5192, P = 0.027; Fig. 9). When pooled for
years, predation and attempted predation rate was also negatively correlated with time of season
(r = - 0.3462, P = 0.029), possibly because as the breeding season advanced, chicks got heavier
and larger making it more difficult for predators to kill them.
20

0
2
4
6
8
1 2 3 4 5 6 7 8 9 10 11 12
Striated Caracara
Kelp Gull
Dolphin Gull
Turkey Vulture
2003
1st crecheobserved
*
0
2
4
6
8
1 2 3 4 5 6 7 8
Time period (2-day interval)
Tota
l act
ivity
rate 2004
1st crecheobserved
FIG. 8. Total activity rate (searches, predation, attempts and scavenging events/hr) of the four most
common predator/scavenger species with time of season, divided into 12 (7-30 December in 2003) and 9
(8-25 December in 2004) two-day intervals.
*: bad weather conditions prevented observations during time period 8 in 2003.
21

0
0.1
0.2
0.3
0.4
6 7 8 9 10 11 12 13 14 15 16 17 18 19 20 21 22 23 24 25 26 27 28 29 30 31
December
Pre
datio
n an
d at
tem
pted
pr
edat
ion
rate
FIG. 9. Daily predation and attempted predation rates (predation and attempt events/hr) by Striated
Caracaras and Kelp Gulls on Southern Rockhopper Penguin chicks during 2003 and 2004. Filled squares:
2003, open squares: 2004. Solid arrow: 1st crèche observed in 2003, dashed arrow: 1st crèche observed in
2004.
22

Weather and Activity Rates
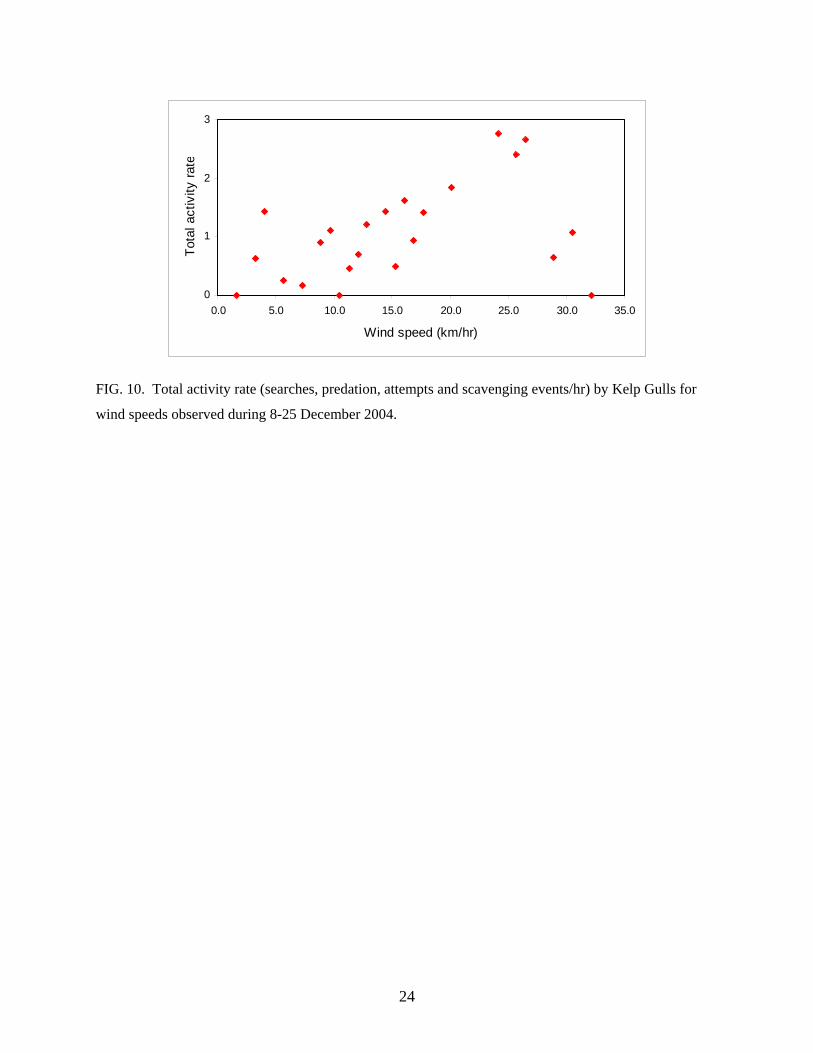
Total activity rate by Kelp Gulls correlated with wind speed up to 27 km/h (r = 0.7303, P
< 0.001, n = 20; Fig.10) and decreased for wind speeds over 29 km/hr. Total activity rate by
Giant Petrels was also positively correlated with wind speed (r = 0.4256, P = 0.043, n =23), but
not for other species (Turkey Vulture: r = 0.0054, P = 0.98; Dolphin Gull: r = 0.158, P = 0.47;
Chilean Skua: r = 0.2146, P = 0.32; Crested Caracara: r = 0.0535, P = 0.80). Young (1994)
found variation in predation rates in relation to weather, higher predation rates by South Polar
Skuas (Catharacta maccormicki) on windy or stormy days when adult Adélie penguins may be
distracted, thus facilitating prey capture. However for Striated Caracaras and Kelp Gulls on
Staten Island, total predation and attempted predation rate was not correlated with wind speed (r
= - 0.0692, P = 0.75, n = 23).
Predation and Nest Location
Predation and attempted predation events on penguin chicks were rarely observed for
Striated Caracaras and Kelp Gulls (Table 2). In both years, the main predator was the Striated
Caracara, which accounted for 93 % (n = 71) of observed predations and attempts on
Rockhopper Penguin chicks. In 2003 predation and attempted predation events were higher on
the functional edge of the subcolony, but not significantly so (exact X22 = 3.92, P = 0.17; Fig.
11). In 2004, these events varied significantly with nest location (exact X22 = 13.087, P = 0.002;
Fig. 11).
Highest predation and attempted predation events were observed on the functional and
geometric edge of the subcolony. In both years there was a significant association between the
predator’s method of approach and the nest location (2003: exact X26 = 50, P < 0.001; 2004:
23
0
1
2
3
0.0 5.0 10.0 15.0 20.0 25.0 30.0 35.0
Wind speed (km/hr)
Tota
l act
ivity
rate
FIG. 10. Total activity rate (searches, predation, attempts and scavenging events/hr) by Kelp Gulls for
wind speeds observed during 8-25 December 2004.
24

TABLE 2. Predation (P) and attempted predation (AP) events on Rockhopper Penguin chicks by Striated
Caracaras and Kelp Gulls at study subcolonies during 2003 and 2004. Species counts not indicated as P
or AP include both types of events.
* SC9 was only observed in 2004.
mean number Striated Kelp total P & P & AP ratesubcolony year of nests Caracara Gull AP events (events/hr)
SC1 2003 69 0 0 0 02004 72 0 0 0 0
SC2 2003 506 0 0 0 02004 473 0 0 0 0
SC3 2003 929 0 0 0 02004 978 1P 0 1 0.024
SC4 2003 1520 7 0 7 0.0952004 1660 0 0 0 0
SC5 2003 440 1P 0 1 0.0182004 386 0 0 0 0
SC6 2003 122 3 0 3 0.0582004 132 1AP 0 1 0.031
SC7 2003 574 10 0 10 0.1672004 361 12 0 12 0.182
SC8 2003 179 0 4AP 4 0.0782004 145 0 0 0 0
SC9 2003* - - - - -2004 1682 31 1P 32 0.464
Total 2003 4461 21 4 25 0.0542004 7571 45 1 46 0.119
25

0
20
40
60
geometric edge functional edge center
air
central tussock
periphery tussock
ground
N=6
N=13
N=6
2003
0
20
40
60
geometric edge functional edge center
Nest location in subcolony
Atte
mpt
s an
d pr
edat
ion
even
ts (%
)
N=23N=19
N=4
2004
FIG. 11. Percent of total predation and attempted predation events (n=25 in 2003, n=46 in 2004) on
Rockhopper penguin chicks by Striated Caracaras and Kelp Gulls during 2003 and 2004. Events were
recorded from the air, from central or peripheral tussocks or from the ground on nests on the geometric
edge, functional edge or center of the subcolonies (see Methods for definitions of nest location).
26
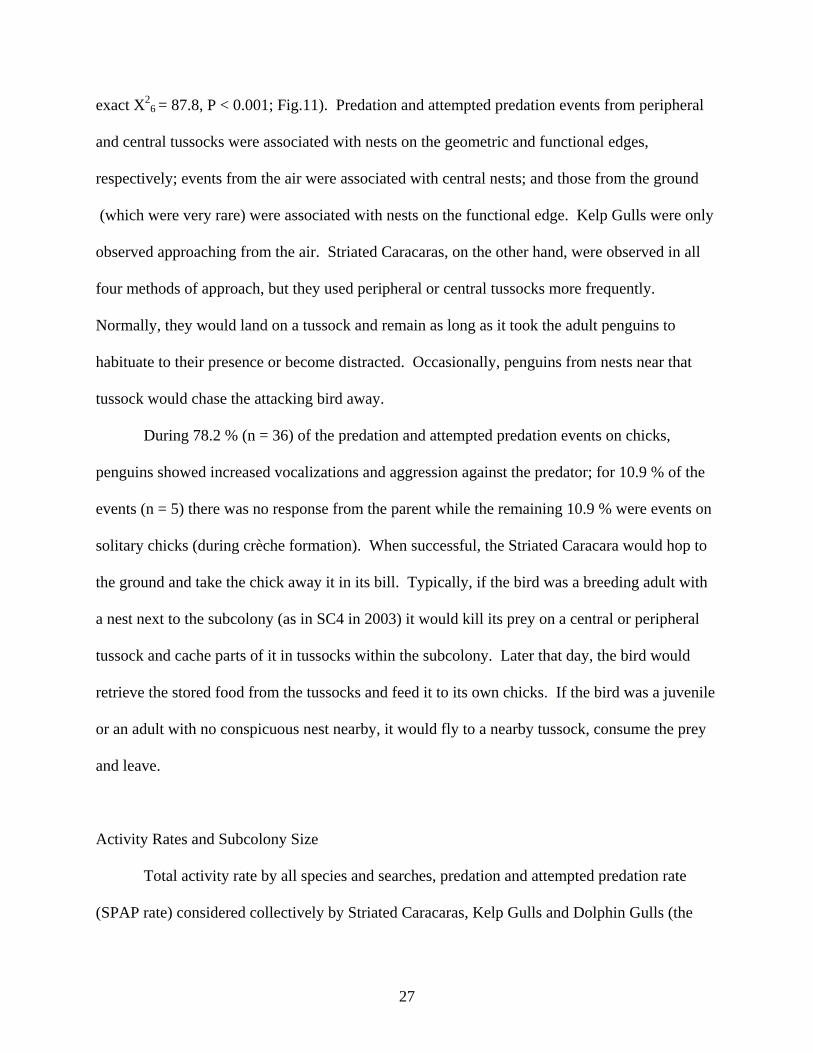
exact X26 = 87.8, P < 0.001; Fig.11). Predation and attempted predation events from peripheral
and central tussocks were associated with nests on the geometric and functional edges,
respectively; events from the air were associated with central nests; and those from the ground
(which were very rare) were associated with nests on the functional edge. Kelp Gulls were only
observed approaching from the air. Striated Caracaras, on the other hand, were observed in all
four methods of approach, but they used peripheral or central tussocks more frequently.
Normally, they would land on a tussock and remain as long as it took the adult penguins to
habituate to their presence or become distracted. Occasionally, penguins from nests near that
tussock would chase the attacking bird away.
During 78.2 % (n = 36) of the predation and attempted predation events on chicks,
penguins showed increased vocalizations and aggression against the predator; for 10.9 % of the
events (n = 5) there was no response from the parent while the remaining 10.9 % were events on
solitary chicks (during crèche formation). When successful, the Striated Caracara would hop to
the ground and take the chick away it in its bill. Typically, if the bird was a breeding adult with
a nest next to the subcolony (as in SC4 in 2003) it would kill its prey on a central or peripheral
tussock and cache parts of it in tussocks within the subcolony. Later that day, the bird would
retrieve the stored food from the tussocks and feed it to its own chicks. If the bird was a juvenile
or an adult with no conspicuous nest nearby, it would fly to a nearby tussock, consume the prey
and leave.
Activity Rates and Subcolony Size
Total activity rate by all species and searches, predation and attempted predation rate
(SPAP rate) considered collectively by Striated Caracaras, Kelp Gulls and Dolphin Gulls (the
27

three most common species) were pooled for 2003 and 2004 as ANCOVA analysis revealed no
significant year effect (total act. rate: P = 0.38; SPAP rate: P = 0.35) and no significant year x
subcolony size interaction (total act. rate: P = 0.98; SPAP rate: P = 0.92). Subcolony size was
positively correlated with total activity rate by all species (r = 0.7132, P = 0.001, n = 17) as well
as with SPAP rate by Striated Caracaras, Kelp Gulls and Dolphin Gulls (r = 0.6569, P = 0.004,
n= 17). Total relative activity rate, instead, was negatively correlated with subcolony size
however not significantly so (r = - 0.473, P = 0.055, n = 17). Relative SPAP rate showed the
same trend (r = - 0.3407, P =0.18, n = 17).
Encounter rate (search rate by all species) was positively correlated with subcolony size
(r = 0.7132, P = 0.001, n = 17). The observed slope of 0.00353 ± 0.00287 (95 % confidence
limits) was significantly different from the expected slope of 0.00778 (t = 3.163, P = 0.006; Fig.
12), thus supporting the encounter effect hypothesis. The rate of encounter increased at a lower
rate than expected when subcolony size increased.
Individual attack rate, based on predation and attempt events per hr per nest (Fig. 13) for
subcolonies where attacks were observed, was not correlated with subcolony size (r = - 0.5, P =
0.17, n = 9). The attack rate may not necessarily be diluted by being in a larger subcolony
because, once the subcolony is detected, predators may attempt to prey on more than one nest or
on the same nest more than once. On a few occasions the same Striated Caracara was observed
either attempting to take different chicks or consecutively attempting to take the same chick
twice. Also, Striated Caracaras were observed returning to the same nest throughout the day
(though in this case it was not certain if it was the same Striated Caracara or not).
The occurrence of predation events was not significantly different either for subcolony
size (Wald X2: 0.2966, P = 0.59), for year (Wald X2: 0.7512, P = 0.39) or for the presence of
28

0
2
4
6
8
10
12
14
0 200 400 600 800 1000 1200 1400 1600 1800
Subcolony size
Enc
ount
er ra
te (s
erac
hes/
hr)
FIG. 12. Encounter rate of all predator/scavenger species together on Rockhopper Penguin subcolonies in
2003 and 2004. Dashed line represents expected encounter rates based on the predictions that encounter
rate is proportionate to subcolony size (no encounter effect). Solid line represents linear fit of observed
encounter rates.
29

0
0.0001
0.0002
0.0003
0.0004
0.0005
0.0006
0 200 400 600 800 1000 1200 1400 1600 1800
Subcolony size
Indi
vidu
al a
ttack
rate
FIG. 13. Individual attack rate (predation and attempt events per hr per nest) by Striated Caracaras and
Kelp Gulls on Southern Rockhopper Penguin chicks. Filled squares: 2003, open squares: 2004.
30

central tussocks (criteria chosen for the classification in large or small subcolonies) (Wald X2:
0.8043, P = 0.37). Neither predation rate nor relative predation rate were correlated with
subcolony size (predation rate: r = 0.4089; relative predation rate: r = 0.236; both P > 0.1 and
n = 17; Fig. 14). Predation events were rare, and in several small as well as large subcolonies no
predation events were observed. Subcolonies > 200 nests with a low predation rate (< 0.05
events/hr and different to zero) had also a low relative predation rate (< 0.0001 events/hr; Fig.
14). However, for the three subcolonies > 200 nests with predation rates >0.05 events/hr,
predation rates were proportionally lower for the larger subcolonies (the largest subcolony with
the highest predation rate has the lowest relative predation rate; Fig. 14).
For subcolonies < 200 nests, predation events were observed in only one of them (Table
2). Even though this subcolony had a low predation rate (< 0.05 events/hr), this rate was
proportionally higher than for larger subcolonies with similar predation rates (<0.05) and even
slightly higher than the largest subcolony with the highest predation rate. However, reanalysis of
the data with only those subcolonies in which predation events were observed revealed a
negative though nonsignificant correlation of predation rate or relative predation rate with
subcolony size (predation rate: r = 0.4643; relative predation rate r = -0.5357; both: P = 0.29 and
n = 7).
Individual predation risk (predation events per searches per nest) was zero in several
subcolonies (regardless their size) in which predation or attempts were not observed (Fig. 15 A).
For those subcolonies in which predation and attempts were observed, large subcolonies also
experienced reduced individual risk. Individual predation risk decreased with increasing
subcolony size, but not significantly so (r = -0.6786, P = 0.09, n = 7; Fig. 15 A). This
relationship on a double log plot gives an observed slope of – 0.88012 ± 0.95748 (95 %
31

0
0.05
0.1
0.15
0.2
0.25
0 200 400 600 800 1000 1200 1400 1600 1800
Subcolony size
Pre
datio
n ra
te
A
0
0.0001
0.0002
0.0003
0.0004
0 200 400 600 800 1000 1200 1400 1600 1800
Subcolony size
Rel
ativ
e pr
edat
ion
rate
B
FIG. 14. A: Observed predation rate (predation events per hr) and B: relative predation rate (predation
events per hr per nest) by Striated Caracaras and Kelp Gulls on Southern Rockhopper Penguin chicks.
Filled squares: 2003, open squares: 2004.
32

0
0.00002
0.00004
0.00006
0.00008
0.0001
0.00012
0 200 400 600 800 1000 1200 1400 1600 1800
Subcolony size
Indi
vidu
al p
reda
tion
risk
A
0.000001
0.00001
0.0001
0.001
10 100 1000 10000
Subcolony size
Indi
vidu
al p
reda
tion
risk
B
FIG. 15. A: Estimated individual predation risk (predation events per searches per nest) Filled squares:
2003, open squares: 2004. B: Estimated individual predation risk for subcolonies in which predation
events were observed, solid line represents the linear fit for these data
(log y = -2.1963 – 0.88012 log x, P = 0.06, n = 7). Dashed line: expected values based on numerical
dilution (calculated by multiplying predations/searches in the smallest subcolony in which predation was
observed by 1/subcolony size).
33

confidence interval; Fig. 15 B), which is not significantly different from the expected slope of –
1.00000, assuming a simple dilution effect in which the probability of predation per nest is
inversely related to subcolony size.
Nest Checks: Nest Success, Chick Mortality and Nest Predation
Nest success significantly increased with subcolony size in 2003 and 2004 (Table 3).
Logistic regression analyses were used to model the relationship between nest success and
subcolony size for 2003 and 2004 (Fig. 16). Small subcolonies had a significantly lower nest
success in both years (2003: X21 = 4.678, P = 0.003; 2004: X2
1 = 18.198, P < 0.0001; Table 4);
however, there were no differences in chick mortality or nest predation between large and small
subcolonies for either year (both years P > 0.05; Table 4). In 2003 there were no differences in
nest success, chick mortality or nest predation among the different nest locations in large or
small subcolonies (Table 4). In 2004 chick mortality and nest predation in large subcolonies
were highest in the functional edge (chick mortality: X22 = 22.481; nest predation: X2
2 = 23.341;
both P < 0.0001 for; Table 4). Overall nest success (2003 + 2004) was also lower in small
(0.574 %) than in large subcolonies (0.743 %) (X21 = 15.24, P < 0.0001), and overall chick
mortality and nest predation were higher in the functional edge (0.175 % and 0.138 %,
respectively) than in the geometric edge (0.088 %, 0.054 %) or center (0.047 %, 0.034 %) of
large subcolonies (chick mortality: X22 = 16.08, P < 0.001; nest predation: X2
2 = 13.649, P =
0.001). When effects of subcolony size and nest location were examined using logistic
regression, the probability of chick mortality and nest predation was independent of subcolony
size in both years (Table 5). However, in 2004 nest location had a significant effect on chick
34

TABLE 3. Effect of subcolony size on nest success, chick mortality and nest predation in 2003 and 2004.
The parameter estimate gives the estimated coefficient of the fitted logistic regression model.
Parameter Standard WaldVariable df Estimate Error Chi-Square P
December 2003Nest success Intercept 1 1.0193 0.171 35.5468 < 0.0001 Subcolony size 1 0.0009 0.0003 7.3313 0.0088
Chick mortality Intercept 1 -2.1478 0.2805 58.65 < 0.0001 Subcolony size 1 -0.0012 0.0006 3.2 0.0738
Nest predation Intercept 1 -2.6095 0.3322 61.71 < 0.0001 Subcolony size 1 -0.0008 0.0007 1.51 0.2189
December 2004Nest success Intercept 1 0.3885 0.1236 9.8822 0.0017 Subcolony size 1 0.0005 0.000153 13.0584 0.0003
Chick mortality Intercept 1 -2.3398 0.2529 85.58 < 0.0001 Subcolony size 1 0.0001 0.0003 0.13 0.7171
Nest predation Intercept 1 -2.4044 0.2705 79.01 < 0.0001 Subcolony size 1 -0.0002 0.0003 0.4 0.5261
35

0 500 1500
0.0
0.2
0.4
0.6
0.8
1.0
Subcolony size
Nes
t suc
cess
20032003
0 500 1500
0.0
0.2
0.4
0.6
0.8
1.0
Subcolony size
Nes
t suc
cess
2004
FIG. 16. Logistic regression curve showing the relationship between nest success and subcolony size in
2003 and 2004. Open circles: observed nest success at each subcolony, calculated as the number of nests
that had at least 1 chick divided by the total number of nests on the transect. Solid line: estimated
probability of nest success.
36

TABLE 4. Differences in nest success, chick mortality and nest predation between large and small
subcolonies and between different nest locations within large or small subcolonies in 2003 and 2004 (n =
total number of nests, chicks, and nests with chicks monitored on the transect). Percentage was calculated
as the number of nests that produced at least one chick related to the total number of nests at the
beginning of nest checks, as the number of chicks lost to predation or other causes related to the total
number of chicks at the beginning of nest checks, and as the total number of nests that suffered chick
predation related to the total number of nests with chicks at the beginning of nests checks (see Methods).
Nest success Chick mortality Nest predationn % n % n %
December 2003Large subcolonies 149 85.2 134 5.2 132 4.5Small subcolonies 221 76.0 185 8.6 182 5.5
X2 4.678 * 1.362 0.143Large subcolonies Geometric edge 19 100 21 9.5 21 9.5 Center 80 82.5 69 4.3 68 4.4 Functional edge 47 89.4 44 4.5 43 2.3
X2 4.499 0.932 1.691Small subcolonies Geometric edge 84 71.4 67 9.0 66 7.5 Center 137 78.8 118 8.5 116 4.3
X2 1.566 0.12 0.864
December 2004
Large subcolonies 335 74.3 279 10.8 274 7.7Small subcolonies 242 57.4 149 6.7 148 6.8
X2 18.198 ** 1.872 0.39Large subcolonies Geometric edge 40 82.5 36 8.3 34 2.9 Center 212 75 167 4.8 167 3.0 Functional edge 83 68.7 76 25 73 20.5
X2 2.84 22.481 *** 22.341 ***Small subcolonies Geometric edge 91 57.1 53 1.9 52 1.9 Center 151 57.6 96 9.4 96 9.4
X2 0.005 3.058 2.973
* P < 0.05, df = 1; ** P < 0.0001, df = 1; *** P < 0.0001, df = 2
37

TABLE 5. Effect of subcolony size and nest location on nest success, chick mortality and nest predation
in 2003 and 2004. The parameter estimate gives the estimated coefficient of the fitted logistic regression
model.
Parameter Standard WaldVariable df Estimate Error Chi-Square P
December 2003Nest success Intercept 1 0.846 0.4192 4.0726 0.0436 Subcolony size 1 0.000947 0.000387 5.9711 0.0145 Location 1 0.1208 0.2425 0.2483 0.6183
Chick mortality Intercept 1 -2.008 0.6871 8.5396 0.0035 Subcolony size 1 -0.0011 0.000682 2.6067 0.1064 Location 1 -0.877 0.3958 0.0491 0.8246
Nest predation Intercept 1 -1.7848 0.766 5.4296 0.0198 Subcolony size 1 -0.00057 0.000698 0.6774 0.4105 Location 1 -0.53 0.4607 1.3236 0.2499
December 2004Nest success Intercept 1 0.4651 0.2968 2.4558 0.1171 Subcolony size 1 0.000563 0.000158 12.7419 0.0004 Location 1 -0.0434 0.1529 0.0807 0.7763
Chick mortality Intercept 1 -4.877 0.7033 48.0875 < 0.0001 Subcolony size 1 -0.00012 0.000282 0.1955 0.6584 Location 1 1.2515 0.2957 17.9119 < 0.0001
Nest predation Intercept 1 -5.4093 0.8155 44.0009 < 0.0001 Subcolony size 1 -0.00052 0.000346 2.227 0.1356 Location 1 1.4787 0.3435 18.5318 < 0.0001
38

mortality and nest predation; the probabilities of chick mortality and nest predation were highest
in the functional edge of the subcolony (Table 5, Fig. 17).
In some of the subcolonies where no predation was observed, there was evidence of chick
predation (missing chicks) from the transect nest checks. With the cumulative number of
missing chicks on the transect within the nest check period, ‘transect -predation rates’ can be
calculated as preyed chicks per hr. In all but two of the subcolonies in which predation events
were not observed, these transect-predation rates were higher than the observed predation rates
(which were zero). For subcolonies in which predation events were observed, the transect-
predation rate was lower than the observed predation rate. Predation rates obtained from nest
checks are not as accurate as direct observations, since missing chicks (assumed to be lost due to
predation) might have died from other causes (starvation, other penguins, etc.) and then were
scavenged. Moreover, the subset of nests in a transect may not be representative of the entire
subcolony. Results suggest that observed predation rates might have been underestimated at
some of the subcolonies in which predation events were not observed, especially for those in
which predators were frequently seen searching (ex: SC8).
DISCUSSION
Striated Caracaras
Striated Caracaras at Bahía Franklin were the main predators on Rockhopper Penguin
chicks. This result agrees with previous observations which indicated that these subcolonies are
usually occupied by either a single adult breeding pair of Striated Caracaras or by a "gang" of
juveniles, immatures and / or adult nonbreeders; these groups sometimes also included Turkey
Vultures and juvenile Crested Caracaras (J. Meiburg, pers. comm.). On a survey conducted on
Staten Island during 1995, 37 Striated Caracaras were observed along 196 km of coastline
39
0 500 1500
0.00
0.05
0.10
0.15
0.20
0.25
0.30
0.35
Subcolony size
Nes
t pre
datio
n
Geometric edge
0 500 1500
0.00
0.05
0.10
0.15
0.20
0.25
0.30
0.35
Subcolony size
Nes
t pre
datio
n
Center
0 500 1500
0.00
0.05
0.10
0.15
0.20
0.25
0.30
0.35
Subcolony size
Nes
t pre
datio
n
Functional edge
FIG. 17. Logistic regression curve showing the relationship between nest predation and subcolony size on
the geometric edge, center and functional edge of subcolonies in 2004. Open circles: observed nest
predation at each nest location within each subcolony calculated from the nest checks on each transect.
Solid line: estimated probability of nest predation on each location of the subcolony.
40

surveyed (68% of total coastline but not including Bahía Franklin) and all of them were at or in
close proximity to colonies of marine mammals or seabirds (Frere et al. 1999). In another survey
conducted in November 2001 at Bahía Franklin, 20 adult Striated Caracara pairs (five of them
with nests) and five immature foraging groups were located and their territories mapped (J.
Meiburg, pers. comm). All of the territories were within the Rockhopper colony at Bahía
Franklin.
As Striated Caracaras hold territories within the Rockhopper Penguin colony and most of
the observed predation and attempted predation events on penguin chicks were by this species, it
is reasonable to conclude that at Bahía Franklin this predator feeds predominantly on
Rockhopper Penguins and has the greatest impact on them. Skua predation is a major cause of
egg mortality in Rockhopper penguins on New Island, Falkland Islands (St. Clair and St. Clair
1996). Skuas were also observed taking penguin chicks from their nests, while parents stood
beside or near them (St. Clair and St. Clair 1996), and killing lone chicks during the Rockhopper
crèche period (Pettingill 1960). The Chilean Skua (Catharacta chilensis) has been recorded at
Staten Island (Schiavini et al. 1999) and on occasion they have been seen feeding on adult/chick
penguin remains in the periphery of the subcolonies or close to their nests (A. Raya Rey, pers.
comm.). Also, analysis of regurgitated pellets collected by skua nests during December 1999
showed that penguin remains were the most important item, accounting for 74% of all prey
(unpublished data). During this study, skuas were never seen taking penguin chicks or
scavenging, and accounted for less than 5 % of the total activity events in all subcolonies for
both years. However, further study is needed on their potential impact on Rockhoppers during
the incubation period.
41

Other Predator/Scavengers
Kelp Gulls and Dolphin Gulls were the second most common species observed at the
subcolonies. Kelp Gulls were most common at SC8 where, in both years, gull nests with
chicks/eggs were present. Kelp Gull activities at penguin colonies have been studied for Adélie
Penguins at King George Island (Emslie et al. 1995) and for King Penguins at Marion Island
(Hunter 1991). At both sites, Kelp Gulls were observed frequently scavenging but never preying
on eggs or chicks. At Punta Leon, Argentina, Kelp Gulls were the main predator on a mixed
colony of Royal Terns (Sterna maxima) and Cayenne Terns (Sterna eurygnatha); they preyed
mainly upon tern eggs but were twice observed preying on tern chicks (Yorio and Quintana
1997).
At Staten Island, Kelp Gulls were observed scavenging later in the season and in 2003
they were only observed attempting to take penguin chicks at SC8 on four occasions. However,
given the small size of SC8, this resulted in a high individual attack rate. Moreover, this
subcolony had the lowest nest success in both years and the highest nest predation in 2004,
suggesting that Kelp Gulls might have an important impact here. At Staten Island, Kelp Gulls
were always seen approaching central nests and from the air. Instead, at Punta Leon, Gulls
approached almost exclusively peripheral tern nests and from the ground (Yorio and Quintana
1997). These alternate methods of approach at different sites may be due to variations in the
prey’s nest defense behavior and nesting density. At Staten Island the estimated nesting density
for Rockhopper Penguins is 102.5 (± 29.7) nests per 100 m2 (Schiavini 2000). Instead, at Punta
Leon, Royal and Cayenne Terns nest together with a density of 9-11 nests per m2 (Quintana 1995
in Yorio and Quintana 1997) which, among other factors, appears to result in a low frequency of
aerial predation (Yorio and Quintana 1997).
42

The increase of Kelp Gull activity rate with wind speed might explain their dominance in
a place as SC8, the most isolated and exposed to the wind of all study subcolonies. Gulls always
approached nests from the air, and higher wind speeds might give them greater maneuverability
and speed when approaching the nests and greater lift when searching from the air. Dolphin
Gulls, on the other hand, did not have an important impact as predators but they seem to be
important scavengers. Not only did their total activity rate increase significantly later in the
season; scavenging events were also observed at this time of season and they were seen walking
inside the subcolony searching for dead chicks or abandoned eggs, mostly in SC2 and SC9.
Dolphin Gulls are mainly specialized scavengers and at Punta Tombo, Argentina, they mainly
feed by scavenging on food dropped by other colonial seabirds and on sea lion excrement; and
they have also been seen scavenging remains of Magellanic Penguin (Spheniscus magellanicus)
eggs already preyed upon by other species and stealing cormorant and Kelp Gull eggs (Yorio et
al. 1996).
Activity Rate and Subcolony Size
Searches were the most common activity for all species. This result agrees with other
studies of South Polar Skuas (Catharacta maccormicki) at Adélie Penguin colonies (Young
1994) and Brown Skuas (Catharacta lonnbergi) at Adélie and Gentoo Penguin colonies (Emslie
et al. 1995). Emslie et al. (1995) suggested that frequent searches by predators might help them
locate vulnerable prey or assess prey for later attacks.
Encounter rate (search rate) increased with subcolony size, but at a lower rate than
expected, thus supporting the encounter effect hypothesis. The encounter effect favors being in a
group by decreasing the probability of detection by a predator and because the detection of larger
43

three-dimensional groups does not increase proportionally with group size (Vine 1973, Taylor
1977, Uetz and Hieber 1994). If the probability of detection of a group initially increases
linearly with group size and then levels off, large groups hunted visually will not be
proportionally more conspicuous than small groups (Inman and Krebs 1987). For Rockhopper
Penguins the encounter effect may not be very important; the probability of detection may not
vary much among subcolonies since most of them are in close proximity to each other. Further
studies are needed to better explain the pattern of predator encounter seen at these subcolonies.
Impact of Predation
The effect each species of predator has on a colony depends on the size of the predator in
relation to the defending species or risk, and the method of approach by the predator (Brunton
1997). In Least Terns (Sterna antillarum) the relationship between colony size and the
percentage of nests lost to each type of predator depends on the predator’s method of approach,
either aerial or from the periphery; small colonies appeared to be more vulnerable to predators
with periphery approach, whereas large colonies were more vulnerable to predators approaching
from the air (Brunton 1999). Brunton (1997) concluded that the selfish herd hypothesis may be
limited to applying only when predators are restricted to approach from the edge due to the type
of predator, the effectiveness of the antipredator behavior by the prey species, or the physical
characteristics of the nesting site.
The ratio of peripheral to central nests depends on the shape and the size of the
subcolony. For any subcolony size, circular shapes have the lowest ratio. Thus, when predation
occurs mainly on the edge and given a circular shape, the disadvantage of peripheral nests would
be less in larger subcolonies. If predation from the ground is an important method of approach
44

by the predator then highest levels of predation are more likely to occur on the edge (especially if
nest density is high, making it difficult for a predator to land within the colony), giving central
nests an advantage against predation since they can only be accessed from the air.
Several studies have reported higher nest predation on the edge of the colonies
(Young1994, Emslie et al. 1995, Yorio and Quintana 1997). In all these studies predators
approached almost exclusively from the ground. In Rockhopper Penguin subcolonies at Staten
Island, Striated Caracaras attacked preferentially from tussocks. Even though attacks from the
ground were rare, peripheral nests would still be more vulnerable to predation than central nests
because they can be accessed from peripheral tussocks. The argument given above would still
hold true if it was not for the large subcolonies also having tussocks within them (central
tussocks). In 2004, predation and attempts were indeed significantly higher on nests on the
geometric and functional edge. Thus, being in the center might not be an advantage unless the
nest is not next to a central tussock. Also, the proportion of peripheral to central nests does not
necessarily decrease with subcolony size; this will depend on how many central tussocks are
present. Conversely, and to complicate the interpretation even more, some peripheral nests
might be more protected than central nests depending on the topography of the subcolony.
Nest-site topography has been identified as a potential factor, among others, in
determining the likelihood that a particular nest will be subject to predation. Weidinger (1998)
showed that skua predation on Cape Petrels (Daption capense) was lower on nests in vertical
parts of cliffs, on narrow ledges and with more sides sheltered by rock walls. Similarly, Double-
crested Cormorants (Phalacrocorax auritus) and Pelagic Cormorants (P. pelagicus) nesting in
steeper and more central locations had the lowest predation pressure (Siegel-Causey and Hunt
1981). The landscape at Bahía Franklin presents eroded areas creating embankments up to 1-2
45

meters high, at the top of which is the ground level with tussocks. These embankments are
sometimes found bordering part of the periphery of subcolonies, thus creating a barrier to
predators approaching from the edge (it seems unlikely for a Striated Caracara to jump from a
tussock onto a nest that is 2 meters below). In these situations, peripheral nests would be as
protected as central ones, whereas those on the functional edge would be the most vulnerable to
predation.
In 2004, nest checks in large subcolonies revealed a higher nest predation on functional
edge nests, suggesting that in certain parts of the subcolonies these nests are indeed the most
vulnerable to predation. In small subcolonies, no differences in nest predation between the
geometric edge and center were found, probably because Striated Caracaras were rarely seen
here. Even though in one of them (SC8) Kelp Gulls were most common and nest predation was
higher in the center, predation rate may have been too low to show any significant differences.
The number and kinds of predators and their life history strategies also should be
considered when assessing predation impact. Emslie et al. (1995) suggested that differences in
reproductive success by penguins of the same species at different locations may be explained, in
part, by differences in the number and kind of predators associated with them. A greater number
and diversity of predators could result in a greater proportion of prey killed. Striated Caracaras
at Staten Island often hold territories that include entire penguin subcolonies. Larger subcolonies
offer a greater number and variety of prey, and might attract more predators than smaller ones.
Indeed, at SC9, the largest of all subcolonies and apparently not part of a Striated Caracara
territory, up to five caracaras were seen simultaneously. Instead, at SC4, a similar sized
subcolony and part of a Striated Caracara territory, no more than two caracaras (the breeding
pair) were observed because they would always exclude other caracaras from their territory.
46

Several studies have shown that predators with feeding territories have higher reproductive rate
compared with pairs with out feeding territories (Spear 1993, Young 1994). In this study,
regardless of the possible benefit for the predator, being part of the territory of a Striated
Caracara seems to be beneficial from the view point of the prey. SC4 had a lower proportion of
predation rate and a lower predation risk than SC9.
Predation rates increased (though not significantly) with subcolony size, which is
consistent with other studies. Hunter (1991) calculated predation rates on King Penguins by
collecting carcasses and found that they increased with colony size. Emslie et al. (1995)
calculated predation rates on Adélie Penguins from direct observations and found the highest
rates at larger colonies. However, breeding in larger colonies can still be adaptive for reducing
predation risk as long as predation rates are proportionally lower in larger colonies. In this study,
for large subcolonies in which predation occurs over a certain predation rate threshold (0.05
predation events/hr?) the individual predation rate (relative predation rate) was reduced by being
in a larger subcolony. Instead, for small subcolonies individual predation rate was high,
regardless of low overall predation rates. Davis (1982) found that the number of Adélie chicks
lost to predation was greatest at the largest crèche, although the proportion was smallest.
Hernández-Matías and Ruiz (2003) found that larger subcolonies of Common Terns had a higher
absolute number of predated nests but a lower percentage of nest predation than smaller
subcolonies and observed that the probability of predation was negatively related to subcolony
size. Thus, higher predation rate in larger colonies does not necessarily mean that the individual
predation risk is higher.
In this study, the analysis of the individual predation risk suggests that, for those
subcolonies in which predation was observed, there is a dilution effect and that those individuals
47

seem to reduce their risk of predation by being in larger subcolonies. Some authors have
considered that predation has a secondary role in the evolution of coloniality (Ward and Zahavi
1973), others that it may even be a cost for colonial breeders (Clode 1993). However,
Wittenberger and Hunt (1985) suggest that as a general rule, the proportion of nests lost to
predators will decrease with increasing colony size once the colony is large enough to swamp all
local predators. Here, small subcolonies for which predation was observed had a proportionally
higher predation rate than larger subcolonies with similar absolute predation rates suggesting
that, indeed, the swamping effect of colony size may not take place unless the colony reaches
some minimum size.
Differences in breeding success are not always attributable to predation. Factors such as
the quality of birds nesting at the edge versus the center of the colony might be involved
(Coulson 1968). In Chinstrap Penguins, nests in large subcolonies, whatever their position, were
more successful than nests in small ones (Barbosa et al. 1997). For Rockhoppers, in both years,
small subcolonies had lower nest success than large ones, but no differences were found in nest
predation or chick mortality. For large subcolonies, direct observations suggest that higher nest
success may be explained in part by a dilution effect thus reducing the probability of predation
per nest.
Lower breeding success in small subcolonies has been explained by the increased
proportion of peripheral nests (Tenaza 1971). The lower breeding success of peripheral nests
may be due to higher rates of nest predation (Tenaza 1971) or, as in Adélie Penguins, to the
presence of older and more experienced birds in the center of the colony and a larger proportion
of young and inexperienced birds on the periphery (Ainley et al. 1983). In the present case, low
nest success in small subcolonies may be partially attributable to predation and the high
48

predation risk of small subcolonies. However, predation rates were low or not even observed at
several other small subcolonies. At the start day of nest checks, many of the nests were already
empty (they just had the breeding penguin pair). Thus, it is possible that these pairs had either
lost their eggs during the incubation or their chick earlier in the season, or that they were young
or inexperienced breeders. The effects of age-related factors on nest success and the impact of
predation during the incubation period remain to be explored.
Results from this study do not completely support the hypothesis that breeding in larger
subcolonies offers more protection to chicks against aerial predators than smaller ones. For
Rockhopper Penguins at Staten Island, in regard to reducing the probability of predation, size is
not all that matters. If predation does occur, subcolonies may lower their predation risk by a
dilution effect, once they have reached some minimum size. Subcolonies can also have zero or
low predation risk when surrounded by larger subcolonies or when part of the territory of a
Striated Caracara. Within each subcolony, nests in central locations of large subcolonies or those
on the geometric edge of embankments seem to be the most protected from predation.
Consequently, when assessing the impact of predation on Rockhopper Penguins at Staten Island,
factors to be considered include: predator species (their methods of approach and territoriality),
subcolony size, location of the subcolony (isolated or surrounded by other large subcolonies),
nest-site characteristics (presence of central tussocks or embankments), and nest location within
each subcolony.
49

LITERATURE CITED
Ainley, A. G., R. E. LeResche and W. J. L. Sladen. 1983. Breeding biology of the Adélie Penguin. Univ. of California Press, Berkeley, California. Anderson, D. J. and P. J. Hodum. 1993. Predator behavior favors clumped nesting in an oceanic seabird. Ecology 74: 2462-2464. Barbosa, A., J. Moreno, J. Potti, and S. Merino.1997. Breeding group size, nest position and breeding success in the chinstrap penguin. Polar Biology 18: 410-414. Bellinato, F. and G. Bogliani. 1995. Colonial breeding imposes increased predation: experimental studies with herons. Ethology Ecology and Evolution 7: 347-353. Birdlife International. 2000. The threatened birds of the world. Lynx Edicions, Barcelona, Spain. Birdlife International. 2005. Species factsheet: Phalcoboenus australis. Online at <http://www.birdlife.org> (accessed 8 November 2005). Brown, C. R. and M. B. Brown. 2001. Avian Coloniality, Progress and Problems. Current Ornithology 16: 1-82. Brunton, D. H. 1997. Impacts of predators: center nests are less successful than edge nests in a large colony of Least Terns. Condor 99: 372-380. Brunton, D. 1999. “Optimal” colony size for Lest Terns: an intercolony study of opposing selective pressures by predators. Condor 101: 607-615. Clode, D. 1993. Colonially Breeding Seabirds: Predators or Prey? Trends in Ecology and Evolution 8: 336-338. Coulson, J. C. 1968. Differences in the Quality of Birds nesting in the Center and on the Edges of a Colony. Nature 217: 478-479. Davis, L. S. 1982. Creching behaviour of Adelie penguin chicks (Pygoscelis adeliae). New Zeland Journal of Zoology 9: 279-286. Emslie, S. E., N. Karnovsky, and W. Trivelpiece.1995. Avian predation at penguin colonies on King George Island, Antarctica. Wilson Bulletin 107: 317-327. Frere, E., A. Travaini, A. Parera, and A. Schiavini. 1999. Striated Caracara (Palcoboenus australis) population at Staten Island and Año Nuevo Islands. Journal of Raptor Research 33: 268-269. Hamilton, W. D. 1971. Geometry for the selfish herd. Journal of Theoretical Biology 31: 295-311.

Hernández-Matías, A., L. Jover, and X. Ruiz. 2003. Predation on Common Tern Eggs in Relation to Sub-colon Size, Nest Aggregation and Breeding Synchrony. Waterbirds 23: 280-289. Hernández-Matías, A. and X. Ruiz. 2003. Predation on common tern eggs by the yellow-legged gull at the Ebro Delta. Scientia Marina 67: 95-101. Hunter, S. 1991. The impact of avian predator-scavengers on King Penguin Aptenodytes patagonicus chicks at Marion Island. Ibis 133: 343-350. Inman, A. J. and J. Krebs. 1987. Predation and group living. Trends in Ecology and Evolution 2: 31-32. Lack, D. 1968. Ecological adaptations for breeding in birds. Methuen, London. Le Bohec, C., M. Gauthier-Clerc, J-P. Gender, N. Chatelain, and Y. Le Maho. 2003. Nocturnal predation of king penguins by giant petrels on the Crozet Islands. Polar Biology 26:587-590. Narosky, T. and D. Yzurieta. 1987. Guía para la identificación de las aves de Argentina y Uruguay. Asociación Ornitológica del Plata. Buenos Aires, Argentina. Pettingill, Jr. O. S. 1960. Crèche behavior and individual recognition in a colony of Rockhopper Penguins. Wilson Bulletin 72: 213-221. Pütz, K., R. J. Ingham, J. G. Smith, and B. H. Lüthi. 2002. Winter dispersal of rockhopper penguins Eudyptes chrysocome from the Falkland Islands and its implications for conservation. Marine Ecology Progress Series 240: 273-284. Quintana, F. 1995. Unpublished PhD thesis, University of Buenos Aires, in Yorio and Quintana 1997. Schiavini, A. 2000. Staten Island, Tierra del Fuego: The Largest Breeding Ground for Southern Rockhopper Penguins? Waterbirds 23: 286-291. Schiavini, A., E. Frere, P. Yorio, and A. Parera. 1999. Las aves marinas de la isla de los Estados, Tierra del Fuego, Argentina: revisión histórica, estado poblacional y problemas de conservación. Anales Instituto Patagonia, Serie Ciencias Naturales (Chile) 27: 25-40. Siegel-Causey, D. and G. L. Hunt, Jr. 1981. Colonial defense behavior in Double-crested and Pelagic Cormorants. Auk 98: 522-531. Spear, L. B. 1993. Dynamics and effect of western gulls feeding in a colony of guillemots and Brandt’s cormorants. Journal of Animal Ecology 62: 399-414. St. Clair, C. C. and R. C. St. Clair. 1996. Causes and consequences of egg loss in rockhopper penguins, Eudyptes chrysocome. Oikos 77: 459-466.
51

Stokes, D. L. and P. D. Boersma. 2000. Nesting density and the reproductive success in a colonial seabird, the Magellanic Penguin. Ecology 81: 2878-2891. Taylor, R. H. 1962. The adelie penguin Pygoscelis adeliae at Cape Royds. Ibis 104: 176-204. Taylor, R. J. 1977. The Value of Clumping to Prey. Oecologia 30: 285-294. Tenaza, R. 1971. Behavior and nesting success relative to nest location in Adélie Penguins (Pygoscelis adeliae). Condor 73: 81-92. Uetz, G. W. and C. S. Hieber. 1994. Group size and predation risk in colonial web-building spiders; analysis of attack abatement mechanisms. Behavioral Ecology 5: 326-333. Ward, P. and A. Zahavi. 1973. The importance of certain assemblages of birds as “information centers” for food –finding. Ibis 115: 517-534. Weidinger, K. 1998. Effect of predation by skuas on breeding success of the Cape Petrel Daption capense at Nelson Island, Antarctica. Polar Biology 20: 170-177. Williams, T.D. 1995. The Penguins. Oxford University Press, Oxford. Wittenberger, J. F. and G. L. Hunt. 1985. The adaptive significance of coloniality in birds, in Avian Biology, vol. 8 (D. S. Farner, J. R. King, and K. C. Parkes, Eds.). Academic Press, New York. Woehler , E. J. and J. P. Croxall. 1997. The status and trends of Antarctic and Subantarctic seabirds. Marine Ornithology 25: 43-66. Yorio, P., P. D. Boersma, and S. Swann. 1996. Breeding biology of the Dolphin Gull at Punta Tombo, Argentina. Condor 98: 208-215. Yorio, P. and F. Quintana. 1997. Predation by Kelp Gulls Larus dominicanus at a mixed-species colony of Royal Terns Sterna maxima and Cayenne Terns Sterna eurygnatha in Patagonia. Ibis 139: 536-541. Young, E. 1994. Skua and penguin. Cambridge University Press, England. Vine, I. 1973. Detection of Prey Flocks by Predators. Journal of Theoretical Biology 40: 207-210.
52