average annual percent cost increase since 1999: eid water, cost for 1500 cf per month &...
TRANSCRIPT

Average Annual Percent Cost Increase since 1999:EID Water, cost for 1500 cf per month
& national CPI-U detail for water, wastewater, & solid waste
2000 2001 2002 2003 2004 2005 2006 2007 2008 2009 2010 2011 2012 2013
-30.0%
-20.0%
-10.0%
0.0%
10.0%
20.0%
30.0%
40.0%
EID Water CPI-U Water Detail

Total (Cumulative) Percent Cost Increase since 1999:EID Water, cost for 1500 cf per month
& national CPI-U detail for water, wastewater, & solid waste
2000 2001 2002 2003 2004 2005 2006 2007 2008 2009 2010 2011 2012 2013
-20.0%
0.0%
20.0%
40.0%
60.0%
80.0%
100.0%
120.0%
EID Water CPI-U water detail
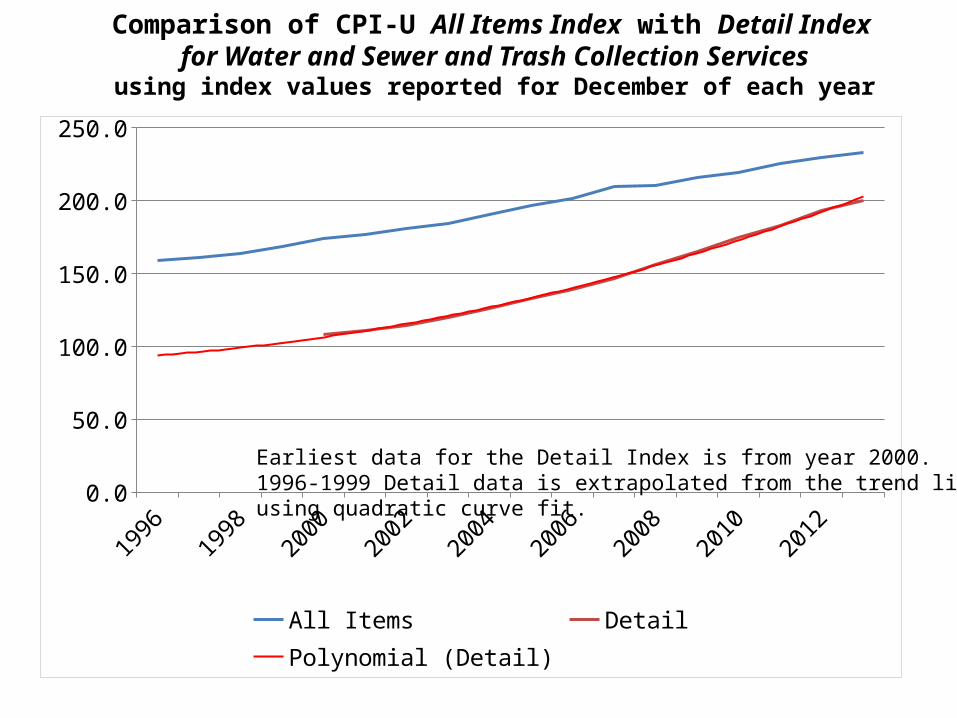
Comparison of CPI-U All Items Index with Detail Index for Water and Sewer and Trash Collection Servicesusing index values reported for December of each year
19961997
19981999
20002001
20022003
20042005
20062007
20082009
20102011
20122013
0.0
50.0
100.0
150.0
200.0
250.0
All Items Detail Polynomial (Detail)
Earliest data for the Detail Index is from year 2000.1996-1999 Detail data is extrapolated from the trend lineusing quadratic curve fit.

Comparison of CPI-U All Items Index with Detail Index for Water and Sewer and Trash Collection Services
Quantified as proportion of 1996 value
19961997
19981999
20002001
20022003
20042005
20062007
20082009
20102011
20122013
0.000
0.500
1.000
1.500
2.000
2.500
All Items DetailPolynomial (Detail) Indices:
Earliest data for the Detail Index is from year 2000.1996-1999 Detail data is extrapolated from the trend lineusing quadratic curve fit.

Comparison of CPI-U All Items Index with Detail Index for Water and Sewer and Trash Collection Services
Quantified as percentage of 1996 value
19961997
19981999
20002001
20022003
20042005
20062007
20082009
20102011
20122013
0.0%
20.0%
40.0%
60.0%
80.0%
100.0%
120.0%
140.0%
All Items Detail Polynomial (Detail)
Earliest data for the Detail Index is from year 2000.1996-1999 Detail data is extrapolated from the trend lineusing quadratic curve fit (order 2 polynomial).

Comparison of change in CPI-U Detail Indexfor Water and Sewer and Trash Collection Services
with change in EID Water Rates
19961997
19981999
20002001
20022003
20042005
20062007
20082009
20102011
20122013
-20.0%
0.0%
20.0%
40.0%
60.0%
80.0%
100.0%
120.0%
140.0%
All Items DetailPolynomial (Detail) 0.0%
Earliest data for the Detail Index is from year 2000.1996-1999 Detail data is extrapolated from the trend lineusing quadratic curve fit (order 2 polynomial).
19961997
19981999
20002001
20022003
20042005
20062007
20082009
20102011
20122013
-20.0%
0.0%
20.0%
40.0%
60.0%
80.0%
100.0%
120.0%
140.0%
All Items DetailPolynomial (Detail) EID Water
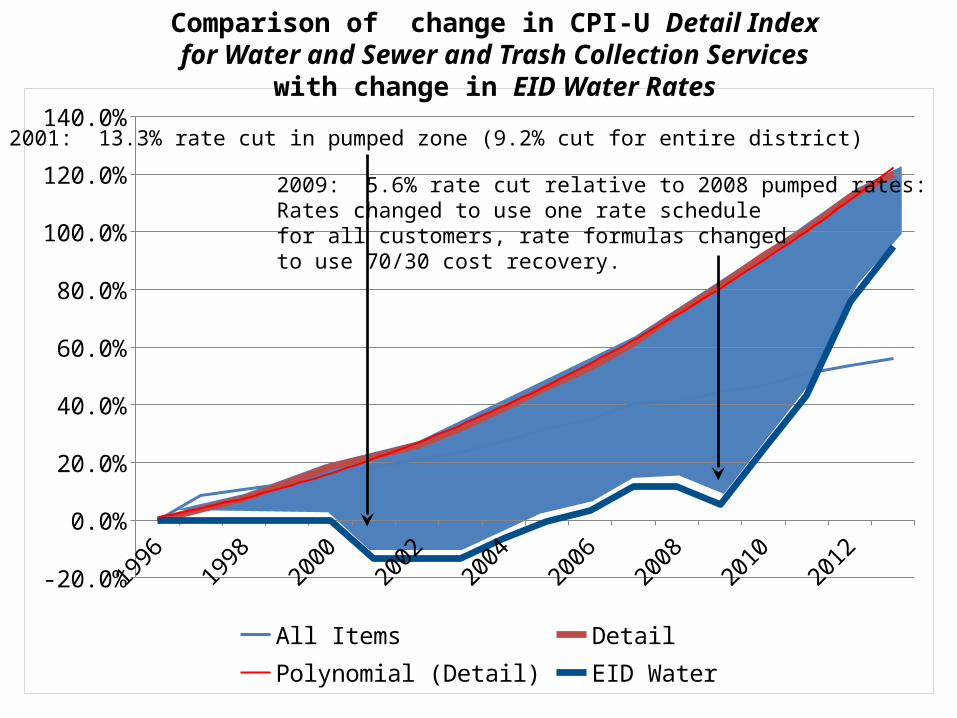
Comparison of change in CPI-U Detail Indexfor Water and Sewer and Trash Collection Services
with change in EID Water Rates
2001: 13.3% rate cut in pumped zone (9.2% cut for entire district)
2009: 5.6% rate cut relative to 2008 pumped rates:Rates changed to use one rate schedulefor all customers, rate formulas changedto use 70/30 cost recovery.

Comparison of change in EID Total Expenses per water service,EID Water cost for 3,000 cf bimonthly, and CPI-U detail inflation index
Costs on this graphare per water customer
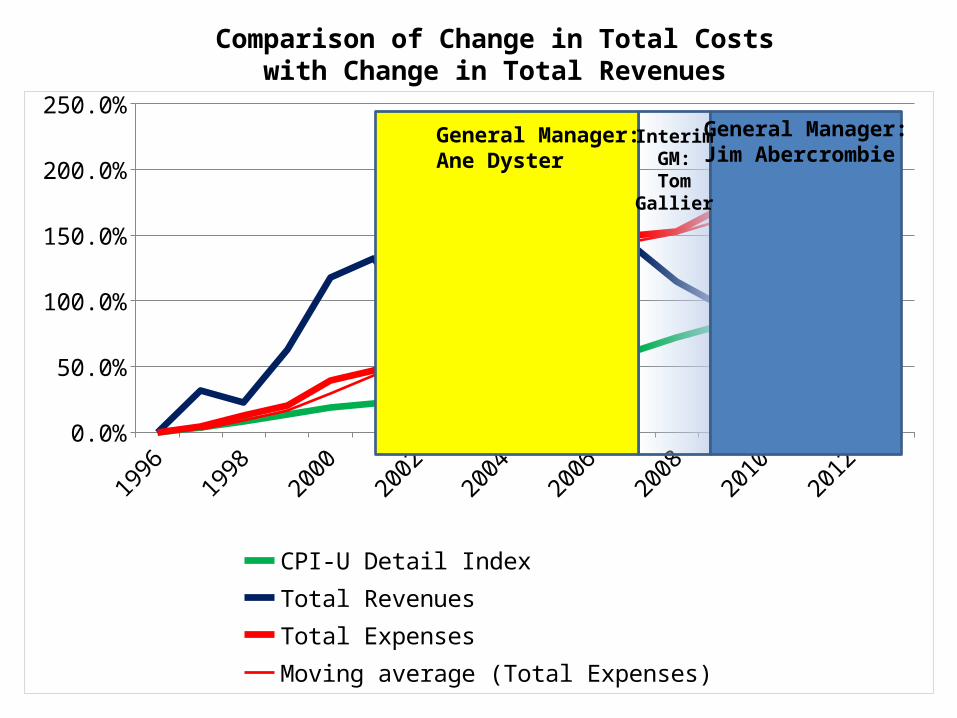
General Manager:Ane Dyster
InterimGM:Tom
Gallier
General Manager:Jim Abercrombie
19961997
19981999
20002001
20022003
20042005
20062007
20082009
20102011
20122013
-20.0%
0.0%
20.0%
40.0%
60.0%
80.0%
100.0%
120.0%
140.0%
CPI-U Detail Index EID Water RatesTotal Expenses Moving average (Total Expenses)

Comparison of change in EID Operating Expenses per water service,EID Water cost for 3,000 cf bimonthly, and CPI-U detail inflation index
Costs on this graphare per water customer
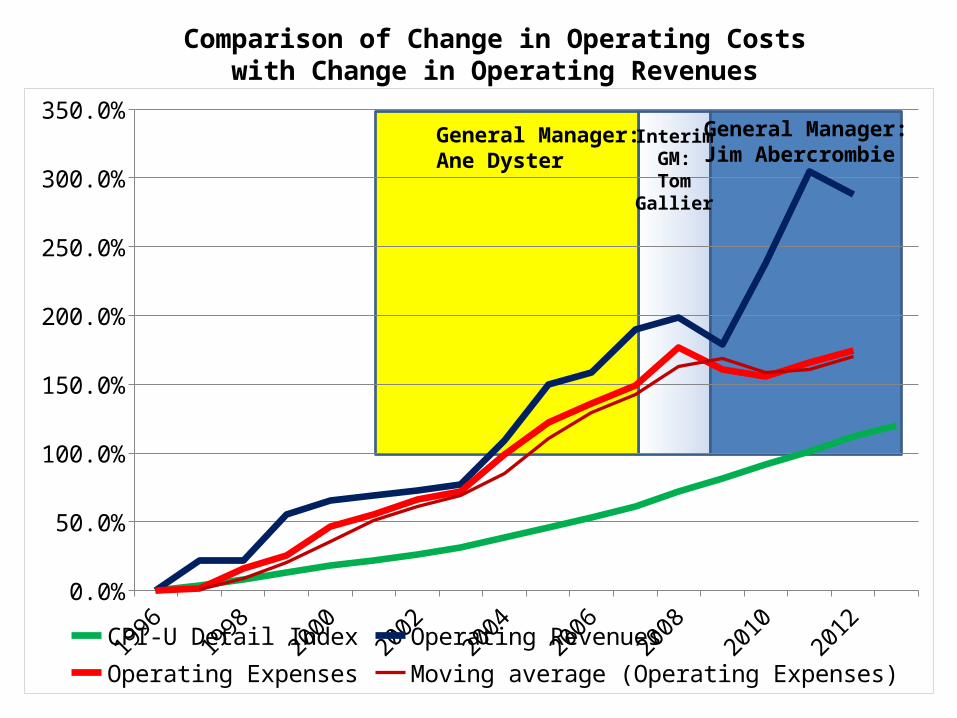
General Manager:Ane Dyster
InterimGM:Tom
Gallier
General Manager:Jim Abercrombie
19961997
19981999
20002001
20022003
20042005
20062007
20082009
20102011
20122013
-20.0%
0.0%
20.0%
40.0%
60.0%
80.0%
100.0%
120.0%
140.0%
CPI-U Detail Index EID Water Rates Operating ExpensesMoving average (Operating Expenses)

Comparison of change in CPI-U Detail Indexfor Water and Sewer and Trash Collection Serviceswith change in EID Water Rates and EID Total Cost
Growth in Total Costsroughly doubled underbudgets & planning by2001 – 2007 GM
19961997
19981999
20002001
20022003
20042005
20062007
20082009
20102011
20122013
-50.0%
0.0%
50.0%
100.0%
150.0%
200.0%
CPI-U Detail Index EID Water Rates Total Expenses
19961997
19981999
20002001
20022003
20042005
20062007
20082009
20102011
20122013
0.0%
50.0%
100.0%
150.0%
200.0%
250.0%
CPI-U Detail Index Total RevenuesTotal Expenses Moving average (Total Expenses)
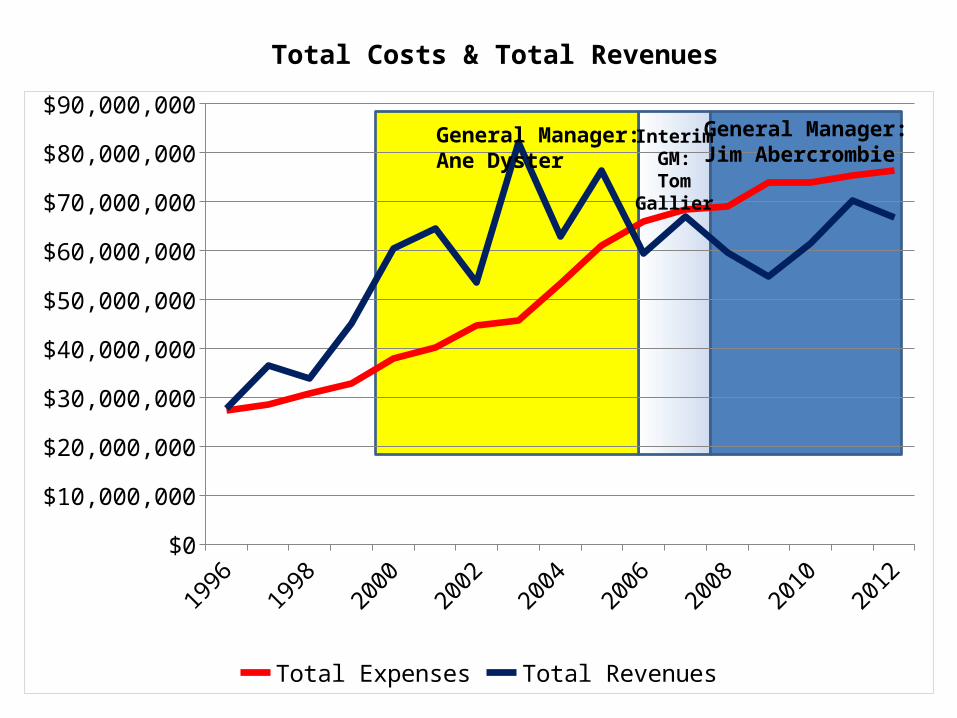
Comparison of Change in Total Costswith Change in Total Revenues
General Manager:Ane Dyster
InterimGM:Tom
Gallier
General Manager:Jim Abercrombie
19961997
19981999
20002001
20022003
20042005
20062007
20082009
20102011
20122013
0.0%
50.0%
100.0%
150.0%
200.0%
250.0%
300.0%
350.0%
CPI-U Detail Index Operating RevenuesOperating Expenses Moving average (Operating Expenses)
Comparison of Change in Operating Costswith Change in Operating Revenues
General Manager:Ane Dyster
InterimGM:Tom
Gallier
General Manager:Jim Abercrombie
19961997
19981999
20002001
20022003
20042005
20062007
20082009
20102011
2012$0
$10,000,000
$20,000,000
$30,000,000
$40,000,000
$50,000,000
$60,000,000
$70,000,000
$80,000,000
$90,000,000
Total Expenses Total Revenues
Total Costs & Total Revenues
General Manager:Ane Dyster
InterimGM:Tom
Gallier
General Manager:Jim Abercrombie

$0
$10,000,000
$20,000,000
$30,000,000
$40,000,000
$50,000,000
$60,000,000
$70,000,000
GAAP Operating Expenses Operating Revenues
Operating Costs & Operating Revenues
General Manager:Ane Dyster
InterimGM:Tom
Gallier
General Manager:Jim Abercrombie

19961997
19981999
20002001
20022003
20042005
20062007
20082009
20102011
20122013
-20.0%
0.0%
20.0%
40.0%
60.0%
80.0%
100.0%
120.0%
CPI-U Detail Index EID Water Rates Operating Expenses
Comparison of change relative to 1996 in:
EID Water Rates: Cost for 3,000 cf bimonthlyCPI-U detail index, national average customer cost for water, sewer, & trash
EID Operating Expenses per water service [per customer]

Change in costs relative to 1996 in inflation-adjusted (constant 1996) dollars:Inflation metric uses CPI-U detail index for water, sewer & trash
EID Operating Expenses per water service [per customer]
19961997
19981999
20002001
20022003
20042005
20062007
20082009
20102011
20122013
-50.0%
-40.0%
-30.0%
-20.0%
-10.0%
0.0%
10.0%
20.0%
CPI-U Detail Index EID Water Rates EID Operating Expenses
CPI-U detail index,national average customer cost for water, sewer, & trash
EID Water Rates: Cost for 3,000 cf bimonthlyin pumped zone for year with separate pumped/gravity rates

19961997
19981999
20002001
20022003
20042005
20062007
20082009
20102011
20122013
-30.0%
-20.0%
-10.0%
0.0%
10.0%
20.0%
30.0%
40.0%
50.0%
CPI-U Detail Index EID Water Rates Operating Expenses
CPI-U all items index,national average consumer costs (urban)
EID Water Rates: Cost for 3,000 cf bimonthlyin pumped zone for year with separate pumped/gravity rates
Change in costs relative to 1996 in inflation-adjusted (constant 1996) dollars:Inflation metric uses CPI-U index for all items
EID Operating Expenses per water service[per customer]

System analysis needs to begin with scoping the system.
One element of analytical scope for EID rate changes is time.
At the 2/24/2014 meeting I noted that the need for high water rate increases beginningin the most recent five years was due to artificial restraint of rates from 1996 to 2009.In the latter 13 years the aggregate rate increase in the Pumped Zone was 5.6% whilenational water cost increased by an average of 82%.
Following a break in the meeting Director Prada stated briefly that there were four “rate hikes”In that 13-year period. This demonstrates Director Prada’s overriding focus on “rate hikes”.This neglects two rate decreases in that period, the larger being a 13.3% decrease in 2001in the Pumped Zone. The important result is what I stated: Understanding need for recenthigh rate increases must begin with the ultimate cause, freezing and lowering rates while costsincreased.
Because of Present-Value considerations, what matters is not only how much rates changedbut also when they changed. One step down in level of abstraction, the major sourceof the rate problems was in the first 8 years of the 13. In four of the last five years the boardused a 5% annual increase to adjust for cost inflation. If this had begun in 1996 it would havebeen excessive; beginning in 2004 it was insufficient to make up for the preceding cumulativeshortage in Operating Revenues.

Water cost scoping involves geography and industry.
Graphs on the next two pages show two points that consumer costs for water, sewer, and trash services have risen much more rapidly than overall consumer costs. This is fromnational averages reported by the BLS in CPI-U data. A further finding is essential to recognize in analyzing consumer costs:
Inflation in overall consumer costs (the CPI-U “All Items” index) has been growingas a linear function of time. Annual cost growth has been by adding an approximatelyconstant amount.
Inflation in water/sewer/trash costs has been growing as a quadratic function of time.Annual cost growth has been by multiplying the preceding year’s cost by an approximatelyconstant percentage.
Similar cost growth is evident in data from multiple rate surveys for the State of California. To date, data are consistent with a hypothesis that cost factors affecting water agencies are common to most water agencies throughout the nation and throughout California. EID directors who campaigned on an argument that “There’s something wrong with EID” need to recognize that EID has been outperforming most of California and most of the United State in restraining cost increases. It’s not possible to fix state and national problems by local action on the EID board.

Comparison of national inflation in Water, Sewer, and Trashconsumer costs with all consumer costs
Quantified as percentage of 1996 costs for both indices
19961997
19981999
20002001
20022003
20042005
20062007
20082009
20102011
20122013
0.0%
20.0%
40.0%
60.0%
80.0%
100.0%
120.0%
140.0%
All Items Linear (All Items)Detail Polynomial (Detail)
Detail cost index in CPI-U tablesfor “water, sewer, & trash”
Overall CPI-U cost indexfor “all items”
Trend line is quadratic(order 2 polynomial)
Annual increase is multiplicative
Trend line is linear: Annual increase is additive

National inflation in Water, Sewer, and Trash consumer costsrelative to all consumer costs (CPI-U “All Items”)
[graphed with the domain transform to relate to “constant 1996 dollars” for All Items]
19961997
19981999
20002001
20022003
20042005
20062007
20082009
20102011
20122013-10.0%
40.0%
90.0%
140.0%
190.0%
240.0%
All Items Linear (All Items)Detail Polynomial (Detail)
NATIONAL CPI-U detailcost index for water,sewer, & trash
NATIONAL CPI-U indexfor “All Items”

Checking a different region
The next page includes a bar graph of average customer rates in Massachusetts ,for retail rates set by over 60 cities and agencies. Two subsequent pages merge tracesof the MWRA data, the CPI-U data, and EID data. MWRA is the Massachusetts Water Resources Authority, a water wholesaler.Its Advisory Board publishes an annual survey of its customers’ retail water costsfor consumption of 1,200 cubic feet per month (2,400 cf bimonthly). In the MWRA survey, this bar graph tracks customer costs since 1991. Two subsequent line graphs combine CPI-U data, MWRA data, and EID data.They show that increases in MWRA retailers’ average customer costs are nearlyidentical to increases in average customer costs reported by the national CPI-Udetail index for water, sewer and trash services.
High customer cost growth is measured in Massachusetts and in the nationas a whole: It’s not specifically an EID problem. In fact, EID costs have beenheld well below the nadional and MWRA indices, gaining on them only sincehigh rate increases began in 2010.
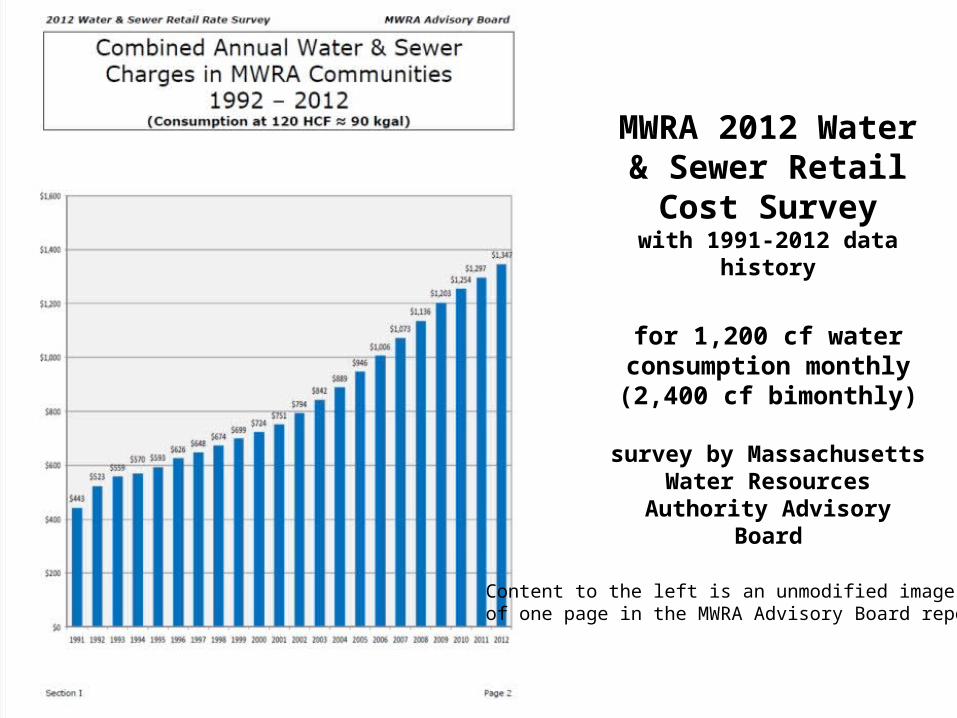
MWRA 2012 Water & Sewer Retail
Cost Surveywith 1991-2012 data history
for 1,200 cf water consumption monthly(2,400 cf bimonthly)
survey by Massachusetts Water Resources Authority
Advisory Board
Content to the left is an unmodified imageof one page in the MWRA Advisory Board report.

Comparison of EID water+sewer annual costs withMWRA retailers water+sewer annual costsand CPI-U water+sewer+trash detail index
19961997199819992000200120022003200420052006200720082009201020112012$0
$200
$400
$600
$800
$1,000
$1,200
$1,400
$1,600
MWRA EID EID water-only CPI-U*
*The CPI-U detail index plot is scaled to make its 1996 value identical to the 1996 MWRA costsfor direct comparison between costs in the nation as a whole and in a region other than California.
MWRA: 1,200 cf water monthly [2,400 cf bimonthly] , sewage flow not stated in data source [This is approximately equivalent to EID’s “Medium” water usage case; inside usage is similar, Massachussetts has more natural rainfall and less landscape irrigation.]
EID: 2,400 cf water bimonthly [1,200 cf monthly] , 1,800 cf wastewater bimonthly [900 cf monthly]

Change relative to 1996 constant dollars (CPI-U All Items index) for…
19961997199819992000200120022003200420052006200720082009201020112012
-40.0%
-20.0%
0.0%
20.0%
40.0%
60.0%
80.0%
100.0%
120.0%
140.0%
MWRA EID EID water-only CPI-U*
* The CPI-U detail index is plot equates its 1996 value to that of the 1996 MWRA rates in order to compareaverage cost inflation in more than 60 Massachusetts retail agencies with the national average cost increase.
MWRA: 1,200 cf water monthly [2,400 cf bimonthly] , sewage flow not stated by data source [This is approximately equivalent to EID’s “Medium” water usage case; inside usage is similar, Massachussetts has more natural rainfall and less landscape irrigation.]
EID: 2,400 cf water bimonthly [1,200 cf monthly] , 1,800 cf wastewater bimonthly [900 cf monthly]
MWRA (Massachusetts Water Resources Authority) water + sewer EID Water + Sewer EID Water National CPI-U detail index for water + sewer + trash