available online a t · available online a t ... recent advances in microseismicity technology ......
TRANSCRIPT
www.scholarsresearchlibrary.comtAvailable online a
Scholars Research Library
Archives of Applied Science Research, 2016, 8 (4):13-19
(http://scholarsresearchlibrary.com/archive.html)
ISSN 0975-508X
CODEN (USA) AASRC9
13 Scholars Research Library
Microseismicity applications in hydraulic fracturin g monitoring
Ali Isa1 and Mustapha A. Mohammed2
Department of Physics, Federal University Lokoja Department of Physics, Federal University Lafia
_____________________________________________________________________________________________
ABSTRACT Microseismic has been used basically to monitor hydraulic fracturing, which is a short term plan and to monitor steam injection, a long term plan. Recent advances in microseismicity technology has led to an increase in its usage in the reservoir monitoring activities such as gas storage, co2 injection , hydraulic fracture operations , production monitoring (oil and gas) etc., and thus, fast becoming a viable technique in oil and gas industry. This is because of its unique service it renders through provision of fast and accurate information about stress changes in a reservoir and the associated geomechanical deformation which are used to characterize complex fracture networks and fluid flow paths. Due to its relevance in monitoring fracture network and fluid flow paths, a lot of efforts and innovations in the recent years have been channeled to improving its mode of operations and its imaging capabilities. In this study, we highlighted the methods of acquiring and processing microseismic data, their limitations and pitfalls and its applications in unconventional reservoirs. Keywords: Microseismicity, Reservoir, Hydraulic fracturing, Unconventional reservoir, geomechanical _____________________________________________________________________________________________
INTRODUCTION
Induced seismicity events could be linked to production of hydrocarbon and fluid injection in a reservoir. These events are generated in the rock matrix which are due to the changes in pore pressure and geomechanical stress field. These changes in stress slippage (usual the shear stress) can occur in the zones of weakness associated with new or preexisting faults and fractures and thus emits microseismic waves. To monitor the hydraulic fracturing, emissions from the microseismic events should be mapped and recorded. In order to gather useful information from the data, locating areas with high population of microseismic events will be necessary in order to increase the resolution of the hydraulic monitoring and imaging. The simulation of hydraulic fracturing has helped to improve enhanced oil recovery during water-flooding and in exploitation of unconventional gas reservoir, [1]. The distribution patterns of the events are interpreted with respect to the geomechanical deformation linked to the fluids that are produced or injected. Other applications include, delineating the fluids leakage paths, fluid fronts etc., which can then be used to manage the reservoir and adequately plan for future wells. This technology recorded it breakthrough within the last decade, but it has been in existence since 1947 when Stanolind adopted the technology at Hugoton Field, Kansas, USA [8]. Today, over 2.5 million wells have been fractured and possibly been monitored. There are three predominant application of microseismicity: environmental monitoring, long-term reservoir monitoring and short-term reservoir monitoring [4]. Our focus in this review is on hydraulic monitoring. In this article we give some insights into how the technology works, processing and interpretation of the data, and some of its advantage and its pitfalls, and future integration of the method with real seismic and well log data.

Ali Isa and Mustapha A. Mohammed Arch. Appl. Sci. Res., 2016, 8 (4):13-19 ______________________________________________________________________________
14 Scholars Research Library
Monitoring Wells Monitoring wells are wells drilled to measure specific well parameters that can indicate performance, longevity and transient processes (Figure 1)
Figure 1: Diagram demonstrating microseismic monitoring of a hydraulic fracture [6].
Hydraulic Fracture Monitoring Hydraulic Fracturing or fracking is the process of drilling and injecting fluid into the ground at a high pressure in order to fracture shale rock to release natural gas inside the reservoir. As a result of the pressure exerted on the rock during the drilling, there is an increase in pore pressure; the increased pore pressure caused the minor naturally occurring fracture in the formation to slip leading to Microseismic (elastic wave). These movements need to be monitored and observed through geophysical equipment and applications (geophones etc) (Figure 2). The information acquired from the process are then used for several purposes like reservoir information, production enhancement and prediction, environmental impact assessment, developmental planning of a basin or field etc.
Figure 2: Illustration of Hydraulic Fracturing and Microseismic Monitoring [10]

Ali Isa and Mustapha A. Mohammed Arch. Appl. Sci. Res., 2016, 8 (4):13-19 ______________________________________________________________________________
15 Scholars Research Library
Figure 3: Hydraulic fracturing process [2] Hydraulic fracturing can be monitored when microseismic events are induced due to fracturing of a reservoir especially an unconventional reservoir, which are naturally fractured. A typical example of this imaging technology is in Barnett Shale in Shale, which has become one of the largest fields in the United States. Microseismic imaging has become a viable tool that helps in the understanding of the of complex unconventional reservoir fracture networks [4]. Hydraulic fracturing model is now integrated with microseismic monitoring [5] The operations that are involved in the microseismicity imaging have a short time duration which will be suitably deployed to a far offset well. To obtain an accurate location of the microseismic events, the array of the sensors should be restricted to one or more monitoring wells and their spacing and positions with respect to the well should be taken into account.
MATERIALS AND METHODS
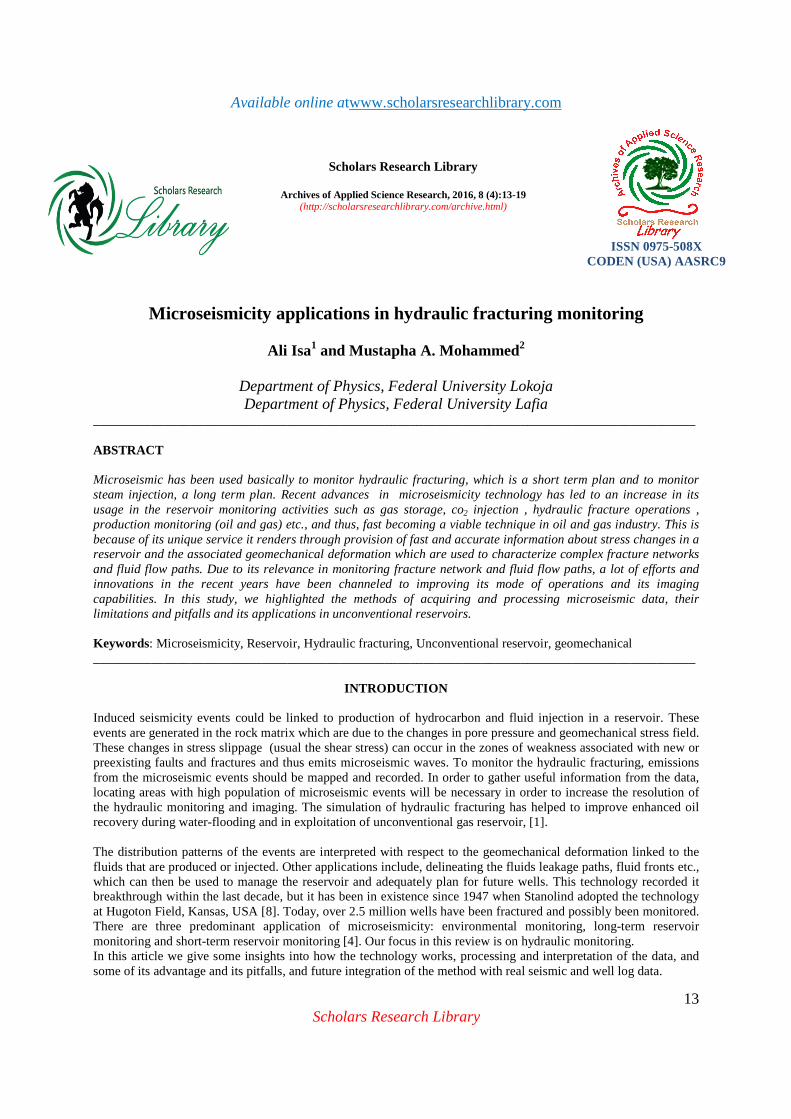
Data Acquisition The setup is made up of sensors that are coupled to the reservoir rock with a view to recording low energy signals and deliver them as microseismic signals on the surface. The deployment of this system depends on the objective of the monitoring exercise, the availability of well (s), proximity to the events of interest, and accessibility to oil field. Basically, there are three main approaches involved in acquiring microseismic data during hydraulic fracturing operations. [8] listed the three different techniques of acquiring the data: 1) Placing 3-component geophones in wellbores at near-reservoir depths – downhole method [11] Figure 4. In this method the microseismic signals are recorded but however, it has major pitfalls in the sense that the length of the geophones and the weak signals limit the distance of the monitoring well.
Ali Isa and Mustapha A. Mohammed Arch. Appl. Sci. Res., 2016, 8 (4):13-19 ______________________________________________________________________________
16 Scholars Research Library
Figure 4: Diagram showing wireline deployment of a string of geophones in a monitoring well [7]
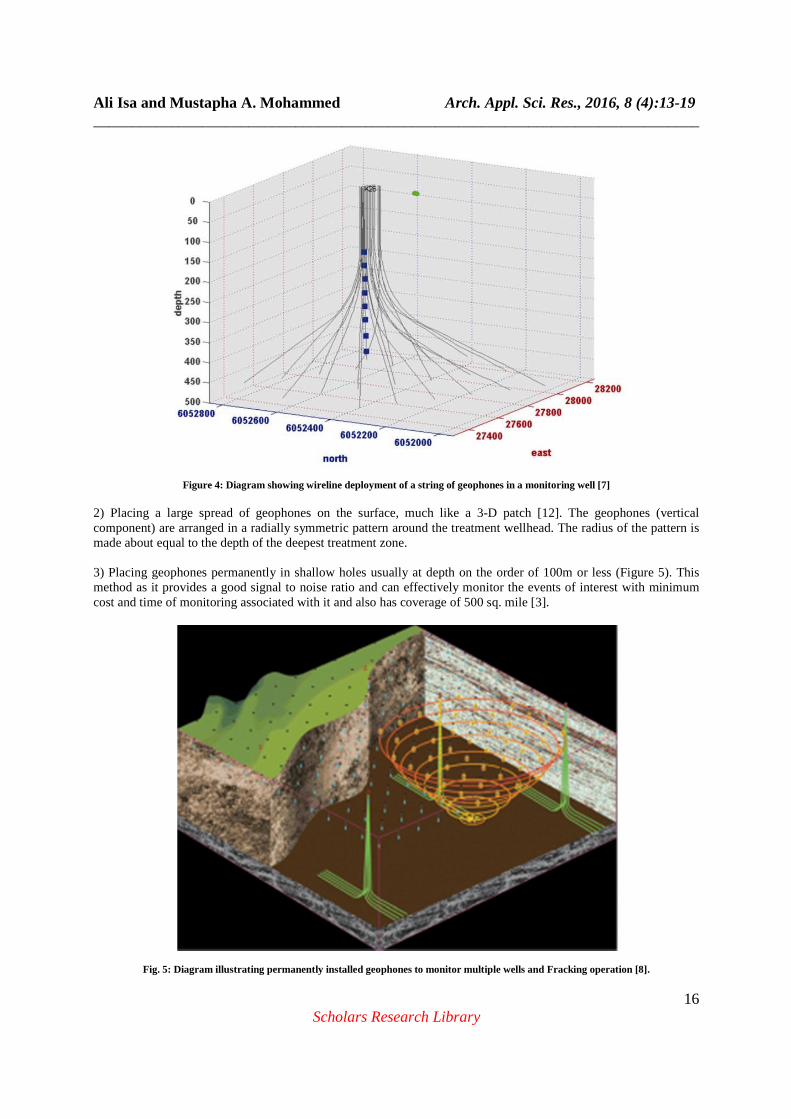
2) Placing a large spread of geophones on the surface, much like a 3-D patch [12]. The geophones (vertical component) are arranged in a radially symmetric pattern around the treatment wellhead. The radius of the pattern is made about equal to the depth of the deepest treatment zone. 3) Placing geophones permanently in shallow holes usually at depth on the order of 100m or less (Figure 5). This method as it provides a good signal to noise ratio and can effectively monitor the events of interest with minimum cost and time of monitoring associated with it and also has coverage of 500 sq. mile [3].
Fig. 5: Diagram illustrating permanently installed geophones to monitor multiple wells and Fracking operation [8].

Ali Isa and Mustapha A. Mohammed Arch. Appl. Sci. Res., 2016, 8 (4):13-19 ______________________________________________________________________________
17 Scholars Research Library
Application And Discussions For this study, method 2 and 3 will be merged together (same mode of operation) and will be referred to as surface/near surface array method. However, various studies have showed that adopting 2 methods (downhole and surface or near surface array methods can greatly enhance the quality of the data acquired. This will assist to fill the gaps inherent in their respective limitations, as such; will assist to reconcile both approaches. Hence studies have showed that surface or near surface array method proves to be more suitable for detecting microseismic events. Data Processing : There are two basic methods of analyzing microseismic events:
I. Travel time inversion method [11]. II. Waveform migration method [12].
Travel Time Inversion Method The technique use in this method is to pick the arrival time of the P and S phases (elastic wave). These waves are generated when hydraulic fracture forcefully stresses the surrounding rocks, and increase the pore pressure. The waves however travelled at different speed. The arrival times of the waves are picked by the receivers (Figure 6) with its velocity. This is then use to estimate the hypocenter (location and time) of the fracture [9]. These events are then monitored, processed and interpreted by various geophysical applications. The results are always presented as map sections known as ‘dots in the box’ result [8]. It should be noted that trilateration or travel time inversion is best use in a single observation station because of it closeness to the monitoring reservoir. (Downhole method – Multiple geophones on a single well).
Figure 6: P and S wave arrival (Left) Seismic Wave Path [9] Waveform migration method This method was introduced in 2013. It requires that the observed wave-field is inferred from the observation points backward in time to the source point known as time shifted. The time shifted traces are summed or stacked, and the resultant stacked trace is evaluated to know if it’s an event [9]. This approach requires a well sampled wave-field over a large aperture. The procedure is repeated for every possible event location in the subsurface. It is best adopted when a surface or near surface array method of acquisition is used (Multiple geophones on multiple well) [13]. This method requires a good number of geophones (size of the array must be twice the depth of the mark reservoir) to acquire data with good signal to noise ratio. [9], deployed microseismicity technology to monitor the microseismic events during hydraulic fracturing of wells in Permian basin to determine the techniques best suitable to produce high quality results in terms of signal to noise ratio, downhole image, and events count (improve imaging capability). A full waveform migration method was used to analyze the data acquired from both the downhole and surface or near surface array methods. Figure 7 represents the result of full-waveform downhole image point set (Left – map view; Right – Depth view looking east). Also Figure 8 illustrates the result of surface image point set (Left – map view; Right – Depth view looking east).

Ali Isa and Mustapha A. Mohammed Arch. Appl. Sci. Res., 2016, 8 (4):13-19 ______________________________________________________________________________
18 Scholars Research Library
Figure 7: Full-waveform downhole image point set (Left – map view; Right – Depth view looking east) [9] Figure 7 shows rich downhole image point set around the monitoring borehole, good zonal control and good events count. The imaging point sets that are close to the monitoring borehole contain valid microseismic events. This is because the imaging uses both P and S wave energy. However, the point that extends beyond 3000ft from the monitoring borehole contains lots of uncertainties and thus could not be observed in the result. Figure 8 is the result of the surface image points. Although the point sets are not as rich as the downhole image point sets, but however, they were able to pick all the events in the footprint of the surface array with acceptable uncertainty. This is was obvious because of the presence of larger surface array footprint.
Figure 8: Surface image point set (Left – map view; Right – Depth view looking east) [9]

Ali Isa and Mustapha A. Mohammed Arch. Appl. Sci. Res., 2016, 8 (4):13-19 ______________________________________________________________________________
19 Scholars Research Library
The above analysis has shown that the application of full waveform migration method to process data acquired through downhole method will enhance good imaging set but failed to pick any microseismic events that are not located close to the monitoring borehole. Also application of full waveform migration method to process data acquired through surface or near surface array method has the capacity to record events that are far away from the monitoring borehole because of the presence of larger surface or near surface array.
CONCLUSION
Utilization of microseismicity in hydraulic fracturing monitoring was revisited with a view to infer the best method of data acquisition and processing. This technology is used to obtain an accurate and a more reliable information about the stress changes in unconventional reservoirs and fluid flow paths for proper monitoring of the reservoir over a long period of time with minimal costs. The sensors should be integrated with permanent pressure, temperature and flow gauges in wells to monitor the changes in the reservoir fluids properties continuously and also map out complex fracture networks. This information will enhance in the understanding of the fluid behavior and drainage strategy in unconventional reservoirs for future planning and development.
REFERENCES [1] B. Thierry. Microseismic monitoring downhole instrumentation for hydraulic fracture mapping. A review through case histories, 2010. http://www.sercel.com/product/ lists/productpublication/Microseismic%20monitoring%20downhole%20instructment%20for%20hydraulic%20fracture%20mapping.pdf accessed 7 Dec., 2015. [2] Fracking, 2015 https://www.propublica.org/special/hydraulic-fracturing-national, accessed 18 Dec., 2015. [3]G.Kelly. Microseismic Monitoring,2011. https://www.slb.com/media/flies/ stimu lation/industry_articles/201101_ep_microseismic_monitoring.pdf accessed 7 Dec., 2015 [4]G. M. Kim, M. Shawn, K. Nick, and G. Robert. Application of Microseismic in the oil and Gas Industry,2010http://www.slb.com/~/media/Files/evaluation/industry_articles/201009_geoexpromicroseismic.pdf, accessed 18 Dec., 2015. [5]H. Baker. Borehole Microseismic Monitoring Services Monitor fracture activity to refine fracture design, Inc., 2014, www.magnitude-eo.com/pdf/41642_boreholemonitoringmag ov.pdf, accessed 7 Dec., 2015. [6]Induced Seismicity Potential in Energy Technologies, 2013, www.nap.edu/read/13355/chapter/20, accessed 18 Dec., 2015. [7]J. S. Richard, , 15 years of passive seismic monitoring at Cold Lake, Alberta, 2010. http://csegrecorder.com/articles/view/15-years-of-passive-seismic-monitoring-at-cold-lake-alberta, accessed 18 Dec., 2015. [8]M. D. Peter. Microseismic Monitoring for Unconventional Resource Development, 2012. http://www.spgindia.org/geohorizons_jan2012issue/3_paper.pdf accessed 7 Dec., 2015. [9]M. D. Peter and W. N. Carl., Microseismic Monitoring, Method Improves Microseismic Result Permian Basin, 2015. http://www.aogr.com/magazine/frac-facts/method-improves-mocroseismin -result, accessed 13 Dec., 2015. [10] Microseismic Monitoring 101, 2015, https://www.esgsolutions.com/technical-resources/microseismic-knowledgebase/microseismic-monitoring-101 accessed 18 Dec., 2015. [11] M. Shawn . The Leading Edge Microseismic: Growth born from success. 2010, 29(3), 338-343.doi: 10.1190/1.3353732, http://library.seg.org/doi/abs/10.1190/1.3353732 , accessed 18 Dec., 2015. [12] P. Duncan and L. Eisner. Geophysics, Reservoir characterization using surface microseismic monitoring, 2010,75,pp.75A139-75A146. http://www.spgindia.org/geohorizons_jan2012_issue/3_paper.pdf accessed 18 Dec. 2015. [13] W. E. Dave. Comparing energy calculations: Hydraulic fracturing and microseismic Monitoring, 2012.http://www.geoconvention.com/archives/2012/313_GC2012_comparing_ Energy_calculations.pdf accessed 7 Dec., 2015.