availability of internationally controlled drugs: ensuring
TRANSCRIPT
9
Chapter II.
Narcotic drugs
A. Supply of and demand for opiate raw materials and opioids
52. Inadequate distribution of consumption of opioid analgesics is not the result of a lack of supply of raw mate-rials and opioids. To the contrary, the Board has been concerned by an increase in the production of such sub-stances without a corresponding increase in consump-tion, leading to a consequent increase in stocks.
53. Opiates consumed by patients for medical treatment are obtained from opiate raw materials (opium, poppy straw and concentrate of poppy straw). Adequate availa-bility of opiate raw materials for the manufacture of opi-ates is therefore a precondition for ensuring the adequate availability of opiates used for medical and scientific purposes.
54. Pursuant to the 1961 Convention and the relevant resolutions of the Commission on Narcotic Drugs and the Economic and Social Council, the Board examines on a regular basis developments affecting the supply of and demand for opiate raw materials. The Board endeavours, in cooperation with Governments, to maintain a lasting balance between supply and demand. Global stocks of opiate raw materials should cover global demand for
about one year to ensure the availability of opiates used for medical and scientific purposes in the event of an unexpected decline in production resulting from, for example, adverse weather conditions in producing countries.32
55. At the end of 2013, global stocks of opiate raw materials rich in morphine were sufficient to cover global demand for 14 months. Global stocks of opiate raw materials rich in thebaine were sufficient to cover global demand for 12 months. In 2014, the global pro-duction of opiate raw materials rich in morphine was greater than the utilization of those materials. The global supply (stocks and production) of opiate raw materials rich in morphine was fully sufficient to cover global demand.
56. Figure 1 presents data on the manufacture, stocks, consumption and utilization33 of morphine during the period 1994-2013. Global manufacture of morphine dou-bled during that 20-year period, increasing from about 247.1 tons in 1994 to 522.6 tons in 2013, which was a further increase from the 475.3 tons recorded in 2012. Around 70 per cent of the morphine manufactured glob-ally is converted into other narcotic drugs or into sub-stances not covered by the 1961 Convention. The rest is used directly for medical purposes.
32 Report of the International Narcotics Control Board for 2014 (E/INCB/2014/1), para. 90. 33 “Consumption” indicates the quantity of the drug to be consumed directly for domestic medical and scientific purposes, while “utilization” refers to quantity of the drug to be utilized for the manufacture of other drugs, preparations included in Schedule III of the 1961 Convention or substances not covered by the 1961 Convention.

10 AVAILABILITY OF INTERNATIONALLY CONTROLLED DRUGS
Figure 1. Morphine: global manufacture, stocks, consumption and utilization, 1994-2013
Source: International Narcotics Control Board.a Stocks as at 31 December of each year.
57. Until the 1990s, thebaine, the other main alkaloid obtained from opium poppy, was manufactured mainly from opium; since 1999, it has been obtained primarily from poppy straw. Thebaine may also be obtained through the conversion of oripavine or from semi-synthetic opioids, such as hydrocodone. Thebaine itself is not used therapeutically, but it is an important starting material for the manufacture of a number of opioids, mainly codeine, dihydrocodeine, etorphine, hydrocodone, oxycodone and oxymorphone (all of which are controlled under the 1961 Convention) and buprenorphine (which is controlled under the 1971 Convention). Global manufacture of thebaine has increased sharply since the late 1990s, as a consequence of the grow-ing demand for oxycodone and other drugs and substances that may be derived from it (see figure 2).
Figure 2. Thebaine: global manufacture, utilization and stocks, 1994-2013
Source: International Narcotics Control Board.a Stocks as at 31 December of each year.
58. The information available to the Board indicates that global production of opiate raw materials rich in the-baine exceeded global demand in 2014. Total stocks of opiate raw materials rich in thebaine were sufficient to cover global demand for about one year. The plans of pro-ducing countries indicate that global production of opi-ate raw materials rich in thebaine will be slightly less than global demand in 2015. Total stocks of opiate raw mate-rials rich in thebaine are therefore expected to decrease. The global supply (stocks and production) of opiate raw materials rich in thebaine will continue to be sufficient to fully cover global demand.
59. Codeine is a natural alkaloid of the opium poppy plant, but most of the codeine currently being manu-factured is obtained from morphine through a semi- synthetic process. There has been an increase in the cultivation of the opium poppy variety that is rich in codeine and in the manufacture of concentrate of poppy straw rich in codeine, which is used for the extraction of codeine. Global utilization of concentrate of poppy straw rich in codeine amounted to 24.6 tons in 2013, which is a fraction of the amount of morphine used. Codeine is used mainly for the manufacture of preparations in Schedule III of the 1961 Convention, while a smaller quantity is used for the manufacture of other narcotic drugs, such as dihydrocodeine and hydrocodone. The trends relating to global manufacture, consumption, utilization and stocks of codeine during the period 1994-2013 are shown in figure 3.
Figure 3. Codeine: global manufacture, stocks, consumption and utilization, 1994-2013
Source: International Narcotics Control Board.a Stocks as at 31 December of each year.
60. Global demand for opiate raw materials rich in mor-phine and rich in thebaine is expected to rise in the future. It is anticipated that global demand for opiates
0
50
100
150
200
250
300
350
400
450
500
550
94 95 96 97 98 99 00 01 02 03 04 05 06 07 08 09 10 11 12 13
Consumption Utilization Stocksa Manufacture
Tons
Year
0
20
40
60
80
100
120
140
160
180
94 95 96 97 98 99 00 01 02 03 04 05 06 07 08 09 10 11 12 13
Stocksa Manufacture Utilization
Tons
Year
0
50
100
150
200
250
300
350
400
450
94 95 96 97 98 99 00 01 02 03 04 05 06 07 08 09 10 11 12 13
Consumption Utilization Manufacture Stocksa
Year
Tons

ChApTER II. NARCOTIC DRUGS 11
and opiate raw materials will also continue to rise. Figure 4 presents the global level of consumption of opiates and synthetic opioids, including buprenorphine and pentazocine, which are opioids controlled under the 1971 Convention, during the 20-year period from 1994 to 2013. To allow the aggregation of consumption data for substances having different potencies, the levels of consumption are expressed in billions of S-DDD.
Figure 4. Global consumption of opioids, 1994-2013
Source: International Narcotics Control Board.a Including buprenorphine, an opiate controlled under the 1971 Convention.b Including pentazocine, a synthetic opioid controlled under the 1971 Convention.c Including opiates and synthetic opioids.
61. Over the past 20 years, global consumption of opi-oids has more than tripled. The consumption of opiates as a percentage of total consumption of opioids fluctuated between 62 per cent in 1994 and 52 per cent in 2006, ris-ing again to 61 per cent in 2013. As a result, the share of synthetic opioids, which are used for the same indications as opiates, increased from 38 per cent in 1994 to 48 per cent in 2008, but declined to 39 per cent in 2013. Between 2010 and 2013, the ratio of consumption of opiates to syn-thetic opioids stabilized at about 60 per cent for opiates and 40 per cent for synthetic opioids. Throughout the period, the supply of opiate raw materials from which opiates were obtained was sufficient to cover increasing demand. It is expected that the demand for opiates will increase again in the future, while their share of the total
consumption of opioids may decline, owing to expected growth in the consumption of synthetic opioids.
62. Overall, the available data indicate that the amount of opiate raw materials available for the manufacture of narcotic drugs for pain relief is more than sufficient to satisfy the current level of demand as estimated by Governments. In addition, both production and stocks continue to increase.
B. Availability of opioid analgesics
63. Opioid analgesics are essential medicines for palli-ation therapy.34 They are prescribed mainly in relation to cancer, but palliation therapy is also needed for other health situations that require the management of pain (such as surgery and childbirth) and for chronic condi-tions such as cardiovascular diseases, chronic respiratory diseases, HIV/AIDS and diabetes.
64. Each year, around 5.5 million terminal cancer patients, 1 million end-stage HIV/AIDS patients and 800,000 patients with lethal injuries caused by accidents or violence, in addition to patients with chronic illnesses, patients recovering from surgery, women in labour and paediatric patients, are subjected to untreated or under-treated moderate to severe pain. All in all, WHO estimates that annually tens of millions of people are suffering without adequate treatment.35
65. It is estimated that, out of the 20 million people in need of palliative care at the end of their lives, about 80 per cent live in low- or middle-income countries.36 According to the Worldwide Palliative Care Alliance, every year at least 100 million people worldwide would benefit from palliative care; however, fewer than 8 per cent of people in need of palliative care have access to it. According to the Harvard Global Equity Initiative-Lancet Commission on Global Access to Pain Control and Palliative Care, “the absence of palliative care also under-mines efforts to improve human well-being, and
34 World Health Organization, Model List of Essential Medicines, 19th list (April 2015, amended June 2015). Available from www.who.int/medicines/publications/essentialmedicines. 35 World Health Organization, Ensuring Balance in National Policies on Controlled Substances: Guidance for Availability and Accessibility of Controlled Medicines (Geneva, 2011). 36 Report by the secretariat of the World Health Organization on the strengthening of palliative care as a component of integrated treatment throughout the life course.
0
2
4
6
8
10
12
14
94 95 96 97 98 99 00 01 02 03 04 05 06 07 08 09 10 11 12 13
Year
Billi
ons
of S
-DD
D
Opiatesa Synthetic opioidsb Opioidsc
12 AVAILABILITY OF INTERNATIONALLY CONTROLLED DRUGS
impoverishes a host of interventions intended to reduce human suffering and strengthen health systems”.37
66. In many countries, especially in less developed regions, the possibility of preventing, treating and curing cancer early is severely limited by a number of factors, including a lack of early detection and prevention policies, and the limits of the health system. In many situations, palliation may be the only option available for handling an increasing number of cases.
67. Other internationally controlled drugs, such as methadone and buprenorphine (an opioid analgesic which is controlled under the 1971 Convention and whose use in substitution therapy continues to increase), can be used in the management of pain but are mostly used in the treatment of drug dependence. However, their use is also limited in some countries despite a consider-able prevalence of heroin abuse.
68. In spite of the common prevalence of the above- mentioned conditions in all regions, pain relief drugs are not available in sufficient quantities, are difficult to obtain because of unduly restrictive procedures, and are not prescribed, owing to a lack of training and capacity of health profession-als or because of fear of addiction, which discourages health professionals from prescribing such medications.
69. Consequently, severe pain is often left untreated, although medical professionals have the capacity to relieve most such pain. Untreated pain diminishes the quality of life of patients, their families, their friends and their com-munities, and may lead to wider losses for society.38
37 F. Knaul and others, “Closing the divide: the Harvard Global Equity Initiative-Lancet Commission on Global Access to Pain Control and Palliative Care”, The Lancet (8 March 2015). 38 N.I. Cherny and others, “The Global Opioid Policy Initiative (GOPI) project to evaluate the availability and accessibility of opioids for the management of cancer pain in Africa, Asia, Latin America and the Carribean, and the Middle East: introduction and methodology”, Annals of Oncology, Vol. 24, Suppl. No. 11 (2013), pp. xi7-xi13.
1. Global patterns of consumption of opioid analgesics
(a) Inadequate access
70. The data available to INCB indicate an increase in the level of reported consumption in S-DDD in the 2011-2013 period in comparison with the 2001-2003 period (see maps 1 and 2). In particular, there was visible pro-gress with regard to availability in Latin America and in the Middle East. In Latin America, consumption of opi-oid analgesics could possibly be even higher than reported because methadone (which is not included in the global S-DDD calculation because of its prevalent use in opiate substitution treatment) is more frequently used for pain relief in this region than in other regions. Very little is used for drug dependence treatment, since the prevalence of heroin abuse is relatively low and therefore opiate sub-stitution treatment services are not common.
71. There have been some small improvements in the Russian Federation and in some countries in Central Asia. However, the situation remains problematic in most of Africa and parts of Asia.
72. The United States, Canada, Australia and some countries in Western Europe have increased their levels of consumption to above 10,000 S-DDD per million inhabitants per day. In some of these countries, there has been a considerable increase in prescription drug abuse, which Governments have taken action to reduce without limiting access for people in need of pain relief medicines.
73. Overall, there has been encouraging progress towards ensuring availability and increasing access to opi-oid analgesics, but that goal is still a distant one for a considerable number of countries.

ChApTER II. NARCOTIC DRUGS 13
Map 1. Availability of opioids for pain management (2001-2003 average)
Source: International Narcotics Control Board.Note: Opioids defined as codeine, dextropropoxyphene, dihydrocodeine, fentanyl, hydrocodone, hydromorphone, ketobemidone, morphine, oxycodone, pethidine, tilidine and trimeperidine.
Map 2. Availability of opioids for pain management (2011-2013 average)
Source: International Narcotics Control Board.Note: Opioids defined as codeine, dextropropoxyphene, dihydrocodeine, fentanyl, hydrocodone, hydromorphone, ketobemidone, morphine, oxycodone, pethidine, tilidine and trimeperidine.
The boundaries and names shown and the designations used on this map do not imply official endorsement or acceptance by the United Nations. The final boundary between South Sudan and the Sudan has not yet been determined. The dotted line represents approximately the Line of Control in Jammu and Kashmir agreed upon by India and Pakistan. The final status of Jammu and Kashmir has not yet been agreed upon by the parties. A dispute exists between the Governments of Argentina and the United Kingdom of Great Britain and Northern Ireland concerning sovereignty over the Falkland Islands (Malvinas).
Consumption in S-DDD per million inhabitants per day < 1 1-100 101-200 201-2,000 2,001-5,000 5,001-10,000 > 10,000

14 AVAILABILITY OF INTERNATIONALLY CONTROLLED DRUGS
(b) Evolution of the consumption of opioid analgesics over time
74. In the past two decades, global consumption of opi-oid analgesics expressed in S-DDD has increased consid-erably. The long-term trend shows an overall increase of 618 per cent between the 1991-1993 period and the 2011-2013 period (see figure 5). That trend was especially pro-nounced during the initial years: between 1991-1993 and 2001-2003, there was an increase of 240 per cent, com-pared with an increase of 84 per cent between 2001-2003 and 2007-2009. The growth rate declined further to 14 per cent during the period between 2007-2009 and 2011-2013. The increase in consumption is mainly the result of an increase in the consumption of fentanyl and, to a limited extent, the consumption of morphine. Global consumption of codeine and pethidine for the treatment of pain has decreased.
Figure 5. Global trend in the consumption of opioid analgesics, 1991-1993, 2001-2003, 2007-2009 and 2011-2013 averages
Source: International Narcotics Control Board.
75. The growth in consumption of opioid analgesics observed since 1991 has been uneven among regions. It has been driven mainly by North America, but also by Europe and Oceania, the three major consumer regions (see figures 6-17).
76. In Asia, the situation is mixed. Here, most countries saw an increase in their consumption during the past dec-ade, although with varying trends at the subregional level. A moderate increase was observed in East, South-East and West Asia, while there was a decrease in South Asia, which continued to have the lowest level of consumption in the world. This decrease is probably attributable to a considerable decrease to the consumption of opioid anal-gesics in India as a consequence of legislative restrictions that had been introduced in the past. Those restrictions have recently been lifted, but it will take some time before the gap in consumption is closed.
77. In Africa, the situation is problematic and consumption continues to be very low despite progress in a few countries. Patterns of consumption fluctuated considerably both in countries with higher levels of consumption and in countries with lower levels of consumption. This is probably due to a lack of capacity of competent national authorities to estimate correctly their national needs.
78. In Central America and the Caribbean, the overall trend shows increased consumption, but there were con-siderable variations among countries. Consumption in Central American and Caribbean countries was still below an adequate level. In South America, most countries had increased their consumption in 2011-2013, even though some of them had experienced drops in consumption in earlier periods. The data for these two subregions, but particularly for South America, have some limitations because, while methadone is used in some of the countries of the region as a pain relief medication and not in substitution treatment—heroin abuse in the region is not common—it is excluded from the S-DDD calculation at the global level.
79. In Europe, the overall trend showed an increase, with some stabilization for some countries.
80. In Australia and New Zealand, consumption increased, which influenced the trend for the whole region.
0
500
1 000
1 500
2 000
2 500
3 000
3 500
1991-1993 2001-2003 2007-2009 2011-2013
S-D
DD
per
mill
ion
inha
bita
nts
per d
ay

ChApTER II. NARCOTIC DRUGS 15
Figure 6. Trends in consumption, by region, 2001-2013
Source: International Narcotics Control Board.
Figure 7. Trends in consumption for selected subregions, 2001-2013
Source: International Narcotics Control Board.
Figure 8. Average consumption of opioid analgesics, all regions, 2001-2003, 2007-2009 and 2011-2013
Source: International Narcotics Control Board.
Figure 9. Average consumption of opioid analgesics in African countries and territories with higher levels of consumption, 2001-2003, 2007-2009 and 2011-2013
Source: International Narcotics Control Board.Note: Red lines: levels less than 200 S-DDD are considered inadequate; levels less than 100 S-DDD are considered very inadequate. For further information on inadequate and very inadequate levels of consumption as identified by the Board, see paragraph 46, above.
North America
Other regions
Western andCentral Europe Oceania
0
5 000
10 000
15 000
20 000
25 000
30 000
35 000
2001-2003 2007-2009 2011-2013
S-D
DD
per
mill
ion
inha
bita
nts
per d
ay
Africa
Central America and the Caribbean
South America
East andSouth-East Asia
South Asia
West Asia
Eastern andSouth-Eastern
Europe
0
50
100
150
200
250
300
350
2001-2003 2007-2009 2011-2013
S-D
DD
per
mill
ion
inha
bita
nts
per d
ay
0
5 000
10 000
15 000
20 000
25 000
30 000
35 000
NorthAmerica
Western andCentral Europe
Oceania
S-D
DD
per
mill
ion
inha
bita
nts
per d
ay
0
50
100
150
200
250
300
350
400
SouthAmerica
Eastern andSouth-Eastern
Europe
West Asia East andSouth-East
Asia
CentralAmerica and
the Caribbean
Africa South Asia
2001-2003 2007-2009 2011-2013
S-D
DD
per
mill
ion
inha
bita
nts
per d
ay
0
100
200
300
400
500
600
South Afri
ca
Seychelle
s
Tunisi
a
Namibia
Botswana
Mauritius
Ascension Is
landEgyp
t
AlgeriaLib
ya
Zimbabwe
Cabo Verde
Zambia
Uganda
Malawi
Morocc
o
Sao Tome and Prin
cipe
Ghana
2001-2003 2007-2009 2011-2013

16 AVAILABILITY OF INTERNATIONALLY CONTROLLED DRUGS
Figure 10. Average consumption of opioid analgesics in African countries with lower levels of consumption, 2001-2003, 2007-2009 and 2011-2013
Source: International Narcotics Control Board.
Figure 11. Average consumption of opioid analgesics in Central America and the Caribbean, 2001-2003, 2007-2009 and 2011-2013
Source: International Narcotics Control Board.a The Netherlands Antilles was dissolved on 10 October 2010, resulting in two new constituent entities, Curaçao and Sint Maarten.
0
2
4
6
8
10
12
14
16
BeninChad
Angola
Gabon
Mozambique
United Rep.
of Tanza
nia
Cameroon
Senegal
Dem. Rep.
of the Congo To
go
Burkina Faso
Côte d’Ivoire
Eritrea
Madagascar
Mali
S-D
DD
per
mill
ion
inha
bita
nts
per d
ay
2001-2003 2007-2009 2011-2013
0
500
1 000
1 500
2 000
2 500
3 000
Haiti
Dominican Republic
Nicaragua
Anguilla
Montserrat
Honduras
Grenada
El Salva
dor
Belize
DominicaCuba
Guatemala
Jamaica
Costa Rica
Trinidad and To
bago
St. Vince
nt and th
e Grenadines
Panama
British Virg
in Islands
Barbados
Bahamas
Sint Maarte
na
Curaçaoa
Cayman Is
lands
S-D
DD
per
mill
ion
inha
bita
nts
per d
ay
2001-2003 2007-2009 2011-2013

ChApTER II. NARCOTIC DRUGS 17
Figure 12. Average consumption of opioid analgesics in South America, 2001-2003, 2007-2009 and 2011-2013
Source: International Narcotics Control Board.Note: Red lines: levels less than 200 S-DDD are considered inadequate; levels less than 100 S-DDD are considered very inadequate. For further information on inadequate and very inadequate levels of consumption as identified by the Board, see paragraph 46, above.
Figure 13. Average consumption of opioid analgesics in Asian countries and territories with higher levels of consumption, 2001-2003, 2007-2009 and 2011-2013
Source: International Narcotics Control Board.
0
100
200
300
400
500
600
700
800
900
1 000
Suriname
Paraguay
Bolivia (P
lurinatio
nal
State of)Ecu
adorPeru
Guyana
Venezuela
(Boliv
arian Rep. o
f)
Uruguay
ColombiaBrazil
Argentina
Chile
Falkland Is
lands
(Malvi
nas)
5 38
12
909
2 66
9
S-D
DD
per
mill
ion
inha
bita
nts
per d
ay
2001-2003 2007-2009 2011-2013
0
500
1 000
1 500
2 000
2 500
Israel
Rep. of K
oreaJapan
Bhutan
Turkey
Bahrain
Singapore
Kuwait
Jordan
Saudi Arabia
Macao, C
hina
Lebanon
Brunei D
aruss
alam
Malaysia
S-D
DD
per
mill
ion
inha
bita
nts
per d
ay
3 47
74
664
2001-2003 2007-2009 2011-2013

18 AVAILABILITY OF INTERNATIONALLY CONTROLLED DRUGS
Figure 14. Average consumption of opioid analgesics in Asian countries and territories with lower levels of consumption, 2001-2003, 2007-2009 and 2011-2013
Source: International Narcotics Control Board.Note: Red lines: levels less than 200 S-DDD are considered inadequate; levels less than 100 S-DDD are considered very inadequate. For further information on inadequate and very inadequate levels of consumption as identified by the Board, see paragraph 46, above.
Figure 15. Average consumption of opioid analgesics in European countries and territories with higher levels of consumption, 2001-2003, 2007-2009 and 2011-2013
Source: International Narcotics Control Board.
Qatar
United Arab Emira
tes
Hong Kong, China
OmanSyria
Kazakhstan
Iran (Is
lamic Rep. o
f)
Georgia
China
Thaila
nd
Viet Nam
Mongolia
Armenia
Dem. People’s Rep. o
f Korea
Sri Lanka
Kyrgyz
stan
Philippines
Maldives
IndonesiaIndia
Azerb
aijan
Turkmenist
an
Uzbekist
anNepal
Bangladesh
Yemen
Lao People’s Dem. R
ep.
CambodiaIra
q
Pakistan
Tajik
istan
0
20
40
60
80
100
120
140
160
180
200
S-D
DD
per
mill
ion
inha
bita
nts
per d
ay
2001-2003 2007-2009 2011-2013
0
5 000
10 000
15 000
20 000
25 000
Germany
Austria
Belgium
Denmark
Gibraltar
Switzerla
nd
Netherla
ndsSpain
Norway
Luxembourg
Sweden
Iceland
France
Finland
Ireland
United Kingdom
Slovenia
Hungary
Czech
Republic Italy
Greece
Slovakia
S-D
DD
per
mill
ion
inha
bita
nts
per d
ay
2001-2003 2007-2009 2011-2013

ChApTER II. NARCOTIC DRUGS 19
Figure 16. Average consumption of opioid analgesics in European countries with lower levels of consumption, 2001-2003, 2007-2009 and 2011-2013
Source: International Narcotics Control Board.
Figure 17. Average consumption of opioid analgesics in Oceania, 2001-2003, 2007-2009 and 2011-2013
Source: International Narcotics Control Board.
0
500
1 000
1 500
2 000
2 500
3 000
Croatia
Andorra
Portugal
Poland
Montenegro
Cypru
s
Serbia
Lithuania
Latvi
a
Romania
Bosnia and Herze
govina
Estonia
BulgariaMalta
Belarus
Russian Fe
deratio
n
Rep. of M
oldova
The fo
rmer Y
ugoslav
Rep. of M
acedonia Ukra
ine
Albania
S-D
DD
per
mill
ion
inha
bita
nts
per d
ay
2001-2003 2007-2009 2011-2013
0
500
1 000
1 500
2 000
2 500
3 000
3 500
Australia
Norfolk Is
land
New Zealand
New Caledonia
French
Polynesia
Wallis and Fu
tuna Islands
Palau
Christm
as Isla
nd
Cook Islands
Micronesia
Papua New GuineaNauru
Tonga Fij
i
Samoa
Tuva
lu
Vanuatu
8 00
2
5 79
2
5 50
5
13 4
40
S-D
DD
per
mill
ion
inha
bita
nts
per d
ay
2001-2003 2007-2009 2011-2013

20 AVAILABILITY OF INTERNATIONALLY CONTROLLED DRUGS
(c) Overconsumption and prescription drug abuse
81. While inadequate access to opioid analgesics in some regions is a matter of concern, it is important to also consider that in regions with high levels of consump-tion there are growing public health concerns regarding the abuse of prescription drugs, which in some countries has outpaced the abuse of illegal drugs.
82. Many factors are contributing to this development, but the main ones are the widespread availability of pre-scription drugs and the erroneous perception that they are less susceptible to abuse than illicit drugs. The non-prescription use of prescription drugs for self- medication has further exacerbated the problem.
83. A comparative analysis by UNODC39 of the con-sumption of opioid analgesics and the prevalence of their
39 World Drug Report 2014, United Nations publication, Sales No. E.14.XI.7.
misuse shows a high prevalence of misuse of opioids in some countries. This is reported by high-income coun-tries40 such as Australia, Canada and the United States and by lower-middle-income countries such as Nigeria and Pakistan, which have the lowest per capita consumption of opioids for medical purposes (see figures 18-19).41 According to UNODC, that suggests that the misuse of prescription opioids does not necessarily follow from mak-ing opioids accessible or available for medical purposes.42
40 Based on the World Bank classification of income levels and development. 41 The annual prevalence of misuse of prescription opioids is as follows: Australia, 3.1 per cent; Canada, 1 per cent; Nigeria, 3.6 per cent; Pakistan, 1.5 per cent; and United States, 5.2 per cent. 42 World Drug Report 2014.
Figure 18. Per capita consumption of opioid analgesics, 2011
Source: UNODC.
0
100
200
300
400
500
600
700
800
Canada
United States
Australia
Switzerla
nd
Germany
New Zealand
Ireland
United Kingdom
Mauritius
Finland
Israel
Slovakia
Czech
Republic
Bulgaria
Estonia
Serbia
Poland
South Afri
ca
Georgia
Chile
Argentin
a
Costa Rica
Uruguay
Brazil
Tunisi
a
Kazakhstan
Bolivia (P
lurinatio
nal State of)
Afghanistan
Pakistan
Nigeria
Mor
phin
e eq
uiva
lent
in m
g/pe
r cap
ita

ChApTER II. NARCOTIC DRUGS 21
Figure 19. Prevalence of misuse of prescription opioids in the general population, 2013 or latest available data
Source: UNODC.
84. To address this problem, countries need to develop a comprehensive strategy aimed at tackling the root causes of the excessive supply of prescription drugs, including overprescribing by medical professionals, “doc-tor shopping” and inadequate controls on the issuing and filling of prescriptions. In addition, public health officials identified the presence in households of prescription drugs that are no longer needed or used for medical pur-poses as one of the main sources of prescription drugs diverted from licit channels for abuse. Surveys of the prevalence of abuse undertaken in several countries have revealed that a significant percentage of individuals abus-ing prescription drugs for the first time had obtained the drug from a friend or family member who had acquired them legally.
85. Among the measures increasingly being used to address this problem are mechanisms to ensure the safe return and disposal of medications possessing psycho-active properties, particularly those containing narcotic drugs or psychotropic substances, including through prescription drug take-back days. The setting up of such initiatives in many jurisdictions has yielded significant results at a relatively low cost.
86. The importance of these measures has been recog-nized by the international community, including by the
Commission on Narcotic Drugs. Accordingly, in March 2013 the Commission adopted resolution 56/8, on pro-moting initiatives for the safe, secure and appropriate return for disposal of prescription drugs, in particular those containing narcotic drugs and psychotropic sub-stances under international control.
87. In that resolution, the Commission encouraged States to consider the adoption of a variety of courses of action to address prescription drug abuse, in cooperation with various stakeholders such as public health officials, pharmacists, pharmaceutical manufacturers and distribu-tors, physicians, consumer protection associations and law enforcement agencies, in order to promote greater awareness of the risks associated with the non-medical use of prescription drugs, in particular those containing narcotic drugs or psychotropic substances.
(d) Consumption of opioid analgesics and the need for palliative care
88. The patterns of consumption of opioid analgesics expressed in S-DDD or in milligrams per capita tell only part of the story. In order to ascertain if the level of con-sumption is appropriate, it is important to measure it in relation to the prevalence of health conditions requiring
0
1
2
3
4
5
6
Canada
United States
Australia
Switzerla
nd
Germany
New Zealand
Ireland
United Kingdom
Mauritius
Finland
Israel
Slovakia
Czech
Republic
Bulgaria
Estonia
Serbia
Poland
South Afri
ca
Georgia
Chile
Argentin
a
Costa Rica
Uruguay
Brazil
Tunisi
a
Kazakhstan
Bolivia (P
lurinatio
nal State of)
Afghanistan
Pakistan
Nigeria
Annu
al p
reva
lenc
e (p
erce
ntag
e)

22 AVAILABILITY OF INTERNATIONALLY CONTROLLED DRUGS
palliative care, which include not only cancer but also other conditions. Also, while consumption of opioid anal-gesics is concentrated in a few countries, the prevalence of conditions requiring their use is much more widespread.
89. Information from the Global Atlas of Palliative Care at the End of Life,43 prepared by WHO and the Worldwide Palliative Care Alliance, indicates that cancer is respon-sible for 28 per cent of adult deaths requiring palliative care. The majority (66 per cent) of deaths requiring such care are related to progressive non-malignant diseases (PNMD).44 The remaining 6 per cent are due to AIDS (see figure 20).
90. In all but low-income countries, the share of adults in need of palliative care for cancer remains more or less constant at around 33-38 per cent; that share drops to around 23 per cent in low-income countries (see figure 21). Progressive non-malignant diseases continue to comprise the majority of cases in all regions. The need for AIDS palliative care comprises one third of palliative
43 World Health Organization and Worldwide Palliative Care Alliance, Global Atlas of Palliative Care at the End of Life (Worldwide Palliative Care Alliance, 2014). 44 Progressive non-malignant diseases among adults are considered to be Alzheimer’s disease and other dementias, cardiovascular diseases (excluding sudden deaths), chronic obstructive pulmonary diseases, cirrhosis of the liver, Diabetes mellitus, multiple sclerosis, kidney diseases, Parkinson’s disease, rheumatoid arthritis and tuberculosis (multidrug-resistant tuberculosis and extensively drug-resistant tuberculosis only).
care cases in low-income countries, but remains below 10 per cent in countries with higher income levels.
91. The latest data available from the International Agency for Research on Cancer, the specialized cancer research agency of WHO, show that the global burden of cancer has risen to 14.1 million new cases and 8.2 mil-lion cancer deaths in 2012, compared with 12.7 million new cases and 7.6 million deaths in 2008. Prevalence esti-mates for 2012 show that there were 32.6 million people alive and over the age of 15 years who had been diagnosed with cancer in the previous five years (see figure 22). According to projections based on estimates presented by the GLOBOCAN project for 2012, a substantial increase in new cancer cases to 19.3 million per year by 2025 is expected, owing to the expected increase and ageing of the global population.
92. More than half of all cancer cases (56.8 per cent) and cancer deaths (64.9 per cent) in 2012 occurred in less developed regions of the world. Those proportions will increase further by 2025. Cancer is often presented as a disease of wealthy or developed populations. In real-ity, over 70 per cent of cancer deaths occur in low- and middle-income countries. Without sustained action, the incidence of cancer is projected to increase further in low- and middle-income countries by 2030. Cancer is present throughout the world, but countries that lack the health infrastructure to cope with the increasing num-ber of people suffering from the disease are particularly affected.
Figure 20. Deaths from diseases requiring palliative care at the end of life, by type of disease, 2011
Source: World Health Organization and Worldwide Palliative Care Alliance, Global Atlas of Palliative Care at the End of Life (Worldwide Palliative Care Alliance, 2014).
6%
28%
66%
HIV/AIDS Cancer (malignant neoplasm) PNMD
Figure 21. Distribution of adults in need of palliative care at the end of life by income group and disease category, 2011
Source: World Health Organization and Worldwide Palliative Care Alliance, Global Atlas of Palliative Care at the End of Life (Worldwide Palliative Care Alliance, 2014).
0
10
20
30
40
50
60
70
80
90
100
High income Upper middleincome
Lower middleincome
Low income
CancerHIV/AIDS PNMD

ChApTER II. NARCOTIC DRUGS 23
Figure 22. Prevalence of cancer diagnoses within the previous five years, per 100,000 population, 2012
Source: GLOBOCAN database.
93. In low- and middle-income countries, where there is limited capacity with regard to prevention and early detection of cancer, the disease is mostly discovered when it is at an advanced stage. By then, there are not many treatment options and palliation is required. Opioid analge-sics for cancer treatment are therefore are indispensable in these countries.
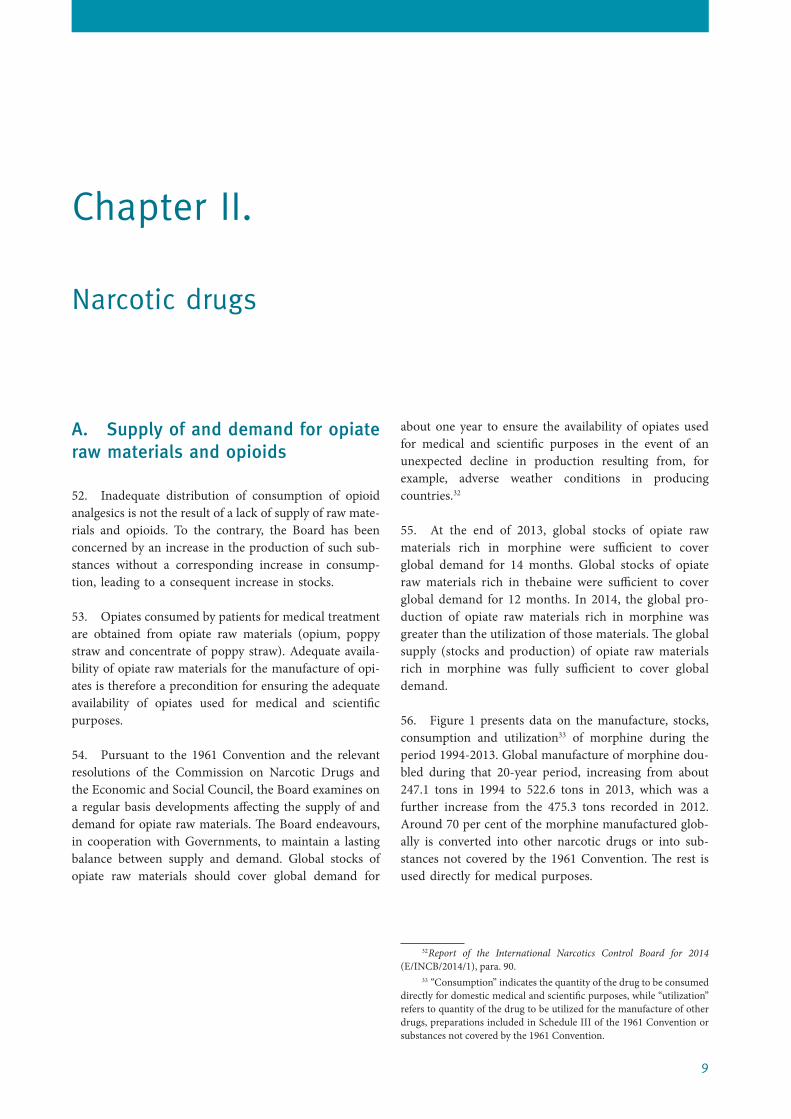
94. Plotting the level of consumption of opioid analge-sics against the cancer age-standardized rate45 confirms the global imbalance in the consumption of such substances, with the United States, Canada, Australia, New Zealand and Western and Central European countries registering high levels of consumption, with a corresponding high cancer age-standardized rate. A global comparison is dif-ficult owing to the fact that most countries are clustered together in the lower levels as a result of the high level of consumption in a few countries (see figure 23). If the pat-terns in each region are examined in detail, it is possible to gain a better idea of the global variations.
45 GLOBOCAN presents cancer data in an age-standardized rate, which is a summary measure of the rate that a population would have if it had a standard age structure. Standardization is necessary when compar-ing several populations that differ with respect to age because age has a powerful influence on the risk of cancer. The age-standardized rate is a weighted mean of the age-specific rates; the weights are taken from the population distribution of the standard population. The most frequently used standard population is the World Standard Population. The calcu-lated incidence or mortality rate is then called age-standardized incidence or mortality rate (world), and is expressed per 100,000 people. The age-standardized rate is calculated using 10 age groups (0-14, 15-39, 40-44, 45-49, 50-54, 55-59, 60-64, 65-69, 70-74 and 75+). The result may be slightly different from that computed using the same data categorized using the traditional five-year age bands.
0
500
1 000
1 500
2 000
NorthAmerica
Oceania Europe World Latin America and
the Caribbean
Asia Africa
Figure 23. Relationship between cancer incidence, 2012, and consumption of narcotic drugs, 2011-2013
Source: GLOBOCAN database and International Narcotics Control Board.
0
5 000
10 000
15 000
20 000
25 000
30 000
35 000
40 000
45 000
0 50 100 150 200 250 300 350 400
S-D
DD
per
mill
ion
inha
bita
nts
per d
ay
Cancer (age -standardized rate)
Africa Asia Eastern Europe Western Europe
Oceania Americas United States
24 AVAILABILITY OF INTERNATIONALLY CONTROLLED DRUGS
95. In the North America region, there is a considerable gap between Mexico on the one hand, and the United States and Canada on the other hand (see figure 24).
96. In Central and South America and the Caribbean, the distribution of the countries seems to indicate that South American countries have increased their consump-tion of opioid analgesics and that this is the result of an increasing rate of cancer (see figure 25). In Central America and the Caribbean, there are countries with relatively higher rates of cancer, but their consumption of narcotic drugs for palliative care is below the adequate level.
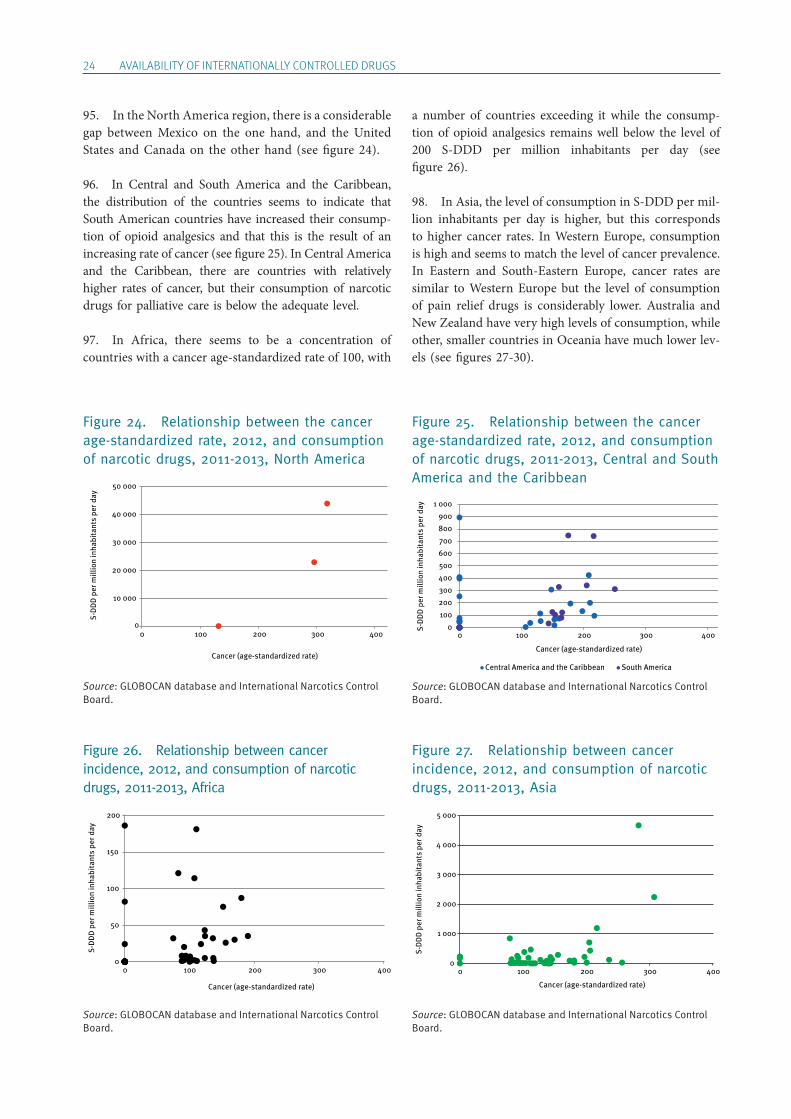
97. In Africa, there seems to be a concentration of countries with a cancer age-standardized rate of 100, with
a number of countries exceeding it while the consump-tion of opioid analgesics remains well below the level of 200 S-DDD per million inhabitants per day (see figure 26).
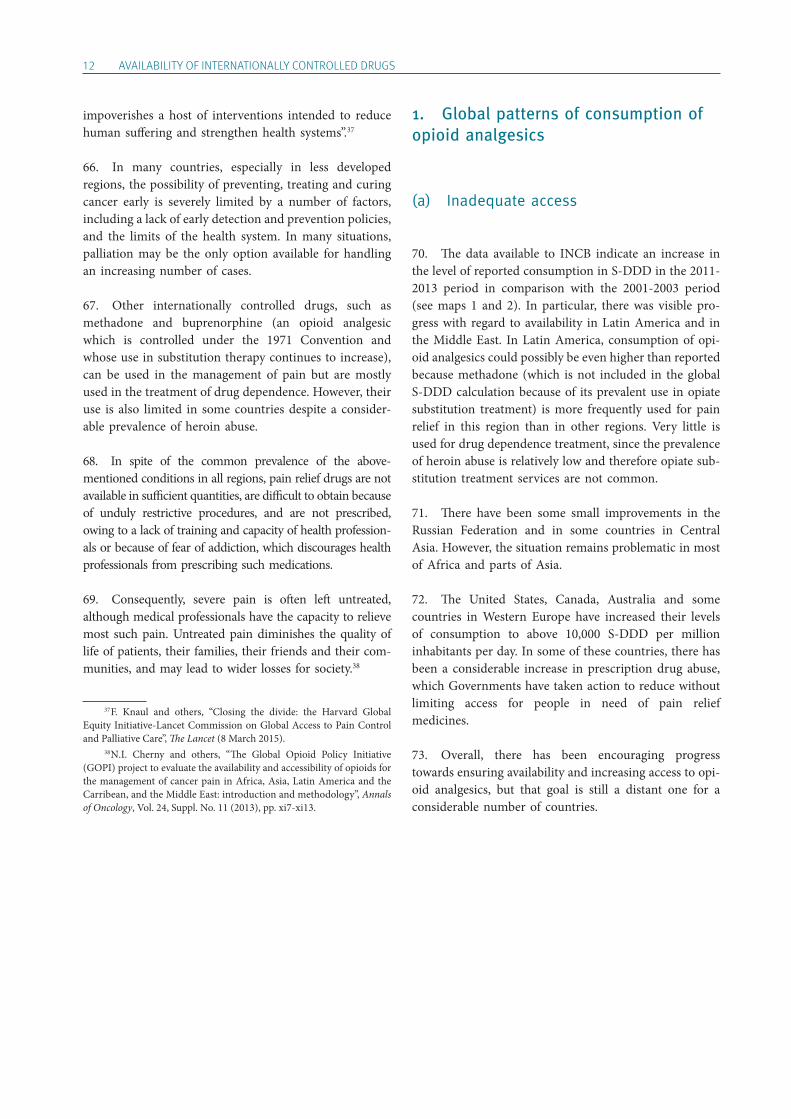
98. In Asia, the level of consumption in S-DDD per mil-lion inhabitants per day is higher, but this corresponds to higher cancer rates. In Western Europe, consumption is high and seems to match the level of cancer prevalence. In Eastern and South-Eastern Europe, cancer rates are similar to Western Europe but the level of consumption of pain relief drugs is considerably lower. Australia and New Zealand have very high levels of consumption, while other, smaller countries in Oceania have much lower lev-els (see figures 27-30).
Figure 27. Relationship between cancer incidence, 2012, and consumption of narcotic drugs, 2011-2013, Asia
Source: GLOBOCAN database and International Narcotics Control Board.
0
1 000
2 000
3 000
4 000
5 000
0 100 200 300 400
S-D
DD
per
mill
ion
inha
bita
nts
per d
ay
Cancer (age-standardized rate)
Figure 26. Relationship between cancer incidence, 2012, and consumption of narcotic drugs, 2011-2013, Africa
Source: GLOBOCAN database and International Narcotics Control Board.
0
50
100
150
200
0 100 200 300 400
S-D
DD
per
mill
ion
inha
bita
nts
per d
ay
Cancer (age-standardized rate)
Figure 25. Relationship between the cancer age-standardized rate, 2012, and consumption of narcotic drugs, 2011-2013, Central and South America and the Caribbean
Source: GLOBOCAN database and International Narcotics Control Board.
0 100 200 300 400 500 600 700 800 900
1 000
0 100 200 300 400
S-D
DD
per
mill
ion
inha
bita
nts
per d
ay
Cancer (age-standardized rate)
Central America and the Caribbean South America
Figure 24. Relationship between the cancer age-standardized rate, 2012, and consumption of narcotic drugs, 2011-2013, North America
Source: GLOBOCAN database and International Narcotics Control Board.
10 000
20 000
30 000
40 000
50 000
00 100 200 300 400
S-D
DD
per
mill
ion
inha
bita
nts
per d
ay
Cancer (age-standardized rate)

ChApTER II. NARCOTIC DRUGS 25
Figure 28. Relationship between cancer incidence, 2012, and consumption of narcotic drugs, 2011-2013, Western Europe
Source: GLOBOCAN database and International Narcotics Control Board.
Figure 29. Relationship between cancer incidence, 2012, and consumption of narcotic drugs, 2011-2013, Eastern and South-Eastern Europe
Source: GLOBOCAN database and International Narcotics Control Board.
Figure 30. Relationship between cancer incidence, 2012, and consumption of narcotic drugs, 2011-2013, Oceania
Source: GLOBOCAN database and International Narcotics Control Board.
99. Palliative care is also required for AIDS. A compar-ison among the various WHO regions in the Global Atlas of Palliative Care at the End of Life shows that the per-centage of adults in need of palliative care in relation to AIDS is larger in low-income countries, particularly in Africa, than in countries in other income groups. Expanded access to antiretroviral therapy and a declining incidence of HIV infection have led to a steep fall glob-ally in the number of adults and children dying from HIV-related causes. The drop in HIV-related mortality is especially evident in the regions with the greatest burden of HIV infection, including the African region, which was home to about three in four people who died from HIV-related causes in 2013. However, HIV and AIDS preva-lence remains high in low-income countries, and the availability of antiretroviral therapy is still limited, despite efforts made in that regard by UNAIDS and the broader international community. The inadequate availability of opioid analgesics to manage AIDS-related pain is a major problem for an even larger percentage of the population in low-income countries.
100. When comparing the estimated number of AIDS deaths in 201346 with the level of consumption of opioid analgesics, expressed in S-DDD per million inhabitants per day, the countries with highest number of deaths and lowest levels of consumption were in sub-Saharan Africa and Asia (see table 1). Nigeria, with an estimated 210,000 AIDS deaths in 2013, reported no consumption of opi-oid analgesics to INCB. India had an estimated 130,000 AIDS deaths and just 11 S-DDD per million inhabitants per day. Mozambique, with only 5 S-DDD per million inhabitants per day, had an estimated number of deaths in 2013 of 82,000. The United Republic of Tanzania had the same level of S-DDD and 78,000 estimated deaths. Zimbabwe had 64,000 estimated deaths and only 35 S-DDD. Uganda had only 30 S-DDD and 63,000 esti-mated AIDS-related deaths. South Africa had 338 S-DDD, but the estimated number of AIDS-related deaths was 200,000.
46 World Health Organization, Global Health Observatory.
Cancer (age-standardized rate)
0
5 000
10 000
15 000
20 000
25 000
0 100 200 300 400
S-D
DD
per
mill
ion
inha
bita
nts
per d
ay
0
500
1 000
1 500
2 000
2 500
3 000
0 100 200 300 400
S-D
DD
per
mill
ion
inha
bita
nts
per d
ay
Cancer (age-standardized rate)
0
2 000
4 000
6 000
8 000
10 000
12 000
14 000
0 100 200 300 400
S-D
DD
per
mill
ion
inha
bita
nts
per d
ay
Cancer (age-standardized rate)

26 AVAILABILITY OF INTERNATIONALLY CONTROLLED DRUGS
Table 1. Estimated number of AIDS deaths, 2013, compared with the level of consumption of opioid analgesics, 2011-2013
CountryEstimated AIDS deaths in 2013
S-DDD per million inhabitants per day, 2011-2013
Nigeria 210 000 0
South Africa 200 000 338
India 130 000 11
Mozambique 82 000 5
United Republic of Tanzania
78 000 5
Zimbabwe 64 000 35
Uganda 63 000 30
Kenya 58 000 0
Malawi 48 000 26
Ethiopia 45 000 0
Cameroon 44 000 4
Democratic Republic of the Congo
30 000 2
Indonesia 29 000 16
Côte d’Ivoire 28 000 1
Zambia 27 000 32
Source: International Narcotics Control Board and WHO Global Health Observatory.
101. Even though the table above confirms that AIDS is a major health condition requiring palliation, the dis-eases classified as progressive non-malignant diseases are the major reasons for the demand for palliative care in all regions. However, reliable prevalence rates for these diseases are not available at the global level, making it impossible to compare them with levels of consumption of opioid analgesics.
(e) Consumption of opioid analgesics and the level of development of palliative care
102. An important aspect of the availability of opioid analgesics is the capacity of health systems to prescribe
and dispense such substances through appropriate palli-ative care services. In the Global Atlas of Palliative Care at the End of Life, WHO and the Worldwide Palliative Care Alliance classified countries in relation to the devel-opment of the level of palliative care services in six categories:
• Level 1: no known activity • Level 2: capacity-building activity • Level 3a: isolated provision • Level 3b: generalized provision • Level 4a: preliminary health system integration • Level 4b: advanced health system integration
103. By looking at the map illustrating the different lev-els of palliative care services (see map 3) and comparing it with the map illustrating the levels of consumption of opioid analgesics expressed in S-DDD (see map 4), it is possible to see that, even though there is generally a positive direct correlation between high levels of consumption and high levels of development of palliative care services, there are some inconsistencies.
104. In East and Southern Africa, for example, there are a number of countries at level 4a (Kenya, Malawi, South Africa, United Republic of Tanzania, Zambia and Zimbabwe) or level 4b (Uganda), but in all of these coun-tries (except South Africa) the reported consumption of opioid analgesics is fairly low.
105. In South America (with the exception of Chile and Uruguay, which are considered to be at level 4a, and Argentina, which is rated as level 3b), most countries are rated at level 3a (Brazil, Colombia, Ecuador, Guyana, Paraguay and Peru) or level 2 (Bolivia (Plurinational State of) and Suriname). Nevertheless, levels of consumption are relatively high in the region. The apparent inconsist-ency with the level of palliative care services may be an indication that consumption is high but concentrated in limited or privileged areas.
106. The development of palliative care services is important to ensure that, when opioid analgesics are made available, they can actually be efficiently and ration-ally prescribed.

ChApTER II. NARCOTIC DRUGS 27
Map 3. Global levels of palliative care, 2014
Source: World Health Organization and Worldwide Palliative Care Alliance, Global Atlas of Palliative Care at the End of Life (Worldwide Palliative Care Alliance, 2014).
Map 4. Consumption of opioids for pain management, 2011-2013
Source: International Narcotics Control Board.Note: Opioids defined as codeine, dextropropoxyphene, dihydrocodeine, fentanyl, hydrocodone, hydromorphone, ketobemidone, morphine, oxycodone, pethidine, tilidine and trimeperidine.
1
2
3
4
5The boundaries and names shown and the designations used on this map do not imply official endorsement or acceptance by the United Nations. The final boundary between South Sudan and the Sudan has not yet been determined. The dotted line represents approximately the Line of Control in Jammu and Kashmir agreed upon by India and Pakistan. The final status of Jammu and Kashmir has not yet been agreed upon by the parties. A dispute exists between the Governments of Argentina and the United Kingdom of Great Britain and Northern Ireland concerning sovereignty over the Falkland Islands (Malvinas).
Levels of palliative care development Level 1: no known
activity Level 2: capacity-
building activity Level 3a: isolated
provision Level 3b: generalized
provision Level 4a: preliminary
health system integration
Level 4b: advanced health system inte-gration
Not applicable
The boundaries and names shown and the designations used on this map do not imply official endorsement or acceptance by the United Nations. The final boundary between South Sudan and the Sudan has not yet been determined. The dotted line represents approximately the Line of Control in Jammu and Kashmir agreed upon by India and Pakistan. The final status of Jammu and Kashmir has not yet been agreed upon by the parties. A dispute exists between the Governments of Argentina and the United Kingdom of Great Britain and Northern Ireland concerning sovereignty over the Falkland Islands (Malvinas).
Consumption in S-DDD per million inhabitants per day < 1 1-100 101-200 201-2,000 2,001-5,000 5,001-10,000 > 10,000

28 AVAILABILITY OF INTERNATIONALLY CONTROLLED DRUGS
C. Impediments to the availability of narcotic drugs
107. In 2014, INCB carried out a survey asking coun-tries to provide information on policies and practices at the national level to implement the provisions of the 1961 Convention to ensure the availability of narcotic drugs for medical and scientific purposes. The Board received responses from 107 countries. The following paragraphs are an analysis of those responses, with a particular focus on the impediments to availability identified by the com-petent national authorities.47
108. An analysis of the responses indicates that in recent years Member States have taken action to improve availa-bility. This is likely to have contributed to the increase in the consumption of opioid analgesics, as expressed in S-DDD per million inhabitants per day, reported earlier. The answers to the survey show that a large number of countries that are paying attention to the issue of availa-bility and have taken action to overcome legislative, admin-istrative and other impediments have increased access to narcotic drugs for medical purposes and improved the quality of life of people in need of palliative care.
109. This conclusion emerges from an analysis of the consumption patterns examined in previous chapters, but it also derives from self-evaluations by countries of their performance in relation to the availability of narcotic drugs. As shown in figure 31, two thirds of countries con-sider their situation satisfactory or entirely satisfactory (46 and 22 per cent, respectively), while others indicated the need for some (22 per cent) or significant improve-ment (7 per cent). Obviously, these self-evaluations need to be checked against the real situation, but they provide an insight into how countries perceive their own perfor-mance and therefore whether they are considering taking action or not.
47 Results shown in the figures are based on replies submitted by Member States to the INCB questionnaire on availability. The number of responses taken into consideration for the calculation of percentages relates to the total number of valid responses for each of the questions, and therefore varies. The sum of all percentages may not amount to 100 in some figures, as countries are given the option of marking one or more options in multiple-choice questions.
Figure 31. Availability of narcotic drugs, as evaluated by countries themselves, 2014
Source: International Narcotics Control Board survey 2014.
110. Member States have reported to the Board on the main factors that unduly limit the availability of narcotic drugs needed for medical or scientific purposes (see figure 32). Out of 96 valid responses to this specific question, 36 per cent of countries indicated as a major impediment a lack of training or awareness among members of the medical profession regarding the use of narcotic drugs. This was followed by fear of addiction (34 per cent) and limited financial resources (32 per cent).
22%
46%
22%
7%
4%
Entirely satisfactory
Satisfactory
Responses not provided
In need of some improvement
In need of signi�cant improvement

ChApTER II. NARCOTIC DRUGS 29
Figure 32. Impediments to availability of narcotic drugs
Source: International Narcotics Control Board survey 2014.
111. The Board also reviewed the impediments identi-fied by researchers and civil society organizations involved in health and palliative care. Sometimes the impediments and their prioritization identified by these stakeholders did not match those identified by the competent national authorities. Civil society and academia often consider onerous regulations, strict trade control measures and problems in sourcing as being among the causes of lim-ited access to pain relief medications. Countries respond-ing to the questionnaire, however, highlighted lack of training/awareness and fear of addiction as the main problems.
112. For some of these factors, it is possible to make a comparison with information from the surveys carried out by the Board in 1995 and 2010. Fear of addiction, for example, was identified as an impediment by 64 per cent of countries in 1995, but only by 47 per cent in 2010; in the most recent survey, it declined even further, to 34 per cent. Similarly, the mention of onerous regulations and legislative restrictions decreased considerably, as shown in figure 33.
113. The mention of lack of training/awareness among medical professionals as an impediment declined between 1995 and 2010, but it has since increased. It was the most mentioned impediment in the 2014 survey, indicated by 36 per cent of countries. Problems in sourcing or insuf-ficient supply followed a similar trajectory. From
31 per cent in 1995, they dropped to 8 per cent in 2010, and bounced back to 31 per cent in 2014.
114. Similar fluctuations can be seen in responses citing the cost of medicines or lack of financial resources: from 28 per cent in 1995 to 32 per cent in 2014, with a drop to 13 per cent in 2010.
Figure 33. Impediments to availability, 1995-2014
Source: International Narcotics Control Board surveys 1995, 2010 and 2014.
115. The paragraphs below provide an analysis of responses by countries to the 2014 survey. The identified impediments are discussed in descending order by num-ber of mentions.
0 5 10 15 20 25 30 35 40
Action by the Board
Other
Onerous regulatory framework
Fear of prosecution/sanction
Control measures for international trade
Fear of diversion
Cultural/social attitudes
Problems in sourcing
Limited resources
Fear of addiction
Lack of training/awareness
Percentage
0
10
20
30
40
50
60
70
1995 2010 2014
Perc
enta
ge
Problems in sourcing Limited �nancial resourcesOnerous regulations Lack of training/awarenessFear of addiction

30 AVAILABILITY OF INTERNATIONALLY CONTROLLED DRUGS
1. Lack of training or awareness among health professionals
116. Lack of training and awareness among health pro-fessionals was the most often mentioned impediment in the responses received from Member States. Several stud-ies and analyses of the problem confirm this. In several countries, health professionals may not have sufficient professional knowledge about pain and pain management. There may be excessive concerns about the side effects of opioids and the possibility that patients may become dependent. Doctors may lack confidence in the patient’s report of pain, or assign low priority to pain management. A possible reason for this situation may be the limited attention devoted to palliative care in the curricula of medical schools. In other cases, doctors may be reluctant to prescribe opioid analgesics because they do not trust the ability of the patients and their families to safely manage them.
117. Because of insufficient education and training on palliative care treatment, doctors sometimes underesti-mate the degree of relief that can be attained with proper treatment, and the extent to which pain is undermedi-cated. Physicians may also underestimate the need to use potent opioids, such as morphine, for severe pain, and instead prescribe less effective drugs. Also, some physi-cians may not be able to establish, or may not be used to establishing, an interpersonal relationship that would help to identify the adequate pharmacological therapy and allow for personalized prescriptions that take the patient’s needs and current health status into account.
118. In addition, nurses in some countries may not be adequately trained to manage pain and support patients, and may have misconceptions and prejudices about opi-oid medications similar to those held by doctors, as described above. In some cases, nurses may administer lower dosages than required or none at all, or they may try to convince the patient to wait and endure the situa-tion without adequate pain medication.
119. In the 2014 survey, 70 countries reported having an educational curriculum for medical practitioners that included content on the rational prescription and use of narcotic drugs. Of those, 73 per cent (51 countries) had registered an increased per capita consumption between the 2007-2009 and the 2011-2013 periods.
120. Out of 61 countries that reported implementing awareness-raising measures to foster a deeper under-standing of responsible prescribing practices for narcotic drugs among health professionals, 45 countries (74 per cent) had observed an increase in S-DDD per million
inhabitants per day. Such measures have included work-shops, seminars, special training and supervision, and distribution of informative materials, as well as working groups with pharmacists, representatives of the pharma-ceutical industry and medical associations.
2. Fear of addiction
121. Thirty-three countries (34 per cent) reported fear of addiction as an impediment to availability, the second most mentioned impediment in the 2014 survey. Out of those countries, 18 (55 per cent) remained below the minimum levels of consumption.
122. According to Human Rights Watch, the reluctance among health professionals to prescribe opioid analgesics may be related more to the fear of causing addiction or respiratory distress in patients than the fear of prosecution or sanction.48 This emerges also from the 2014 survey, in which fear of addiction was identified as an impediment by 33 countries and fear of prosecution or sanction by 21 per cent.
123. It seems that fear of addiction is related to lack of awareness and training, as well as cultural attitudes. Both patients and medical professionals may be reluctant to pre-scribe and use narcotic drugs due to lack of knowledge about their properties and safe ways to prescribe them, as well as prejudices against the use of such substances.
3. Limited financial resources
124. Thirty-one countries (32 per cent) identified finan-cial issues as an impediment to the availability of narcotic drugs. Lack of resources can be particularly prohibitive when narcotic drug prices are high. While some formula-tions, such as oral morphine, can be produced quite cheaply, prices of narcotic drugs may be driven up by gov-ernment regulation, licensing and taxation, as well as poor distribution systems (e.g. ones that require expensive and lengthy travel to collect medicines), among other things.49 For example, the Latin-American Association of Palliative Care reported that, in one country in Central America, the price of a one-month treatment with injectable morphine was more than double the national minimum monthly wage. In this context, availability is dependent on the abil-ity of patients to afford narcotic drugs that are prescribed. Therefore, it is important to consider whether patients are
48 Human Rights Watch, Global State of Pain Treatment: Access to Palliative Care as a Human Right (2011), chap. II. 49 Ibid.

ChApTER II. NARCOTIC DRUGS 31
expected to cover all or most costs for such drugs, or if there is financial support through social security or national health insurance schemes. In the responses to the question on who pays for narcotic drugs prescribed (see figure 34), patients were mentioned the most (83 per cent), followed by the government (72 per cent) and health insurance schemes (63 per cent).
125. A cross-sectional study carried out in 2014 sug-gests that, particularly in countries with limited resources for subsidy and reimbursement schemes for opioid anal-gesics, the additional costs arising from regulatory requirements might thus be transferred directly onto patients. The study also found that the price of oral solid immediate-release morphine was 5.8 times higher in lower-middle-income countries than in high-income countries. This difference in dispensing prices may be related to the artificial lowering of the price of other more expensive formulations (fentanyl) owing to heavy subsi-dies, which in turn creates a condition of economic dis-advantage for oral solid immediate-release morphine.50
126. Thus, impediments to the affordability of narcotic drugs can derive from lack of resources, high prices cre-ated by restrictive national regulations and international trade control measures, and non-supportive policies, including lack of public health reimbursement schemes.
Figure 34. Who bears the cost of prescribed narcotic drugs, 2014
Source: International Narcotics Control Board survey 2014.
50 Liliana De Lima and others, “Cross-sectional pilot study to moni-tor the availability, dispensed prices, and affordability of opioids around the globe”, Journal of Pain and Symptom Management, vol. 48, No. 4 (October 2014).
4. Problems in sourcing from industry or imports
127. Many responses indicated problems in sourcing. Some formulations of narcotic drugs, such as oral mor-phine, may not be available in sufficient quantities, as manufacturers and importers/exporters, especially in the case of smaller populations and/or low market demand, may prefer to produce and trade only more expensive for-mulations. Marketing of such formulations, coupled with the subsidies granted for specific products (for example, fentanyl), may explain why an analysis of consumption data shows a much steeper increase in the consumption of fentanyl than of morphine.
128. In several countries, local pharmaceutical compa-nies lack interest in manufacturing oral morphine, in part because the prescribing of opioids by physicians is too limited and the demand from hospitals insufficient to justify production. In some developing countries, mor-phine is only available through import from international pharmaceutical companies, with prices that are unafford-able both for the government and the population. Finally, some local pharmaceutical companies are not interested in producing opioid medications because of security costs and legal risks associated with this kind of product.
129. In addition to the lack of local production, another obstacle to the availability of narcotic drugs is the diffi-culty in sourcing through imports. Several countries indi-cated that there were shortages of medications as a result of delays in the supply chain due to lengthy and burden-some regulatory requirements (e.g. import/export licens-ing). The supply of narcotic drugs has also been found to be restricted by inadequate national estimates, time- consuming reporting requirements and difficulties in the management of narcotic drugs.
5. Cultural and social attitudes towards the treatment of pain
130. Impediments related to attitudes and knowledge, identified by 31 per cent of countries, included the beliefs of doctors, patients and their families, as well as policy-makers. Patients may sometimes be the ones to refuse pain relief due to their reluctance to report pain or to accept the idea of taking opioids. Some patients and/or their family members may be concerned about the side effects of opioids and try to reduce the dosages. They may also worry about the stigma associated with the use of opiates or pain medication. Some patients may avoid tak-ing opioids owing to their sedative effects, because they want to remain conscious, especially patients in the
0 20 40 60 80 100
Other
Health insuranceschemes
Government (social security)
Patients themselves
Percentage

32 AVAILABILITY OF INTERNATIONALLY CONTROLLED DRUGS
terminal stages of a disease who may be afraid to lose the bond with their families.
131. Out of 61 countries that had implemented awareness-raising measures among health professionals, a large proportion (67 per cent) did not report fear of addiction as an impediment to availability (see figure 35). This may indicate that investing in fostering a deeper understanding of responsible prescribing practices for narcotic drugs among health professionals can contribute to overcoming the impediments created by the fear of addiction and other misconceptions regarding opioid analgesics and the management of pain.
Figure 35. Reports of fear of addiction among countries and territories that have implemented awareness-raising measures, 2014
Source: International Narcotics Control Board survey 2014.
6. Fear of diversion into illicit channels
132. Out of 96 responding countries, 29 (30 per cent) reported fear of diversion as an impediment to availabil-ity. Out of these, 20 countries (69 per cent) had levels of consumption below 200 S-DDD per million inhabitants per day, a level that is not considered to be adequate by the Board.
133. Reported fear of diversion can result from the experiences of countries with the emergence of unregu-lated parallel markets for narcotic drugs. Among the countries that reported fear of diversion as an impedi-ment, 41 per cent also reported experiencing problems
with parallel markets. One country mentioned that lim-ited availability had been the result of stricter regulatory measures enacted in response to the use of the Internet to purchase and sell opioid analgesics without prescription.
7. Fear of prosecution or sanction
134. Out of 99 responding countries, 81 (82 per cent) reported the existence of penalties for inadequate record-keeping. Reported penalties ranged from monetary fines, to licence revocation, to prison sentences. Reports by the Access to Opioid Medication in Europe project51 and Human Rights Watch52 suggest that fear of sanction may arise in the context of unclear, often stigmatizing legisla-tion, lack of legal knowledge among health professionals and harsh penalties, including penalties for unintentional violations. In the survey, out of 21 countries reporting fear of prosecution/sanction as an impediment, almost all indicated the existence of penalties, and three quarters of them showed inadequate S-DDD levels, i.e. below 200 per million inhabitants per day.
8. International trade control measures
135. Policies, rules and regulations to control the pro-duction, import and export of controlled substances have been established and are monitored at the international level by INCB. For some countries, the effort to estimate the amount of controlled medication needed may be beyond their capacities and existing resources, and there-fore technical and logistical support may be required.
136. Countries have reported difficulties with the issuance of import/export permits, along with other inter-national drug control measures that require lengthy procedures and thus may lead to delays and shortages.
9. Onerous regulations
137. Out of 53 countries that reported having taken leg-islative or regulatory action in the previous 10 years to
51 Access to Opioid Medication in Europe, Final Report and Recom-mendations to the Ministries of Health, Lukas Radbruch and others, eds. (Bonn, Germany, Pallia Med Verlag, November 2014). 52 Global State of Pain Treatment, chap. II.
67%
33%
No reported fear of addiction
Reported fear of addicion

ChApTER II. NARCOTIC DRUGS 33
increase the availability of narcotic drugs for medical pur-poses, 37 countries (70 per cent) had observed an increase in S-DDD rates since the 2007-2009 period. Among such legislative or regulatory actions, countries reported the following: facilitating the prescription and dispensing of narcotic drugs, which could include the elimination of obligatory prescription pads for doctors and the extension of prescription periods; allowing nurses and midwives to prescribe and administer narcotic drugs; facilitating accessibility of treatment for patients; simplifying record-keeping; and issuing informative leaflets on uses, side effects, warnings and precautions concerning narcotic medicines.
138. At the national level, some countries, out of fear of diversion and risk of addiction, have developed regu-latory systems that go beyond the requirements provided in the drug control treaties, with unnecessary impedi-ments that do not take into full account the WHO and INCB recommendations.
139. Regulations that restrict opioid prescription mech-anisms include the following: requiring special patient permits; limiting the authority of physicians to prescribe opioids, even for cancer patients with strong pain; impos-ing dose limits that restrict the ability to adjust the dose to individual patient needs; imposing severe limits on the duration of prescriptions; restricting the dispensing of opioids, making it harder for patients to access such medi cation; increasing bureaucratic burdens through the use of complex or poorly accessible prescription forms or complex reporting requirements; and introducing dispro-portionate legal sanctions that result in the intimidation of health-care providers and pharmacists.
140. In some countries, regulations prevent doctors from prescribing appropriate substances and sufficient dosages, so that patients have to visit their physicians very frequently, for example, because they are not allowed to get a prescription for morphine for more than 7 or 10 days. Of the countries responding, only 21 per cent stated that they allowed refills under certain circumstances without requiring a new prescription.
141. Particularly in low-income countries, the ability to prescribe morphine and other potent opioids is limited to a small number of physicians, who are required to undergo a special registration procedure. In some cases, not even specialists in diseases requiring palliative care have independent prescribing authority.
142. Another example of a regulatory impediment is the special triplicate forms doctors have to fill out, which can be difficult to obtain and for which in many cases
doctors have to pay. According to WHO, special multiple- copy prescription requirements typically “reduce pre-scribing of covered drugs by 50 per cent or more”.53
143. Of 102 responding countries, 75 per cent legally required prescribers to keep records of narcotic drug pre-scriptions. This may discourage the stocking of opioid analgesics owing to costs and time-consuming proce-dures, and possibly fear of prosecution and sanctions. It is certainly possible to find a way to ensure that records are kept while preventing this basic requirement from becoming too onerous for those who are doing the prescribing.
144. As illustrated in figure 36, nurses are seldom allowed to prescribe narcotic drugs. This may also be an impediment to availability, especially in countries facing challenges in their health-care systems and infrastructure.
Figure 36. Prescribers of narcotic drugs, 2014
Source: International Narcotics Control Board survey 2014.
145. Some countries that have been able to considera-bly increase their levels of consumption in S-DDD per million inhabitants per day during the past two decades have reported that midwives are also allowed to prescribe narcotic drugs. The issue of pain during labour is mostly overlooked in the discussion, despite its ubiquity, which calls for measures to ensure its adequate management, including the use of narcotic drugs.
53 World Health Organization, Cancer Pain Relief, With a Guide to Opioid Availability, second edition (1996), part 2.
0 25 50 75 100
Nurses
Other
GPs with special licence
Veterinarians
General practitioners
Medical specialists
Percentage

34 AVAILABILITY OF INTERNATIONALLY CONTROLLED DRUGS
146. There was a wide range of prescription validities among countries (see figure 37). Forty-three per cent of countries reported that prescriptions were valid for up to seven days. The second most often reported validity (30 per cent of countries) was between two weeks and a month.
147. Centralized systems can furthermore limit ade-quate distribution, because opioids are often only availa-ble in major cities and are not delivered to rural areas. Sometimes, doctors have to travel to major cities to get medications and even prescription forms; patients may have to do the same. In some countries, it can take more than a month for an opioid medication to be delivered from urban centres to provincial and rural areas.
Figure 37. Maximum validity period of prescriptions that contain narcotic drugs, 2014
Source: International Narcotics Control Board survey 2014.
148. Member States reported that narcotics were dis-pensed mostly in licensed hospital pharmacies (75 per cent). Slightly more than half of responding countries (54 per cent) reported that narcotics could be dispensed in regular pharmacies (see figure 38).
Figure 38. Facilities where prescriptions for narcotic drugs can be dispensed, 2014
Source: International Narcotics Control Board survey 2014.
149. Restrictions on the number of pharmacies that are allowed to dispense controlled substances may also reduce availability. The administrative burden for pharmacies is an additional factor. In some countries, pharmacists must collect a standard set of information: patient name, address and date of birth; drug dispensed, as well as the date, quantity and dosage, the number of days’ supply and the number of refills; and the patient’s health-care provider. Pharmacies are also required to keep such infor-mation in a central database for several years. This necessitates the use of human resources, time and access to specific technology for monitoring and data collection. The existence of a legal requirement for dispensing agents to keep records was reported by 101 (98 per cent) of 103 responding countries.
150. In many countries, only one institution, or else a few pharmacies, are allowed to stock opioid medication. To do so, they have to seek permission from drug regu-latory authorities through a lengthy process. Even in acute-care hospitals, morphine may not be included in the drug list for emergencies. In addition, some pharma-cies located in unsafe areas are afraid to sell opioids because of the risk of being robbed.
10. Other impediments
151. Other impediments identified by a smaller num-ber of countries (seven) point to insufficient supply due to a lack of certain opioid formulations, an unexpected increase in demand for a specific drug, or business
0 5 10 15 20 25 30 35 40 45
Unlimited/depends
More than 1 month
Up to 1 month
Less than 2 weeks
Less than 1 week
Percentage
0 10 20 30 40 50 60 70 80
Others
Specially licensed pharmacies
Pharmacies
Licensed hospital pharmacies
Percentage

ChApTER II. NARCOTIC DRUGS 35
decisions by industry and importers of narcotic drugs. Also mentioned were a lack of awareness on the part of patients, inadequate estimates and reporting, and the existence of illegal markets.
11. Action by the Board
152. In the survey, countries could also indicate that actions taken by the Board had been an impediment. Only four countries did so.
153. In addition, countries were asked to suggest meas-ures the Board could take to improve the availability of narcotic drugs for medical and scientific purposes. Most countries mentioned the provision of training and infor-mation to authorities and stakeholders on several issues: benefits, rational prescription and use of narcotic drugs; management, distribution and control of narcotic drugs; estimates and assessments; and awareness-raising programmes to address fears relating to prescribing or dispensing narcotics.
154. Other countries pointed to the need to facilitate the procurement of narcotic drugs through quick and flexible approval of estimates and supplementary esti-mates by the Board, as well as the introduction of online software for import and export licensing. In addition, INCB was requested to play a more active role by urg-ing manufacturers to deliver the necessary medications on time, asking Governments to provide the necessary human and financial resources, and facilitating the avail-ability of limited quantities for the purpose of test and reference standards. A few countries mentioned the need for more research on availability, the development of recommendations to increase access and the estab-lishment of a laboratory for quality control of narcotic drugs.
155. Among responding countries, there was a high level of awareness of the procedures for submitting esti-mates and supplementary estimates (97 per cent), as well as knowledge of INCB training materials (82 per cent) and joint INCB/WHO guidelines (87 per cent) on the preparation of estimates.