availability, application, and economic values of poultry ... · survey of availability,...
TRANSCRIPT

Availability, Application, and Economic Values of Poultry Manure
for Cropland in Indiana
Department of Agricultural and Biological Engineering Purdue University
July 2013

Final Report
Survey of Availability, Application, and Economic Values of
Poultry Manure for Cropland in Indiana
(Project #00026411)
to
Andy Tauer
Director of Livestock
Indiana Soybean Alliance
5757 W 74th St
Indianapolis, IN 46278-1755
by
Ji-Qin Ni and Albert J. Heber
Agricultural and Biological Engineering Department
Purdue University
225 S. University St.
West Lafayette, IN 47907
May 31, 2013
Revised July 31, 2013

i
Table of Contents
Executive Summary ...................................................................................................................... 1
Introduction ................................................................................................................................... 3
Poultry Manure Availability and Geographical Distribution .................................................. 6
Procedures and Methods ............................................................................................................. 6
Sources of Poultry Data .............................................................................................................. 6
Sources of Manure Production Rate Data ................................................................................. 11
Method Selection and Total Manure Production Calculation ................................................... 13
Poultry Manure Nutrient Value Assessment............................................................................. 14
Indiana Poultry Farms ............................................................................................................... 15
Indiana Poultry Manure Production .......................................................................................... 19
Nutrients from Indiana Poultry Manure .................................................................................... 21
Poultry Manure Transportation ................................................................................................ 23
Procedures and Methods ........................................................................................................... 23
Overview of Commercial Manure Service Providers ............................................................... 23
Various Commercial Services................................................................................................... 23
Transportation Distances .......................................................................................................... 25
Service Areas ............................................................................................................................ 26
Manure Economics ................................................................................................................... 26
Regulations and Environmental Concerns ................................................................................ 28
Poultry Manure Application to Crop Fields and Other Uses ................................................. 29
Procedures and Methods ........................................................................................................... 29
Characteristics of Respondents ................................................................................................. 29
Manure Application .................................................................................................................. 32
Manure Transportation, Transportation and Application Costs, and Willingness-to-Pay ........ 35
Manure Management and Regulations ..................................................................................... 37
Recommendations ....................................................................................................................... 39
Acknowledgements ..................................................................................................................... 40
References .................................................................................................................................... 41
Appendix A: Maps of Indiana ................................................................................................... 43
Appendix B: Survey Questionnaire of Poultry Manure Application in Indiana .................. 64

ii
List of Figures
Figure 1. An example Annual Report of confined animal feeding operations. ............................ 10
Figure 2. Number of Indiana poultry farms in 2002 and 2007. .................................................... 15
Figure 3. Production of as-excreted manure from Indiana poultry farms in 2007. ...................... 19
Figure 4. Annual Indiana manure production by three major poultry species from 2002 to
2011. ............................................................................................................................. 20
Figure 5. Manure service providers identified in Indiana since 2006. .......................................... 24
Figure 6. Average U.S. farm prices of selected nitrogen fertilizers. Source: Agricultural
Prices, USDA-NASS. ................................................................................................... 26
Figure 7. Average U.S. farm prices of selected phosphate and potassium fertilizers.
Source: Agricultural Prices, USDA-NASS. ................................................................. 27
Figure 8. Distribution of land acreages of the respondents. ......................................................... 30
Figure 9. Distribution of surveyed poultry farm sizes. ................................................................. 31
Figure 10. Percentages of producers who owned and applied poultry manure to different
crops. ............................................................................................................................ 32
Figure 11. Acreage of different crops used poultry manure as fertilizer. ..................................... 33
Figure 12. Percentage of different fertilizer or manure applied to the land. ................................. 33
Figure 13. Distribution of years of poultry manure application. .................................................. 34
Figure 14. Distribution of willing-to-pay costs for solid manure, transportation and
application. ................................................................................................................... 37
Figure A.1. Numbers of all poultry farms in Indiana in 2007. ..................................................... 43
Figure A.2. Numbers of egg layer farms in Indiana in 2007. ....................................................... 44
Figure A.3. Locations and sizes of Indiana layer CAFOs and CFOs in 2011. ............................. 45
Figure A.4. Numbers of pullet farms in Indiana in 2007. ............................................................. 46
Figure A.5. Locations and sizes of Indiana pullet CAFO and CFO in 2011. ............................... 47
Figure A.6. Numbers of broiler farms in Indiana in 2007. ........................................................... 48
Figure A.7. Locations and sizes of Indiana broiler CAFO and CFO in 2011............................... 49
Figure A.8. Numbers of turkey farms in Indiana in 2007. ............................................................ 50
Figure A.9. Locations and sizes of Indiana turkey CAFO and CFO in 2011. .............................. 51
Figure A.10. Numbers of duck and other poultry farms in Indiana in 2007. ................................ 52
Figure A.11. Locations and sizes of Indiana duck CAFO and CFO in 2011. .............................. 53
Figure A.12. Indiana total poultry manure production (tons) in 2007. ......................................... 54
Figure A.13. Indiana layer manure production (tons) in 2007. .................................................... 55
Figure A.14. Indiana pullet manure production (tons) in 2007. ................................................... 56
Figure A.15. Indiana broiler manure production (tons) in 2007. .................................................. 57
Figure A.16. Indiana turkey manure production (tons) in 2007. .................................................. 58
Figure A.17. Indiana duck manure production (tons) in 2007. ..................................................... 59
Figure A.18. Indiana available nitrogen from as-excreted poultry manure (lb/acre) in
2007. ............................................................................................................................. 60
Figure A.19. Indiana available phosphorus from as-excreted poultry manure (lb/acre) in
2007. ............................................................................................................................. 61
Figure A.20. Indiana corn yields in 2010. .................................................................................... 62
Figure A.21. Indiana soybean yields in 2010. .............................................................................. 63
iii
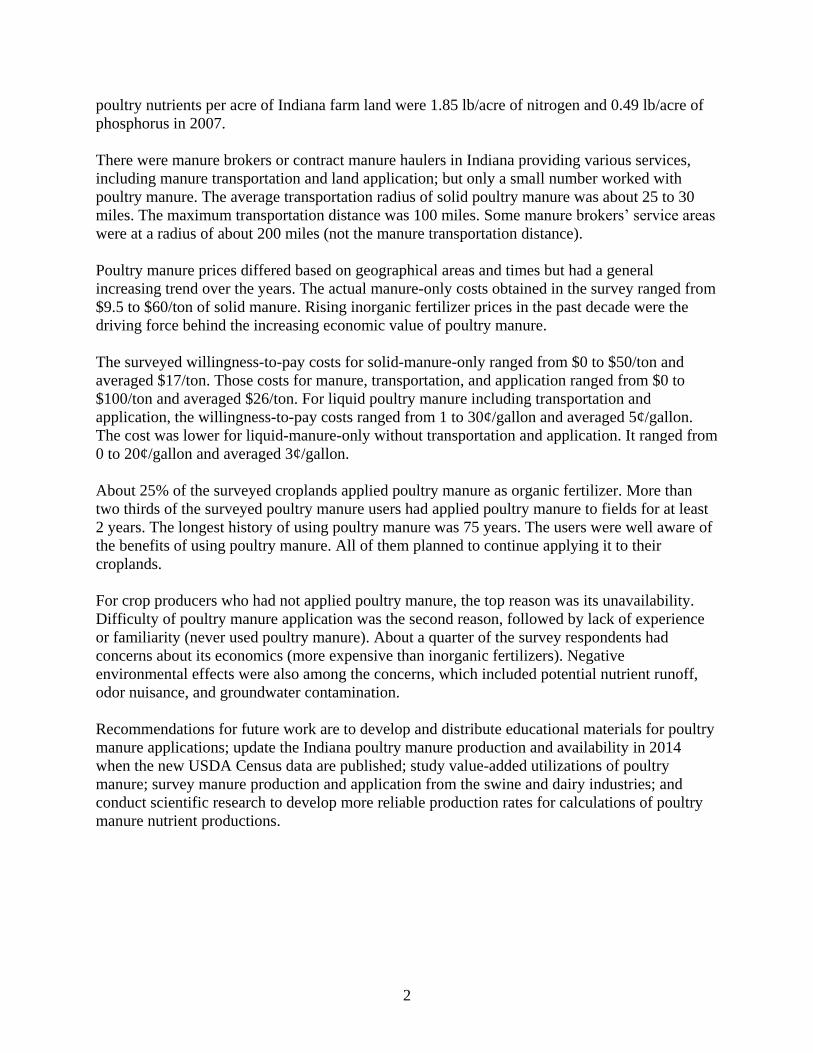
List of Tables
Table 1. Direct, indirect, and induced impacts attributed to Indiana‟s poultry industry. ............... 3
Table 2. Total feed, corn and SBM consumption by poultry industry in Indiana in 2007. ............ 3
Table 3. Threshold number of animals for CAFO and CFO in Indiana. ........................................ 7
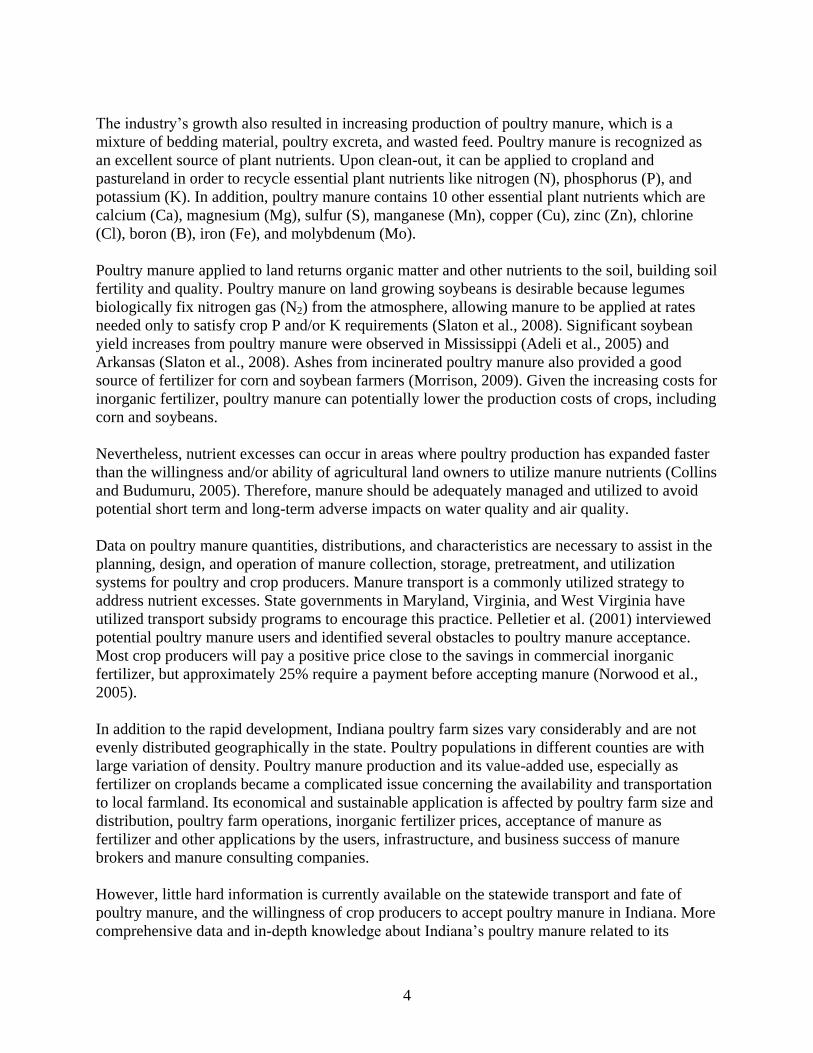
Table 4. Characteristics of poultry data sources. ............................................................................ 8
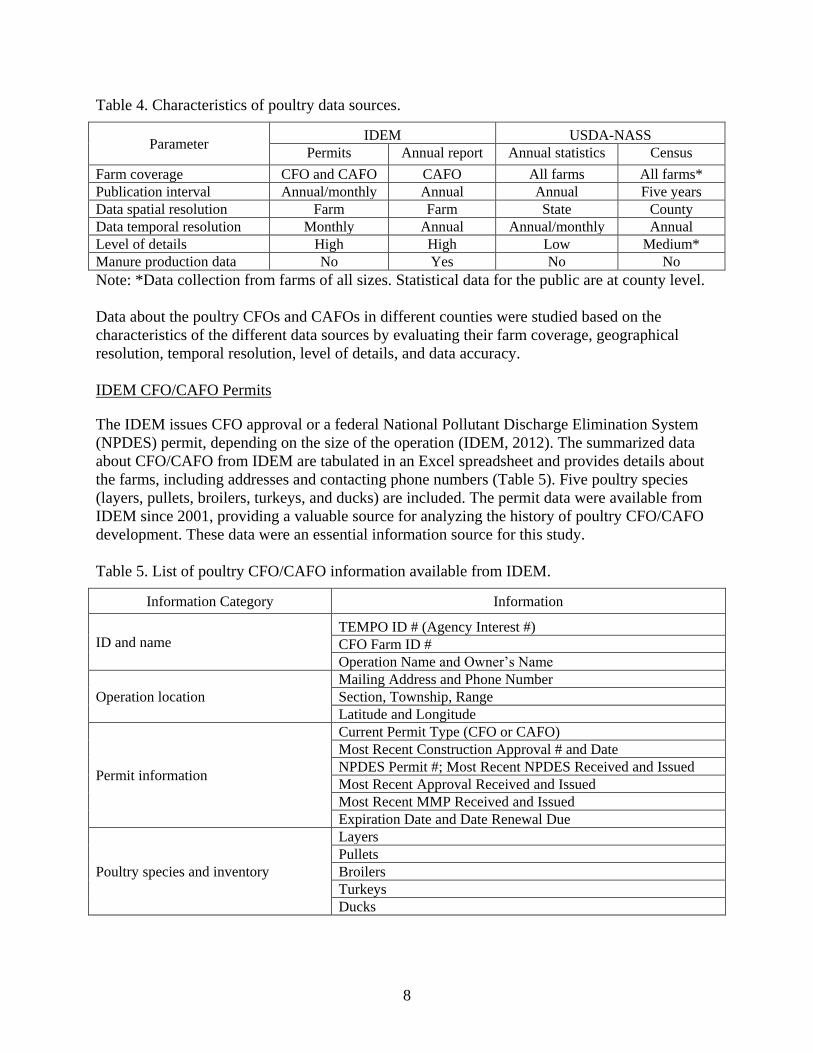
Table 5. List of poultry CFO/CAFO information available from IDEM. ...................................... 8
Table 6. Comparison of USDA and IDEM 2007 poultry data. ...................................................... 9
Table 7. Three typical poultry manure production calculation methods. ..................................... 12
Table 8. As-excreted manure production rates selected and used in this project. ........................ 13
Table 10. Poultry manure nutrients as percentages of as-excreted manure. ................................. 15
Table 11. Size distributions of layer farms in Indiana in 2007. .................................................... 16
Table 12. Size distribution of pullet farms for laying flock replacement in Indiana in 2007.
...................................................................................................................................... 17
Table 13. Size distributions of broiler farms in Indiana in 2007. ................................................. 18
Table 14. Size distributions of turkey farms in Indiana in 2007. .................................................. 18
Table 15. Nitrogen and phosphorus in as-excreted poultry manure in Indiana in 2002 and
2007. ............................................................................................................................. 22
Table 16. Summary of phone interview responses from three manure haulers. ........................... 25
Table 17. Some examples of poultry manure prices. .................................................................... 27
Table 18. Crops and acreages reported by the responded producers. ........................................... 30
Table 19. Poultry production from the respondents. ..................................................................... 31
Table 20. Responses to the reasons for using poultry manure. ..................................................... 34
Table 21. Miscellaneous questions for poultry manure users. ...................................................... 34
Table 22. Reasons given for not using poultry manure on cropland. ........................................... 35
Table 23. Poultry manure prices paid by users for solid poultry manure. .................................... 36
Table 24. Willingness-to-pay for poultry manure by current and potential poultry manure
users. ............................................................................................................................. 36
Table 25. Responses to the awareness of two new regulations. ................................................... 38
1
Executive Summary
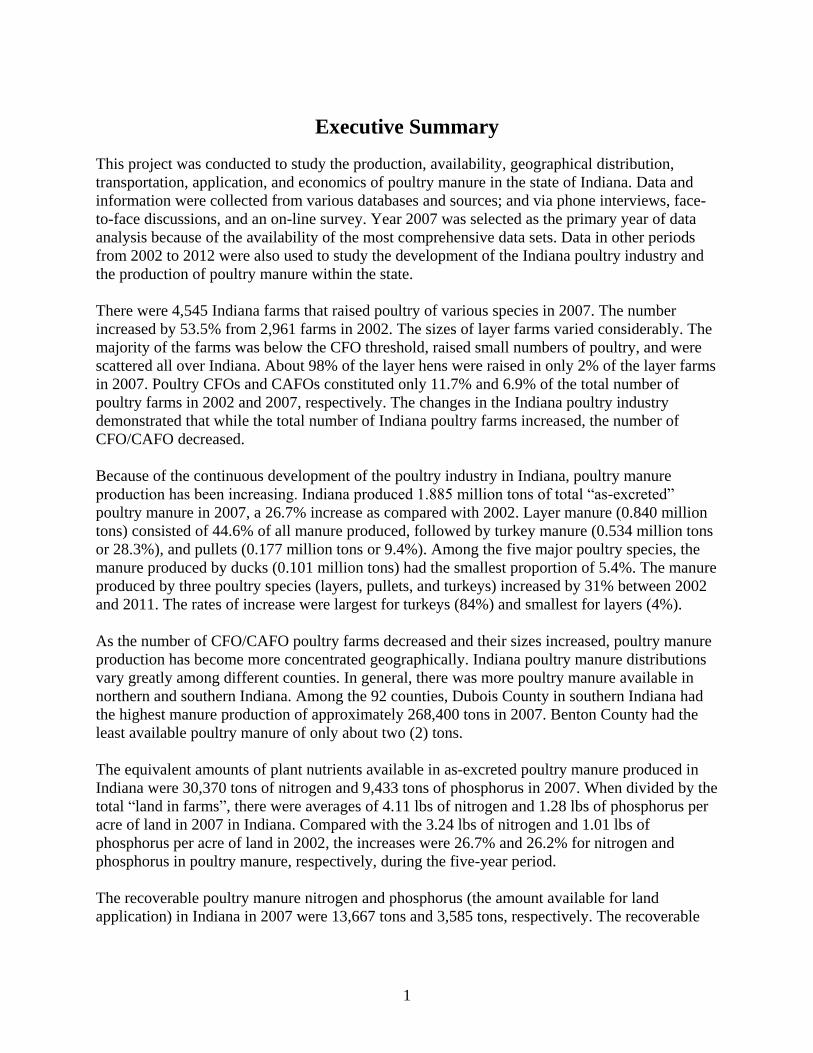
This project was conducted to study the production, availability, geographical distribution,
transportation, application, and economics of poultry manure in the state of Indiana. Data and
information were collected from various databases and sources; and via phone interviews, face-
to-face discussions, and an on-line survey. Year 2007 was selected as the primary year of data
analysis because of the availability of the most comprehensive data sets. Data in other periods
from 2002 to 2012 were also used to study the development of the Indiana poultry industry and
the production of poultry manure within the state.
There were 4,545 Indiana farms that raised poultry of various species in 2007. The number
increased by 53.5% from 2,961 farms in 2002. The sizes of layer farms varied considerably. The
majority of the farms was below the CFO threshold, raised small numbers of poultry, and were
scattered all over Indiana. About 98% of the layer hens were raised in only 2% of the layer farms
in 2007. Poultry CFOs and CAFOs constituted only 11.7% and 6.9% of the total number of
poultry farms in 2002 and 2007, respectively. The changes in the Indiana poultry industry
demonstrated that while the total number of Indiana poultry farms increased, the number of
CFO/CAFO decreased.
Because of the continuous development of the poultry industry in Indiana, poultry manure
production has been increasing. Indiana produced 1.885 million tons of total “as-excreted”
poultry manure in 2007, a 26.7% increase as compared with 2002. Layer manure (0.840 million
tons) consisted of 44.6% of all manure produced, followed by turkey manure (0.534 million tons
or 28.3%), and pullets (0.177 million tons or 9.4%). Among the five major poultry species, the
manure produced by ducks (0.101 million tons) had the smallest proportion of 5.4%. The manure
produced by three poultry species (layers, pullets, and turkeys) increased by 31% between 2002
and 2011. The rates of increase were largest for turkeys (84%) and smallest for layers (4%).
As the number of CFO/CAFO poultry farms decreased and their sizes increased, poultry manure
production has become more concentrated geographically. Indiana poultry manure distributions
vary greatly among different counties. In general, there was more poultry manure available in
northern and southern Indiana. Among the 92 counties, Dubois County in southern Indiana had
the highest manure production of approximately 268,400 tons in 2007. Benton County had the
least available poultry manure of only about two (2) tons.
The equivalent amounts of plant nutrients available in as-excreted poultry manure produced in
Indiana were 30,370 tons of nitrogen and 9,433 tons of phosphorus in 2007. When divided by the
total “land in farms”, there were averages of 4.11 lbs of nitrogen and 1.28 lbs of phosphorus per
acre of land in 2007 in Indiana. Compared with the 3.24 lbs of nitrogen and 1.01 lbs of
phosphorus per acre of land in 2002, the increases were 26.7% and 26.2% for nitrogen and
phosphorus in poultry manure, respectively, during the five-year period.
The recoverable poultry manure nitrogen and phosphorus (the amount available for land
application) in Indiana in 2007 were 13,667 tons and 3,585 tons, respectively. The recoverable
2
poultry nutrients per acre of Indiana farm land were 1.85 lb/acre of nitrogen and 0.49 lb/acre of
phosphorus in 2007.
There were manure brokers or contract manure haulers in Indiana providing various services,
including manure transportation and land application; but only a small number worked with
poultry manure. The average transportation radius of solid poultry manure was about 25 to 30
miles. The maximum transportation distance was 100 miles. Some manure brokers‟ service areas
were at a radius of about 200 miles (not the manure transportation distance).
Poultry manure prices differed based on geographical areas and times but had a general
increasing trend over the years. The actual manure-only costs obtained in the survey ranged from
$9.5 to $60/ton of solid manure. Rising inorganic fertilizer prices in the past decade were the
driving force behind the increasing economic value of poultry manure.
The surveyed willingness-to-pay costs for solid-manure-only ranged from $0 to $50/ton and
averaged $17/ton. Those costs for manure, transportation, and application ranged from $0 to
$100/ton and averaged $26/ton. For liquid poultry manure including transportation and
application, the willingness-to-pay costs ranged from 1 to 30¢/gallon and averaged 5¢/gallon.
The cost was lower for liquid-manure-only without transportation and application. It ranged from
0 to 20¢/gallon and averaged 3¢/gallon.
About 25% of the surveyed croplands applied poultry manure as organic fertilizer. More than
two thirds of the surveyed poultry manure users had applied poultry manure to fields for at least
2 years. The longest history of using poultry manure was 75 years. The users were well aware of
the benefits of using poultry manure. All of them planned to continue applying it to their
croplands.
For crop producers who had not applied poultry manure, the top reason was its unavailability.
Difficulty of poultry manure application was the second reason, followed by lack of experience
or familiarity (never used poultry manure). About a quarter of the survey respondents had
concerns about its economics (more expensive than inorganic fertilizers). Negative
environmental effects were also among the concerns, which included potential nutrient runoff,
odor nuisance, and groundwater contamination.
Recommendations for future work are to develop and distribute educational materials for poultry
manure applications; update the Indiana poultry manure production and availability in 2014
when the new USDA Census data are published; study value-added utilizations of poultry
manure; survey manure production and application from the swine and dairy industries; and
conduct scientific research to develop more reliable production rates for calculations of poultry
manure nutrient productions.
3
Introduction
Indiana is one of the leading states in poultry production. Indiana ranks first in ducks, third in
eggs, and eighth in turkeys. Poultry industry is very important in the Indiana economy.
According to USDA-NASS, Indiana poultry and eggs accounts for 9.8% of the total agricultural
cash receipts and remained as the fourth leading contributor with $938 million in the state in
2010 (IFO, 2012). The total impacts of Indiana‟s poultry industry were about $1.7B on labor and
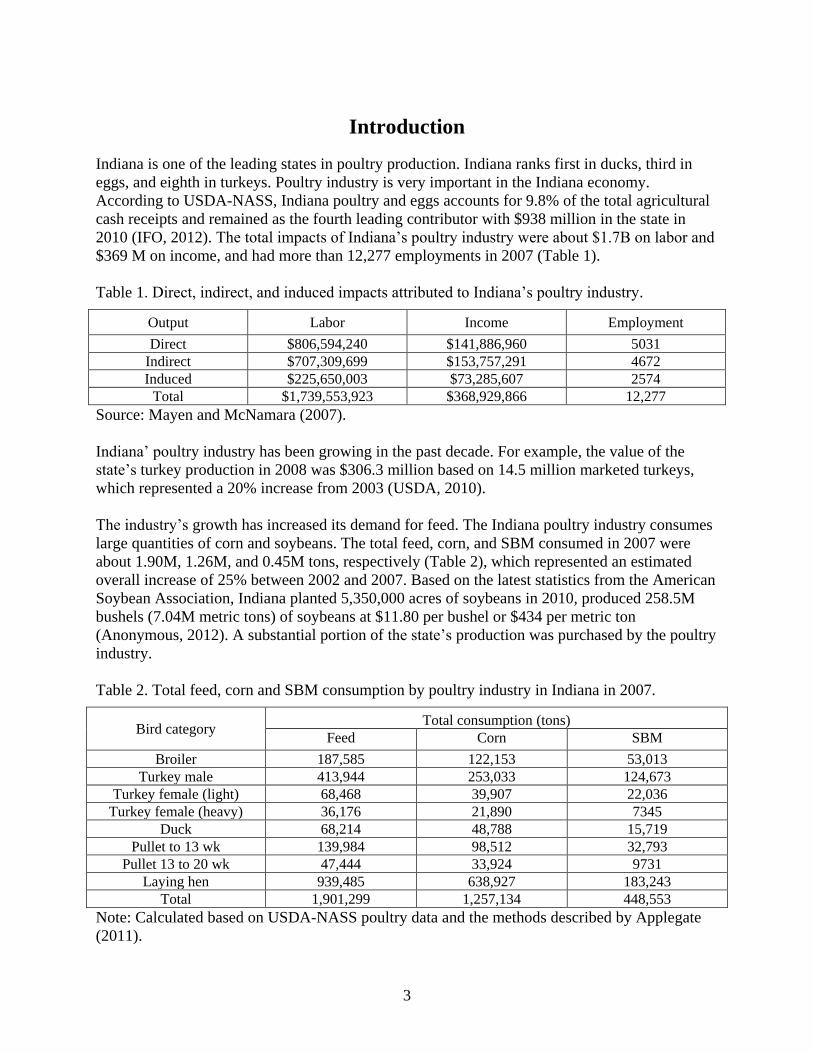
$369 M on income, and had more than 12,277 employments in 2007 (Table 1).
Table 1. Direct, indirect, and induced impacts attributed to Indiana‟s poultry industry.
Output Labor Income Employment
Direct $806,594,240 $141,886,960 5031
Indirect $707,309,699 $153,757,291 4672
Induced $225,650,003 $73,285,607 2574
Total $1,739,553,923 $368,929,866 12,277
Source: Mayen and McNamara (2007).
Indiana‟ poultry industry has been growing in the past decade. For example, the value of the
state‟s turkey production in 2008 was $306.3 million based on 14.5 million marketed turkeys,
which represented a 20% increase from 2003 (USDA, 2010).
The industry‟s growth has increased its demand for feed. The Indiana poultry industry consumes
large quantities of corn and soybeans. The total feed, corn, and SBM consumed in 2007 were
about 1.90M, 1.26M, and 0.45M tons, respectively (Table 2), which represented an estimated
overall increase of 25% between 2002 and 2007. Based on the latest statistics from the American
Soybean Association, Indiana planted 5,350,000 acres of soybeans in 2010, produced 258.5M
bushels (7.04M metric tons) of soybeans at $11.80 per bushel or $434 per metric ton
(Anonymous, 2012). A substantial portion of the state‟s production was purchased by the poultry
industry.
Table 2. Total feed, corn and SBM consumption by poultry industry in Indiana in 2007.
Bird category Total consumption (tons)
Feed Corn SBM
Broiler 187,585 122,153 53,013
Turkey male 413,944 253,033 124,673
Turkey female (light) 68,468 39,907 22,036
Turkey female (heavy) 36,176 21,890 7345
Duck 68,214 48,788 15,719
Pullet to 13 wk 139,984 98,512 32,793
Pullet 13 to 20 wk 47,444 33,924 9731
Laying hen 939,485 638,927 183,243
Total 1,901,299 1,257,134 448,553
Note: Calculated based on USDA-NASS poultry data and the methods described by Applegate
(2011).
4
The industry‟s growth also resulted in increasing production of poultry manure, which is a
mixture of bedding material, poultry excreta, and wasted feed. Poultry manure is recognized as
an excellent source of plant nutrients. Upon clean-out, it can be applied to cropland and
pastureland in order to recycle essential plant nutrients like nitrogen (N), phosphorus (P), and
potassium (K). In addition, poultry manure contains 10 other essential plant nutrients which are
calcium (Ca), magnesium (Mg), sulfur (S), manganese (Mn), copper (Cu), zinc (Zn), chlorine
(Cl), boron (B), iron (Fe), and molybdenum (Mo).
Poultry manure applied to land returns organic matter and other nutrients to the soil, building soil
fertility and quality. Poultry manure on land growing soybeans is desirable because legumes
biologically fix nitrogen gas (N2) from the atmosphere, allowing manure to be applied at rates
needed only to satisfy crop P and/or K requirements (Slaton et al., 2008). Significant soybean
yield increases from poultry manure were observed in Mississippi (Adeli et al., 2005) and
Arkansas (Slaton et al., 2008). Ashes from incinerated poultry manure also provided a good
source of fertilizer for corn and soybean farmers (Morrison, 2009). Given the increasing costs for
inorganic fertilizer, poultry manure can potentially lower the production costs of crops, including
corn and soybeans.
Nevertheless, nutrient excesses can occur in areas where poultry production has expanded faster
than the willingness and/or ability of agricultural land owners to utilize manure nutrients (Collins
and Budumuru, 2005). Therefore, manure should be adequately managed and utilized to avoid
potential short term and long-term adverse impacts on water quality and air quality.
Data on poultry manure quantities, distributions, and characteristics are necessary to assist in the
planning, design, and operation of manure collection, storage, pretreatment, and utilization
systems for poultry and crop producers. Manure transport is a commonly utilized strategy to
address nutrient excesses. State governments in Maryland, Virginia, and West Virginia have
utilized transport subsidy programs to encourage this practice. Pelletier et al. (2001) interviewed
potential poultry manure users and identified several obstacles to poultry manure acceptance.
Most crop producers will pay a positive price close to the savings in commercial inorganic
fertilizer, but approximately 25% require a payment before accepting manure (Norwood et al.,
2005).
In addition to the rapid development, Indiana poultry farm sizes vary considerably and are not
evenly distributed geographically in the state. Poultry populations in different counties are with
large variation of density. Poultry manure production and its value-added use, especially as
fertilizer on croplands became a complicated issue concerning the availability and transportation
to local farmland. Its economical and sustainable application is affected by poultry farm size and
distribution, poultry farm operations, inorganic fertilizer prices, acceptance of manure as
fertilizer and other applications by the users, infrastructure, and business success of manure
brokers and manure consulting companies.
However, little hard information is currently available on the statewide transport and fate of
poultry manure, and the willingness of crop producers to accept poultry manure in Indiana. More
comprehensive data and in-depth knowledge about Indiana‟s poultry manure related to its

5
quantity of production, geographical distribution, transportation, land application, and economics
will help to maximize poultry manure value as a crop nutrient and minimize its adverse
environmental impacts. It will contribute to Indiana‟s agriculture and crop production.
Therefore, a study was needed to investigate current poultry manure production, transportation,
and application situations, summarize successful experiences, identify potential problems related
to these issues, and provide educational information to producers, commodity groups, extension
educators, and policy makers for improvement of poultry manure management.
The objectives of this survey on poultry manure in Indiana were to document its production,
availability, and geographical distribution; evaluate its movement (transportation) and
application; examine the interest in and willingness of crop (especially soybean and corn)
producers to pay for manure; and assess the obstacles and economics of using it as nutrient for
land application.

6
Poultry Manure Availability and Geographical Distribution
Procedures and Methods
The study of the availability and geographical distribution of poultry manure started with a
literature review, which continued throughout the project period. The search of literature covered
peer-reviewed journals, scientific conference papers, research project reports, and extension
publications. It included publications all over the world and back in history as early as the 1940s
(Yushok and Bear, 1943). The review of literature enabled a broader view for the researchers of
this study on the poultry manure management issues, revealed the current knowledge and
knowledge gaps, and facilitated the development of survey methodologies and interpretation of
research results.
In addition to literature review and methodology development, three major steps were taken for
the Indiana manure availability and geographical distribution study:
1. Data collection and evaluation
2. Data analysis and interpretation
3. Result presentation and discussion
Sources of Poultry Data
Two types of data needed to evaluate the manure production and geographical distribution are
essential:
1. Numbers and species (e.g., layer, turkey, and duck) of poultry at different locations in
Indiana;
2. Rates of manure production and nutrient contents of each species under different
production practices.
Additionally, historical data are also necessary to study the changes and predict future trends in
poultry production in the state. The most important data were collected from the following
sources:
1. The Indiana Department of Environmental Management (IDEM, Indianapolis, IN). There
were two data sources from IDEM:
a. Permits for Indiana Confined Feeding Operation (CFO) and Concentrated Animal
Feeding Operation (CAFO) issued by IDEM.
b. Annual reports submitted by Indiana CAFO to IDEM.
2. The USDA National Agricultural Statistics Service (NASS, www.nass.usda.gov).
Publications of NASS cover statewide poultry data and statistics. There are also two data
sources from NASS:
a. Indiana agricultural statistics
b. USDA agricultural census

7
In Indiana, any farm with 300 or more cattle, 600 or more swine or sheep, 30,000 or more
poultry, or 500 or more horses in confinement is a CFO. A CAFO is a CFO that meets the
threshold animal numbers for a large CAFO in Table 3 (IDEM, 2012).
Table 3. Threshold number of animals for CAFO and CFO in Indiana.
Species/Sector Threshold number of animals
Large CAFO CFO
Beef:
≥300
Cattle ≥1000
Cow/Calf Pairs ≥1000
Dairy:
Mature Dairy Cow ≥700
Other than Mature Dairy Cows
(dairy heifers, dairy calves, veal calves) ≥1000
Swine:
≥600 Growers/Finishers/Sows (greater than 55 lbs) ≥2500
Nursery Pig (less than 55 lbs) ≥10,000
Chickens:
≥30,000
Layers/Broilers
(liquid manure handling system) ≥30,000
Chickens other than Layers
(not in a liquid manure handling system) ≥125,000
Layers
(not in a liquid manure handling system) ≥82,000
Ducks:
Liquid Manure System ≥5000
Not in a Liquid Manure System ≥30,000
Others:
Turkeys ≥55,000
Horses ≥500 ≥500
Sheep/Lambs ≥10,000 ≥600
Source: IDEM (2012).
Due to the confidentiality and protection of agricultural producers, poultry farm contact
information and poultry production data from non-CFO/CAFO producers were unavailable.
Therefore, the data relevant to poultry production in this study was mainly based on the
publically accessible sources. Additional information was obtained from Purdue Extension
specialists and professional associations. Discussions and interviews with some individual
producers in Indiana and other states also helped to provide much needed information.
Each data source had its own benefits and limitations (Table 4); but data from different sources
can complement each other and provide more comprehensive information to study the
availability and geographical distributions of Indiana poultry manure.
8
Table 4. Characteristics of poultry data sources.
Parameter IDEM USDA-NASS
Permits Annual report Annual statistics Census
Farm coverage CFO and CAFO CAFO All farms All farms*
Publication interval Annual/monthly Annual Annual Five years
Data spatial resolution Farm Farm State County
Data temporal resolution Monthly Annual Annual/monthly Annual
Level of details High High Low Medium*
Manure production data No Yes No No
Note: *Data collection from farms of all sizes. Statistical data for the public are at county level.
Data about the poultry CFOs and CAFOs in different counties were studied based on the
characteristics of the different data sources by evaluating their farm coverage, geographical
resolution, temporal resolution, level of details, and data accuracy.
IDEM CFO/CAFO Permits
The IDEM issues CFO approval or a federal National Pollutant Discharge Elimination System
(NPDES) permit, depending on the size of the operation (IDEM, 2012). The summarized data
about CFO/CAFO from IDEM are tabulated in an Excel spreadsheet and provides details about
the farms, including addresses and contacting phone numbers (Table 5). Five poultry species
(layers, pullets, broilers, turkeys, and ducks) are included. The permit data were available from
IDEM since 2001, providing a valuable source for analyzing the history of poultry CFO/CAFO
development. These data were an essential information source for this study.
Table 5. List of poultry CFO/CAFO information available from IDEM.
Information Category Information
ID and name TEMPO ID # (Agency Interest #)
CFO Farm ID #
Operation Name and Owner‟s Name
Operation location
Mailing Address and Phone Number
Section, Township, Range
Latitude and Longitude
Permit information
Current Permit Type (CFO or CAFO)
Most Recent Construction Approval # and Date
NPDES Permit #; Most Recent NPDES Received and Issued
Most Recent Approval Received and Issued
Most Recent MMP Received and Issued
Expiration Date and Date Renewal Due
Poultry species and inventory
Layers
Pullets
Broilers
Turkeys
Ducks

9
However, the IDEM permit records only reflect a small portion of the actual producers because
permits are required for only farms classified as CFO or CAFO. There were 315 poultry
CFO/CAFO according to the IDEM permit list, but 4545 Indiana operations classified as “any
poultry farms” according to the USDA census in 2007. In terms of the number of poultry farms,
the total CFO/CAFO listed by IDEM was only about 7% of all the poultry farms counted by
USDA. For poultry species such as ducks, the number of CFO/CAFO was <1% of all duck farms
because most of the duck farms were relatively small contract producers.
Moreover, there were also discrepancies between the number of birds listed in the IDEM permits
and the USDA statistics. The USDA census data covered all poultry farms regardless of their
sizes. The IDEM permits were only required for large farms (CAFO and CFO). Therefore, the
IDEM numbers of poultry farms and numbers of birds should both be subsets of the USDA
census data. However, while this is confirmed for the number of farms, it is not the case for the
numbers of birds for some species. Comparison of the two 2007 data sources in Table 6 shows
that for layers, broilers, and turkeys, the inventories from the USDA census were larger than the
numbers of birds in IDEM permits.
Table 6. Comparison of USDA and IDEM 2007 poultry data.
Poultry USDA census IDEM CFO/CAFO permits
Number of birds (inventory) Farms Number of birds Farms
Layers 24,238,513 3583 30,623,358 72
Pullets 6,928,062 519 9,375,708 49
Broilers 5,536,933 594 3,886,151 34
Turkeys 5,971,548 498 5,892,439 149
Ducks 1,538,664 793 258,700 11
Note: (1)
Inventory poultry.
The possible reason for this discrepancy may be because the actual numbers of birds at the
CFOs/CAFOs were smaller than the permitted numbers of birds. The producers tended to keep
their inventories less than the permitted maximum numbers of birds allowed at their facilities.
IDEM CAFO Annual Report
Poultry producer annual reports (Form 52510) are available from the IDEM on-line Virtual File
Cabinet (VFC) for download. Annual reports of CAFOs provided more detailed information of
individual facilities including manure production and disposal (Figure 1) than the IDEM permits.
However, annual reports to IDEM are only required for CAFOs, not AFOs. Therefore, only 73
poultry CAFOs out of 307 poultry CFO/CAFO (or 21%) had reports available in the VFC in
2011. As a consequence, the VFC can only provide limited amounts of information about poultry
manure production.
Inconsistent methodologies of manure production estimation in the annual report were found.
Some farms calculated the amount of total manure by multiplying the total number of animals on
the farm by the bird-specific manure production rates obtained from Purdue University Extension
publication ID-101 (Sutton et al., 1994), or the ASAE standard of manure production and
10
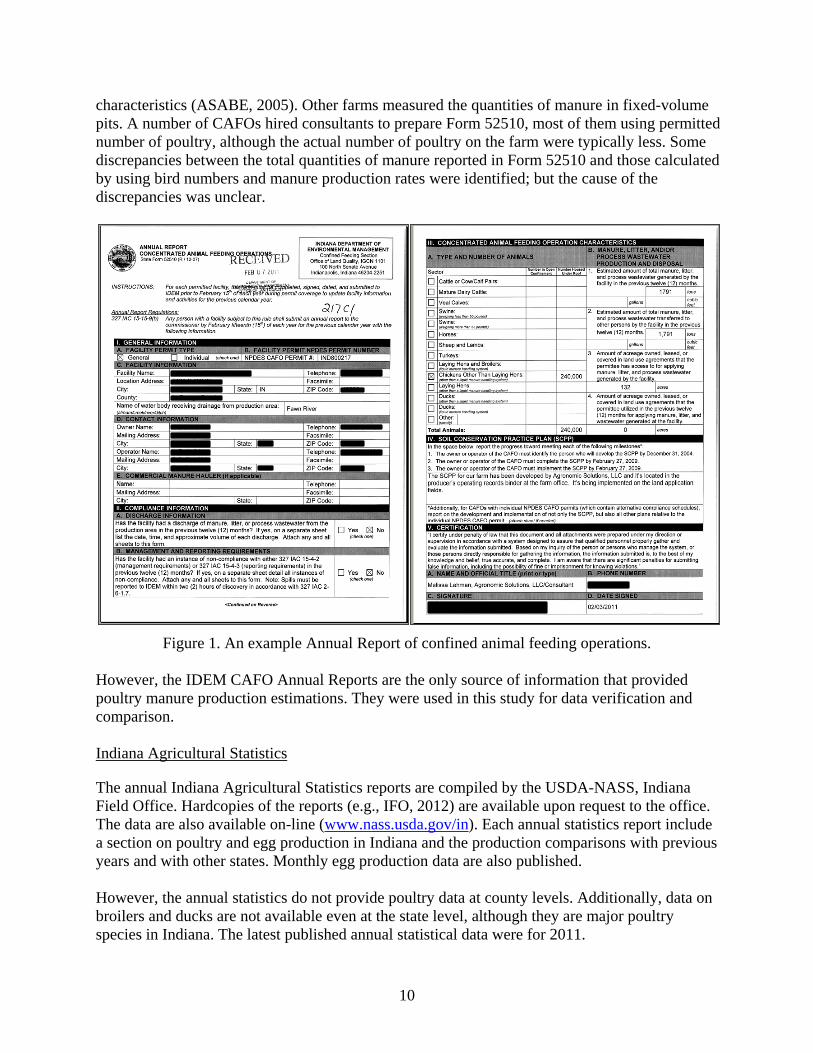
characteristics (ASABE, 2005). Other farms measured the quantities of manure in fixed-volume
pits. A number of CAFOs hired consultants to prepare Form 52510, most of them using permitted
number of poultry, although the actual number of poultry on the farm were typically less. Some
discrepancies between the total quantities of manure reported in Form 52510 and those calculated
by using bird numbers and manure production rates were identified; but the cause of the
discrepancies was unclear.
Figure 1. An example Annual Report of confined animal feeding operations.
However, the IDEM CAFO Annual Reports are the only source of information that provided
poultry manure production estimations. They were used in this study for data verification and
comparison.
Indiana Agricultural Statistics
The annual Indiana Agricultural Statistics reports are compiled by the USDA-NASS, Indiana
Field Office. Hardcopies of the reports (e.g., IFO, 2012) are available upon request to the office.
The data are also available on-line (www.nass.usda.gov/in). Each annual statistics report include
a section on poultry and egg production in Indiana and the production comparisons with previous
years and with other states. Monthly egg production data are also published.
However, the annual statistics do not provide poultry data at county levels. Additionally, data on
broilers and ducks are not available even at the state level, although they are major poultry
species in Indiana. The latest published annual statistical data were for 2011.
11
USDA Agricultural Census
The census data developed by USDA-NASS every five years contained the most detail and had
the highest geographical resolution (Table 4). The census data related to poultry production are
published at county levels. Publications based on the 2007 census are available online (USDA,
2009). Comparison of some 2007 census data with the 2002 census data is also provided. The
2012 census is not yet published.
The U.S. Census data associated with Indiana poultry contain both inventory and sales. The main
poultry species are layers, broilers, pullets, turkeys, and ducks. Additional species listed were
geese, emus, ostriches, pheasants, pigeons or squab, quail, and “other poultry”. “Other poultry”
are those poultry not having a specific code on the report form.
In keeping with the provisions of Title 7 of the United States Code, no data can be published that
would disclose information about the operations of an individual farm or ranch. All tabulated
census data are subjected to an extensive disclosure review prior to publication. Any tabulated
item that identifies data reported by a respondent or allows a respondent‟s data to be accurately
estimated or derived, was suppressed and coded with a „D‟. However, the number of farms is not
considered confidential information and is provided even though other information is withheld.
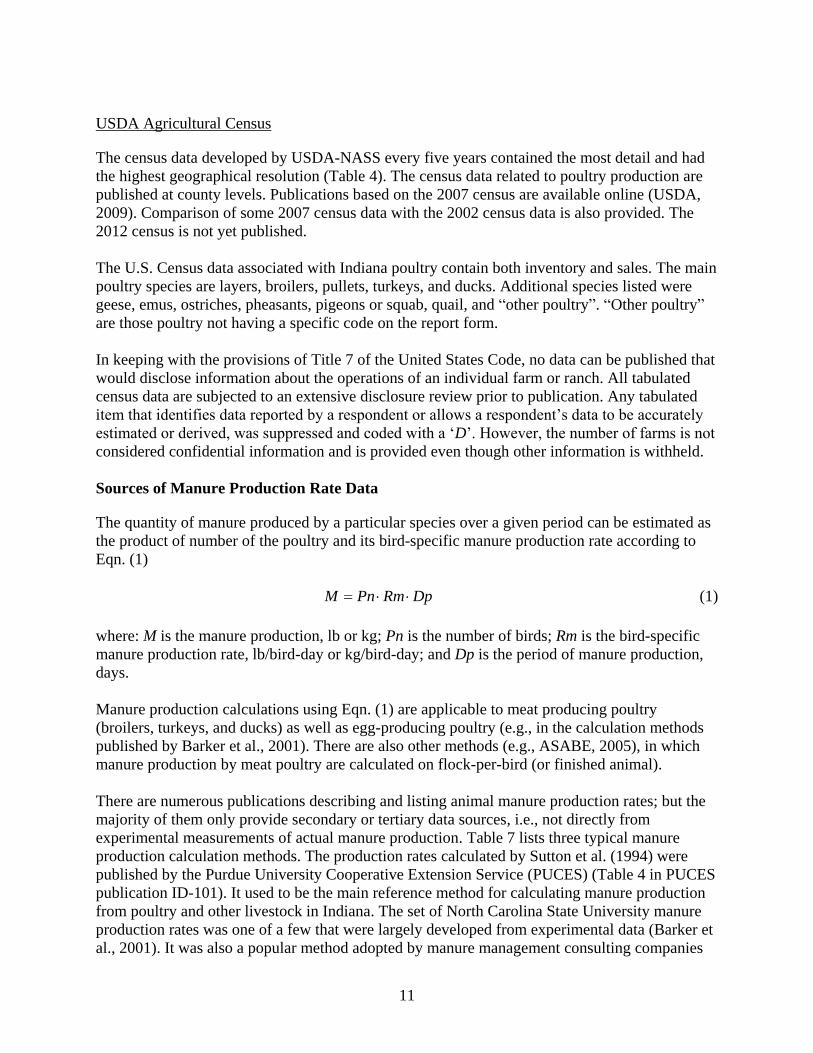
Sources of Manure Production Rate Data
The quantity of manure produced by a particular species over a given period can be estimated as
the product of number of the poultry and its bird-specific manure production rate according to
Eqn. (1)
M Pn Rm Dp (1)
where: M is the manure production, lb or kg; Pn is the number of birds; Rm is the bird-specific
manure production rate, lb/bird-day or kg/bird-day; and Dp is the period of manure production,
days.
Manure production calculations using Eqn. (1) are applicable to meat producing poultry
(broilers, turkeys, and ducks) as well as egg-producing poultry (e.g., in the calculation methods
published by Barker et al., 2001). There are also other methods (e.g., ASABE, 2005), in which
manure production by meat poultry are calculated on flock-per-bird (or finished animal).
There are numerous publications describing and listing animal manure production rates; but the
majority of them only provide secondary or tertiary data sources, i.e., not directly from
experimental measurements of actual manure production. Table 7 lists three typical manure
production calculation methods. The production rates calculated by Sutton et al. (1994) were
published by the Purdue University Cooperative Extension Service (PUCES) (Table 4 in PUCES
publication ID-101). It used to be the main reference method for calculating manure production
from poultry and other livestock in Indiana. The set of North Carolina State University manure
production rates was one of a few that were largely developed from experimental data (Barker et
al., 2001). It was also a popular method adopted by manure management consulting companies

12
before the ASAE (American Society of Agricultural Engineers) Standard of Manure Production
and Characteristics (ASABE, 2005) was widely accepted by producers and consulting companies.
Table 7. Three typical poultry manure production calculation methods.
Species Production rate Converted,
lb/bird-d
Moisture,
% wet base Manure
status kg/bird lb/ bird Period, days
Source: (Sutton et al., 1994)
Layer 14.53 32 365 0.09 NA As leaves
Broiler 8.17 18 365 0.05 NA As leaves
Turkey (male) 20.88 46 365 0.13 NA As leaves
Turkey (female) 20.88 46 365 0.13 NA As leaves
Ducks 27.24 60 365 0.16 NA As leaves
Pullet 9.99 22 365 0.06 NA As leaves
Source: (Barker et al., 2001)
Layer (4 lb) 0.12 0.26 1 0.26 75 As-excreted
Broiler (2 lb) 0.07 0.16 1 0.16 75 As-excreted
Turkey (15 lb) 0.31 0.68 1 0.68 75 As-excreted
Duck (3 lb) 0.15 0.33 1 0.33 73 As-excreted
Source: (ASABE, 2005)
Layer 0.088 0.19 1 0.19 75 As-excreted
Broiler* 4.9 11 48 0.23 74 As-excreted
Turkey (male)* 36 78 133 0.59 74 As-excreted
Turkey (female)* 17 38 133 0.29 74 As-excreted
Duck* 6.5 14 39 0.36 74 As-excreted
Notes: * production rates based on finished animal. NA = not available. As leaves = as manure
leaves storage for land application. As-excreted = feces and urine as excreted.
The ASAE standard was originally developed by the Engineering Practices Subcommittee of the
ASAE Agricultural Sanitation and Waste Management Committee. It was approved by the
Structures and Environment Division Standards Committee and has gone through several
reconfirmations, revisions, and reaffirmations:
Adopted by ASAE in December 1976;
Reconfirmed in December 1981, December 1982, December 1983, December 1984,
December 1985, December 1986, December 1987;
Revised in June 1988;
Revised editorially and reaffirmed in December 1993 as version “ASAE EP384.1
DEC93”;
Revised editorially in March 1995 (ASAE, 1997);
Reaffirmed in December 1998, December 1999, December 2001, February 2003;
Revised in March 2005 by a joint committee of ASAE and Federation of Animal Science
Societies members as version “ASABE D384.2 MAR2005” (ASABE, 2005);
Reaffirmed in January 2010 as version “ASABE D384.2 MAR2005 (R2010)” (ASABE,
2010).
13
Method Selection and Total Manure Production Calculation
Year 2007 was selected as the primary year of Indiana poultry manure availability and
geographical distribution study because 2007 is the latest year that both the USDA census data
and IDEM CFO/CAFO permit data are available. Moreover, only the USDA census data have
sufficient details that can be used to study poultry manure production at both county and state
levels. Statewide poultry manure production by certain poultry species from 2002 to 2011 were
also studied using USDA annual statistical data. In addition, the USDA 2002 census data were
also used as historical data to compare with the relevant data in the 2007 census.
The USDA and IDEM data complemented each other and were used as the primary source of
poultry data to estimate poultry manure production at state and county levels. The withheld data
“D” in the USDA census for certain poultry species and counties created some data gaps. These
“missing data” were assessed and replaced with the IDEM 2007 CFO/CAFO permit data if the
data demonstrated some confidence, e.g., confirmed by the number of farms, which was not
withheld in the census, for the same poultry species and the same county, and evaluated with
multi-year CFO/CAFO permit data. However, this method may still have some errors, although
relatively small compared with leaving the data gaps, due to the fact that the permitted number of
poultry for a CFO/CAFO was often larger than the actual number of poultry raised in the facility.
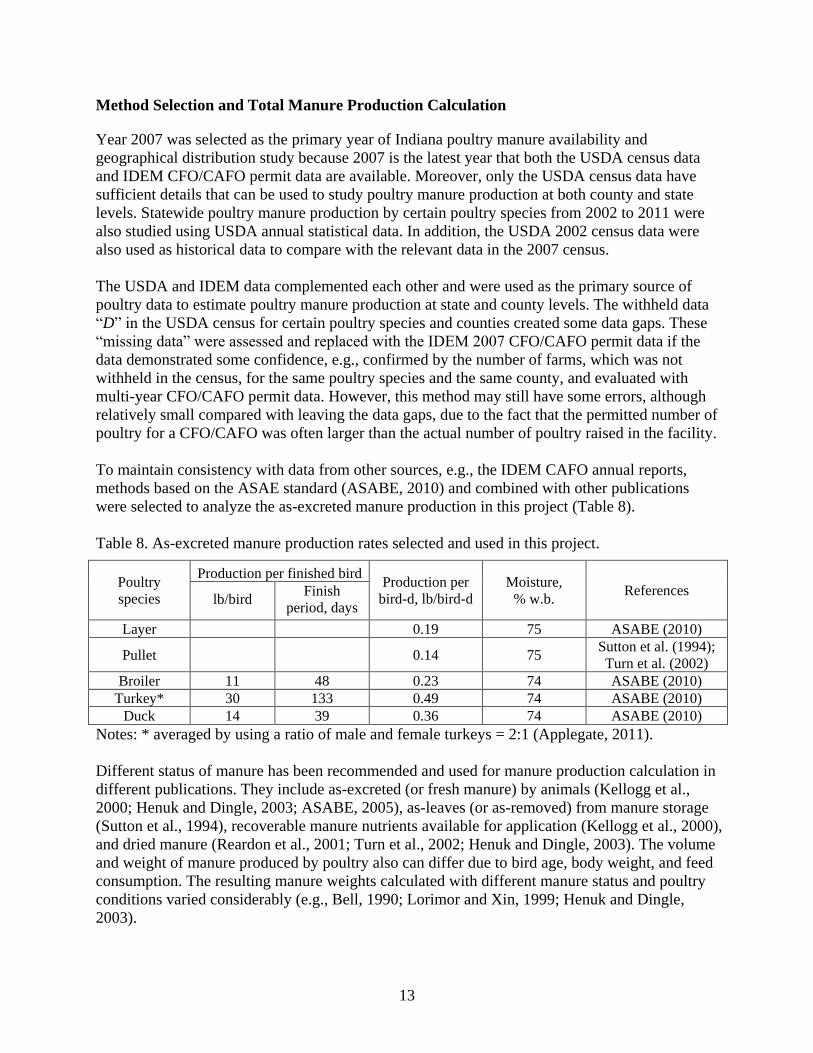
To maintain consistency with data from other sources, e.g., the IDEM CAFO annual reports,
methods based on the ASAE standard (ASABE, 2010) and combined with other publications
were selected to analyze the as-excreted manure production in this project (Table 8).
Table 8. As-excreted manure production rates selected and used in this project.
Poultry
species
Production per finished bird Production per
bird-d, lb/bird-d Moisture,
% w.b. References
lb/bird Finish
period, days
Layer 0.19 75 ASABE (2010)
Pullet 0.14 75 Sutton et al. (1994);
Turn et al. (2002)
Broiler 11 48 0.23 74 ASABE (2010)
Turkey* 30 133 0.49 74 ASABE (2010)
Duck 14 39 0.36 74 ASABE (2010)
Notes: * averaged by using a ratio of male and female turkeys = 2:1 (Applegate, 2011).
Different status of manure has been recommended and used for manure production calculation in
different publications. They include as-excreted (or fresh manure) by animals (Kellogg et al.,
2000; Henuk and Dingle, 2003; ASABE, 2005), as-leaves (or as-removed) from manure storage
(Sutton et al., 1994), recoverable manure nutrients available for application (Kellogg et al., 2000),
and dried manure (Reardon et al., 2001; Turn et al., 2002; Henuk and Dingle, 2003). The volume
and weight of manure produced by poultry also can differ due to bird age, body weight, and feed
consumption. The resulting manure weights calculated with different manure status and poultry
conditions varied considerably (e.g., Bell, 1990; Lorimor and Xin, 1999; Henuk and Dingle,
2003).

14
To reduce errors due to different manure status, it was found that calculation of manure
production in fresh manure (as-excreted) based on the ASAE standard (ASABE, 2010) was most
appropriate. Another advantage of using as-excreted, compared with other status like as-removed,
is that the part of nutrients emitted or run off during storage is taken into account.
However, the ASAE standard (ASABE, 2010) does not provide manure production rates for
pullets. Moreover, the USDA inventory and sales data do not distinguish between male and
female turkeys. To fix these problems when using the ASAE standard, the following manure
production rates were used:
A manure production rate for pullets, equivalent to as-excreted, derived from the methods
by Sutton et al. (1994) and Turn et al. (2002).
An average ratio of male and female turkeys of 2:1 in Indiana based on the data from the
Indiana State Poultry Association (Applegate, 2011).
In this project, manure production rates for layers and pullets were calculated as per bird per day.
For meat-producing poultry, both production rates per day and per finished-animal over the
growing period (e.g., 48 days for broilers and 133 days for turkeys) were used for comparison
(Table 8). Production per bird per day for all poultry species were used to calculate the total
manure production. To keep the confidentiality of the non-CFO/CAFO producers, the highest
geographical resolution was set at the county level.
The quantities of manure produced from n different poultry species over a given period in a
county or in the entire state were calculated using Eqn. (2).
1
n
i i i
i
M Pn Rn Dp
(2)
The unit of weight for manure production at county and state levels is in ton (or short ton = 2000
lbs).
Poultry Manure Nutrient Value Assessment
To assess the total nutrient values of the Indiana poultry manure, the typical manure
characteristics (as-excreted) and calculation methods in the ASAE standard D384.2 MAR2005
(ASABE, 2010), and in Sutton et al. (1994) and Turn et al. (2002) were used (Table 9). Table 10
converts the nutrient contents as percentages of the fresh manure from the data in Table 9 for
quick calculation using the total poultry manure production in each county.
However, the typical manure characteristics in the ASABE standard (ASABE, 2010) were based
on the animals on national demographics, rather than on Indiana demographics (Applegate,
2013). Therefore, adjustments could still be made when the Indiana demographics are available.

15
Table 9. Poultry manure nutrient calculation methods.
Species Total solids Nitrogen Phosphorus Potassium Calcium Total manure Units
Layer 0.049 a 0.0035 a 0.0011 a 0.0015 a 0.0048 a 0.19 a lb/d-bird Pullet 0.036 c 0.0030 c 0.0010 c 0.0011 c 0.14 c lb/d-bird Broiler 2.8 a 0.12 a 0.035 a 0.068 a 11a lb/bird
Turkey 16.6 b 0.99 b 0.29 b 65 b lb/bird
Duck 3.7 a 0.14 a 0.048 a 14 a lb/bird
Note: a Based on Table 10a and Table 12a in ASABE (2010);
b Based on Table 10a in ASABE
(2010) and a 2:1 ratio of male to female turkeys (Applegate, 2011); c Estimated by combining
data in Table 4 of Sutton et al. (1994) and Table 5 in Turn et al. (2002).
Table 10. Poultry manure nutrients as percentages of as-excreted manure.
Types Total solids, % Nitrogen, % Phosphorus, % Potassium, % Calcium, %
Layer 26 1.842 0.579 0.807 2.526
Pullet 25 1.789 0.597 0.629 NA
Broiler 25 1.091 0.318 0.618 NA
Turkey 26 1.531 0.454 NA NA
Duck 26 1.000 0.343 NA NA
Note: NA = not available.
Indiana Poultry Farms
Overview
According to the results of the agricultural census, the total number of Indiana poultry farms
increased by 53.5% from 2002 to 2007. There were 4545 farms, which raised various species of
poultry in 2007, up from 2961 farms in 2002 (Figure 2).
Figure 2. Number of Indiana poultry farms in 2002 and 2007.
2,9
61
2,1
52
54
0
57
2
42
3
55
3
36
7
4,5
45
3,5
83
51
9
59
4
49
8 79
3
72
4
0
1,000
2,000
3,000
4,000
5,000
6,000
All
poultry
Layers Pullets Broilers Turkeys Ducks Other
Nu
mb
er o
f fa
rms 2002 2007

16
Layer hen farms consisted of 78.8% of all Indiana poultry farms in 2007. There were 3853 layer
farms in 2007, up from 2152 farms in 2002 (Figure 2). The number of duck farms was the
second largest and there were 793 in 2007, up from 553 in 2002. Other farms in 2007 included
emus (20), geese (333), ostriches (2), pheasants (113), pigeons or squab (138) and quail (75).
The total inventory of poultry on the “other farms” species was less than 100,000 in 2007.
Pullet, broiler, and turkey farms had similar numbers of farms, ranging from 498 (turkey) to 594
(broiler) in 2007. The number of farms of all major species increased from 2002 to 2007, except
for pullet farms, which decreased by 21 during the five year period. The counties that had the
largest numbers of poultry farms in each county (>100) were La Grange, Elkhart, Noble,
Kosciusko, and Adams in the northeast, and Daviess in the southwest (Figure A.1, page 43).
According to IDEM, the total number of poultry CFO/CAFO was 347 in 2002 and 315 in 2007.
The poultry CFO/CAFO operations were only 11.7% and 6.9% of the total poultry farms in 2002
and 2007, respectively. Most Indiana poultry farms were below the CFO threshold. These trends
demonstrated that while the total number of Indiana poultry farms increased, the number of
CFO/CAFO decreased.
Layer Farms
The sizes of layer farms varied considerably. The majority (about 92.8%) of the layer farms only
had inventories of less than 100 layers (Table 11). Most of these can be called hobby farms, or
small farms that are maintained without expectation of being a primary source of income. Some
are managed as working farms for sideline incomes, or run at an ongoing loss as a lifestyle
choice by people with the means to do so, functioning more like a country home than a business.
The largest numbers of layer farms were found in a few counties (La Grange, Elkhart, Adams,
and Daviess) that had more than 100 layer farms (Figure A.2, page 44).
Table 11. Size distributions of layer farms in Indiana in 2007.
Farms with inventory of Farms Layers
Total number % Total number %
All sizes 3,583 100.00% 24,238,513 100.00%
1 to 49 3,053 85.21% 51,921 0.21%
50 to 99 271 7.56% 16,716 0.07%
100 to 399 150 4.19% 24,360 0.10%
400 to 3199 18 0.50% 30,694 0.13%
3200 to 9999 4 0.11% 28,100 0.12%
10,000 to 19,999 19 0.53% 332,464 1.37%
20,000 to 49,999 21 0.59% 535,830 2.21%
50,000 to 99,999 11 0.31% 677,838 2.80%
100,000 or more 36 1.00% 22,540,590 92.99%
Source: USDA-NASS.
About 98% of the layer hens were raised on less than 2% of the farms (Table 11). The locations
of layer CFO/CAFO farms were mostly in the north and south of Indiana (Figure A.3, page 45).

17
According to the 2007 USDA census, there were 68 layer farms (1.90% of the total layer farms)
that had inventories of more than 20,000 layers in Indiana. According to the IDEM permits, there
were 72 active layer CFO/CAFO (>30,000 layers/farm) in the same year. There are some
discrepancies that were probably due to the fact that the actual number of birds at a CFO/CAFO
could be smaller than the permitted capacity.
Pullet Farms
The total number of pullet farms of 519 in 2007 was smaller than layer farms. La Grange,
Elkhart, Kosciusko, and Adams counties in northeast had the largest number of pullet farms
(Figure A.4, page 46). According to the size distribution data by USDA-NASS for the pullet
farms for laying flock replacement, there were more small farms (<2,000 pullets sold) and large
farms (≥ 100,000 pullets sold) than the medium size (between 2,000 and 100,000) farms in 2007
(Table 12). The small farms consisted of about 61% of total farms but only sold 0.04% pullets,
while the big farms (24% of total farms) produced 94.2% of the pullets.
Table 12. Size distribution of pullet farms for laying flock replacement in Indiana in 2007.
Farms with number sold Farms Pullets sold
Total number % Total number %
All sizes 121 100.00% 12,505,394 100.00%
1 to 1,999 74 61.16% 5,248 0.04%
2,000 to 15,999 3 2.48% 26,400 0.21%
16,000 to 29,999 4 3.31% 87,000 0.70%
30,000 to 59,999 7 5.79% 331,600 2.65%
60,000 to 99,999 4 3.31% 275,000 2.20%
100,000 or more 29 23.97% 11,780,146 94.20%
Source: USDA-NASS.
The IDEM CFO/CAFO permit data listed 49 pullet farms in 2007 (Figure A.5, page 47). Most
pullet CFO/CAFO farms were located in the northern and southern Indiana. There were 52 pullet
farms in 2002, 47 in 2011, and 48 in 2012.
Broiler Farms
The sizes of broiler farms also varied considerably. About 75% of the farms sold less than 2000
broilers in 2007 representing only about 0.1% of all broilers. The second largest broiler farms
sold between 100,000 to 200,000 birds each in 2007 and their total number of birds accounted
for about 20% of the state total. The largest Indiana broiler farms (each sold >500,000 birds in
2007) made up less than 6% of the number of farms, but sold about 71% of the birds (Table 13).
La Grange, Elkhart, and Daviess counties had more than 30 broiler farms each (Figure A.6, page
48). There were 34 broiler CFO/CAFO farms according to the 2007 IDEM permit records. This
number was 23 in 2002 and increased to 50 in 2012, indicating an important increase in the past
decade. Broiler CFO/CAFO farms were located mostly in the southern part of Indiana. There
were also a few CFO/CAFO broiler farms scattered in the northern part of Indiana (Figure A.7,
page 49).

18
Table 13. Size distributions of broiler farms in Indiana in 2007.
Farms with number sold Farms, % Broilers, %
All sizes 100.00% 100.00%
1 to 1999 74.69% 0.11%
2000 to 15,999 0.75% 0.04%
16,000 to 29,999 0.75% 0.17%
30,000 to 59,999 1.25% 0.58%
60,000 to 99,999 1.25% 1.05%
100,000 to 199,999 13.53% 20.26%
200,000 to 299,999 0.75% 2.00%
300,000 to 499,999 1.25% 5.26%
500,000 or more 5.76% 70.53%
Source: USDA-NASS.
Turkey Farms
About 41% of the Indiana turkey farms sold < 2,000 turkeys each in 2007. The production of the
144 farms accounted for 0.02% of the statewide total. About 58% of the farms sold more than
8000 turkeys each in 2007. There were 156 CFO/CAFO turkey farm permits issued by IDEM in
2002, 149 in 2007, and 152 in 2012. The numbers of CFO/CAFO turkey farms were relatively
stable during the past decade.
Although turkey farms were found in 82 Indiana counties (Figure A.8, page 50), most of the
CFO/CAFO‟s were located in southwestern Indiana. There were also a few scattered in the
middle and eastern sections of the state (Figure A.9, page 51).
Table 14. Size distributions of turkey farms in Indiana in 2007.
Farms with number sold Farms Turkeys
Total number % Total number %
All sizes 351 100.00% 13,487,899 100.00%
1 to 1999 144 41.03% 2725 0.02%
2000 to 7999 4 1.14% 16,438 0.12%
8000 to 15,999 14 3.99% 166,200 1.23%
16,000 to 29,999 23 6.55% 518,050 3.84%
30,000 to 59,999 82 23.36% 3,513,313 26.05%
60,000 to 99,999 61 17.38% 4,484,940 33.25%
100,000 or more 23 6.55% 4,786,233 35.49%
Source: USDA-NASS.
Duck Farms
Northeastern Indiana has the largest number of duck farms, especially in Elkhart, La Grange,
Kosciusko, and Adams counties (Figure A.10, page 52). No data about the duck farm size
distribution in Indiana were published in the USDA census.

19
Although Indiana is ranked the number one duck production state, the majority of duck
producers are small scale contractors. There were only 12 duck CFO/CAFO permits issued by
IDEM in 2002, 11 in 2007 (Figure A.11, page 53), 6 in 2011, and 4 in 2012. The number of duck
CFO/CAFO has been decreasing rapidly.
Indiana Poultry Manure Production
Overview
Indiana produced approximately 1.885 million tons of poultry manure in 2007 (Figure 3).
Compared with the manure produced in 2002 (1.488 million tons), there was a 26.7% increase in
total poultry manure production in the five-year period. Layer manure (0.840 million tons)
consisted of 44.6% of all manure produced, followed by turkey manure (0.534 million tons) that
was 28.3% and pullets (0.177 million tons) that was 9.4%. Among the five major poultry species
in the state, the portion of the manure produced by ducks (0.101 million tons) was the smallest at
5.4%.
Figure 3. Production of as-excreted manure from Indiana poultry farms in 2007.
Note: Manure from other poultry (emus, geese, ostriches, pheasants, pigeons or squab, and quail)
were not included due to lack of available manure production rates for these species.
Analysis of poultry data from 2002 to 2011 revealed that there was generally an increasing trend
in the manure production of three of the major poultry species (Figure 4). The total manure
produced by layers, pullets, and turkeys increased 31% from 2002 to 2011. The rate of increase
was the largest for turkeys (84%) and the smallest for layers (4%).
Indiana poultry manure distributions vary greatly among different counties. In general, there was
more poultry manure available in northern and southern Indiana (Figure A.12, page 54). Among
the 92 counties in 2007, Dubois County in southern Indiana had the highest manure production
of approximately 268,400 tons, followed by Kosciusko County (211,800 tons), Jackson Country
(165,100 tons), and Jay County (142,000 tons). Twenty-three counties produced between 10,000
1,4
88
76
1
14
7
16
1
34
4
75
1,8
85
84
0
17
7
23
2 5
34
10
1
0
500
1,000
1,500
2,000
2,500
All poultry Layers Pullets Broilers Turkeys Ducks
Ma
nu
re p
rod
ucti
on
, x 1
00
0 to
ns
2002 2007

20
and 100,000 tons of poultry manure each. Fifty other counties produced less than 1,000 tons of
poultry manure. Benton County had the least available poultry manure of about 2 tons.
Figure 4. Annual Indiana manure production by three major poultry species from 2002 to 2011.
Layer Manure
A total of 761,200 tons layer manure was produced in Indiana in 2002. The quantity increased to
840,500 tons in 2007. It decreased slightly to 795,000 tons in 2011 (Figure 4). Most of the layer-
manure-rich counties were located in northern Indiana. However, the two counties that produced
the largest quantities of manure were Kosciusko County (142,000 tons) in the north and Jackson
County (126,000 tons) in the south. About 69% of the counties had less than 100 tons of layer
manure produced in 2007. Most of these counties are in central Indiana (Figure A.13, page 55).
Pullet Manure
There was a net increase in pullet manure production in Indiana from 2002 to 2011 (Figure 4).
Indiana produced 147,300, 177,000, and 207,800 tons of pullet manure in 2002, 2007, and 2011,
respectively. The geographical distribution of the pullet manure in Indiana is similar to that of
layer manure (Figure A.14, page 56). Most of the pullet-manure-rich counties were located in the
northern and southeast parts of the state. The largest pullet manure producing counties in 2007
were Jackson County (39,000 tons) in the south and Kosciusko County (34,000 tons) in the north.
Broiler Manure
Indiana produced 160,500 tons of broiler manure in 2002 and 232,400 tons in 2007. There was
an increase of about 45% during that period. Because of the data unavailability, the broiler
manure production in 2011 could not be estimated. There were only 34 of the 92 counties, where
broiler manure was produced in 2007. Twenty-four of the 34 counties produced less than 65 tons
of manure each. The six counties that had the highest broiler manure production were
Washington County (82,000 tons), LaGrange County (60,000 tons), Elkhart County (29,000
0
100
200
300
400
500
600
700
800
900
1,000
2002 2003 2004 2005 2006 2007 2008 2009 2010 2011
Mn
au
re p
rod
ucti
on
, x1
00
0 to
n
Year
Layer Pullet Turkey
21
tons), Harrison (15,000 tons), Crawford County (12,000 tons), and Orange County (11,000 tons).
These counties are located in the northeast and southeast of Indiana (Figure A.15, page 57).
Turkey Manure
Indiana produced 344,100 and 534,000 tons of turkey manure in 2002 and 2007, respectively.
This quantity was 633,800 tons in 2011, an increase of 84% in the nine-year period compared
with 2002. Turkey manure was largely produced in southwest counties. There were 14 southwest
counties shown in Figure A.16 (page 58) that produced more than 1,000 tons of manure in 2007.
The largest turkey manure producing county was Dubois County that had 213,400 tons of turkey
manure produced, almost 40% of all the turkey manure in Indiana.
Due to the withheld numbers of turkeys for farms in a large number of counties by the USDA
census and most of these farms were non CFO/CAFO, turkey manure production from 27 of the
92 Indiana counties could not be calculated. Thirty other counties had only less than 5 tons of
turkey manure produced. However, these withheld numbers of turkeys were included in the total
number of turkeys in the entire state. Therefore, they did not affect the state level turkey manure
production calculation.
Duck Manure
A total of 75,100 tons of duck manure was produced in 2002. It was 101,100 tons in 2007, a 35%
increase from 2002. Production of duck manure was concentrated in northeast Indiana (Figure
A.17, page 59). Three counties (Elkhart County, LaGrange County, and Kosciusko County)
produced more than 20,000 tons of duck manure each. Because there were many small duck
producing contractors, and only 11 CFO/CAFO in 2007 (6 in 2011, and 4 in 2012), a large
proportion of manure was distributed around the counties.
Nutrients from Indiana Poultry Manure
The equivalent amounts of nutrients from poultry manure (as-excreted) in Indiana, based on the
estimation methods in Table 9 and Table 10, was 30,370 tons of nitrogen and 9,433 tons of
phosphorus in 2007 (Table 15). The equivalent nitrogen in poultry manure in 2007 increased by
24.3% and that of phosphorus increased by 23.8% compared with 2002. Similar to the largest
percentage of layer manure in the total manure production, layer manure contributed to the
largest portion of nutrient among all poultry species, followed by turkey manure.
When divided by the total “land in farms” in Indiana, there were averages of 4.11 lbs of nitrogen
and 1.28 lbs of phosphorus per acre in 2007, compared with 3.24 lbs of nitrogen and 1.01 lbs of
phosphorus per acre of land in 2002 (Table 15). There were 26.7% and 26.2% increases in
nitrogen and phosphorus from 2002 to 2007, respectively.
The Indiana poultry manure nutrients were unevenly distributed across the state. Fifty counties
had less than 0.15 lb nitrogen and 0.05 lb phosphorus per acre of farm land (Figure A.18, page
60 and Figure A.19, page 61). Thirteen other counties had more than 10 lb nitrogen and 3 lb
phosphorus per acre. Dubois County had the highest available poultry nutrients with 46.9 lb
nitrogen and 14.2 lb phosphorus per acre. Most “nutrient-rich” counties were located in southern

22
and northern Indiana, while the state‟s corn (Figure A.20, page 62) and soybean (Figure A.21,
page 63) production were concentrated in central Indiana.
Table 15. Nitrogen and phosphorus in as-excreted poultry manure in Indiana in 2002 and 2007.
Parameters Nitrogen Phosphorus
2002 2,007 2002 2007
Layer, ton 14,021 15,481 4407 4866
Pullet, ton 2635 3167 879 1057
Broiler, ton 1751 2536 510 739
Turkey, ton 5268 8176 1562 2424
Duck, ton 751 1011 258 347
Total, ton 24,427 30,370 7617 9433
Per acre farm land, lb/acre 3.24 4.11 1.01 1.28
Note: Data of the total “land in farms” in Indiana are from the USDA agricultural censuses and
were 15,058,670 acres in 2002 and 14,773,184 acres in 2007.
Based on incomplete statistical data of three of the major Indiana poultry species (Figure 4), it is
estimated that the total nutrient from poultry manure in 2011 was likely increased by 5% from
2007. Assessment of poultry manure demonstrated that, with the development of the Indiana
poultry industry, more nutrients from poultry manure became available in the past decade.
However, the nitrogen and phosphorus from poultry manure in Table 15 were calculated on the
as-excreted basis using ASAE standards. In reality, some nutrients will be lost before poultry
manure is applied in croplands, depending on the manure collection and storage methods and
storage time. Therefore, the actual quantity of nutrients applied to the fields should be smaller.
According to Kellogg et al. (2000), poultry had the largest share of recoverable manure nutrients:
45% of the nitrogen and 38% of the phosphorus in 1997. Recoverable manure nutrients is the
portion of as-excreted manure nutrients that can be collected from confinement facilities after
accounting for losses during collection, transfer, storage, and treatment. Recoverable manure
nutrients are, therefore, the amounts that are available for land application.
Assuming that these ratios were valid for 2007, then the recoverable poultry manure nitrogen and
phosphorus in Indiana for 2007 were 13,667 tons and 3585 tons, respectively. The recoverable
poultry nutrients per acre of Indiana farm land were 1.85 lb/acre of nitrogen and 0.49 lb/acre of
phosphorus.

23
Poultry Manure Transportation
Procedures and Methods
Concentrated poultry operations result in large quantities of poultry manure in limited areas.
Many Indiana CFO/CAFO cannot utilize all the manure on their own croplands. Sales and
transportation is therefore necessary to distribute the manure to croplands that can be miles or
dozens of miles away from the facilities. To study Indiana poultry manure transportation, four
major procedures were taken:
1. Data collection
2. Phone interviews and face-to-face discussions with manure brokers and other manure
service providers
3. Consulting with manure management specialists and professionals
4. Data analysis and presentation
Information about manure service providers (usually brokers, traders, or contract haulers) were
collected from Purdue University‟s Manure Locator website (www.ansc.purdue.edu/
ManureLocator/), Manure Manager Magazine website (www.manuremanager.com/), online
business directories, and manure management consultants, and word-of-mouth. Historical data in
Indiana were also collected for comparisons with more current data.
Two phone interview sessions were conducted, one in 2011 and another in 2012. Face-to-face
discussions with professionals were made during meetings, seminars, extension workshops and
farm visits. Consulting with manure management specialists and professionals took place
throughout the project period. Data and information about manure sales and transportation
collected from different sources were compared, analyzed, and summarized.
Overview of Commercial Manure Service Providers
There were 41 manure service providers identified from various information sources since 2006
in Indiana. They were located in 18 counties (Figure 5), most of them are in central and northeast
Indiana. There were also a few manure service providers conducting business in Indiana but
located in neighboring states, especially in Michigan and Ohio.
Among the identified companies, 32% of the owners either did not respond for phone interviews,
or were too busy to answer questions or unwilling to share business information. The remaining
28 companies, who answered questions during phone calls or face-to-face discussions, provided
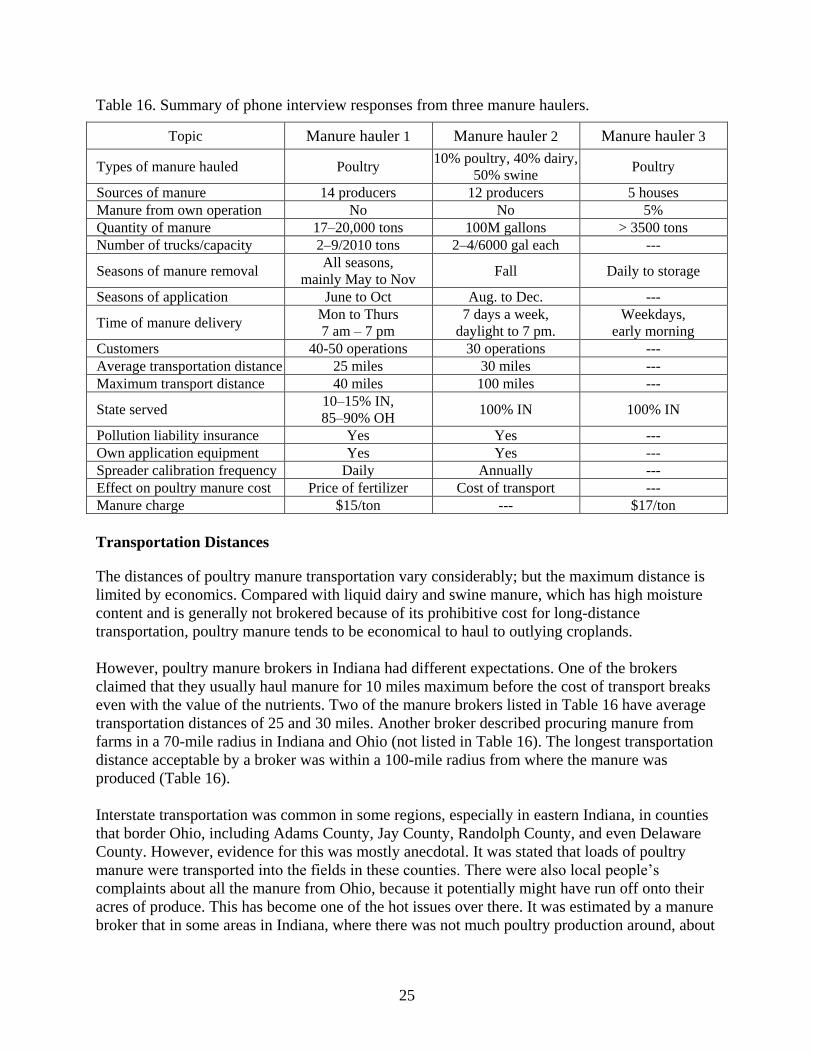
information at various degrees of detail. The responses of three manure haulers during the
interviews are listed in Table 16.
Various Commercial Services
Most of the companies did not broker or transport poultry manure. Among the 28 interviewed
companies, 11 provided service exclusively on dairy and/or swine manure. There were only eight
or 29% who worked directly on transporting and applying poultry manure. Four of the eight

24
provided service solely on poultry manure and four others covered different types of manure
including poultry manure. Additionally, the services of interviewed 28 companies have the
following characteristics:
Five had left the business or moved to a neighboring state by the time of the interviews.
Two provided manure management services, but not manure sales, transportation, and
application.
Two poultry manure service providers only sold, transported, and applied manure from
their own poultry CAFO. Another one had its own poultry CAFO, but also brokered
manure from other farms.
Two companies provided multiple on-farm manure services, including barn cleaning and
air quality testing.
Most brokers offered manure application services, which were considered to really give
the manure its worth. There were some crop producers who did not want to pay for
manure (only pay for application).
Spring, summer, and fall were the most frequent time of manure application.
Figure 5. Manure service providers identified in Indiana since 2006.
0 2 4 6 8
Adams
Carroll
Clinton
Daviess
Decatur
Elkhart
Fayette
Harrison
Hendricks
Howard
Jasper
Johnson
Kosciusko
Montgomery
Noble
Ohio
Spencer
Wabash
Number
Co
un
ty
25
Table 16. Summary of phone interview responses from three manure haulers.
Topic Manure hauler 1 Manure hauler 2 Manure hauler 3
Types of manure hauled Poultry 10% poultry, 40% dairy,
50% swine Poultry
Sources of manure 14 producers 12 producers 5 houses Manure from own operation No No 5% Quantity of manure 17–20,000 tons 100M gallons > 3500 tons Number of trucks/capacity 2–9/2010 tons 2–4/6000 gal each ---
Seasons of manure removal All seasons,
mainly May to Nov Fall Daily to storage
Seasons of application June to Oct Aug. to Dec. ---
Time of manure delivery Mon to Thurs 7 am – 7 pm
7 days a week,
daylight to 7 pm. Weekdays,
early morning Customers 40-50 operations 30 operations --- Average transportation distance 25 miles 30 miles --- Maximum transport distance 40 miles 100 miles ---
State served 10–15% IN, 85–90% OH
100% IN 100% IN
Pollution liability insurance Yes Yes --- Own application equipment Yes Yes --- Spreader calibration frequency Daily Annually --- Effect on poultry manure cost Price of fertilizer Cost of transport --- Manure charge $15/ton --- $17/ton
Transportation Distances
The distances of poultry manure transportation vary considerably; but the maximum distance is
limited by economics. Compared with liquid dairy and swine manure, which has high moisture
content and is generally not brokered because of its prohibitive cost for long-distance
transportation, poultry manure tends to be economical to haul to outlying croplands.
However, poultry manure brokers in Indiana had different expectations. One of the brokers
claimed that they usually haul manure for 10 miles maximum before the cost of transport breaks
even with the value of the nutrients. Two of the manure brokers listed in Table 16 have average
transportation distances of 25 and 30 miles. Another broker described procuring manure from
farms in a 70-mile radius in Indiana and Ohio (not listed in Table 16). The longest transportation
distance acceptable by a broker was within a 100-mile radius from where the manure was
produced (Table 16).
Interstate transportation was common in some regions, especially in eastern Indiana, in counties
that border Ohio, including Adams County, Jay County, Randolph County, and even Delaware
County. However, evidence for this was mostly anecdotal. It was stated that loads of poultry
manure were transported into the fields in these counties. There were also local people‟s
complaints about all the manure from Ohio, because it potentially might have run off onto their
acres of produce. This has become one of the hot issues over there. It was estimated by a manure
broker that in some areas in Indiana, where there was not much poultry production around, about

26
90% of chicken manure was from Ohio. Nevertheless, the exact volumes of the imported manure
were not available.
Service Areas
The business scales of the brokers and contract manure haulers also vary. There were co-ops that
had good coverage for all services with millions of dollars of business across different states
(mainly Michigan, Ohio, and Indiana). A nationwide company had local centers in Indiana.
There were also businesses with limited manure resources. More demands than supplies were
seen in some areas. One broker stated that they had to turn customers away because of their
limited service capacity.
The manure brokers‟ service areas could be at a radius of 200 miles (not the manure
transportation distance). Some were looking to go out even further, to 300 and 400 miles to take
advantage of how different areas require fertilizer at different seasons.
Manure Economics
Poultry manure prices also differ from areas and times but had a general increasing trend over
the years. Rising inorganic fertilizer prices in the past decade are the driving force of the
increasing economic values of the poultry manure. According to USDA, the prices of selected
nitrogen, phosphorus, and potassium fertilizers were approximately doubled or tripled from 2002
to 2012 (Figure 6 and Figure 7).
Figure 6. Average U.S. farm prices of selected nitrogen fertilizers.
Source: Agricultural Prices, USDA-NASS
(http://usda.mannlib.cornell.edu/MannUsda/viewDocumentInfo.do?documentID=1002).
The cost of using poultry manure as organic fertilizer consists of three components: manure,
transportation, and application. According to one manure seller, the price of layer manure
increased recent year considerably. Manure prices can vary and are usually negotiable based on
supply and demand, seasons and locations, and manure moisture and nutrient contents. The
0
100
200
300
400
500
600
700
800
900
1990 1992 1994 1996 1998 2000 2002 2004 2006 2008 2010 2012
$ / t
on
Year
Anhydrous ammonia
Urea 44-46% nitrogen
Ammonium nitrate
Sulfate of ammonium
Nitrogen solutions (30%)
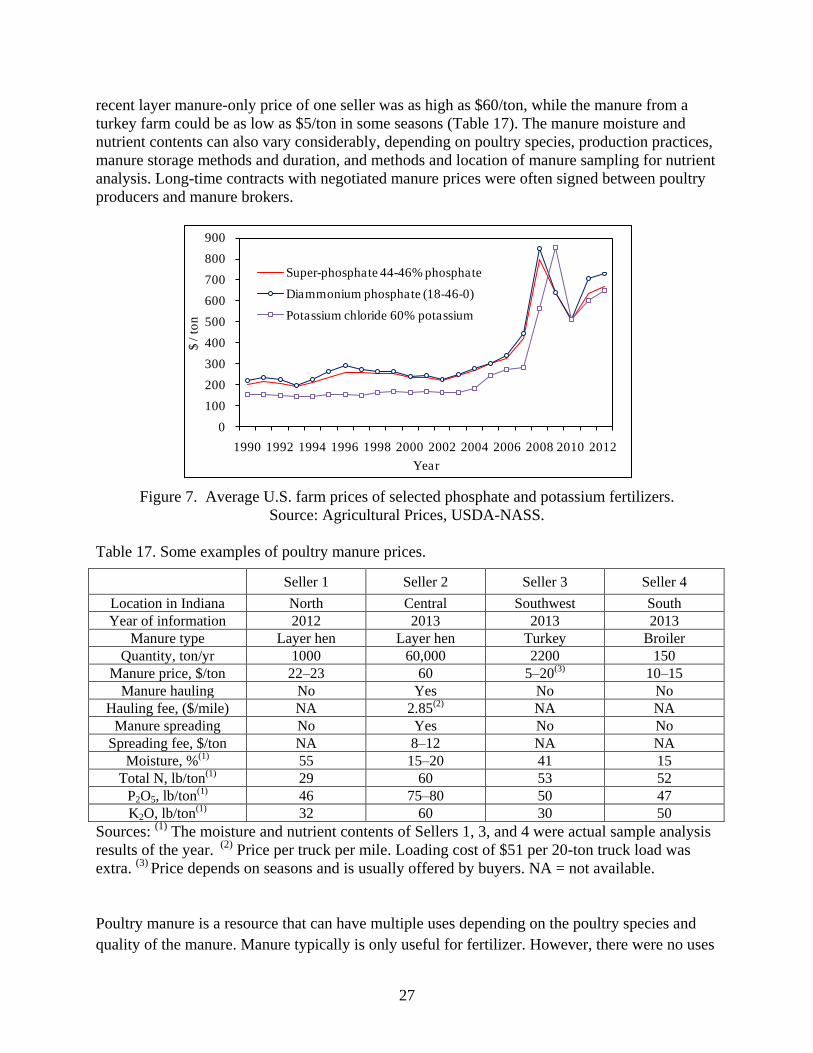
27
recent layer manure-only price of one seller was as high as $60/ton, while the manure from a
turkey farm could be as low as $5/ton in some seasons (Table 17). The manure moisture and
nutrient contents can also vary considerably, depending on poultry species, production practices,
manure storage methods and duration, and methods and location of manure sampling for nutrient
analysis. Long-time contracts with negotiated manure prices were often signed between poultry
producers and manure brokers.
Figure 7. Average U.S. farm prices of selected phosphate and potassium fertilizers.
Source: Agricultural Prices, USDA-NASS.
Table 17. Some examples of poultry manure prices.
Seller 1 Seller 2 Seller 3 Seller 4
Location in Indiana North Central Southwest South
Year of information 2012 2013 2013 2013
Manure type Layer hen Layer hen Turkey Broiler
Quantity, ton/yr 1000 60,000 2200 150
Manure price, $/ton 22–23 60 5–20(3) 10–15
Manure hauling No Yes No No
Hauling fee, ($/mile) NA 2.85(2) NA NA
Manure spreading No Yes No No
Spreading fee, $/ton NA 8–12 NA NA
Moisture, %(1) 55 15–20 41 15
Total N, lb/ton(1) 29 60 53 52
P2O5, lb/ton(1) 46 75–80 50 47
K2O, lb/ton(1) 32 60 30 50
Sources: (1)
The moisture and nutrient contents of Sellers 1, 3, and 4 were actual sample analysis
results of the year. (2)
Price per truck per mile. Loading cost of $51 per 20-ton truck load was
extra. (3)
Price depends on seasons and is usually offered by buyers. NA = not available.
Poultry manure is a resource that can have multiple uses depending on the poultry species and
quality of the manure. Manure typically is only useful for fertilizer. However, there were no uses
0
100
200
300
400
500
600
700
800
900
1990 1992 1994 1996 1998 2000 2002 2004 2006 2008 2010 2012
$ / t
on
Year
Super-phosphate 44-46% phosphate
Diammonium phosphate (18-46-0)
Potassium chloride 60% potassium
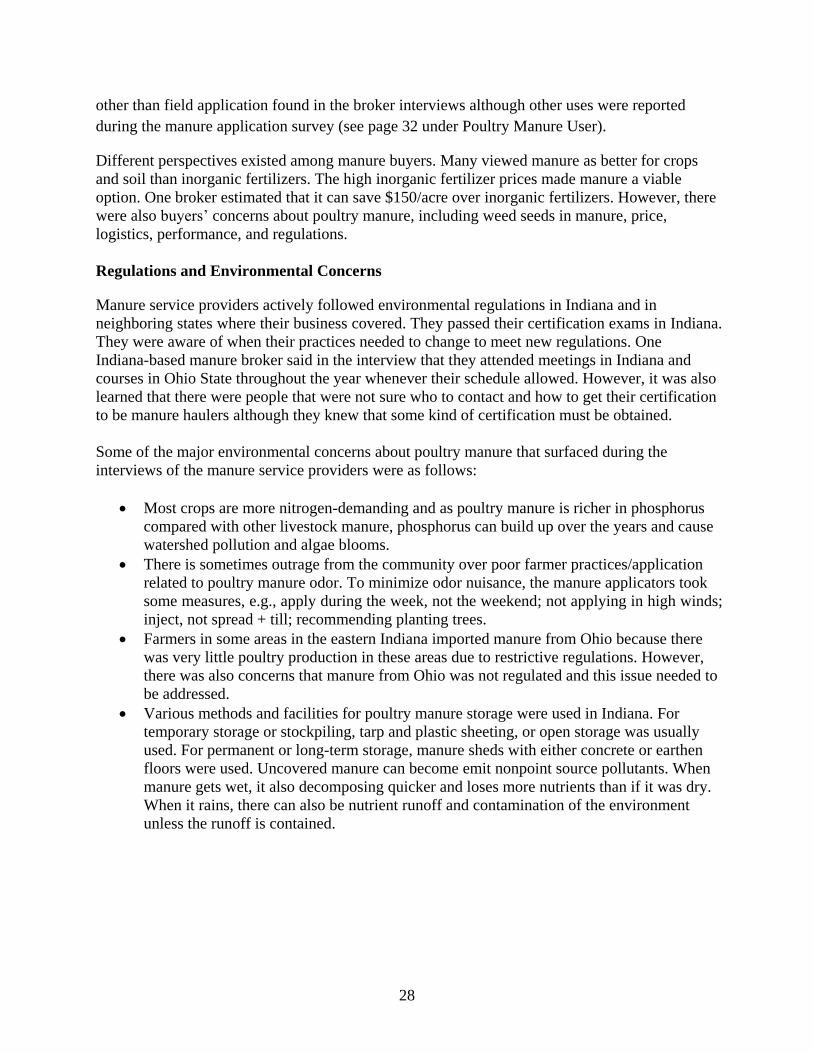
28
other than field application found in the broker interviews although other uses were reported
during the manure application survey (see page 32 under Poultry Manure User).
Different perspectives existed among manure buyers. Many viewed manure as better for crops
and soil than inorganic fertilizers. The high inorganic fertilizer prices made manure a viable
option. One broker estimated that it can save $150/acre over inorganic fertilizers. However, there
were also buyers‟ concerns about poultry manure, including weed seeds in manure, price,
logistics, performance, and regulations.
Regulations and Environmental Concerns
Manure service providers actively followed environmental regulations in Indiana and in
neighboring states where their business covered. They passed their certification exams in Indiana.
They were aware of when their practices needed to change to meet new regulations. One
Indiana-based manure broker said in the interview that they attended meetings in Indiana and
courses in Ohio State throughout the year whenever their schedule allowed. However, it was also
learned that there were people that were not sure who to contact and how to get their certification
to be manure haulers although they knew that some kind of certification must be obtained.
Some of the major environmental concerns about poultry manure that surfaced during the
interviews of the manure service providers were as follows:
Most crops are more nitrogen-demanding and as poultry manure is richer in phosphorus
compared with other livestock manure, phosphorus can build up over the years and cause
watershed pollution and algae blooms.
There is sometimes outrage from the community over poor farmer practices/application
related to poultry manure odor. To minimize odor nuisance, the manure applicators took
some measures, e.g., apply during the week, not the weekend; not applying in high winds;
inject, not spread + till; recommending planting trees.
Farmers in some areas in the eastern Indiana imported manure from Ohio because there
was very little poultry production in these areas due to restrictive regulations. However,
there was also concerns that manure from Ohio was not regulated and this issue needed to
be addressed.
Various methods and facilities for poultry manure storage were used in Indiana. For
temporary storage or stockpiling, tarp and plastic sheeting, or open storage was usually
used. For permanent or long-term storage, manure sheds with either concrete or earthen
floors were used. Uncovered manure can become emit nonpoint source pollutants. When
manure gets wet, it also decomposing quicker and loses more nutrients than if it was dry.
When it rains, there can also be nutrient runoff and contamination of the environment
unless the runoff is contained.

29
Poultry Manure Application to Crop Fields and Other Uses
Procedures and Methods
The purpose of this part of the project is to obtain information about the current situation,
experiences, obstacles, and future perspectives of poultry manure land-application to replace
inorganic fertilizers.
A survey questionnaire for poultry manure application by crop producers and other users was
developed. It was updated after consulting with extension specialists in the Departments of
Animal Sciences, Agronomy, and Agricultural Economics at Purdue University. The survey was
designed for three types of producers: crop farmers who are non-poultry-producers but use
poultry manure, crop farmers who are non-poultry-producers and do not use poultry manure, and
crop farmers who are also poultry producers. The survey consists of the questions regarding
utilization of fertilizer, crop management, and fertilizer market (Appendix II). To obtain the most
recent data and avoid confusion, the survey were designed to ask questions only related to
manure application in 2012.
The questionnaire was submitted to and reviewed by the Institutional Review Board (IRB). Two
revisions were made following the IRB comments. The survey was approved on March 5, 2013
(IRB Protocol#: 1212013039) and posted on-line. One amendment for distributing survey
requests via extension newsletter was filed to IRB on March 19, 2013. It received IRB approval
on April 16, 2013.
Due to the requirement of confidentiality and protection of respondents‟ identity, the survey
requests were distributed via Purdue University‟s county extension educators who work in
Agriculture and Natural Resources. The county educators distributed the survey via email to crop
producers and other possible poultry manure users. One county also distributed the survey via a
mail-in extension newsletter.
Emails were sent to about 2000 recipients and hard copy questionnaire were handed to >20
extension meeting participants. By the end of July 2013, 161 survey responses were obtained and
validated, in which 105 were completed and 57 were partially completed. One reason for the low
return rate, as explained by someone who had good knowledge about the local situation, was that,
with the new Indiana manure regulations coming out, many people dealing with manure tended
to be cautious and wished to not say anything about it.
Nevertheless, although the survey return rate could be higher, the responses obtained were very
useful to understand the application of poultry manure in Indiana.
Characteristics of Respondents
The producers who responded to the survey indicated to have land located in 53 out of 92 (or 58%
of) Indiana counties. Two respondents also had land in Ohio and three had land in Illinois. The
total land owned by individual respondents covered a wide range from 0.5 to 8760 acres and
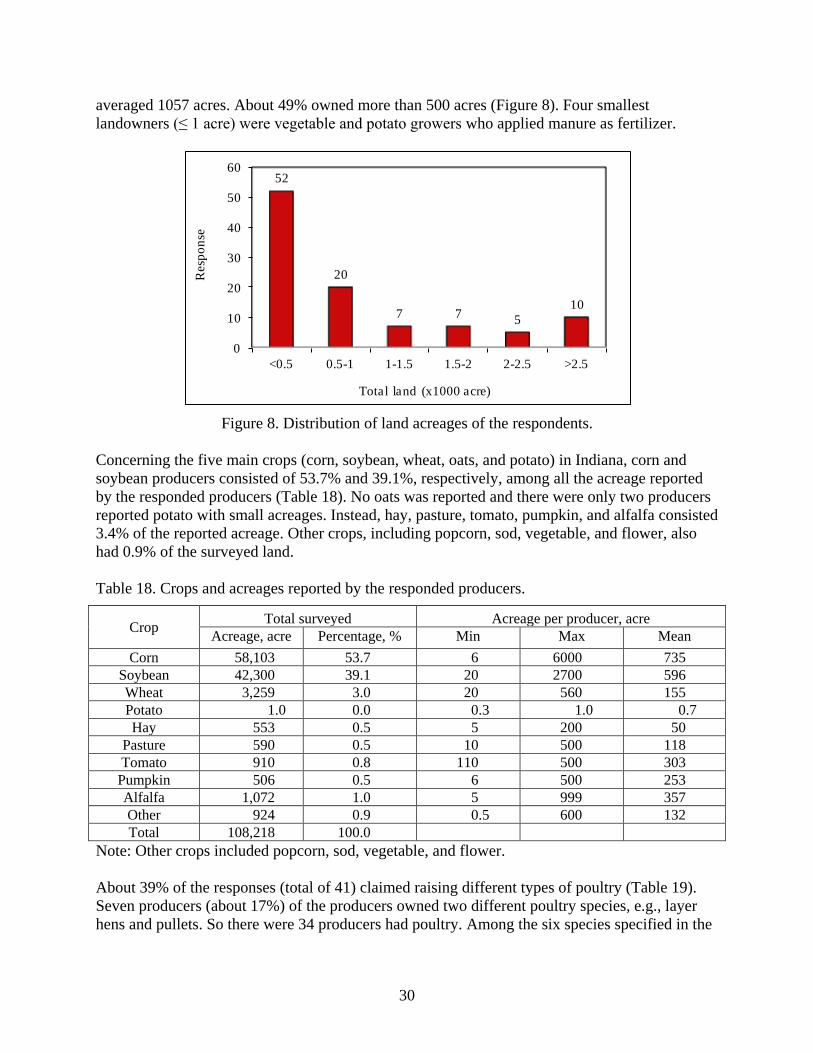
30
averaged 1057 acres. About 49% owned more than 500 acres (Figure 8). Four smallest
landowners (≤ 1 acre) were vegetable and potato growers who applied manure as fertilizer.
Figure 8. Distribution of land acreages of the respondents.
Concerning the five main crops (corn, soybean, wheat, oats, and potato) in Indiana, corn and
soybean producers consisted of 53.7% and 39.1%, respectively, among all the acreage reported
by the responded producers (Table 18). No oats was reported and there were only two producers
reported potato with small acreages. Instead, hay, pasture, tomato, pumpkin, and alfalfa consisted
3.4% of the reported acreage. Other crops, including popcorn, sod, vegetable, and flower, also
had 0.9% of the surveyed land.
Table 18. Crops and acreages reported by the responded producers.
Crop Total surveyed Acreage per producer, acre
Acreage, acre Percentage, % Min Max Mean
Corn 58,103 53.7 6 6000 735
Soybean 42,300 39.1 20 2700 596
Wheat 3,259 3.0 20 560 155
Potato 1.0 0.0 0.3 1.0 0.7
Hay 553 0.5 5 200 50
Pasture 590 0.5 10 500 118
Tomato 910 0.8 110 500 303
Pumpkin 506 0.5 6 500 253
Alfalfa 1,072 1.0 5 999 357
Other 924 0.9 0.5 600 132
Total 108,218 100.0
Note: Other crops included popcorn, sod, vegetable, and flower.
About 39% of the responses (total of 41) claimed raising different types of poultry (Table 19).
Seven producers (about 17%) of the producers owned two different poultry species, e.g., layer
hens and pullets. So there were 34 producers had poultry. Among the six species specified in the
0
10
20
30
40
50
60
<0.5 0.5-1 1-1.5 1.5-2 2-2.5 >2.5
52
20
7 75
10
Resp
on
se
Total land (x1000 acre)

31
survey questionnaire and a choice of “other poultry”, no one selected “turkey breeders”. One
respondent filled data of “peacocks” in “other poultry”.
Table 19. Poultry production from the respondents.
Poultry Response Number of poultry, head
Total Min/producer Max/producer Mean/producer
Layer 15 4,375,802 1 2,950,000 291,720
Broiler 1 350,000 350,000 350,000 350,000
Pullet 6 2,697,050 50 1,000,000 449,508
Turkey 8 425,002 2 120,000 53,125
Turkey breeder 0 NA NA NA NA
Duck 10 281,855 5 69,800 28,186
Peacock 1 3 NA 3 NA
Total 41 8,129,712
Note: A total of 34 producers made 41 responses to different poultry species. NA = not available.
The size of the poultry farms varied from one head to several million head. The largest poultry
producers participated in the survey owned 2.95M layers. The smallest reported numbers
included 1 layer, 2 turkeys, 3 peacocks, and 5 ducks. About 47% of the surveyed farms had more
than 30,000 fowl and were either CFO or CAFO (Figure 9). About 36% of the poultry producers
claimed to have excess manure for sale, which ranged from 50% to 100% of their total manure
production. The diversified poultry farms showed that the survey samples covered a wide range
of representatives from the industry.
Figure 9. Distribution of surveyed poultry farm sizes.
16
1 1
3
0
13
0
5
10
15
20
<10 10-20 20-30 30-40 40-50 >50
Resp
on
se
Total poultry (x1000 head)
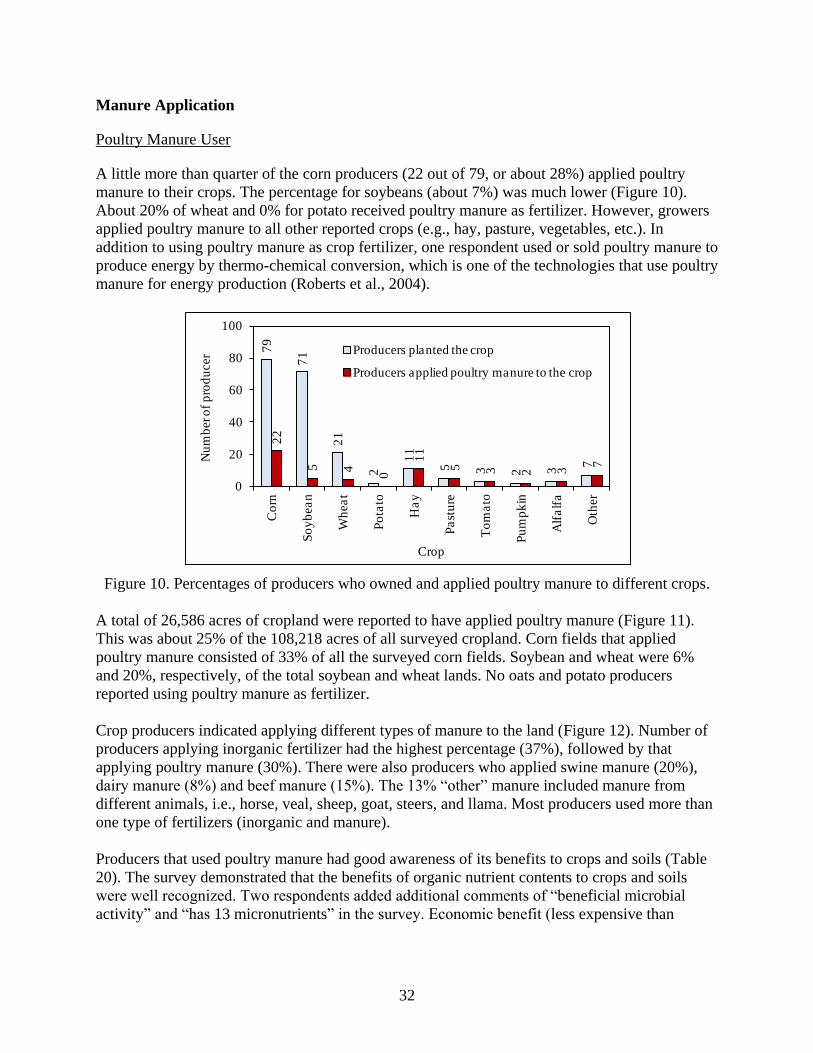
32
Manure Application
Poultry Manure User
A little more than quarter of the corn producers (22 out of 79, or about 28%) applied poultry
manure to their crops. The percentage for soybeans (about 7%) was much lower (Figure 10).
About 20% of wheat and 0% for potato received poultry manure as fertilizer. However, growers
applied poultry manure to all other reported crops (e.g., hay, pasture, vegetables, etc.). In
addition to using poultry manure as crop fertilizer, one respondent used or sold poultry manure to
produce energy by thermo-chemical conversion, which is one of the technologies that use poultry
manure for energy production (Roberts et al., 2004).
Figure 10. Percentages of producers who owned and applied poultry manure to different crops.
A total of 26,586 acres of cropland were reported to have applied poultry manure (Figure 11).
This was about 25% of the 108,218 acres of all surveyed cropland. Corn fields that applied
poultry manure consisted of 33% of all the surveyed corn fields. Soybean and wheat were 6%
and 20%, respectively, of the total soybean and wheat lands. No oats and potato producers
reported using poultry manure as fertilizer.
Crop producers indicated applying different types of manure to the land (Figure 12). Number of
producers applying inorganic fertilizer had the highest percentage (37%), followed by that
applying poultry manure (30%). There were also producers who applied swine manure (20%),
dairy manure (8%) and beef manure (15%). The 13% “other” manure included manure from
different animals, i.e., horse, veal, sheep, goat, steers, and llama. Most producers used more than
one type of fertilizers (inorganic and manure).
Producers that used poultry manure had good awareness of its benefits to crops and soils (Table
20). The survey demonstrated that the benefits of organic nutrient contents to crops and soils
were well recognized. Two respondents added additional comments of “beneficial microbial
activity” and “has 13 micronutrients” in the survey. Economic benefit (less expensive than
79
71
21
2
11
5 3 2 3
7
22
5 4
0
11
5 3 2 3
7
0
20
40
60
80
100
Co
rn
So
yb
ea
n
Wh
ea
t
Po
tato
Ha
y
Pa
stu
re
To
ma
to
Pu
mp
kin
Alf
alf
a
Oth
er
Nu
mb
er o
f p
rod
ucer
Crop
Producers planted the crop
Producers applied poultry manure to the crop
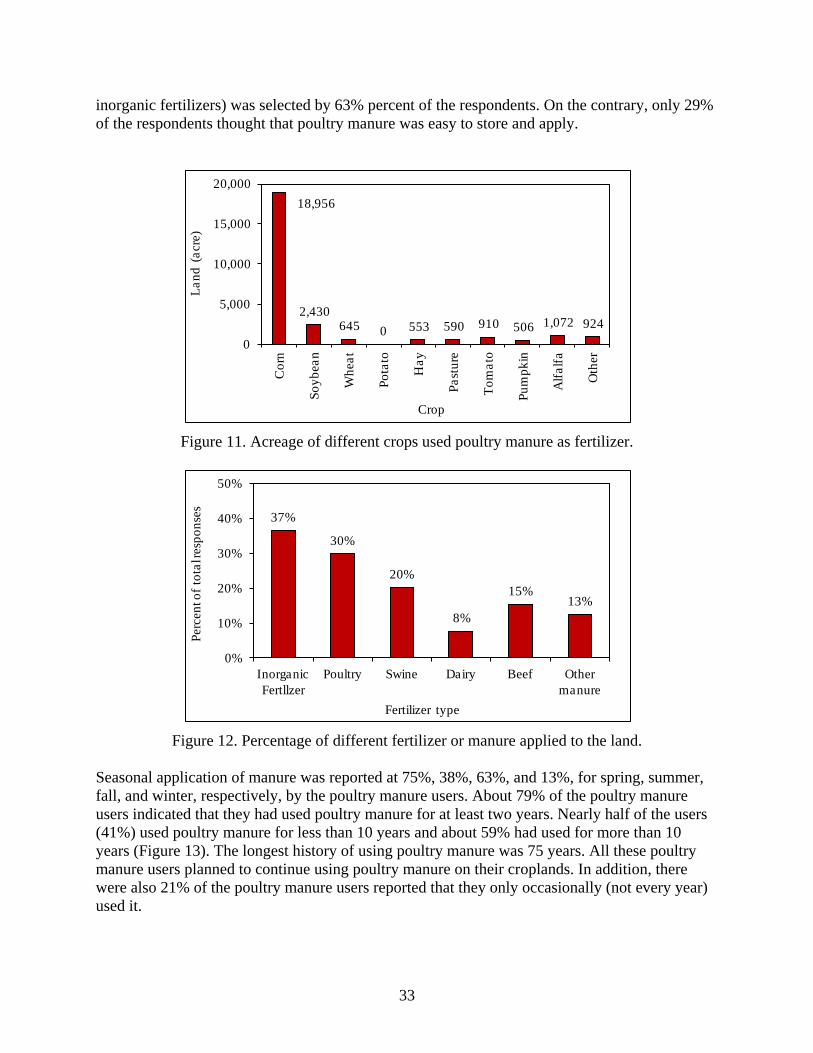
33
inorganic fertilizers) was selected by 63% percent of the respondents. On the contrary, only 29%
of the respondents thought that poultry manure was easy to store and apply.
Figure 11. Acreage of different crops used poultry manure as fertilizer.
Figure 12. Percentage of different fertilizer or manure applied to the land.
Seasonal application of manure was reported at 75%, 38%, 63%, and 13%, for spring, summer,
fall, and winter, respectively, by the poultry manure users. About 79% of the poultry manure
users indicated that they had used poultry manure for at least two years. Nearly half of the users
(41%) used poultry manure for less than 10 years and about 59% had used for more than 10
years (Figure 13). The longest history of using poultry manure was 75 years. All these poultry
manure users planned to continue using poultry manure on their croplands. In addition, there
were also 21% of the poultry manure users reported that they only occasionally (not every year)
used it.
18,956
2,430 645 0 553 590 910 506 1,072 924
0
5,000
10,000
15,000
20,000
Co
rn
So
yb
ea
n
Wh
ea
t
Po
tato
Ha
y
Pa
stu
re
To
ma
to
Pu
mp
kin
Alf
alf
a
Oth
er
La
nd
(a
cre
)
Crop
37%
30%
20%
8%
15%13%
0%
10%
20%
30%
40%
50%
Inorganic
Fertllzer
Poultry Swine Dairy Beef Other
manure
Perc
en
t o
f to
tal r
esp
on
ses
Fertilizer type
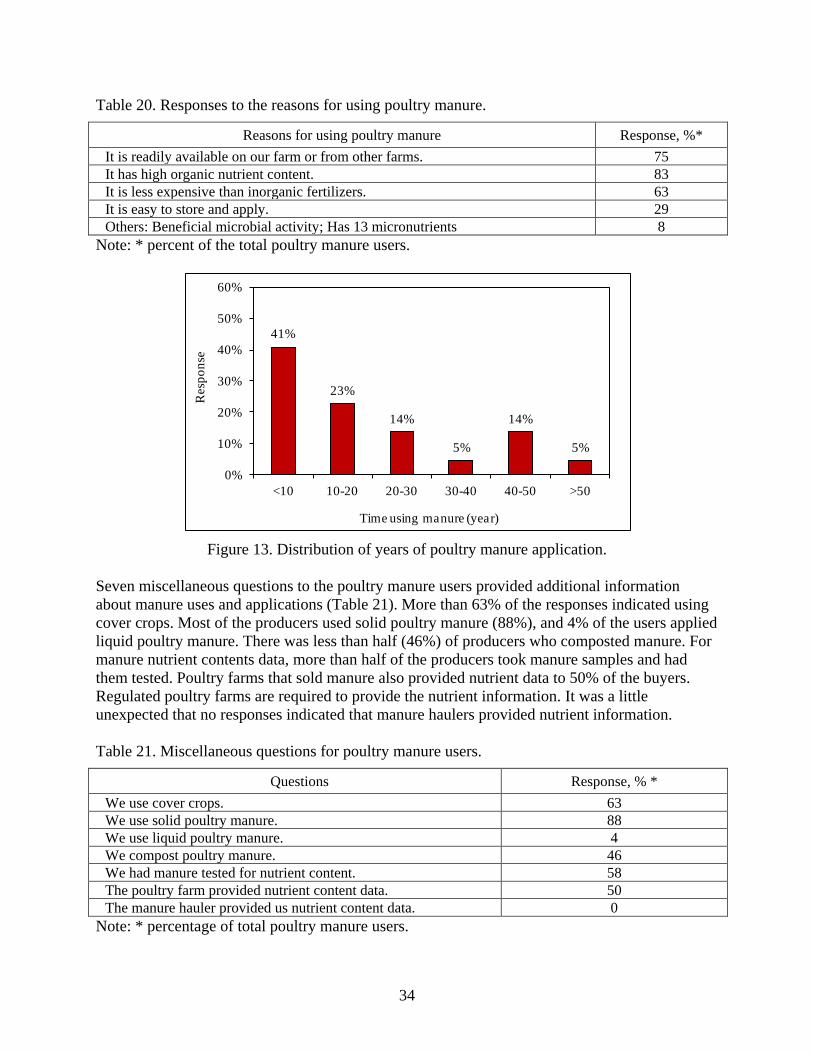
34
Table 20. Responses to the reasons for using poultry manure.
Reasons for using poultry manure Response, %*
It is readily available on our farm or from other farms. 75
It has high organic nutrient content. 83
It is less expensive than inorganic fertilizers. 63
It is easy to store and apply. 29
Others: Beneficial microbial activity; Has 13 micronutrients 8
Note: * percent of the total poultry manure users.
Figure 13. Distribution of years of poultry manure application.
Seven miscellaneous questions to the poultry manure users provided additional information
about manure uses and applications (Table 21). More than 63% of the responses indicated using
cover crops. Most of the producers used solid poultry manure (88%), and 4% of the users applied
liquid poultry manure. There was less than half (46%) of producers who composted manure. For
manure nutrient contents data, more than half of the producers took manure samples and had
them tested. Poultry farms that sold manure also provided nutrient data to 50% of the buyers.
Regulated poultry farms are required to provide the nutrient information. It was a little
unexpected that no responses indicated that manure haulers provided nutrient information.
Table 21. Miscellaneous questions for poultry manure users.
Questions Response, % *
We use cover crops. 63
We use solid poultry manure. 88
We use liquid poultry manure. 4
We compost poultry manure. 46
We had manure tested for nutrient content. 58
The poultry farm provided nutrient content data. 50
The manure hauler provided us nutrient content data. 0
Note: * percentage of total poultry manure users.
41%
23%
14%
5%
14%
5%
0%
10%
20%
30%
40%
50%
60%
<10 10-20 20-30 30-40 40-50 >50
Resp
on
se
Time using manure (year)
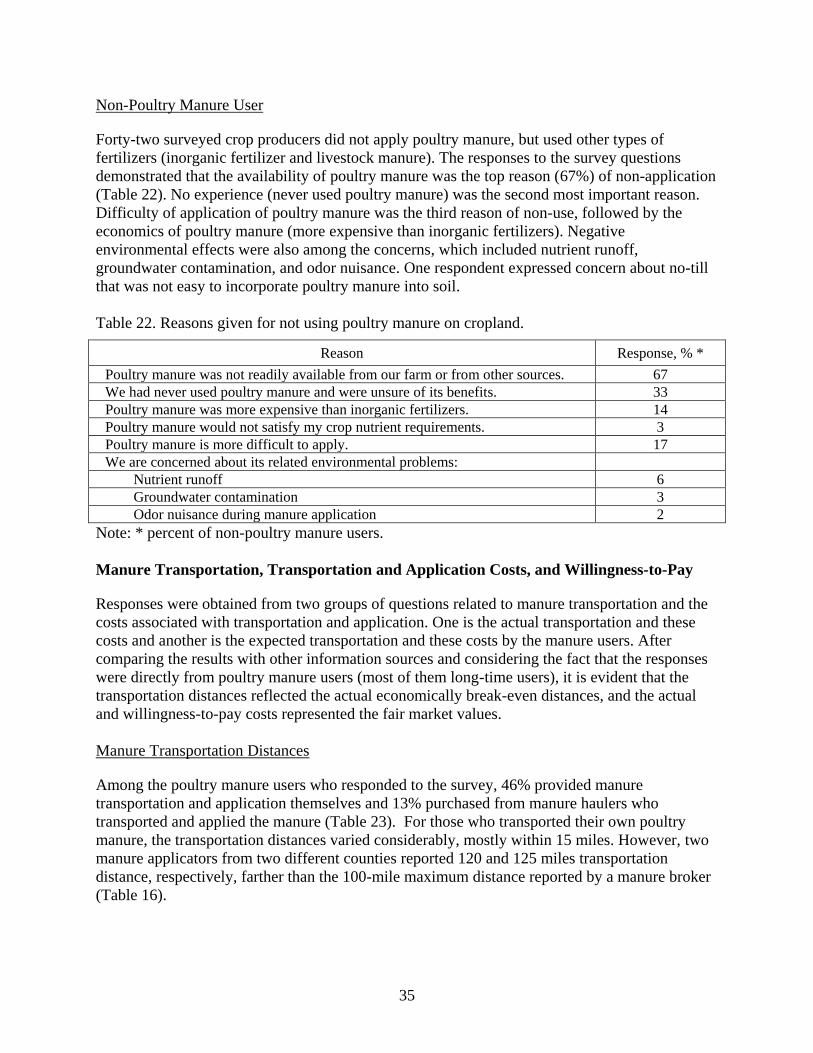
35
Non-Poultry Manure User
Forty-two surveyed crop producers did not apply poultry manure, but used other types of
fertilizers (inorganic fertilizer and livestock manure). The responses to the survey questions
demonstrated that the availability of poultry manure was the top reason (67%) of non-application
(Table 22). No experience (never used poultry manure) was the second most important reason.
Difficulty of application of poultry manure was the third reason of non-use, followed by the
economics of poultry manure (more expensive than inorganic fertilizers). Negative
environmental effects were also among the concerns, which included nutrient runoff,
groundwater contamination, and odor nuisance. One respondent expressed concern about no-till
that was not easy to incorporate poultry manure into soil.
Table 22. Reasons given for not using poultry manure on cropland.
Reason Response, % *
Poultry manure was not readily available from our farm or from other sources. 67
We had never used poultry manure and were unsure of its benefits. 33
Poultry manure was more expensive than inorganic fertilizers. 14
Poultry manure would not satisfy my crop nutrient requirements. 3
Poultry manure is more difficult to apply. 17
We are concerned about its related environmental problems:
Nutrient runoff 6
Groundwater contamination 3
Odor nuisance during manure application 2
Note: * percent of non-poultry manure users.
Manure Transportation, Transportation and Application Costs, and Willingness-to-Pay
Responses were obtained from two groups of questions related to manure transportation and the
costs associated with transportation and application. One is the actual transportation and these
costs and another is the expected transportation and these costs by the manure users. After
comparing the results with other information sources and considering the fact that the responses
were directly from poultry manure users (most of them long-time users), it is evident that the
transportation distances reflected the actual economically break-even distances, and the actual
and willingness-to-pay costs represented the fair market values.
Manure Transportation Distances
Among the poultry manure users who responded to the survey, 46% provided manure
transportation and application themselves and 13% purchased from manure haulers who
transported and applied the manure (Table 23). For those who transported their own poultry
manure, the transportation distances varied considerably, mostly within 15 miles. However, two
manure applicators from two different counties reported 120 and 125 miles transportation
distance, respectively, farther than the 100-mile maximum distance reported by a manure broker
(Table 16).
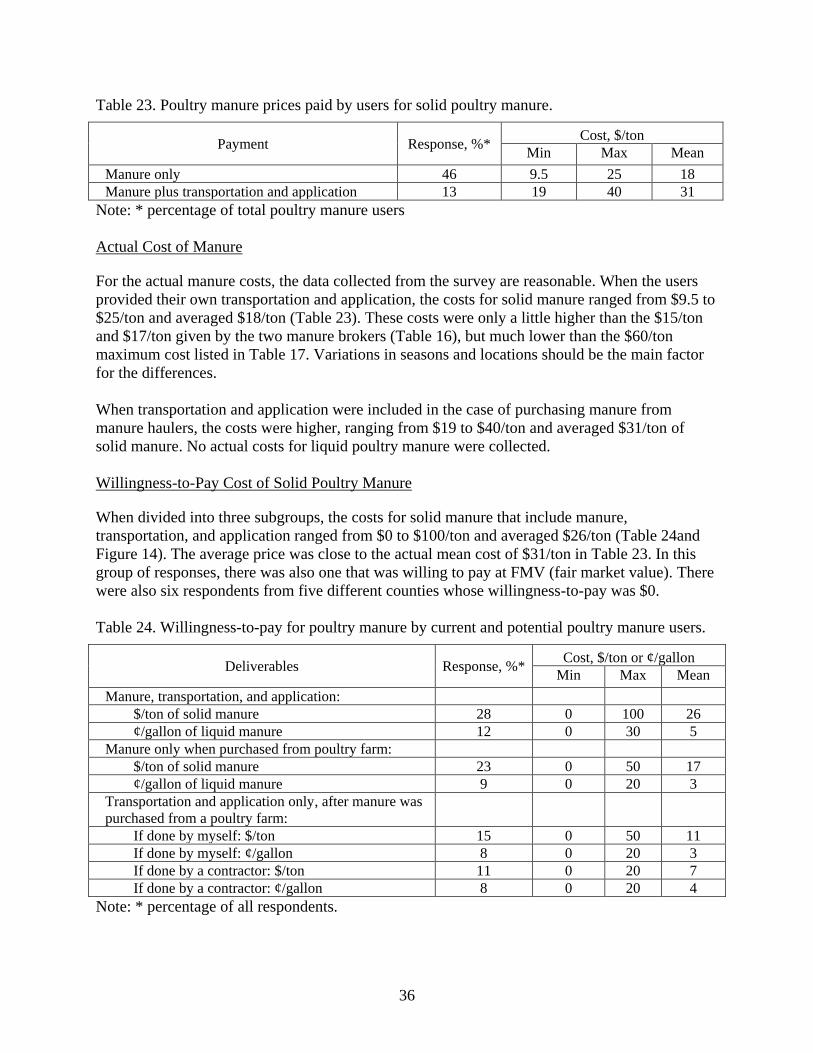
36
Table 23. Poultry manure prices paid by users for solid poultry manure.
Payment Response, %* Cost, $/ton
Min Max Mean
Manure only 46 9.5 25 18
Manure plus transportation and application 13 19 40 31
Note: * percentage of total poultry manure users
Actual Cost of Manure
For the actual manure costs, the data collected from the survey are reasonable. When the users
provided their own transportation and application, the costs for solid manure ranged from $9.5 to
$25/ton and averaged $18/ton (Table 23). These costs were only a little higher than the $15/ton
and $17/ton given by the two manure brokers (Table 16), but much lower than the $60/ton
maximum cost listed in Table 17. Variations in seasons and locations should be the main factor
for the differences.
When transportation and application were included in the case of purchasing manure from
manure haulers, the costs were higher, ranging from $19 to $40/ton and averaged $31/ton of
solid manure. No actual costs for liquid poultry manure were collected.
Willingness-to-Pay Cost of Solid Poultry Manure
When divided into three subgroups, the costs for solid manure that include manure,
transportation, and application ranged from $0 to $100/ton and averaged $26/ton (Table 24and
Figure 14). The average price was close to the actual mean cost of $31/ton in Table 23. In this
group of responses, there was also one that was willing to pay at FMV (fair market value). There
were also six respondents from five different counties whose willingness-to-pay was $0.
Table 24. Willingness-to-pay for poultry manure by current and potential poultry manure users.
Deliverables Response, %* Cost, $/ton or ¢/gallon
Min Max Mean
Manure, transportation, and application:
$/ton of solid manure 28 0 100 26
¢/gallon of liquid manure 12 0 30 5
Manure only when purchased from poultry farm:
$/ton of solid manure 23 0 50 17
¢/gallon of liquid manure 9 0 20 3
Transportation and application only, after manure was
purchased from a poultry farm:
If done by myself: $/ton 15 0 50 11
If done by myself: ¢/gallon 8 0 20 3
If done by a contractor: $/ton 11 0 20 7
If done by a contractor: ¢/gallon 8 0 20 4
Note: * percentage of all respondents.
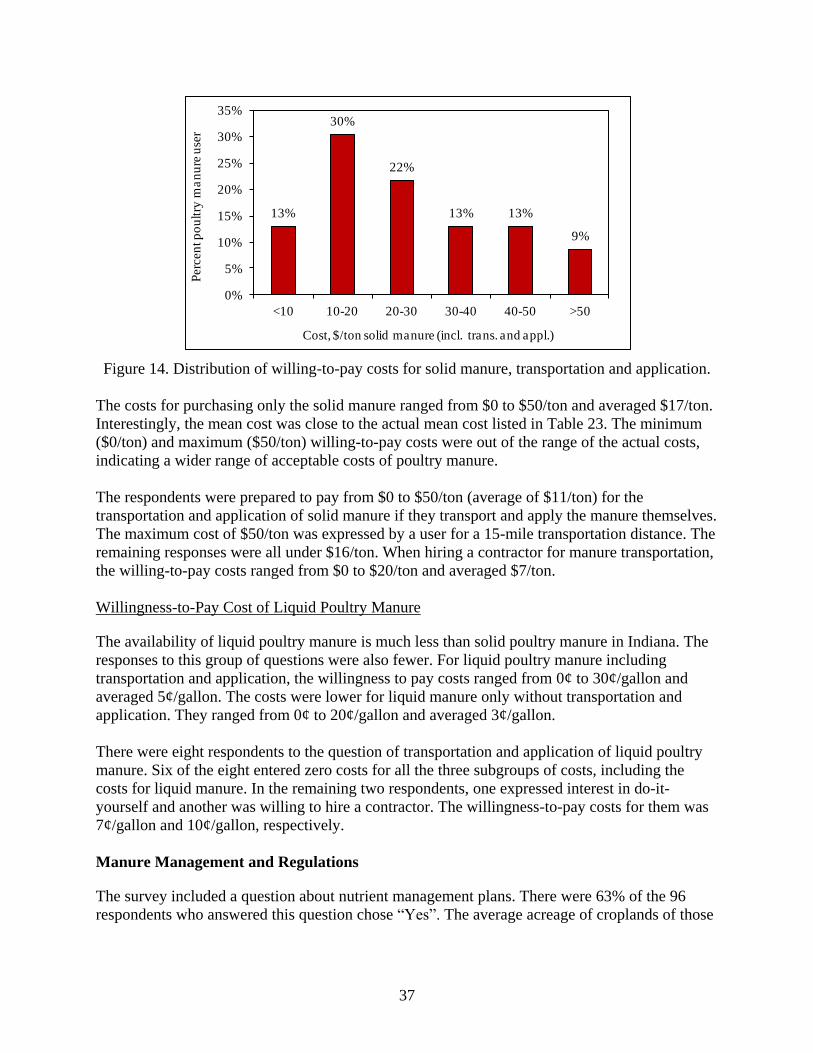
37
Figure 14. Distribution of willing-to-pay costs for solid manure, transportation and application.
The costs for purchasing only the solid manure ranged from $0 to $50/ton and averaged $17/ton.
Interestingly, the mean cost was close to the actual mean cost listed in Table 23. The minimum
($0/ton) and maximum ($50/ton) willing-to-pay costs were out of the range of the actual costs,
indicating a wider range of acceptable costs of poultry manure.
The respondents were prepared to pay from $0 to $50/ton (average of $11/ton) for the
transportation and application of solid manure if they transport and apply the manure themselves.
The maximum cost of $50/ton was expressed by a user for a 15-mile transportation distance. The
remaining responses were all under $16/ton. When hiring a contractor for manure transportation,
the willing-to-pay costs ranged from $0 to $20/ton and averaged $7/ton.
Willingness-to-Pay Cost of Liquid Poultry Manure
The availability of liquid poultry manure is much less than solid poultry manure in Indiana. The
responses to this group of questions were also fewer. For liquid poultry manure including
transportation and application, the willingness to pay costs ranged from 0¢ to 30¢/gallon and
averaged 5¢/gallon. The costs were lower for liquid manure only without transportation and
application. They ranged from 0¢ to 20¢/gallon and averaged 3¢/gallon.
There were eight respondents to the question of transportation and application of liquid poultry
manure. Six of the eight entered zero costs for all the three subgroups of costs, including the
costs for liquid manure. In the remaining two respondents, one expressed interest in do-it-
yourself and another was willing to hire a contractor. The willingness-to-pay costs for them was
7¢/gallon and 10¢/gallon, respectively.
Manure Management and Regulations
The survey included a question about nutrient management plans. There were 63% of the 96
respondents who answered this question chose “Yes”. The average acreage of croplands of those
13%
30%
22%
13% 13%
9%
0%
5%
10%
15%
20%
25%
30%
35%
<10 10-20 20-30 30-40 40-50 >50
Perc
en
t p
ou
ltry
ma
nu
re u
ser
Cost, $/ton solid manure (incl. trans. and appl.)
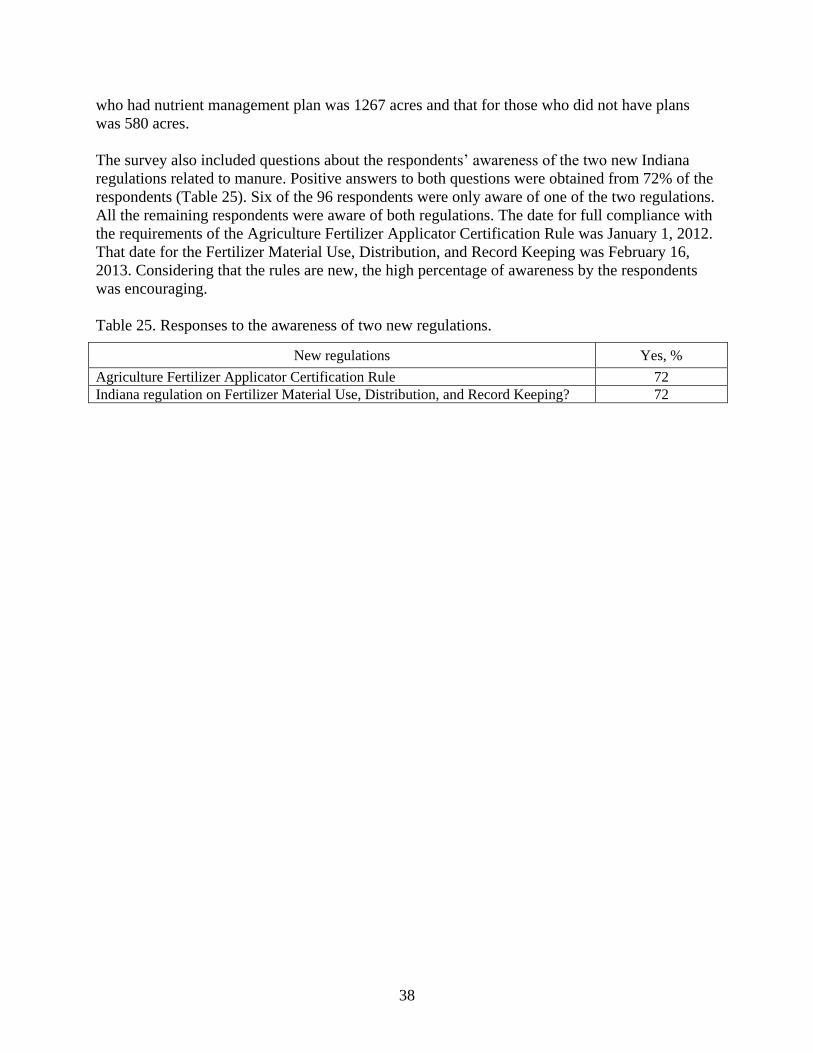
38
who had nutrient management plan was 1267 acres and that for those who did not have plans
was 580 acres.
The survey also included questions about the respondents‟ awareness of the two new Indiana
regulations related to manure. Positive answers to both questions were obtained from 72% of the
respondents (Table 25). Six of the 96 respondents were only aware of one of the two regulations.
All the remaining respondents were aware of both regulations. The date for full compliance with
the requirements of the Agriculture Fertilizer Applicator Certification Rule was January 1, 2012.
That date for the Fertilizer Material Use, Distribution, and Record Keeping was February 16,
2013. Considering that the rules are new, the high percentage of awareness by the respondents
was encouraging.
Table 25. Responses to the awareness of two new regulations.
New regulations Yes, %
Agriculture Fertilizer Applicator Certification Rule 72
Indiana regulation on Fertilizer Material Use, Distribution, and Record Keeping? 72

39
Recommendations
Based on the findings from this project, the authors recommend the following future work for
more economical utilization of poultry manure and sustainable development of Indiana
agriculture:
Develop and distribute educational materials for poultry manure applications. Crop
producers and other poultry manure users are interested in learning various aspects
associated with manure. For example, one county educator received a question from a
farmer about how to better apply poultry manure when side-dressing wheat. Other topics
of interest include poultry manure storage, odor management, new environmental
regulations, manure service providers, and available manure resources.
Update the Indiana poultry manure production and availability in 2014. The agricultural
census data are essential to calculate the overall poultry manure production in Indiana.
The latest census data used in this survey was in 2007. Because of the rapid development
of Indiana poultry industry, it will help to keep the Indiana poultry manure database
updated if new analyses can be conducted after the 2012 USDA Agricultural Census data
are published in 2014.
Study value-added uses of poultry manure. Poultry manure can be used in other ways
besides fertilizer. Indiana poultry manure was reportedly used or sold (probably to a
neighboring state) to produce energy via thermo-chemical conversion. This use of poultry
manure has opened doors for alternative value-added applications. Studies on the related
issues (such as economics, technical feasibilities, environmental impacts, and animal
welfare) of poultry manure alternative uses will help to contribute to the sustainable
development of Indiana‟s agriculture and environment.
Survey manure availabilities from other Indiana animal industries, especially swine and
dairy. Compared with poultry, the swine and dairy industries might produce even larger
volumes of manure. They could have considerate impacts on Indiana‟s soybean and corn
production, environmental protection, and renewable energy generation; but these
impacts could also be more localized because it is usually not economical for long-
distance transportation of liquid swine and dairy manure. The geographical distributions
of these livestock farms could be different from poultry farms. Manure produced by
different industries might complement each other to satisfy crop needs in different areas.
Conduct scientific research on more reliable poultry manure and nutrient production rates.
Many significant changes in the way poultry is produced have occurred in the past
decades. New developments in genotypes, feeding practices, and diet modification as
influenced by environmental considerations (reduced nutrient excretion) have also
occurred (Fulhage, 2003). Surprisingly, there have been only a few experimental studies
on manure nutrient production from poultry in the world. For some poultry species, e.g.,
ducks, no such studies have been found in the literature. Moreover, most of the existing
manure and nutrient production values were obtained prior to the recent changes in

40
production practices. Therefore, there is an urgent need to develop new methods to
reliably predict current poultry manure and nutrient production.
Acknowledgements
Assistance to this project by Mr. Leonard Meador, Mr. Daniel Kaelin, Mr. Jeffrey Lai, Mr.
Zhong Qiao, Mr. Igor Lopes, and Mr. Chaowei Liu are acknowledged. Support from Purdue
University extension specialists and educators, and the Indiana State Poultry Association,
Indiana Department of Environmental Management, and Office of Indiana State Chemist are
greatly appreciated. Special thanks go to Dr. Todd Applegate, Mr. Paul Brennan, Mr. Robert
Kelly, Mr. Brad Kohlhagen, Dr. Robert Waltz, Mr. Matthew Pearson, Dr. Holy Wang, and Dr.
Brad Joern.
41
References
Adeli, A., K.R. Sistani, D.E. Rowe, and H. Tewolde. 2005. Effects of broiler litter on
soybean production and soil nitrogen and phosphorus concentrations. Agronomy Journal
97(1):314-321.
Anonymous. 2012. Soy Stats 2012. American Soybean Association,
http://www.soystats.com/2011/Default-frames.htm. Accessed May 25, 2013.
Applegate, T.J. 2011. Indiana poultry feed consumption. Personal communication. May 16.
Applegate, T.J. 2013. Poultry Manure Survey report for review. Personal communication.
June 25.
ASABE. 2005. ASAE D384.2 MAR2005, Manure Production and Characteristics. In:
ASABE Standards 2006. pp. 708–727. St. Joseph, MI: ASABE.
ASABE. 2010. ASAE D384.2 MAR2005 (R2010) Manure Production and Characteristics.
In: ASABE Standards 2010. pp. 1–20. St. Joseph, MI: ASABE.
ASAE. 1997. ASAE EP384.1 DEC93: Manure production and characteristics. In: ASAE
Standards 1997. pp. 649–651. St. Joseph, MI: ASAE.
Barker, J.C., J.P. Zublena, and F.R. Walls. 2001. Animal and Poultry Manure Production
& Caracterization. North Carolina State University, Raleigh, NC.
Bell, D. 1990. Managing your poultry waste problems. In: Poultry Fact Sheet. University
of California Cooperative Extension, Riverside, CA. PFS No. 10. 2 p.
Collins, A.R. and Y. Budumuru. 2005. Poultry litter use and transport survey in Hardy and
Pendleton counties: A summary report. Agricultural and Resource Economics, West Virginia
University. August. 10 p.
Fulhage, C.D. 2003. Proposed revision of ASAE D384.1 for representative values of “as-
excreted” manure production. In Proceedings of the Ninth International Animal, Agricultural
and Food Processing Wastes. Research Triangle Park, North Carolina, ed. R.T. Burns. p. 257–
262.
Henuk, Y.L. and J.G. Dingle. 2003. Poultry manure: source of fertilizer, fuel and feed.
Worlds Poultry Science Journal 59(3):350–360.
IDEM. 2012. Guidance Manual for Indiana‟s Confined Feeding Program. In: Guidance
Document. Indiana Department of Environmental Management, Indianapolis. June 15.
IFO. 2012. Indiana agricultural statistics 2010–2011. USDA, NASS, Indiana Field Office,
West Lafayette, Indiana. 140 p.
Kellogg, R.L., C.H. Lander, D.C. Moffitt, and N. Gollehon. 2000. Manure Nutrients
Relative to the Capacity of Cropland and Pastureland to Assimilate Nutrients: Spatial and
Temporal Trends for the United States. United States Department of Agriculture, Natural
Resources Conservation Service, Economic Research Service, Washington, DC.
Lorimor, J.C. and H. Xin. 1999. Manure production and nutrient concentrations from high-
rise layer houses. Applied Engineering in Agriculture 15(4):337–340.
Mayen, C. and K.T. McNamara. 2007. The Economic Impact of the Indiana Livestock
Industries. Purdue University Extension, West Lafayette, IN. ID-354.
Morrison, L. 2009. Ashes from poultry manure proving to be a good source of fertilizer for
corn and soybean farmers. Corn and Soybean Digest, http://cornandsoybeandigest.com/inputs/
fertilizer/1115-corn-soybean-fertilizer/. Accessed Feb. 9, 2010.
42
Norwood, F.B., R.L. Luter, and R.E. Massey. 2005. Asymmetric willingness-to-pay
distributions for livestock manure. Journal of Agricultural and Resource Economics 30(3):431–
448.
Pelletier, B.A., J. Pease, and D. Kenyon. 2001. Economic analysis of Virginia poultry litter
transportation. Virginia Agricultural Experiment Station, Virginia Polytechnic Institute and State
University, Blacksburg, Virginia. February. 64 p.
Reardon, J.P., A. Lilley, K. Browne, K. Beard, J. Wimberly, and J. Avens. 2001.
Demonstration of a Small Modular BioPower System Using Poultry Litter. Community Power
Corporation, Littleton, CO. February 25. 53 p.
Roberts, M., R. Jadhav, and F. Lau. 2004. Animal Waste Management – Converting
Broiler Litter into Energy. In World Renewable Energy Congress – VIII. Denver, CO.
Slaton, N.A., R.E. DeLong, J. Shafer, S. Clark, B. Golden, and E. Maschmann. 2008.
Soybean response to poultry litter and inorganic fertilizer. In: Wayne E. Sabbe Arkansas Soil
Fertility Studies ed. N.A. Slaton. Division of Agriculture, Arkansas Agricultural Experiment
Station, Fayetteville, AR. 57–59 p.
Sutton, A.L., D.D. Jones, B.C. Joern, and D.M. Huber. 1994. Animal manure as a plant
nutrient resource. Purdue University Cooperative Extension Service, West Lafayette, IN. ID-101.
May. Reviewed September 1999.
Turn, S.Q., V. Keffer, and M. Staackmann. 2002. Biomass and bioenergy resource
assessment, State of Hawaii. Hawaii Natural Energy Institute, School of Ocean and Earth
Sciences and Technology, University of Hawaii, Honolulu. 44 p.
USDA. 2009. 2007 Census of Agriculture - Indiana State and County Data. In: Geographic
Area Series Part 14. December. 733 p.
USDA. 2010. Indiana Agricultural Statistics - 2008–2009: Poultry and other livestock.
USDA, NASS, Indiana Field Office. 69–72 p.
Yushok, W. and F.E. Bear. 1943. Poultry manure – its preservation, deodorization and
disinfection. In: New Jersey Agricultural Experiment Station Bulletin No. 707. New Jersey
Agricultural Experiment Station, Rutgers University, New Brunswick, New Jersey. September.
11 p.

43
Appendix A: Maps of Indiana
Figure A.1. Numbers of all poultry farms in Indiana in 2007.
Grant
Brown
DaviessKnox
Sullivan
Owen
Greene
Monroe
Martin
Decatur
Franklin
Dearborn
Ripley
Jennings
Jackson
Lawrence
Orange
Jefferson
Ohio
Bartholomew
Washington
Scott
Pike
Gibson
PoseyPerry
Spencer
Warrick
Vanderburgh
Dubois
Switzerland
Crawford
Clark
Floyd
Harrison
LakePorter
La PorteSt Joseph Elkhart
La Grange Steuben
NewtonJasper
De Kalb
WhitleyAllen
Noble
Pulaski
Starke Marshall
Fulton
Kosciusko
Grant
Wabash Huntington
Wells AdamsWhiteCass Miami
Jay
RandolphDelaware
Madison
Tipton
Hamilton
Blackford
Benton Carroll
Tippecanoe
Clinton
Howard
Montgomery Boone
Fountain
Ve
rmil
lion
Parke
Warren
Johnson
Hendricks Marion
Putnam
Vigo
Hancock
Henry
Wayne
Clay
MorganShelby
Rush Fayette Union
4
13
14
19
19
21
22
2525
29
29
30
36
37
38
41
44
44
4546
47
49
52
56
56
60
61
72
87
97
105
129
226
291345
7
13
13
14
14
15
17
18
18
18
18
18
20
20
21
25
27
31
32
33
33
34
35
36
36
36
37
38
38
38
39
40
4041
41
42
42
42
44
44
44
44
45
4647
47
51
51
51
52
53
60
72
78
84
91
147
345
147
60
36
15
> 149
100 – 149
50 – 99
20 – 49
1 – 19

44
Figure A.2. Numbers of egg layer farms in Indiana in 2007.
Grant
Brown
DaviessKnox
Sullivan
Owen
Greene
Monroe
Martin
Decatur
Franklin
Dearborn
Ripley
Jennings
Jackson
Lawrence
Orange
Jefferson
Ohio
Bartholomew
Washington
Scott
Pike
Gibson
PoseyPerry
Spencer
Warrick
Vanderburgh
Dubois
Switzerland
Crawford
Clark
Floyd
Harrison
LakePorter
La PorteSt Joseph Elkhart
La Grange Steuben
NewtonJasper
De Kalb
WhitleyAllen
Noble
Pulaski
Starke Marshall
Fulton
Kosciusko
Grant
Wabash Huntington
Wells AdamsWhiteCass Miami
Jay
RandolphDelaware
Madison
Tipton
Hamilton
Blackford
Benton Carroll
Tippecanoe
Clinton
Howard
Montgomery Boone
Fountain
Ve
rmil
lion
Parke
Warren
Johnson
Hendricks Marion
Putnam
Vigo
Hancock
Henry
Wayne
Clay
MorganShelby
Rush Fayette Union
4
6
12
13
13
15
11
19
11
21
21
26
23
23
32
34
35
34
36
32
39
3738
36
37
37
37
39
37
39
36
36
45
41
41
47
53
52
50
51
54
82
77
177
196
254
1718
40
41
42
63
64
68
75
6
12
14
10
15
16
11
17
22
21
28
29
29
24
28
34
34
36
3533
37
38
29
34
36
2738
43
49
9
13
14
14
25
39
61
106
177
82
41
32
10
> 99
60 – 99
40 – 59
20 – 39
1 – 20

45
Figure A.3. Locations and sizes of Indiana layer CAFOs and CFOs in 2011.

46
Figure A.4. Numbers of pullet farms in Indiana in 2007.
Grant
Brown
DaviessKnox
Sullivan
Owen
Greene
Monroe
Martin
Decatur
Franklin
Dearborn
Ripley
Jennings
Jackson
Lawrence
Orange
Jefferson
Ohio
Bartholomew
Washington
Scott
Pike
Gibson
PoseyPerry
Spencer
Warrick
Vanderburgh
Dubois
Switzerland
Crawford
Clark
Floyd
Harrison
LakePorter
La PorteSt Joseph Elkhart
La Grange Steuben
NewtonJasper
De Kalb
WhitleyAllen
Noble
Pulaski
Starke Marshall
Fulton
Kosciusko
Grant
Wabash Huntington
Wells AdamsWhiteCass Miami
Jay
RandolphDelaware
Madison
Tipton
Hamilton
Blackford
Benton Carroll
Tippecanoe
Clinton
Howard
Montgomery Boone
Fountain
Ve
rmil
lion
Parke
Warren
Johnson
Hendricks Marion
Putnam
Vigo
Hancock
Henry
Wayne
Clay
MorganShelby
Rush Fayette Union
28
21
13
7
3
> 24
15 – 24
10 – 14
5 – 9
1 – 5
1
2
4
3
3
3
1
5
69
5
9
5
5
6
5
6
9
69
9
11
13
3328
1
1
2
22
2
2
2
3
3
3
3
3
3
3
3
4
44
4
4
4
5
5
6
6
6
6
7
7
8
10
10
11
11
13
21
29
3
6
8
7
11
14
1
1 1
1
2 3
3
4
4
4
5
9
13

47
Figure A.5. Locations and sizes of Indiana pullet CAFO and CFO in 2011.
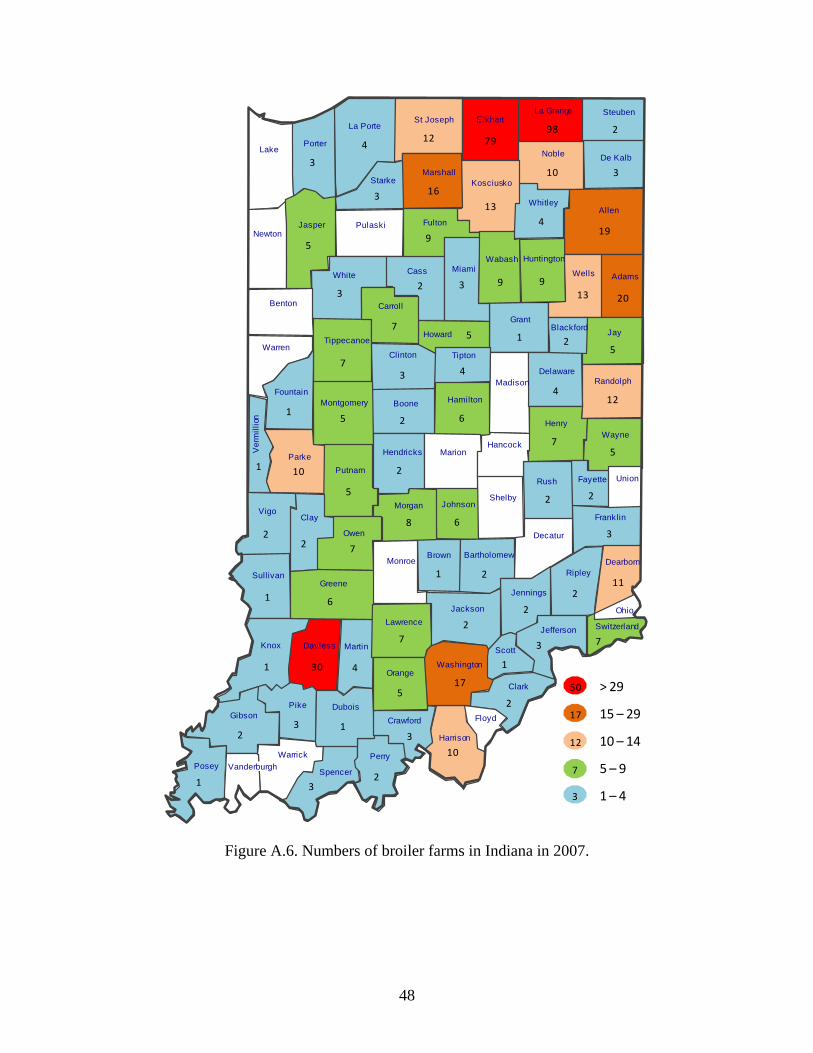
48
Figure A.6. Numbers of broiler farms in Indiana in 2007.
Grant
Brown
DaviessKnox
Sullivan
Owen
Greene
Monroe
Martin
Decatur
Franklin
Dearborn
Ripley
Jennings
Jackson
Lawrence
Orange
Jefferson
Ohio
Bartholomew
Washington
Scott
Pike
Gibson
PoseyPerry
Spencer
Warrick
Vanderburgh
Dubois
Switzerland
Crawford
Clark
Floyd
Harrison
LakePorter
La PorteSt Joseph Elkhart
La Grange Steuben
NewtonJasper
De Kalb
WhitleyAllen
Noble
Pulaski
StarkeMarshall
Fulton
Kosciusko
Grant
Wabash Huntington
Wells AdamsWhiteCass Miami
Jay
RandolphDelaware
Madison
Tipton
Hamilton
Blackford
Benton Carroll
Tippecanoe
Clinton
Howard
Montgomery Boone
Fountain
Ve
rmil
lion
Parke
Warren
Johnson
Hendricks Marion
Putnam
Vigo
Hancock
Henry
Wayne
Clay
MorganShelby
Rush Fayette Union
50
17
12
7
3
> 29
15 – 29
10 – 14
5 – 9
1 – 4
1
1
1
2
2
2
2
2
2
2
3
3
3
3
3
3
3
4
4
4
4
5
5
5
5
5
5
6
6
7
7
7
8
9
99
10
10
12
12
13
13
16
19
20
7998
1
1
1
1
1
1
2
2
2
2
2
2
2
2
2
3
3
3
3
4
5
6
7
7
7
10
11
17
30

49
Figure A.7. Locations and sizes of Indiana broiler CAFO and CFO in 2011.

50
Figure A.8. Numbers of turkey farms in Indiana in 2007.
Grant
Brown
DaviessKnox
Sullivan
Owen
Greene
Monroe
Martin
Decatur
Franklin
Dearborn
Ripley
Jennings
Jackson
Lawrence
Orange
Jefferson
Ohio
Bartholomew
Washington
Scott
Pike
Gibson
PoseyPerry
Spencer
Warrick
Vanderburgh
Dubois
Switzerland
Crawford
Clark
Floyd
Harrison
LakePorter
La PorteSt Joseph Elkhart
La Grange Steuben
NewtonJasper
De Kalb
WhitleyAllen
Noble
Pulaski
StarkeMarshall
Fulton
Kosciusko
Grant
Wabash Huntington
Wells AdamsWhiteCass Miami
Jay
RandolphDelaware
Madison
Tipton
Hamilton
Blackford
Benton Carroll
Tippecanoe
Clinton
Howard
Montgomery Boone
Fountain
Ve
rmil
lion
Parke
Warren
Johnson
Hendricks Marion
Putnam
Vigo
Hancock
Henry
Wayne
Clay
MorganShelby
Rush Fayette Union
40
24
13
7
3
> 29
15 – 29
10 – 14
5 – 9
1 – 4
1
11
1
1
1
1
1
2
2
33
3
3
3
3
3
3
4
4
4
4
4
4
4
4
4
4
5
5
5
6
6
66
7
7
8
8
8
8
9
9
10
11
13
18
1
1
2
2
22
22
2
2
2
2
2
2
3
3
3
4
4
4
55
5
6
6
7
7
8
9
11
13
15
2440
59
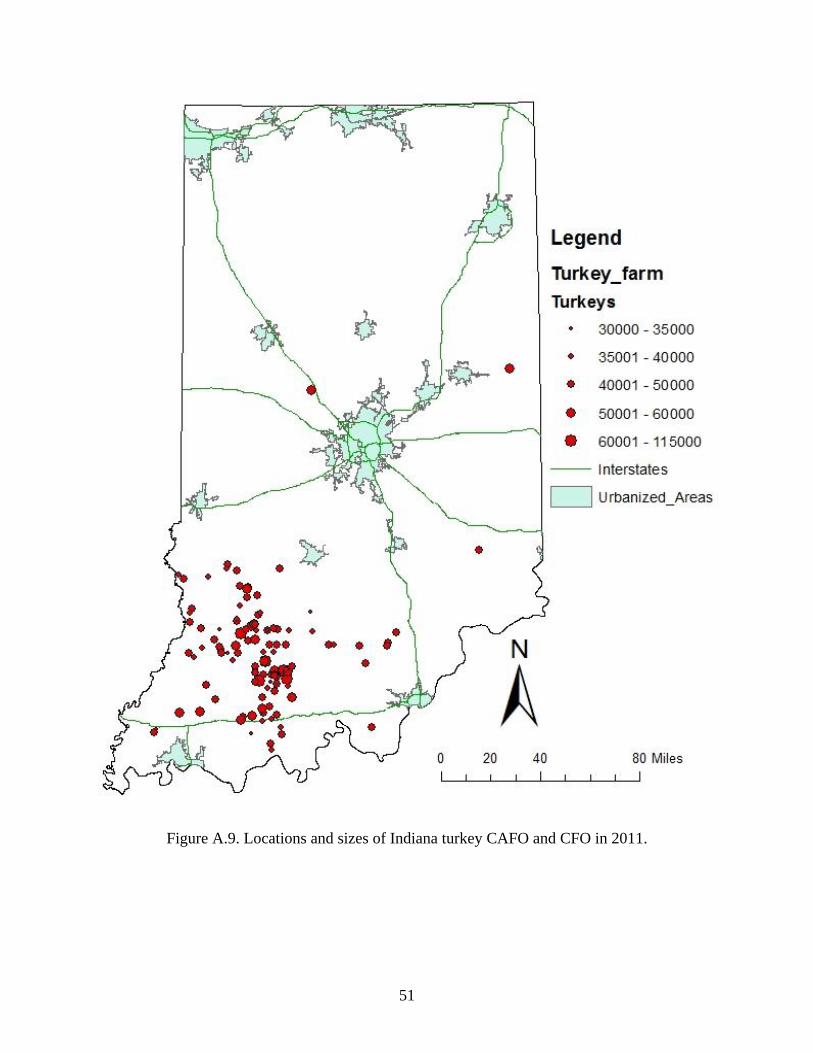
51
Figure A.9. Locations and sizes of Indiana turkey CAFO and CFO in 2011.
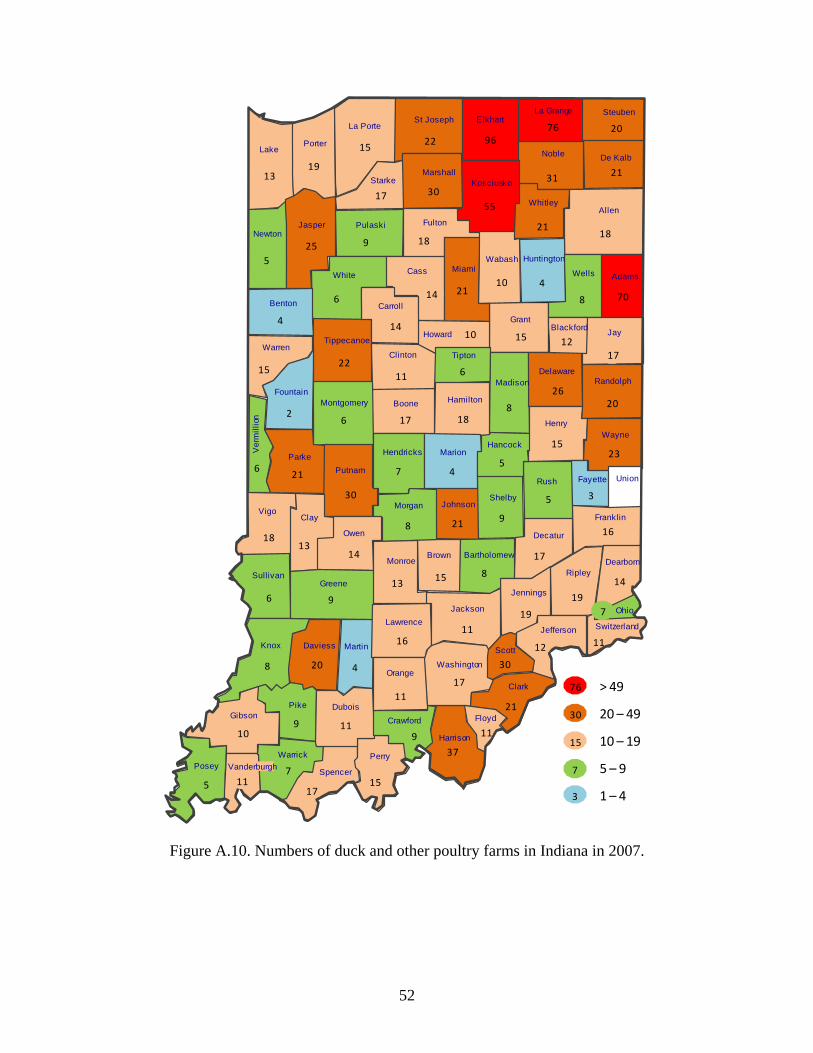
52
Figure A.10. Numbers of duck and other poultry farms in Indiana in 2007.
Grant
Brown
DaviessKnox
Sullivan
Owen
Greene
Monroe
Martin
Decatur
Franklin
Dearborn
Ripley
Jennings
Jackson
Lawrence
Orange
Jefferson
Ohio
Bartholomew
Washington
Scott
Pike
Gibson
PoseyPerry
Spencer
Warrick
Vanderburgh
Dubois
Switzerland
Crawford
Clark
Floyd
Harrison
LakePorter
La PorteSt Joseph Elkhart
La Grange Steuben
NewtonJasper
De Kalb
WhitleyAllen
Noble
Pulaski
StarkeMarshall
Fulton
Kosciusko
Grant
Wabash Huntington
Wells AdamsWhiteCass Miami
Jay
RandolphDelaware
Madison
Tipton
Hamilton
Blackford
Benton Carroll
Tippecanoe
Clinton
Howard
Montgomery Boone
Fountain
Ve
rmil
lion
Parke
Warren
Johnson
Hendricks Marion
Putnam
Vigo
Hancock
Henry
Wayne
Clay
MorganShelby
Rush Fayette Union
76
30
15
7
3
> 49
20 – 49
10 – 19
5 – 9
1 – 4
2
3
4
4
45
5
5
6
6
6
6
7
8
8
8
9
9
10
10
11
12
13
14
14
15
15
15
16
17
17
15
17
1818
18
19
20
20
21
21
21
21
21
22
22
23
25
26
30
30
31
55
70
7696
4
5
6
7
7
8
8
9
9
910
1111
11
11
11
11
12
13
13 14
14
15
15
16
17
17
17
18
19
19
20
21
30
37
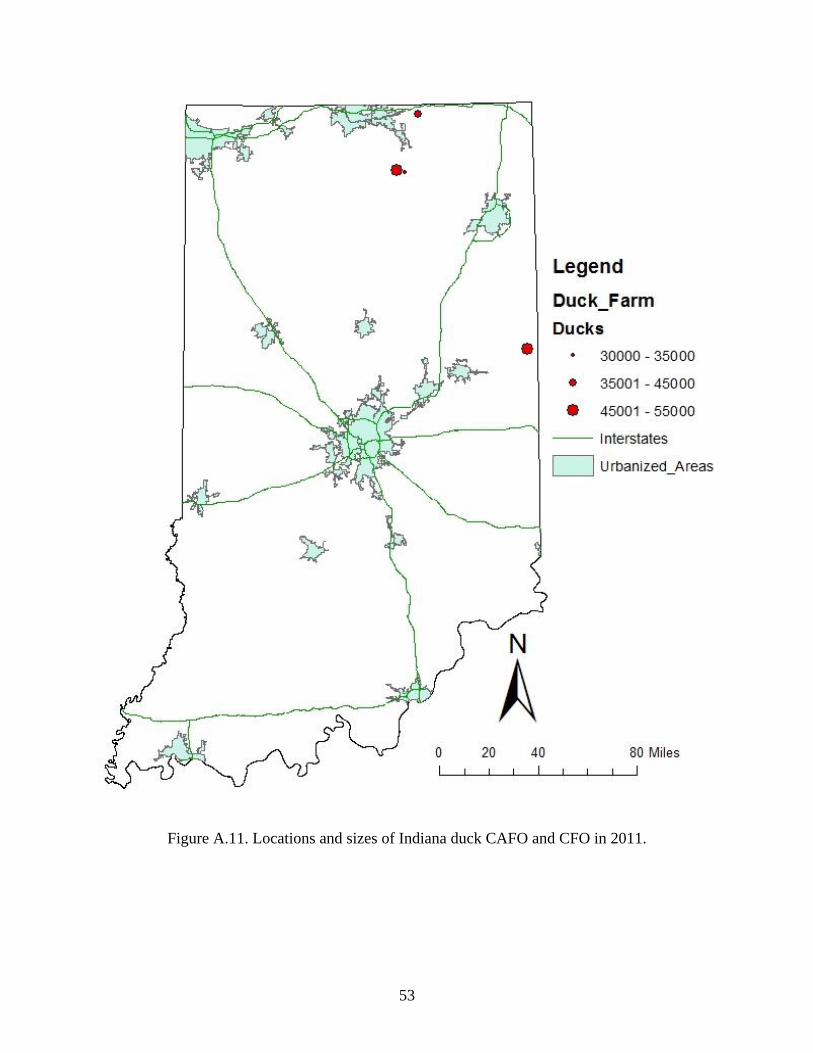
53
Figure A.11. Locations and sizes of Indiana duck CAFO and CFO in 2011.

54
Figure A.12. Indiana total poultry manure production (tons) in 2007.
Grant
Brown
DaviessKnox
Sullivan
Owen
Greene
Monroe
Martin
Decatur
Franklin
Dearborn
Ripley
Jennings
Jackson
Lawrence
Orange
Jefferson
Ohio
Bartholomew
Washington
Scott
Pike
Gibson
PoseyPerry
Spencer
Warrick
Vanderburgh
Dubois
Switzerland
Crawford
Clark
Floyd
Harrison
LakePorter
La PorteSt Joseph Elkhart
La Grange Steuben
NewtonJasper
De Kalb
WhitleyAllen
Noble
Pulaski
StarkeMarshall
Fulton
Kosciusko
Grant
Wabash Huntington
Wells AdamsWhiteCass Miami
Jay
RandolphDelaware
Madison
Tipton
Hamilton
Blackford
Benton Carroll
Tippecanoe
Clinton
Howard
Montgomery Boone
Fountain
Ve
rmil
lion
Parke
Warren
Johnson
Hendricks Marion
Putnam
Vigo
Hancock
Henry
Wayne
Clay
MorganShelby
Rush Fayette Union
91k
50k
15k
5k
53
> 79k
20k– 79k
10k – 19k
1k – 9k
1 – 999
2
6
18
18
21
21
2424
24
25
26
29
30
32
33
38
44
46
51
57
60
63
69
74
78
106
123
503
986
2k
2k
3k
3k
5k
6k
7k
8k
9k
17k
17k
15k
56k
57k
75k
99k
142k
211k
874
22k
32k
38k
80k
91k
11
14
16
17
18
21
22
2627
3031
34
37
40
4141
45
4552 115
3k
7k
7k
8k
9k
10k12k13k
17k
59k
165k
268k
20k
22k
33k
35k85k
97k
99k
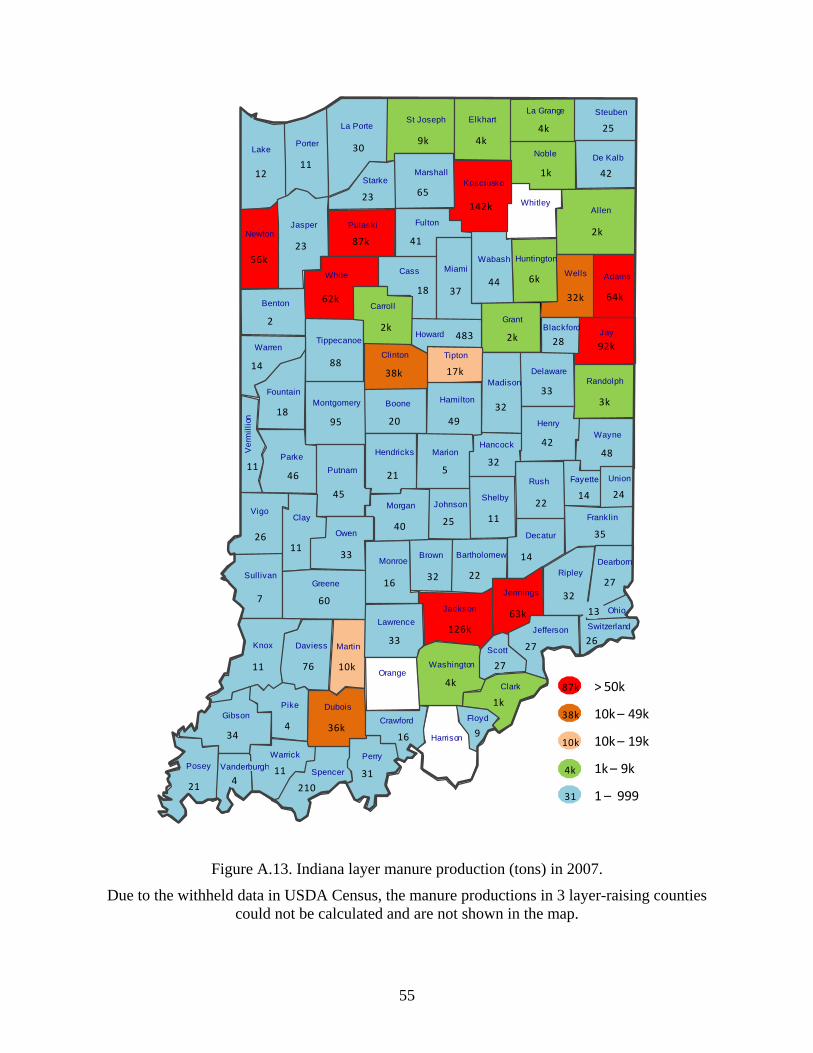
55
Figure A.13. Indiana layer manure production (tons) in 2007.
Due to the withheld data in USDA Census, the manure productions in 3 layer-raising counties
could not be calculated and are not shown in the map.
Grant
Brown
DaviessKnox
Sullivan
Owen
Greene
Monroe
Martin
Decatur
Franklin
Dearborn
Ripley
Jennings
Jackson
Lawrence
Orange
Jefferson
Ohio
Bartholomew
Washington
Scott
Pike
Gibson
PoseyPerry
Spencer
Warrick
Vanderburgh
Dubois
Switzerland
Crawford
Clark
Floyd
Harrison
LakePorter
La PorteSt Joseph Elkhart
La Grange Steuben
NewtonJasper
De Kalb
WhitleyAllen
Noble
Pulaski
StarkeMarshall
Fulton
Kosciusko
Grant
Wabash Huntington
Wells AdamsWhiteCass Miami
Jay
RandolphDelaware
Madison
Tipton
Hamilton
Blackford
Benton Carroll
Tippecanoe
Clinton
Howard
Montgomery Boone
Fountain
Ve
rmil
lion
Parke
Warren
Johnson
Hendricks Marion
Putnam
Vigo
Hancock
Henry
Wayne
Clay
MorganShelby
Rush Fayette Union
87k
38k
10k
4k
31
> 50k
10k– 49k
10k – 19k
1k – 9k
1 – 999
2
4
4
5
7
9
11
11
11
11
11
11
12
13
14
14
14
16
16
18
18
20
21
21
22
22
23
23
24
25
25
26
26
27
27
27
28
30
31
32
32
32
32
33
33
33
34
35
37
40
41
42
42
44
45
46
48
49
60
65
76
88
95
1k
1k
2k
2k
2k
3k
4k
4k4k
10k
17k
32k
36k
38k
56k
62k
63k
64k
87k
92k
126k
142k
6k
9k
483
210

56
Figure A.14. Indiana pullet manure production (tons) in 2007.
Due to the withheld data in USDA Census, the pullet manure productions in 17 pullet-raising
counties are not shown in the map. There were other 10 counties without pullet farms.
Grant
Brown
DaviessKnox
Sullivan
Owen
Greene
Monroe
Martin
Decatur
Franklin
Dearborn
Ripley
Jennings
Jackson
Lawrence
Orange
Jefferson
Ohio
Bartholomew
Washington
Scott
Pike
Gibson
PoseyPerry
Spencer
Warrick
Vanderburgh
Dubois
Switzerland
Crawford
Clark
Floyd
Harrison
LakePorter
La PorteSt Joseph Elkhart
La Grange Steuben
NewtonJasper
De Kalb
WhitleyAllen
Noble
Pulaski
StarkeMarshall
Fulton
Kosciusko
Grant
Wabash Huntington
Wells AdamsWhiteCass Miami
Jay
RandolphDelaware
Madison
Tipton
Hamilton
Blackford
Benton Carroll
Tippecanoe
Clinton
Howard
Montgomery Boone
Fountain
Ve
rmil
lion
Parke
Warren
Johnson
Hendricks Marion
Putnam
Vigo
Hancock
Henry
Wayne
Clay
MorganShelby
Rush Fayette Union
22k
14k
1k
613
55
> 20k
10k– 19k
1k – 9k
100 – 999
1 – 99
1
1
1
1
1
1
1
1
1
1
1
1
1
2
2
2
2
2
2
3
3
3
33
3
4
4
4
4
4
4
44
5
5
5
6
7
9
9
10
11
13
13
22
29
55
94
613
775
1k
6k
7k
12k
12k
14k
15k
19k
20k
21k
22k
34k
39k

57
Figure A.15. Indiana broiler manure production (tons) in 2007.
Due to the withheld data in USDA Census, broiler manure production in 31 broiler-raising
counties are not shown in the map. There were other 16 counties without broiler farms.
Grant
Brown
DaviessKnox
Sullivan
Owen
Greene
Monroe
Martin
Decatur
Franklin
Dearborn
Ripley
Jennings
Jackson
Lawrence
Orange
Jefferson
Ohio
Bartholomew
Washington
Scott
Pike
Gibson
PoseyPerry
Spencer
Warrick
Vanderburgh
Dubois
Switzerland
Crawford
Clark
Floyd
Harrison
LakePorter
La PorteSt Joseph Elkhart
La Grange Steuben
NewtonJasper
De Kalb
WhitleyAllen
Noble
Pulaski
StarkeMarshall
Fulton
Kosciusko
Grant
Wabash Huntington
Wells AdamsWhiteCass Miami
Jay
RandolphDelaware
Madison
Tipton
Hamilton
Blackford
Benton Carroll
Tippecanoe
Clinton
Howard
Montgomery Boone
Fountain
Ve
rmil
lion
Parke
Warren
Johnson
Hendricks Marion
Putnam
Vigo
Hancock
Henry
Wayne
Clay
MorganShelby
Rush Fayette Union
60k
29k
11k
4k
45
> 30k
20k– 29k
10k – 19k
1k – 9k
1 – 999
1
1
1
1
1
2
3
3
4
4
4
4
5
6
6
7
8
8
8
9
10
12
13
15
20
21
2324
25
28
39
45
56
63
4k
5k
6k11k
12k
15k
29k60k
82k
2k

58
Figure A.16. Indiana turkey manure production (tons) in 2007.
Due to the withheld data in USDA Census, turkey manure productions in 27 turkey-raising
counties are not shown in the map. There were other 10 counties without turkey farms.
Grant
Brown
DaviessKnox
Sullivan
Owen
Greene
Monroe
Martin
Decatur
Franklin
Dearborn
Ripley
Jennings
Jackson
Lawrence
Orange
Jefferson
Ohio
Bartholomew
Washington
Scott
Pike
Gibson
PoseyPerry
Spencer
Warrick
Vanderburgh
Dubois
Switzerland
Crawford
Clark
Floyd
Harrison
LakePorter
La PorteSt Joseph Elkhart
La Grange Steuben
NewtonJasper
De Kalb
WhitleyAllen
Noble
Pulaski
StarkeMarshall
Fulton
Kosciusko
Grant
Wabash Huntington
Wells AdamsWhiteCass Miami
Jay
RandolphDelaware
Madison
Tipton
Hamilton
Blackford
Benton Carroll
Tippecanoe
Clinton
Howard
Montgomery Boone
Fountain
Ve
rmil
lion
Parke
Warren
Johnson
Hendricks Marion
Putnam
Vigo
Hancock
Henry
Wayne
Clay
MorganShelby
Rush Fayette Union
213k
99k
11k
7k
11
> 100k
50k– 99k
10k – 49k
1k – 9k
1 – 999
1
1
1
1
1
1
1
1
1
1
1
1
1
2
2
2
2
2
2
2
2
2
3
3
3
4
44
4
4
5
6
7
7
11
14
3k
3k
3k
3k
7k
8k
8k
10k
11k
13k
17k
17k
20k
31k
35k
50k99k
213k

59
Figure A.17. Indiana duck manure production (tons) in 2007.
Due to the withheld data in USDA Census, duck manure productions in 13 duck-raising counties
are not shown in the map. There were other 5 counties without duck farms.
Grant
Brown
DaviessKnox
Sullivan
Owen
Greene
Monroe
Martin
Decatur
Franklin
Dearborn
Ripley
Jennings
Jackson
Lawrence
Orange
Jefferson
Ohio
Bartholomew
Washington
Scott
Pike
Gibson
PoseyPerry
Spencer
Warrick
Vanderburgh
Dubois
Switzerland
Crawford
Clark
Floyd
Harrison
LakePorter
La PorteSt Joseph Elkhart
La Grange Steuben
NewtonJasper
De Kalb
WhitleyAllen
Noble
Pulaski
Starke Marshall
Fulton
Kosciusko
Grant
Wabash Huntington
Wells AdamsWhiteCass Miami
Jay
RandolphDelaware
Madison
Tipton
Hamilton
Blackford
Benton Carroll
Tippecanoe
Clinton
Howard
Montgomery Boone
Fountain
Ve
rmil
lion
Parke
Warren
Johnson
Hendricks Marion
Putnam
Vigo
Hancock
Henry
Wayne
Clay
MorganShelby
Rush Fayette Union
1
1
1
1
1
1
1
1
2
2
2
2
2
2
2
2
2
2
2
2
2
2
2
3
3
3
3
3
3
3
3
34
4
4
4
5
5
5
55
5
6
6
6
6
7
7
7
7
7
8
8
8
8
8
8
9
9
9
10
12
12
20
21
24
977
2k
2k
5k
8k
24k26k
34k
34k
26k
8k
977
20
> 30k
20k– 29k
1k – 19k
100 – 999
1 – 99
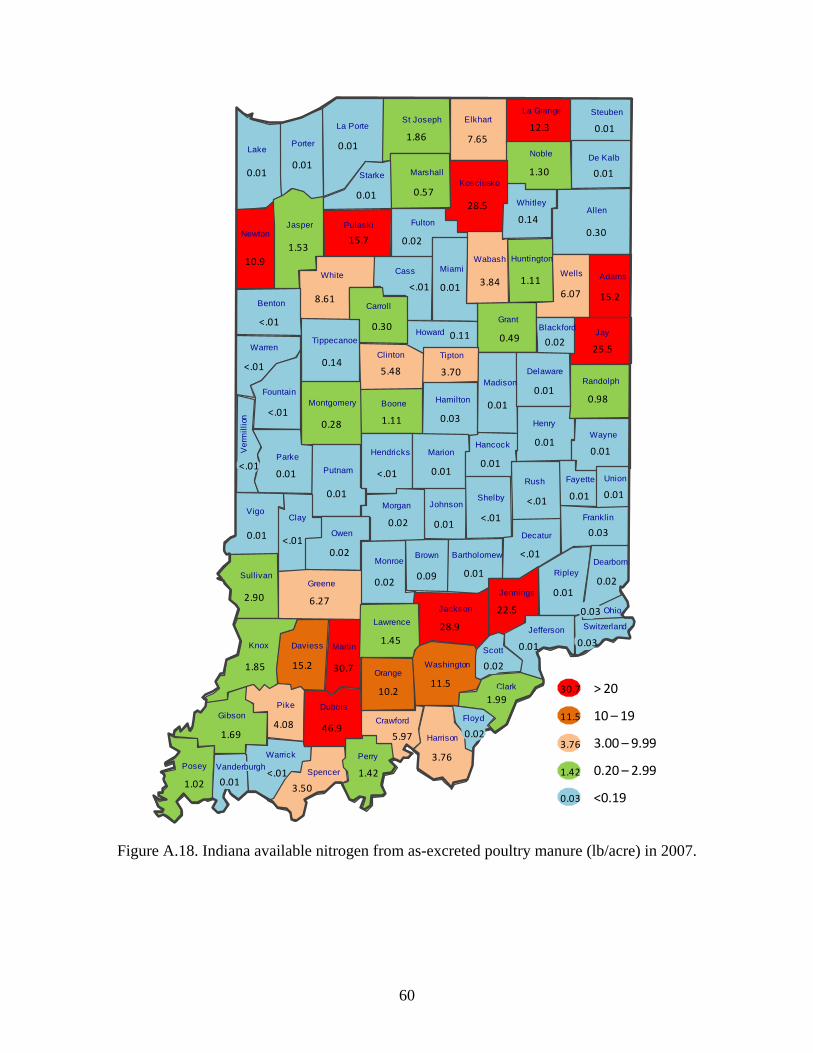
60
Figure A.18. Indiana available nitrogen from as-excreted poultry manure (lb/acre) in 2007.
Grant
Brown
DaviessKnox
Sullivan
Owen
Greene
Monroe
Martin
Decatur
Franklin
Dearborn
Ripley
Jennings
Jackson
Lawrence
Orange
Jefferson
Ohio
Bartholomew
Washington
Scott
Pike
Gibson
PoseyPerry
Spencer
Warrick
Vanderburgh
Dubois
Switzerland
Crawford
Clark
Floyd
Harrison
LakePorter
La PorteSt Joseph Elkhart
La Grange Steuben
NewtonJasper
De Kalb
WhitleyAllen
Noble
Pulaski
Starke Marshall
Fulton
Kosciusko
Grant
Wabash Huntington
Wells AdamsWhiteCass Miami
Jay
RandolphDelaware
Madison
Tipton
Hamilton
Blackford
Benton Carroll
Tippecanoe
Clinton
Howard
Montgomery Boone
Fountain
Ve
rmil
lion
Parke
Warren
Johnson
Hendricks Marion
Putnam
Vigo
Hancock
Henry
Wayne
Clay
MorganShelby
Rush Fayette Union
<.01
<.01
<.01
<.01
<.01
0.01
0.01
0.01
0.01
0.01
0.01
0.01
0.01
0.01
0.01
0.01
0.02
0.02
0.03
0.11
0.14
0.14
0.28
0.30
0.30
0.49
0.57
0.98
1.11
1.11
1.30
1.53
1.86
3.70
3.84
5.48
6.07
7.65
8.61
10.9
12.3
15.2
15.7
25.5
28.5
<.01
<.01
<.01
<.01
<.01
<.01
0.01
0.01
0.010.01
0.01
0.01
0.01
0.01
0.01
0.010.01
0.01
0.02
0.02
0.02
0.02
0.02
0.02
0.03
0.03
0.03
0.09
1.021.42
1.45
1.69
1.85
1.99
2.90
3.50
3.76
4.085.97
6.27
10.211.5
15.2
22.5
28.9
30.7
46.9
30.7
11.5
3.76
1.42
0.03
> 20
10 – 19
3.00 – 9.99
0.20 – 2.99
<0.19

61
Figure A.19. Indiana available phosphorus from as-excreted poultry manure (lb/acre) in 2007.
Grant
Brown
DaviessKnox
Sullivan
Owen
Greene
Monroe
Martin
Decatur
Franklin
Dearborn
Ripley
Jennings
Jackson
Lawrence
Orange
Jefferson
Ohio
Bartholomew
Washington
Scott
Pike
Gibson
PoseyPerry
Spencer
Warrick
Vanderburgh
Dubois
Switzerland
Crawford
Clark
Floyd
Harrison
LakePorter
La PorteSt Joseph Elkhart
La Grange Steuben
NewtonJasper
De Kalb
WhitleyAllen
Noble
Pulaski
Starke Marshall
Fulton
Kosciusko
Grant
Wabash Huntington
Wells AdamsWhiteCass Miami
Jay
RandolphDelaware
Madison
Tipton
Hamilton
Blackford
Benton Carroll
Tippecanoe
Clinton
Howard
Montgomery Boone
Fountain
Ve
rmil
lion
Parke
Warren
Johnson
Hendricks Marion
Putnam
Vigo
Hancock
Henry
Wayne
Clay
MorganShelby
Rush Fayette Union
<.01
<.01
<.01
<.01
<.01
<.01
<.01
0.050.10
0.18
0.44
0.51
0.59 2.40
3.42
3.79
4.97
9.11
<.01
<.01
<.01
<.01
<.01
<.01
<.01<.01
<.01
<.01
<.01<.01
<.01
<.01
<.01
<.01
<.01
<.01
<.01
<.01
<.01
0.01
0.01
0.01
0.04
0.05
0.08
0.100.16
0.30
0.33
0.35
1.16
1.28
1.72
1.912.73 4.80
7.98
<.01
0.01
<.01
<.01
<.01
<.01
<.01
<.01
<.01
0.01
0.01
0.01
0.01
0.01
0.01
0.03
0.300.42
0.43
0.50
0.55
0.59
0.86
1.04
1.16
1.211.74
1.86
3.223.37
4.50
7.19
9.20
9.20
14.17
9.20
3.79
1.16
0.30
0.01
> 6.00
3.00 – 5.99
1.00 – 2.99
0.06 – 0.99
<0.06
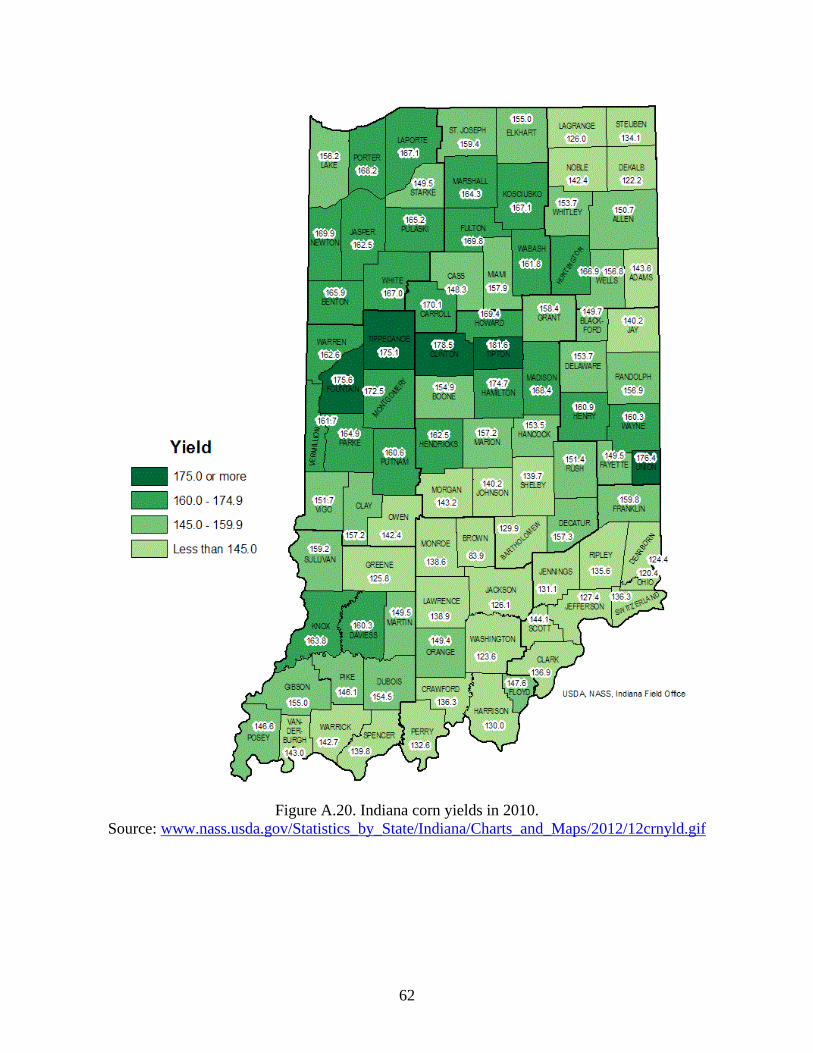
62
Figure A.20. Indiana corn yields in 2010.
Source: www.nass.usda.gov/Statistics_by_State/Indiana/Charts_and_Maps/2012/12crnyld.gif

63
Figure A.21. Indiana soybean yields in 2010.
Source: www.nass.usda.gov/Statistics_by_State/Indiana/Charts_and_Maps/2010/10sbyld.gif

64
Appendix B: Survey Questionnaire of Poultry Manure Application
in Indiana
By Purdue University, West Lafayette, Indiana (IRB Approved Protocol # 1212013039)
The purpose of this survey is to collect data that will help to identify statewide issues related to
manure management, and to increase the value of poultry manure as a nutrient source for crops
and other value-added products. The survey results will be used in scientific research and by
Purdue Extension personnel for Indiana‟s sustainable agriculture. All of your answers will be
CONFIDENTIAL.
To avoid data overlaps, please only enter information relevant to 1) the land that you own or rent
to grow crops (excluding land that you rent to others), and 2) livestock and poultry farm(s) that
you directly operate (i.e., do not include those that you contract to others).
For questions, please contact Jiqin (Jee-Chin) Ni ([email protected], 765-496-1733) or Albert
Heber ([email protected], 765-494-1214).
This survey will take an average of 5 to 15 minutes to complete.
The completed survey can be mailed back to the county educator:
________________________
________________________
________________________
This survey is also available online at:
https://purdue.qualtrics.com/SE/?SID=SV_a64N2cSopRRhki1
65
Q1: Where in Indiana is your land located? (Check all counties that apply).
□ Adams □ Hendricks □ Pike
□ Allen □ Henry □ Porter
□ Bartholomew □ Howard □ Posey
□ Benton □ Huntington □ Pulaski
□ Blackford □ Jackson □ Putnam
□ Boone □ Jasper □ Randolph
□ Brown □ Jay □ Ripley
□ Carroll □ Jefferson □ Rush
□ Cass □ Jennings □ St. Joseph
□ Clark □ Johnson □ Scott
□ Clay □ Knox □ Shelby
□ Clinton □ Kosciusko □ Spencer
□ Crawford □ La Porte □ Starke
□ Daviess □ Lagrange □ Steuben
□ Dearborn □ Lake □ Sullivan
□ Decatur □ Lawrence □ Switzerland
□ De Kalb □ Madison □ Tippecanoe
□ Delaware □ Marion □ Tipton
□ Dubois □ Marshall □ Union
□ Elkhart □ Martin □ Vanderburgh
□ Fayette □ Miami □ Vermillion
□ Floyd □ Monroe □ Vigo
□ Fountain □ Montgomery □ Wabash
□ Franklin □ Morgan □ Warren
□ Fulton □ Newton □ Warrick
□ Gibson □ Noble □ Washington
□ Grant □ Ohio □ Wayne
□ Greene □ Orange □ Wells
□ Hamilton □ Owen □ White
□ Hancock □ Parke □ Whitley
□ Harrison □ Perry
Q2: Do you also have crops grown in the following neighboring states? (Check all that
apply).
□ Ohio □ Michigan □ Illinois □ Kentucky

66
Q3: What poultry types did you have in 2012?
Number of
birds
Layers ___________
Broilers ___________
Pullets ___________
Turkeys ___________
Turkey breeders ___________
Ducks ___________
Other (please specify) ______________ ___________
Other (please specify) ______________ ___________
*If you did not have any poultry production in 2012, skip to Q5.
Q4: Did you have excess poultry manure to sell in 2012?
□ Yes, about ______% manure marketed/sold. □ No
Q5: What crops did you grow and how many acres did you allocate to each crop in 2012?
Number of
acres
Check if you applied poultry
manure to this crop
Corn ___________ □
Soybeans ___________ □
Wheat ___________ □
Oats ___________ □
Potatoes ___________ □
Other (please specify) ______________ ___________ □
Other (please specify) ______________ ___________ □
Q6: What fertilizers and how much of each did you apply to your total cropland in 2012?
Quantity of
fertilizer
Check if in
Tons
Check if in
Gallons
Inorganic fertilizer ___________ □ □
Poultry manure ___________ □ □
Swine manure ___________ □ □
Dairy manure ___________ □ □
Beef manure ___________ □ □
Other (please specify) ______________ ___________ □ □
Other (please specify) ______________ ___________ □ □
*If you did NOT apply poultry manure as fertilizer, please skip to Q14.
67
Q7: About poultry manure transportation and application in 2012. (Check all that apply).
□ We use cover crops.
□ We use solid poultry manure.
□ We use liquid poultry manure.
□ We compost poultry manure.
□ We had manure tested for nutrient content.
□ The poultry farm provided nutrient content data.
□ The manure hauler provided us nutrient content data.
□ We provided transportation and application of poultry manure ourselves for
$ _______/ton of solid manure only or _______¢/gallon of liquid manure only.
□ We purchased manure from manure hauler who transported and applied manure for
$ _______/ton or _______¢/gallon, including transportation, application, and manure).
Q8: If you provide transportation and application of poultry manure in 2012, what is the
maximum transportation distance from the poultry farm to your crop field?
______________ miles
Q9: What are the main reasons that you use poultry manure? (Check all that apply).
□ It is readily available on our farm or from other farms.
□ It has high organic nutrient content.
□ It is less expensive than inorganic fertilizers.
□ It is easy to store and apply.
□ Other (please specify): ______________________________________
□ Other (please specify): ______________________________________
Q10: About using poultry manure as a plant-nutrient fertilizer.
How long have you been using poultry manure?
For __________ years. □ I only use poultry manure occasionally (not every year).
Q11: When do you apply poultry manure? (Check all that apply).
□ spring □ summer □ fall □ winter
Q12: Do you plan to continue using poultry manure on your farms?
□ Yes □ No
Q13: Additional information about poultry manure use. (Check all that apply).
□ We use poultry manure as feed in aquaculture.
□ We use poultry manure as feed for beef cattle.
□ We use/sell poultry manure to produce energy in anaerobic digesters.
□ We use/sell poultry manure to produce energy by thermo-chemical conversion.
*If you DID apply poultry manure, please skip to Q15.

68
Q14: If you did NOT utilize poultry manure on your cropland in 2012, what were the main
reasons? (Check all that apply).
□ Poultry manure was not readily available from our own farm or from other sources.
□ We had never used poultry manure and were unsure of its benefit.
□ It was more expensive than inorganic fertilizers.
□ It would not satisfy my crop nutrient requirements.
□ Poultry manure is more difficult to apply.
□ We are concerned about its related environmental problems:
□ Nutrient runoff
□ Groundwater contamination
□ Odor nuisance during manure application
□ Other (please specify) _____________________________
□ Other (please specify) _____________________________
Q15: What is the price you are willing to pay for poultry manure? (Enter all prices that
apply).
For manure, transportation, and application:
$_____/ton of solid manure or _____¢/gallon of liquid manure.
For manure only when purchased from a poultry farm:
$_____/ton or _____¢/gallon.
For transportation and application only after manure was purchased from a poultry farm:
If done by myself: $_____/ ton or _____¢/ gallon.
If done by a contractor: $_____/ ton or _____¢/ gallon.
Q16: Do you have a nutrient management plan?
□ Yes □ No
Q17: Are you aware of the new Agriculture Fertilizer Applicator Certification Rule
(www.isco.purdue.edu/pesticide/pest_pdf/fert_app_outreach_11_23_2010.pdf)?
□ Yes □ No
Q18: Are you aware of the new Indiana regulation on Fertilizer Material Use, Distribution,
and Record Keeping
(www.isco.purdue.edu/fertilizer/fert_pdf/fert_use_rules_and_faq.pdf)?
□ Yes □ No
Thank you for participating in the Indiana poultry manure application survey 2013!