availability and use of weather, climate, and climate … · climate • climate: the long‐term...
TRANSCRIPT
Cory MorinNASA Postdoctoral Program Fellow
[email protected](Special thanks to Dr. Kacey Ernst, Dr. Dale Quattrochi and Dr. Jeff Luvall)
Availability and Use of Weather, Climate, and Climate Change Data
https://ntrs.nasa.gov/search.jsp?R=20160005832 2018-08-19T19:41:51+00:00Z
Weather
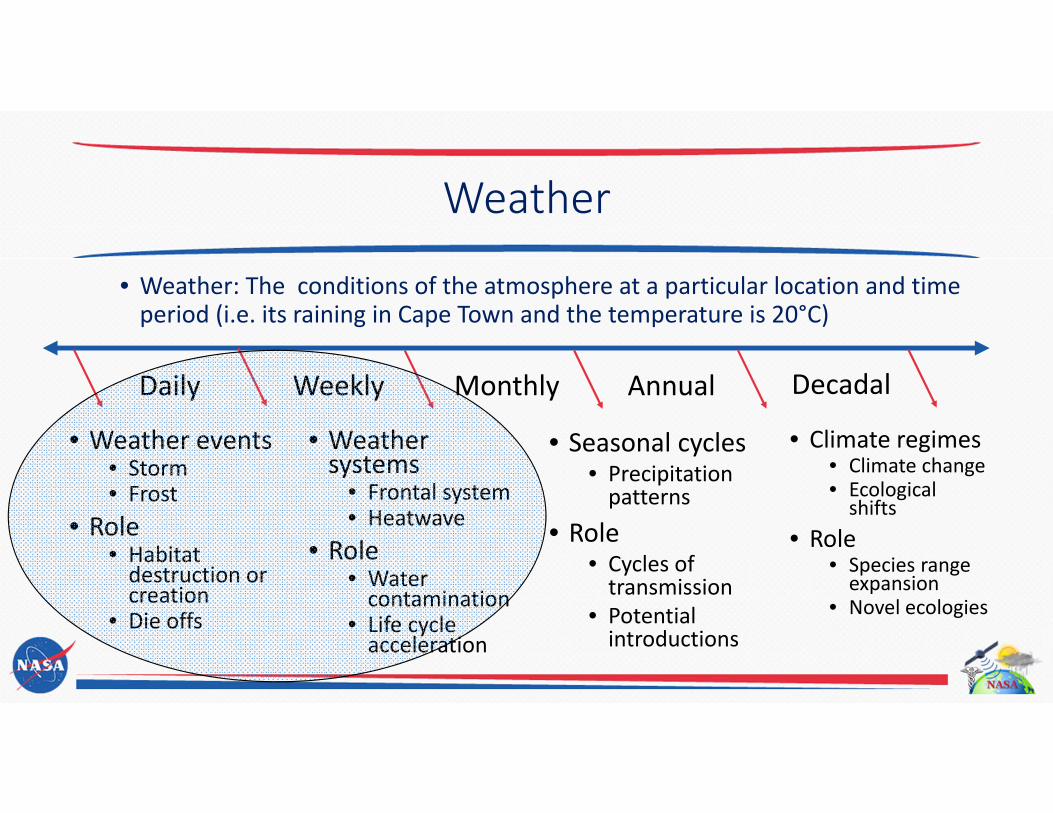
• Weather: The conditions of the atmosphere at a particular location and time period (i.e. its raining in Cape Town and the temperature is 20°C)
• Weather events• Storm• Frost
• Role• Habitat destruction or creation
• Die offs
• Weather systems
• Frontal system• Heatwave
• Role• Water contamination
• Life cycle acceleration
• Seasonal cycles• Precipitation patterns
• Role• Cycles of transmission
• Potential introductions
Daily Weekly Monthly Annual Decadal
• Climate regimes • Climate change• Ecological shifts
• Role• Species range expansion
• Novel ecologies

Climate
• Climate: The long‐term average conditions of the atmosphere over a region (i.e. Tucson, Arizona has an arid climate with seasonal precipitation)
• Weather events• Storm• Frost
• Role• Habitat destruction or creation
• Die offs
• Weather systems
• Frontal system• Heatwave
• Role• Water contamination
• Life cycle acceleration
• Seasonal cycles• Precipitation patterns
• Role• Cycles of transmission
• Potential introductions
Daily Weekly Monthly Annual Decadal
• Climate regimes • Climate change• Ecological shifts
• Role• Species range expansion
• Novel ecologies

Climate Variability
• Climate variability: The fluctuation in climate around its mean value• Can include phases and oscillations
Environm
ental Variable
Time
Actual Mean
Environm
ental Variable
Time
Actual Mean

Climate Change
• Climate change: A long‐term alteration in climate mean or variation • Associated with trends
Environm
ental Variable
Time
Actual Trend
Environm
ental Variable
Time
Actual Mean

Sources of Data
• Weather/Climate Data• Paleoclimate data• Stations and other recorders• Satellite and remotely sensed data
• Reanalysis datasets • Forecasting
• Climate Change• Global climate models (GCMs)
• Scenario building• Downscaling http://www.hmei.org/march‐2015/

Paleoclimate Data
• Past climate data obtained through proxy records
• Many methods of obtainment• Ice cores• Tree rings (dendrochronology)• Sediments• Various organisms
• Rarely used in climate and disease research
http://www.thenakedscientists.com/HTML/interviews/interview/643/
http://www.visualisingdata.com/2015/02/dendrochronology‐visualisation‐literacy/
http://sites.dartmouth.edu/jstroup/photo‐gallery/
Earthobservatory.nasa.gov

Weather Stations
• Can record a suite of variables depending on the instrumentation
• Temperature, precipitation, humidity, wind speed, wind direction, incoming solar radiation
• Records are usually daily
• Found at many airports, universities, and research centers
• Data is often available through local or national weather services
http://mea.com.au/upload/AWS_with_Labels.jpg

Weather Stations
• Strengths• Often record many variables• Daily resolution (sometimes hourly)• Most populated areas contain at least one• Long record history
• Weaknesses• Not uniformly distributed• Potential breaks in recording or location• Can be heavily influenced by local environment• Not representative of a large area• Data is sometimes unavailable or expensive
https://www.wunderground.com/weatherstation/installationguide.asp
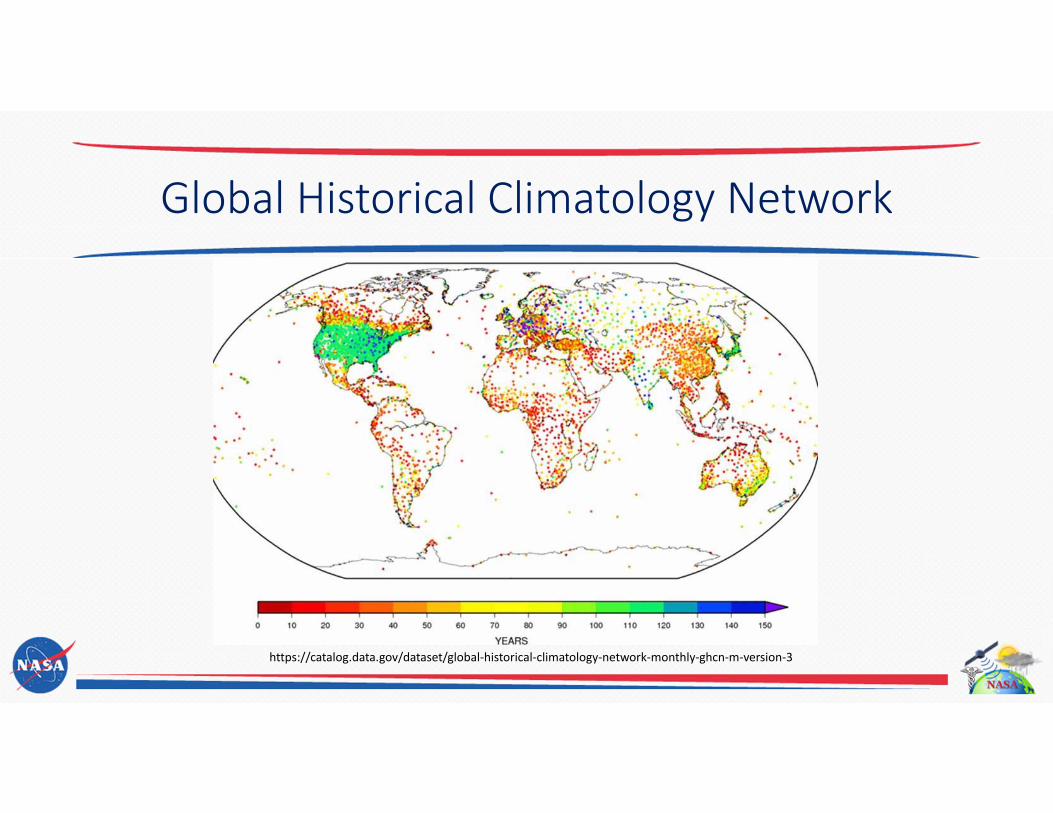
Global Historical Climatology Network
https://catalog.data.gov/dataset/global‐historical‐climatology‐network‐monthly‐ghcn‐m‐version‐3

Mini Weather Data Loggers
• Devices for collecting weather data• Generally record temperature and/or humidity• Data downloaded via connection to laptop or wifi
• Advantages• Small and inexpensive• Can record at various time intervals• Good for sampling microclimates
• Disadvantages• Usually self employed• Limited variables• Representative of very small areas
http://thermometer.co.uk/71‐humidity‐and‐temperature‐data‐loggers

Remote Sensing: How it Works
• Technique that collects information through signals (i.e., electromagnetic radiation) using sensors with filters specific to certain wavelengths
• Found on satellites, planes, towers, ect.• Features on Earth identified through their specific radiative frequencies
http://www.seos‐project.eu/modules/classification/classification‐c00‐p05.htmlhttps://www.e‐education.psu.edu/geog160/node/1958

Remote Sensing Techniques
• Passive vs Active remote sensing• Passive only collects signal • Active emits a signal and then collects a return signal
• Levels of data• 0: Raw data• 1: Data calibrated, georeferenced, time‐referenced, ect.
• 2: Derived geophysical variables• 3: Data mapped on uniform grid• 4: Modeled variables from the lower level data (NDVI)
https://en.wikipedia.org/wiki/Remote_sensing

What Can Remote Sensing Measure?
• Temperature‐ ECOSTRESS (2017), HyspIRI (2020+), ASTER (1999), Landsat (5,7,8), MODIS
• Precipitation‐ GPM (2014)• Soil Moisture‐ SMAP(2015)• Hyperspectral‐ Hyperion (2000), HyspIRI (2020+)
• Structure ‐ IceSat2 (2016)• Flooding/water levels lakes streams, groundwater storage –GRACE (2002) SWOT (late 2020)
• Land Cover/Use‐ Landsat, MODIS, ASTER, Sentinel‐2(2015)

• Measures environmental state functions important to pathogen life cycles
• Precipitation, soil moisture, temperature, vapor pressure deficits, wet/dry edges, solar radiation….
• But also the interfaces as process functions:• Land use/cover mapping; Ecological functions/structure,
canopy cover, species, phenology, aquatic plant coverage…..
• And provides a Spatial Context• Spatial coverage & topography – local, regional & global…
• Lastly, but perhaps the greatest strength:• Provides a time series of measurements
Remote Sensing Strengths

• Tradeoff between spatial and temporal resolution• Satellites may pass over multiple times per day or once
every few weeks• Spatial resolution can by sub‐meter to kilometers
• Atmospheric interference • Clouds can obscure views• Detrimental if the data has poor temporal resolution
• Accuracy and interpretation• Algorithms often required and will not be perfect
• Availability• Although NASA provides data free, other space agencies
and private companies charge exorbitant prices for data
Remote Sensing WeaknessesMODIS – 1 km
Landsat 7 – 60 m
Reanalysis Data
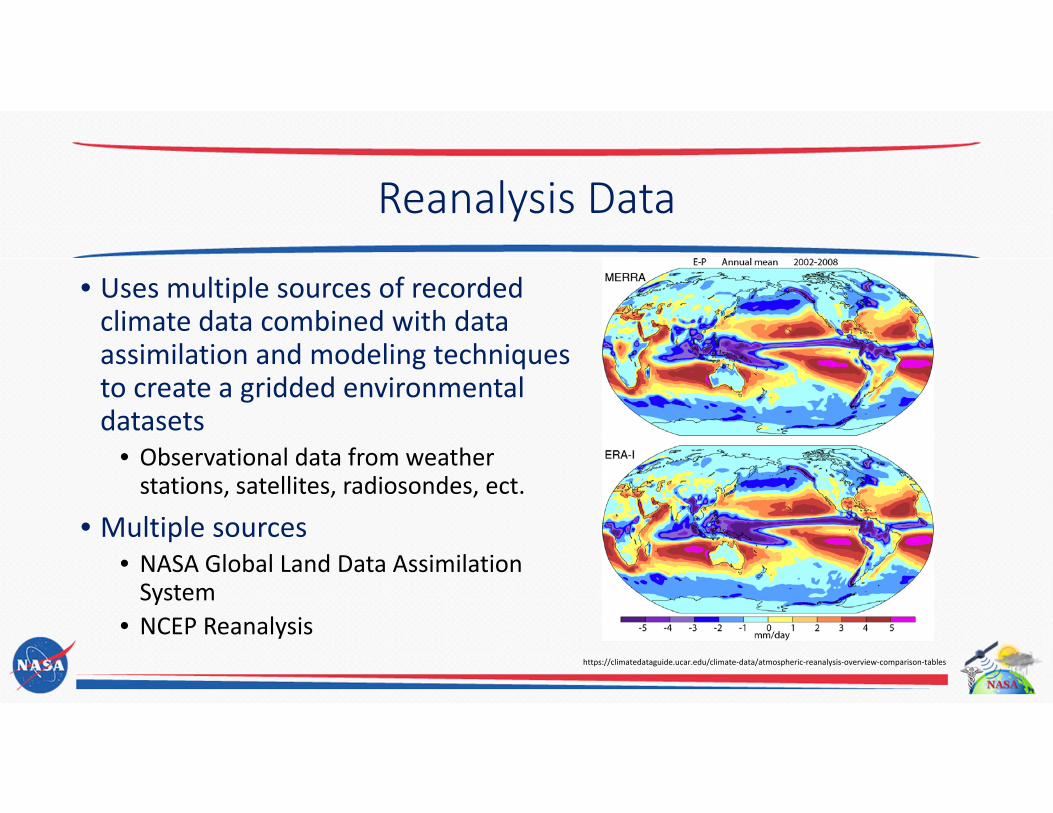
• Uses multiple sources of recorded climate data combined with data assimilation and modeling techniques to create a gridded environmental datasets
• Observational data from weather stations, satellites, radiosondes, ect.
• Multiple sources• NASA Global Land Data Assimilation System
• NCEP Reanalysishttps://climatedataguide.ucar.edu/climate‐data/atmospheric‐reanalysis‐overview‐comparison‐tables

Reanalysis Data
• Advantages• Includes huge amount of variables• Global gridded data with consistent spatial and temporal resolution
• Incorporates millions of observations • Free and relatively easy to use
• Disadvantages• Reliability depends on location, time period, and variable
• The type and number of observations changes over time
• Use of modeled data
http://cpo.noaa.gov/ClimatePrograms/ModelingAnalysisPredictionsandProjections/MAPPNewsEvents/TabId/506/ArtMID/1256/ArticleID/197/MAPP‐kicks‐off‐Climate‐Reanalysis‐Task‐Force‐activities.aspx

Weather Forecasts
• Short‐term predictions out to 2 weeks into the future
• Meteorologists use multiple methods to produce forecasts
• Current observational data• Tracking weather systems and air masses
• Weather forecasting models• Weather research and forecasting model WRF
• Experiencehttp://www.cnn.com/WEATHER/Africa/frct.html

Weather Forecasts
• Multiple sources • Local or national weather service• Private companies: TV or Websites
• weatherunderground.com
• Considerations when using weather forecast data
• Uncertainty • Forecasts degrade in quality as they extend out
• Evaluation of forecasts are important
Bauer at al. 2015

Seasonal Forecasts
• 1‐6 Month Forecasts• Based on long‐term climate trends, sea surface temperatures, oscillations
• From numerical weather prediction models and/or statistical models
• Example: North American Multi‐Model Ensemble
• Made up of multiple models• Gridded, monthly
• Daily downscaled version available but are not specific daily predicitons http://iri.columbia.edu/our‐expertise/climate/forecasts/seasonal‐climate‐forecasts/

Climate Variability and Change
• Shift in mean and variance• Increase in frequency of extreme conditions
IPCCIPCC 2013IPCC 2013

Global Climate Models
• Global climate models• Attempt to simulate the climate system through mathematically modeling the physical, chemical, and biological processes that occur within and between the atmosphere, hydrosphere, lithosphere, and biosphere
• Many different models with different resolutions, assumptions, and regional accuracy
nca2014.globalchange.gov

Climate Change Models
• Earth and atmosphere divided into a 3‐d grid which interact
• Higher resolution is more accurate but requires increased computing power
• Can simulate the climate system under various conditions
https://www.e‐education.psu.edu/earth103/node/524

Climate Change Data
• GCM inputs• Greenhouse gas, aerosol, and pollutant concentrations
• Land use/cover
• Representative concentration pathways
• Scenarios created based on projected socioeconomic conditions
• Designed to deal with uncertainty
Van Vuuren et al. 2011

Downscaling Climate Change Data
• A method of estimating local scale climate/weather features from larger scale models
• Important for local impact assessments
• Downscaling can refer to both spatial and/or temporal downscaling
• Two major methods of downscaling GCM climate data
• Dynamic downscaling• Statistical downscaling
http://www.climatechange2013.org/report/reports‐graphic/ch1‐graphics/
https://www2.ucar.edu/news/understanding‐climate‐change‐multimedia‐gallery
https://www.wmo.int/pages/themes/climate/climate_models.php
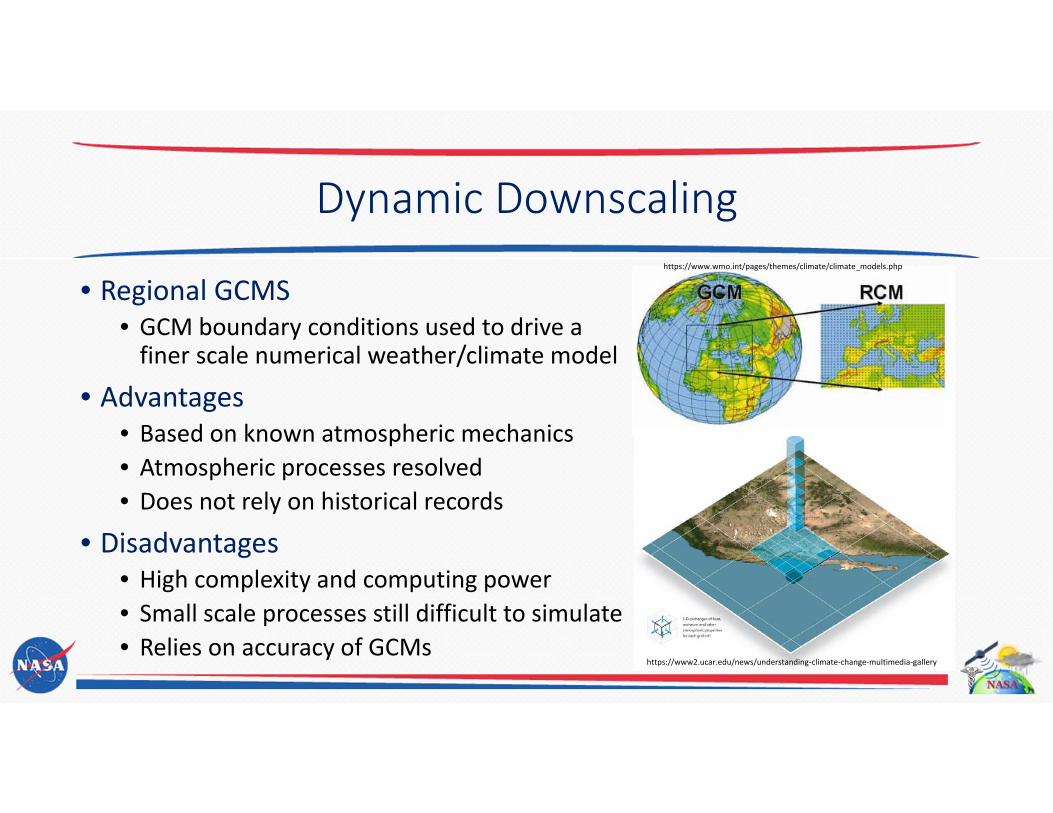
Dynamic Downscaling
• Regional GCMS• GCM boundary conditions used to drive a finer scale numerical weather/climate model
• Advantages• Based on known atmospheric mechanics• Atmospheric processes resolved • Does not rely on historical records
• Disadvantages• High complexity and computing power• Small scale processes still difficult to simulate• Relies on accuracy of GCMs

Statistical Downscaling
• Based on relationships between large‐scale and local atmospheric conditions
• Methods: linear regression, weather classification, weather generators
• Advantages• Simple with little required computer power• Can downscale to very fine resolution• Methods are flexible
• Disadvantages• Assumes stationary relationships over time• Accuracy and resolution are method dependent• Relies on accuracy of GCMs and historic data
https://rcmes.jpl.nasa.gov/content/statistical‐dow
nscaling

Data Considerations in Climate and Health Research
• What is the required resolution?• Spatial• Temporal
• What is the period of study?• Historic• Future
• How to deal with uncertainty?• Sources• Solutions
http://www.labreporter.com/the‐impact‐of‐climate‐change‐on‐human‐health/
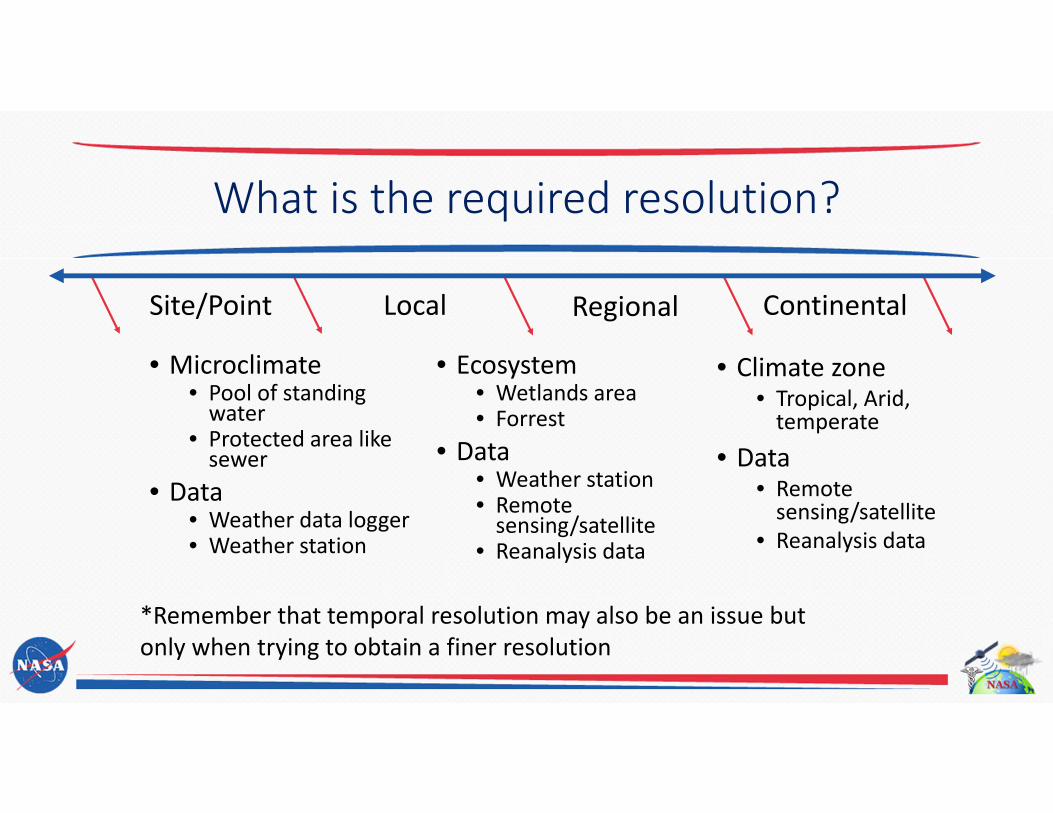
• Microclimate• Pool of standing water
• Protected area like sewer
• Data• Weather data logger• Weather station
What is the required resolution?
• Ecosystem • Wetlands area• Forrest
• Data• Weather station• Remote sensing/satellite
• Reanalysis data
Local Regional Continental
• Climate zone• Tropical, Arid,temperate
• Data• Remote sensing/satellite
• Reanalysis data
Site/Point
*Remember that temporal resolution may also be an issue but only when trying to obtain a finer resolution

• Historic• Methods of collecting weather/climate data change over time
• Certain variables are only available more recently
• The number of collections also changes over time
• Future• Short‐term: weather forecast• Mid‐term: seasonal forecast• Long‐term: climate change
www.era‐clim.ev
What is the Period of Study?
Uncertainty increases as forecast increases while specificity decreases
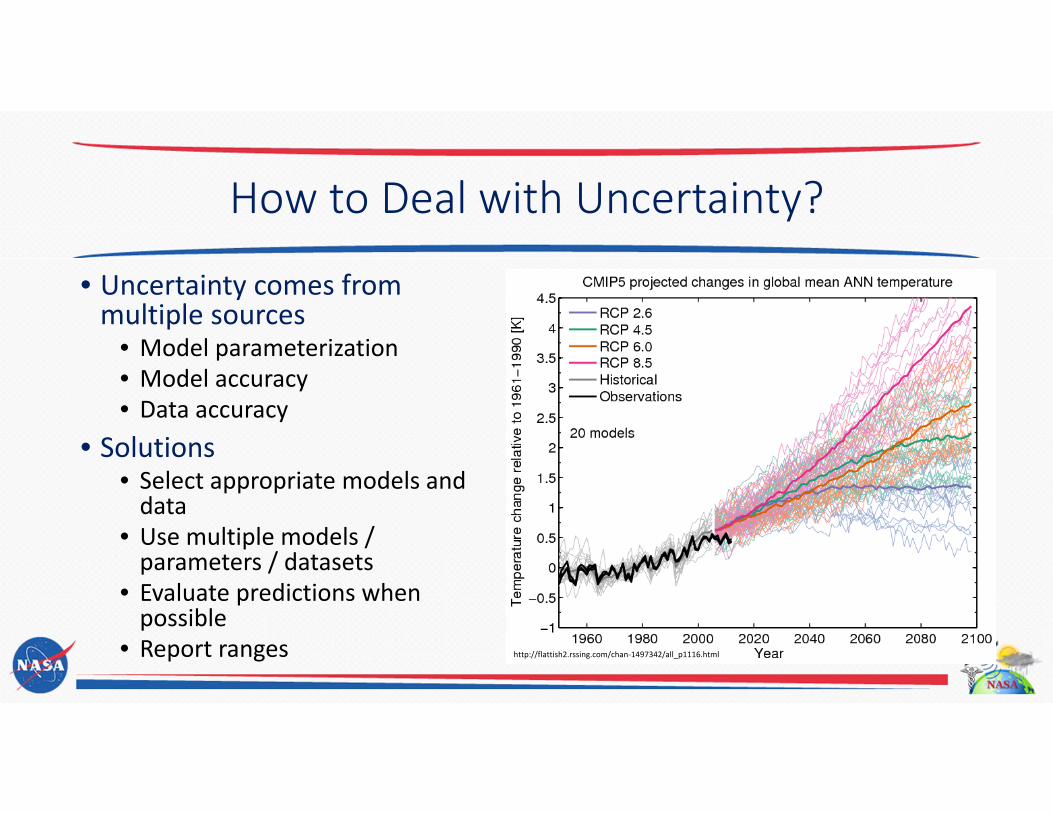
• Uncertainty comes from multiple sources
• Model parameterization• Model accuracy• Data accuracy
• Solutions• Select appropriate models and data
• Use multiple models / parameters / datasets
• Evaluate predictions when possible
• Report ranges
www.era‐clim.ev
How to Deal with Uncertainty?
http://flattish2.rssing.com/chan‐1497342/all_p1116.html