auxiliary cargo and ammunition ship design t-ake pikebrown/vtshipdesign/2002taketeam2report.pdf ·...
TRANSCRIPT

Auxiliary Cargo and Ammunition Ship Design T-AKE PIKE
AOE 4065/4066 Ocean Design Team #2
Daniel Eling ___________________________________________________________16692 Timothy Brereton ___________________________________________________________15957 Melissa Gill ___________________________________________________________17887 Moojane Louie ___________________________________________________________14607 Brian Wolf ___________________________________________________________13334
T-AKE PIKE Design Report
ii
Contract Deliverables Requirements List
Requirement Page Principal Characteristics iii
Weight Estimates Appendix F Curves of Form 26
Floodable Length Curve 60 Intact Stability Analysis 53
Damaged Stability Analysis 56 Lines Drawing Drawing 1
General Arrangements Drawings Drawing 4 Typical Berthing Arrangement Drawings Drawing 7
Capacity Plan Drawing 6 Machinery Arrangement Drawings Drawing 5
Midship Section Drawing Drawing 3 Speed/Power Analysis 39, Appendix E Electric Load Analysis Appendix L Seakeeping Analysis 60
Area/Volume Summary Drawing 6 Manning Estimate 51
Major Equipment List Appendix K Propulsion Trade-off Study 11 Endurance Fuel Calculation Appendix E
Cost Analysis 62 Risk Summary 61
T-AKE PIKE Design Report
iii
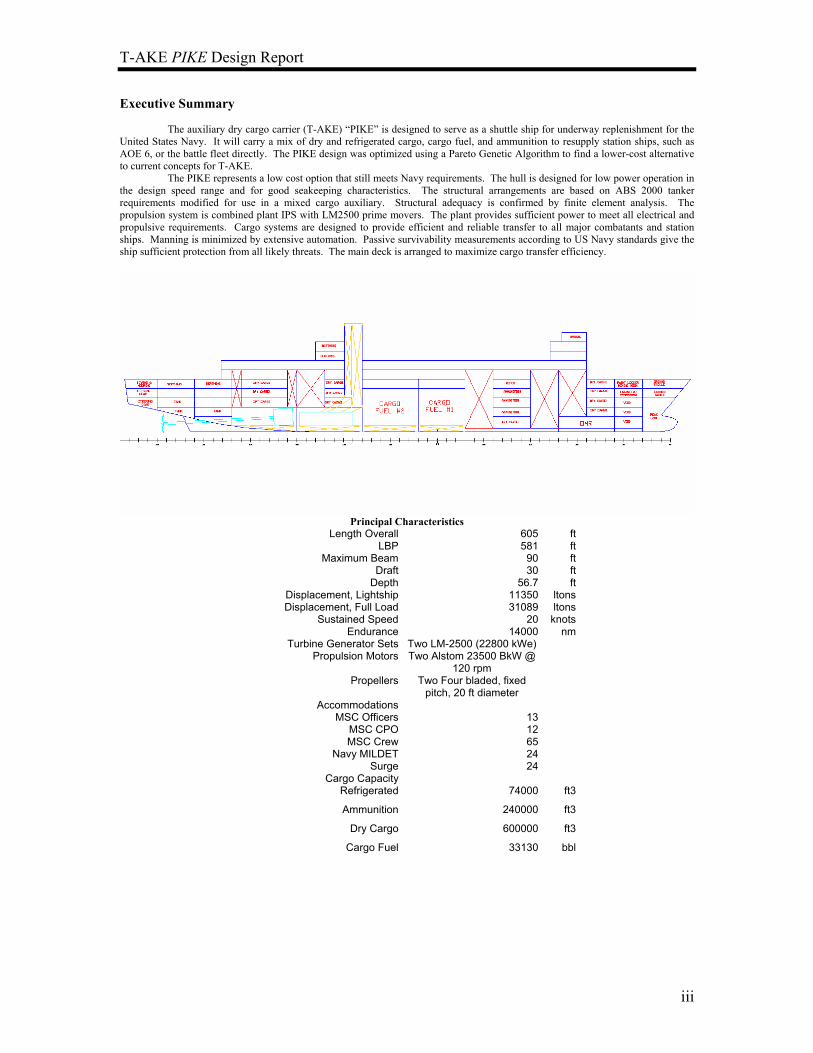
Executive Summary The auxiliary dry cargo carrier (T-AKE) “PIKE” is designed to serve as a shuttle ship for underway replenishment for the United States Navy. It will carry a mix of dry and refrigerated cargo, cargo fuel, and ammunition to resupply station ships, such as AOE 6, or the battle fleet directly. The PIKE design was optimized using a Pareto Genetic Algorithm to find a lower-cost alternative to current concepts for T-AKE. The PIKE represents a low cost option that still meets Navy requirements. The hull is designed for low power operation in the design speed range and for good seakeeping characteristics. The structural arrangements are based on ABS 2000 tanker requirements modified for use in a mixed cargo auxiliary. Structural adequacy is confirmed by finite element analysis. The propulsion system is combined plant IPS with LM2500 prime movers. The plant provides sufficient power to meet all electrical and propulsive requirements. Cargo systems are designed to provide efficient and reliable transfer to all major combatants and station ships. Manning is minimized by extensive automation. Passive survivability measurements according to US Navy standards give the ship sufficient protection from all likely threats. The main deck is arranged to maximize cargo transfer efficiency.
Principal Characteristics
Length Overall 605 ft LBP 581 ft
Maximum Beam 90 ft Draft 30 ft
Depth 56.7 ft Displacement, Lightship 11350 ltons Displacement, Full Load 31089 ltons
Sustained Speed 20 knots Endurance 14000 nm
Turbine Generator Sets Two LM-2500 (22800 kWe) Propulsion Motors Two Alstom 23500 BkW @
120 rpm
Propellers Two Four bladed, fixed pitch, 20 ft diameter
Accommodations MSC Officers 13
MSC CPO 12 MSC Crew 65
Navy MILDET 24 Surge 24
Cargo Capacity Refrigerated 74000 ft3
Ammunition 240000 ft3
Dry Cargo 600000 ft3
Cargo Fuel 33130 bbl
T-AKE PIKE Design Report
iv
Table of Contents 1 REQUIREMENTS AND PLAN ........................................................................................................ 1
1.1 Mission Need ...................................................................................................... 1 1.2 Design Philosophy and Process .......................................................................... 1 1.3 Work Breakdown................................................................................................ 3 1.4 Resources ............................................................................................................ 4
2 MISSIONS, MISSION EFFECTIVENESS AND COST................................................................. 5 2.1 Missions .............................................................................................................. 5
2.1.1 Mission Concept of Operations .................................................................. 5 2.1.2 Projected Operational Environment and Threat ......................................... 5 2.1.3 Mission Scenarios ....................................................................................... 6 2.1.4 Required Operational Capabilities.............................................................. 7
2.2 Objective Attributes ............................................................................................ 8 2.2.1 Cost ............................................................................................................. 8 2.2.2 Overall Measure of Effectiveness Model ................................................... 9
3 CONCEPT EXPLORATION .......................................................................................................... 11 3.1 Concept Exploration Model.............................................................................. 11
3.1.1 Model Overview and Function ................................................................. 11 3.1.2 Trade-Off Technologies, Concepts, and Design Parameters .................... 11 3.1.3 Concept Design Balance Sub-Models ...................................................... 16 3.1.4 Concept Design Feasibility ....................................................................... 21
3.2 Multi-Objective Optimization........................................................................... 22 3.2.1 Pareto Genetic Algorithm (PGA) Overview and Function....................... 22 3.2.2 Optimization Results................................................................................. 23
3.3 Baseline Concept Design and ORD1................................................................ 25 4 CONCEPT DEVELOPMENT......................................................................................................... 26
4.1 Hull Form and Appendages .............................................................................. 26 4.2 Structural Design and Analysis......................................................................... 28
4.2.1 Procedures................................................................................................. 28 4.2.2 Scantlings.................................................................................................. 29 4.2.3 Midships Region Analysis ........................................................................ 32 4.2.4 Load cases and Analysis ........................................................................... 34
4.3 Resistance, Power and Propulsion .................................................................... 38 4.4 Space and Arrangements................................................................................... 41
4.4.1 External ..................................................................................................... 41 4.4.2 Internal Space and Arrangements ............................................................. 45
4.5 Mechanical and Electrical Systems and Machinery Arrangement ................... 49 4.6 Mission Systems ............................................................................................... 50
4.6.1 CONREP................................................................................................... 50 4.6.2 VERTREP................................................................................................. 51
4.7 Manning ............................................................................................................ 51 4.8 Weights and Loading ........................................................................................ 52 4.9 Hydrostatics and Stability ................................................................................. 53
T-AKE PIKE Design Report
v
4.9.1 General...................................................................................................... 53 4.9.2 Intact Stability........................................................................................... 53 4.9.3 Damage Stability....................................................................................... 56
4.10 Seakeeping and Maneuvering ........................................................................... 60 4.11 Cost and Effectiveness...................................................................................... 61
5 CONCLUSIONS AND FUTURE WORK ...................................................................................... 63 5.1 Assessment........................................................................................................ 63 5.2 Recommended Improvements .......................................................................... 63
1
1 Requirements and Plan
1.1 Mission Need This report describes the concept development design of an auxiliary dry cargo carrier (T-AKE). It
responds to the Navy's need for a logistics support ship as described in the Mission Needs Statement, MNS (Appendix A), and directed by the Acquisition Decision Memorandum, ADM (Appendix I).
Logistics support is a fundamental requirement of forward engagement. Combat ships must be supplied with necessary fuel, stores and weapons in forward areas. These supplies must ultimately be transported from friendly ports and bases. Supplies must be provided at sea, when, where and as required without delaying or interfering with primary combat operations.
The current Combat Logistics Force (CLF) capability has been shrinking since 1992 when the five-ship AE 21/23 Class began to be decommissioned. The five-ship AO 177 Class was decommissioned by FY 1999. The T-AE, T-AFS and the aging AOE 1 Classes will be retired/decommissioned at the end of their service life, extended to 35-40 years. Although the size of the entire fleet has been decreasing, unscheduled deployments and operational tempo have remained constant. Without additional capacity, particularly for the shuttle mission, the Navy will not be able to satisfy projected CLF capacity requirements beyond 2010. Taking into account these reasons, the Navy requires a new ship design to perform the following missions:
• Shuttle. Provide logistic lift from sources of supply such as friendly ports, or at sea from specially
equipped merchant ship by consolidation and transfer this cargo (ammunition; food; limited quantities of fuels; repair parts; ship store items and expendable supplies and material) at sea to station ships and other naval ships.
• Station. As a secondary or additional mission, provide direct logistics support to the combat ship within a battle group.
• NCO. Support non-combatant operation (NCO) in conjunction with national directives. With the above requirements, the following constraints apply to the design of this ship.
• The cost of the platforms must be kept to the absolute minimum, acknowledging the rapidly decreasing U.S. defense department budget.
• The platforms must be highly producible, minimizing the time from concept to delivery to the Fleet. The design must be flexible enough to support variants if necessary.
• The platforms must operate within current logistics support capabilities. • Inter-service and Allied C4/I (inter-operability) must be considered in the development of any new
platform or the upgrade of existing assets. • The platform or system must be capable of operating in the following environments:
(1) Open ocean (sea states 0 through 9) and littoral regions; (2) All-Weather, Battle Group Environments; (3) Independent operations.
• The platform must have absolute minimum manning.
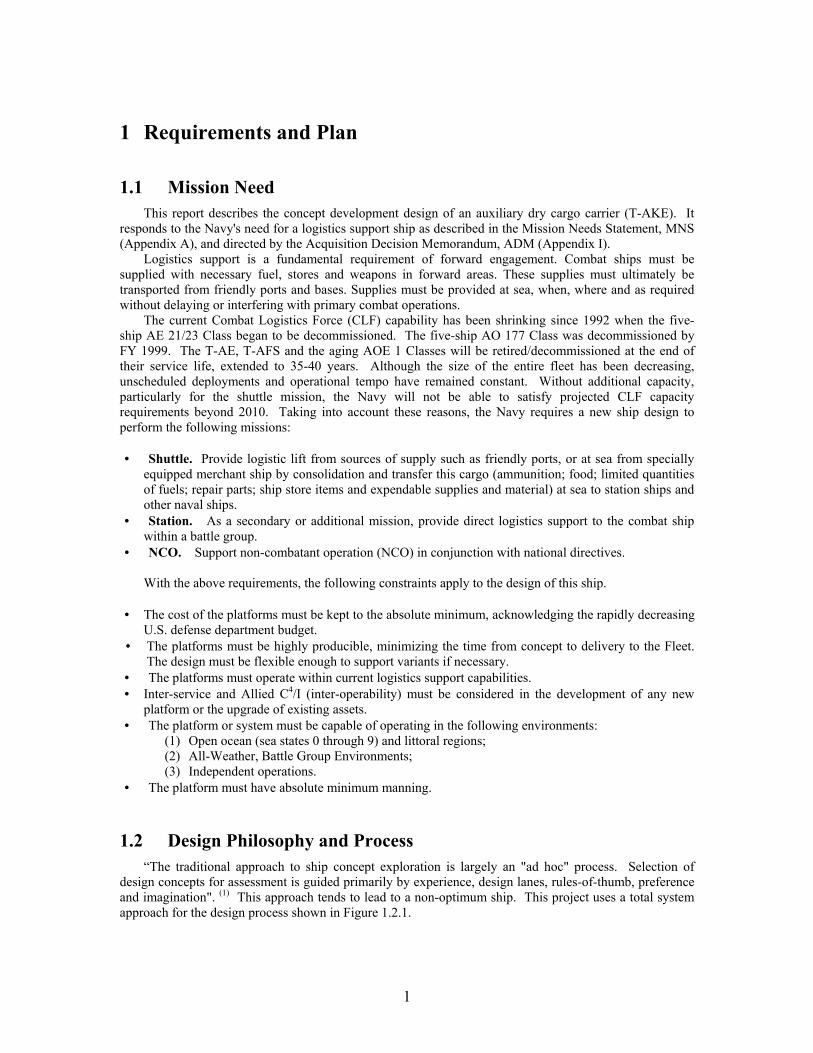
1.2 Design Philosophy and Process “The traditional approach to ship concept exploration is largely an "ad hoc" process. Selection of
design concepts for assessment is guided primarily by experience, design lanes, rules-of-thumb, preference and imagination". (1) This approach tends to lead to a non-optimum ship. This project uses a total system approach for the design process shown in Figure 1.2.1.
2
ConceptExploration
ConceptDevelopment
PreliminaryDesign
ContractDesign
DetailDesign
ExploratoryDesign
Mission orMarketAnalysis
Concept andRequirements
Exploration
TechnologyDevelopment
ConceptDevelopment
and FeasibilityStudiesConcept
BaselineFinalConcept
Figure 1.2.1: Concept Exploration [1]
The first two phases shown in Figure 1.2.1, circled in green, are accomplished in this project. The
concept exploration phase, as described in Chapter 3, includes a mathematical search of design concepts based on a multi-objective optimization process concentrating on cost, risk, and effectiveness.(1) This methodology replaces the more traditional approaches mentioned above. Circled in red is the concept exploration phase, when the processes needed to be performed before concept development may be initiated.
As shown in Figure 1.2.1, the MNS starts the concept exploration phase. The Navy's response to this need is specified by the ADM, which is a part of the Analysis of Alternatives or AOA. These documents direct the concept exploration, so the ship synthesis model can be designed as described in Chapter 3. From this model, the Operational Requirements Document (ORD) is created which starts the concept development phase.
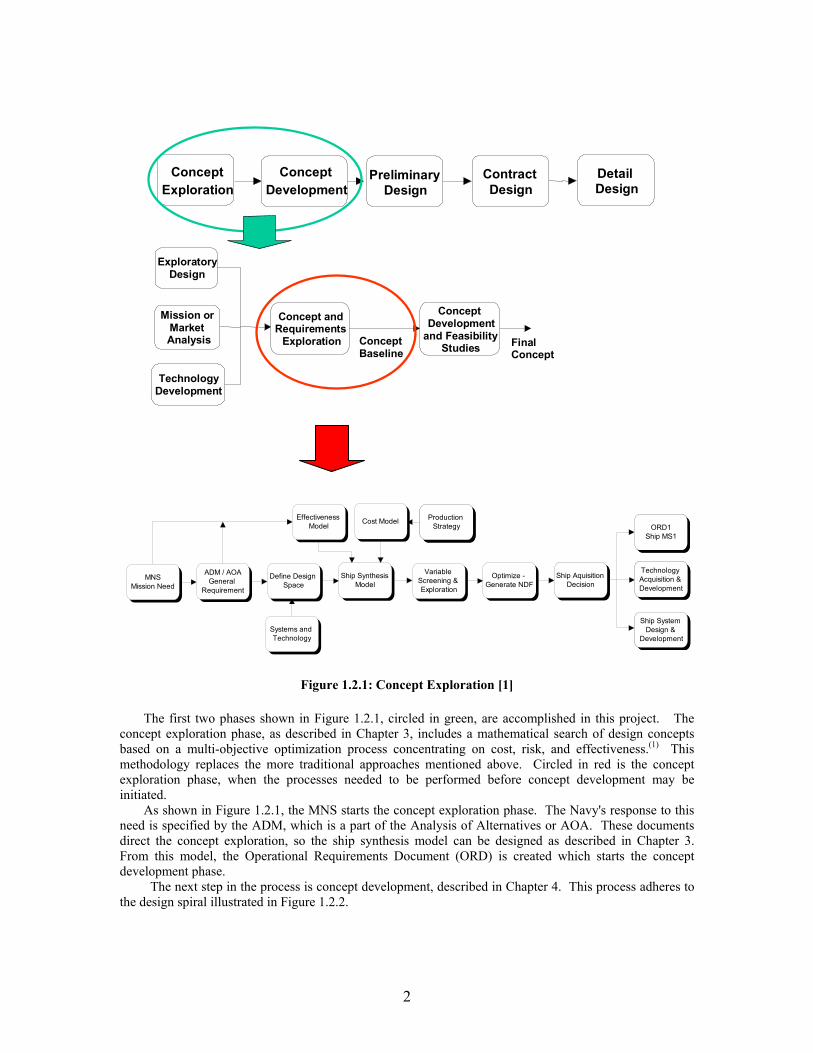
The next step in the process is concept development, described in Chapter 4. This process adheres to the design spiral illustrated in Figure 1.2.2.
MNSMission Need
ADM / AOAGeneral
Requirement
Define Design Space
Ship Synthesis Model
Variable Screening & Exploration
Effectiveness Model
Cost Model
Optimize - Generate NDF
Ship Aquisition Decision
ORD1Ship MS1
Technology Acquisition & Development
Ship System Design &
Development
Production Strategy
Ship Aquisition Decision
ORD1Ship MS1
Technology Acquisition & Development
Ship System Design &
Development
Production Strategy
Systems and Technology
3
Hull Geometry
Space & Arrangements
Weights andStability
Structures
Resistance &Power
HM&E
Seakeeping &Maneuvering
Manning &Automation
Cost, Riskand Effectiveness
Requirements Concept & RequirementsExploration
Figure 1.2.2: Design Spiral [1]
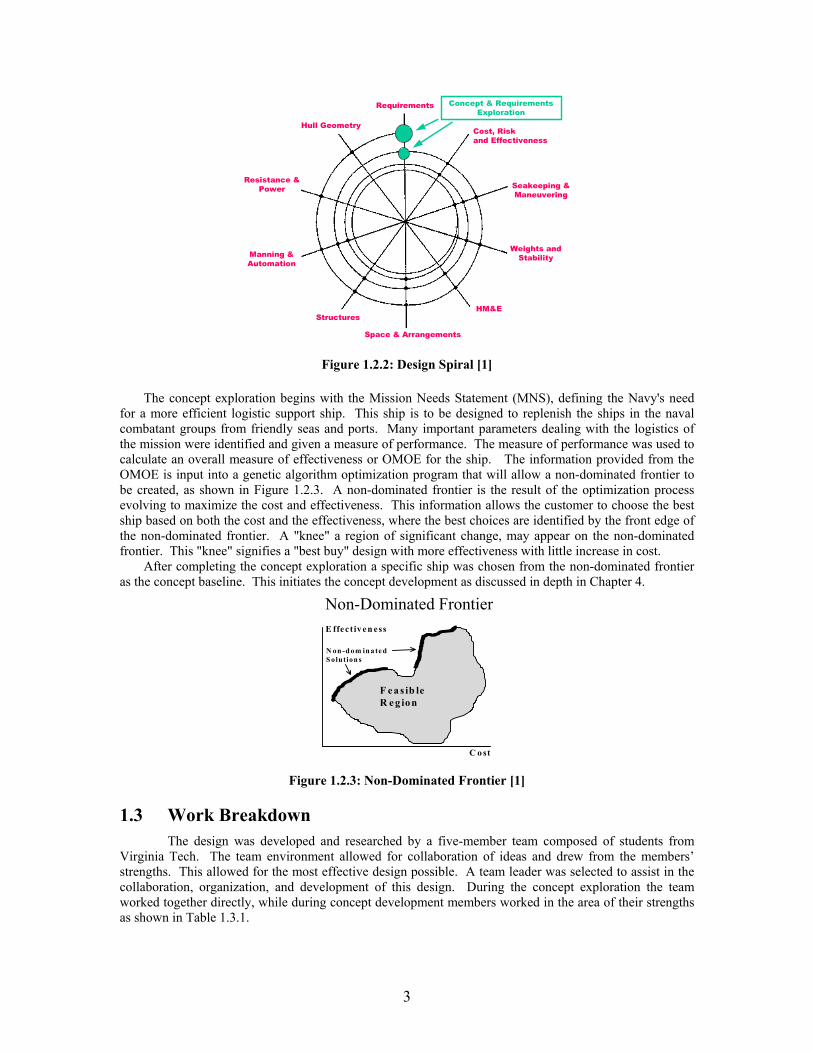
The concept exploration begins with the Mission Needs Statement (MNS), defining the Navy's need for a more efficient logistic support ship. This ship is to be designed to replenish the ships in the naval combatant groups from friendly seas and ports. Many important parameters dealing with the logistics of the mission were identified and given a measure of performance. The measure of performance was used to calculate an overall measure of effectiveness or OMOE for the ship. The information provided from the OMOE is input into a genetic algorithm optimization program that will allow a non-dominated frontier to be created, as shown in Figure 1.2.3. A non-dominated frontier is the result of the optimization process evolving to maximize the cost and effectiveness. This information allows the customer to choose the best ship based on both the cost and the effectiveness, where the best choices are identified by the front edge of the non-dominated frontier. A "knee" a region of significant change, may appear on the non-dominated frontier. This "knee" signifies a "best buy" design with more effectiveness with little increase in cost.
After completing the concept exploration a specific ship was chosen from the non-dominated frontier as the concept baseline. This initiates the concept development as discussed in depth in Chapter 4.
Figure 1.2.3: Non-Dominated Frontier [1]
1.3 Work Breakdown The design was developed and researched by a five-member team composed of students from
Virginia Tech. The team environment allowed for collaboration of ideas and drew from the members’ strengths. This allowed for the most effective design possible. A team leader was selected to assist in the collaboration, organization, and development of this design. During the concept exploration the team worked together directly, while during concept development members worked in the area of their strengths as shown in Table 1.3.1.
Non-Dominated FrontierE ffec t iv en ess
C o st
N on -d om in a te dS olution s
F ea s ib leR eg ion
4
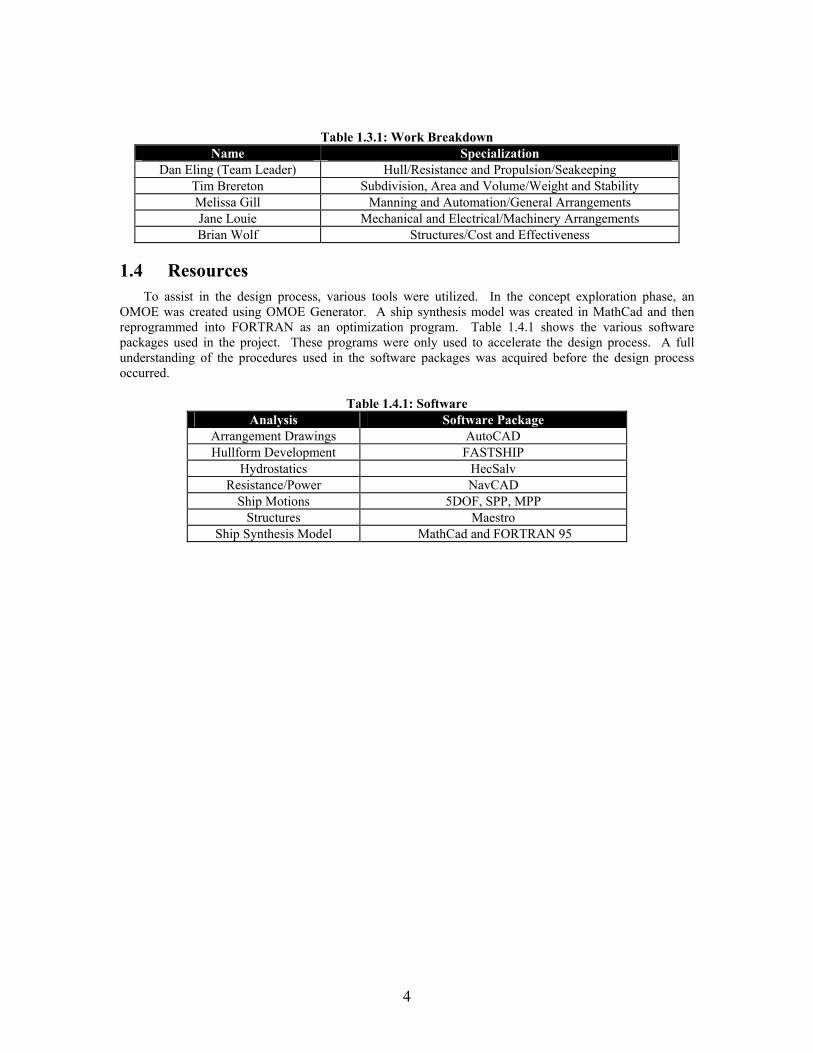
Table 1.3.1: Work Breakdown Name Specialization
Dan Eling (Team Leader) Hull/Resistance and Propulsion/Seakeeping Tim Brereton Subdivision, Area and Volume/Weight and Stability Melissa Gill Manning and Automation/General Arrangements Jane Louie Mechanical and Electrical/Machinery Arrangements Brian Wolf Structures/Cost and Effectiveness
1.4 Resources To assist in the design process, various tools were utilized. In the concept exploration phase, an
OMOE was created using OMOE Generator. A ship synthesis model was created in MathCad and then reprogrammed into FORTRAN as an optimization program. Table 1.4.1 shows the various software packages used in the project. These programs were only used to accelerate the design process. A full understanding of the procedures used in the software packages was acquired before the design process occurred.
Table 1.4.1: Software Analysis Software Package
Arrangement Drawings AutoCAD Hullform Development FASTSHIP
Hydrostatics HecSalv Resistance/Power NavCAD
Ship Motions 5DOF, SPP, MPP Structures Maestro
Ship Synthesis Model MathCad and FORTRAN 95
5
2 Missions, Mission Effectiveness and Cost
2.1 Missions The primary mission of the T-AKE is to provide logistic lift from sources of supply such as friendly
ports, or at sea from specially equipped merchant ships by consolidation, and will transfer this cargo (ammunition; food; limited quantities of fuel; repair parts; ship store items and expendable supplies and material) at sea to station ships and other naval warfare forces.
As a secondary mission, T-AKE may be required to operate in concert with a T-AO Class ship as a substitute station ship to provide direct logistics support to the ships within a battle group. The T-AO Class ship, which carries liquid cargo, and the T-AKE Class ship, which carries dry cargo, when operating together in lieu of a station ship will provide the Battle Group with the product lift equivalent to an AOE 1/6 Class ship.
2.1.1 Mission Concept of Operations
The T-AKE will provide logistic lift from varying supply sources. These sources include friendly ports and specially equipped merchant ships. This cargo, including ammunition, food, limited quantities of fuel, repair parts, ship store items, expendable supplies and material, will be transferred at sea to station ships and other naval forces. Underway replenishment will be performed to existing and planned U.S. and NATO ships by both connected replenishment (CONREP) and vertical replenishment (VERTREP). It will transfer a limited amount of fuel by CONREP or Astern Refueling. These transfers will normally take place outside of combat zones. However, when necessary, escorting combatants will provide defense. The T-AKE has its own self-defense capabilities, but they are limited. It will function as a unit of the Military Sealift Command (MSC) and primarily employ a civilian crew.
2.1.2 Projected Operational Environment and Threat
The projected operational environment for the T-AKE is worldwide replenishment up to Sea State 5 with both day and night operations. In addition the vessel will transit worldwide for the entire year. Loading will be done in friendly ports or in safe blue-water environments. The transfer of supplies directly to a combat ship or to combat supply ships will be done in more exposed blue-water and littoral areas, but not in combat areas. This is due to the fact that a small number of regional powers possess forces that could support a limited blue-water confrontation. At sea, supply ships may face a threat ranging from low-cost conventional weapons to sophisticated non-conventional weapons. This is with the understanding that foreign forces will gain more effective and sophisticated weapon platforms through 2019 by means of indigenous and cooperative industrial development, technology transfers, and outright arms purchases. Some nations are currently upgrading the size and/or quality of their military forces and many have relatively modern weapons. The weapons technology available to these nations is increasing and they are receiving front-line equipment quicker than in the past.
The primary threat will be from aircraft, ships, and submarines, coastal defense units armed with antiship cruise missiles (ASCMs), and air-, ship-, and submarine- launched mines. Secondary but significant threats will also come from submarine-launched torpedoes; fighter-launched tactical air-to-surface missiles (ASMs); other ordnance carried by sea- and land-based aircraft (fixed- and rotary-wing); and chemical, biological and nuclear weapons. While operating in the littoral regions, additional threats from coastal defense sites (artillery, missile, multiple rocket launchers, and possibly torpedoes) and theater ballistic missiles (TBMs) may be encountered. A third tier threat will include preemptive attacks or covert action from special operations forces and/or combat divers. Command, Control and Communications (C 3) electronic attack and electronic support systems may support the weapons threats.
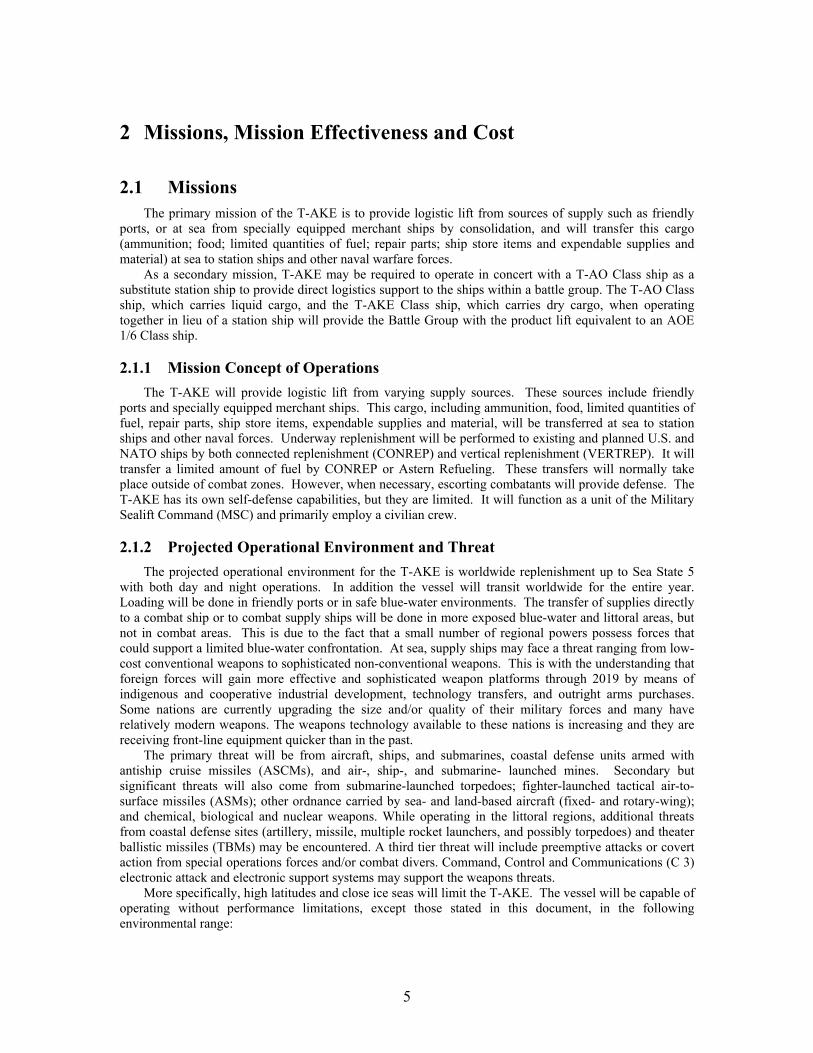
More specifically, high latitudes and close ice seas will limit the T-AKE. The vessel will be capable of operating without performance limitations, except those stated in this document, in the following environmental range:
6
Table 2.1.2.1 Environmental Operating Range Maximum Minimum Outside Dry Bulb 40 oC (104 oF) -18 oC (0 oF) For Topside Equipment 48.9 oC (120 oF) -28.9 oC (-20 oF) Outside Wet Bulb 30 oC (86 oF) -- Seawater 35 oC (95 oF) -2 oC (28.4 oF) Seakeeping Sea State 5 Sea State 0
In addition all systems will retain full capability through a relative humidity range of 0 to 95% and will
be capable of operating through a relative humidity range of 0 to 100%. Taking into account Electromagnetic Environmental Effects (E3) Control, the ship and all its systems
shall be capable of operating in the extreme electromagnetic (EM) environments associated with the ship itself and battle group operations without suffering degradation below established key performance, mobility and survivability thresholds, due to E3. In addition, T-AKE systems shall not degrade the performance of other equipment/systems in expected operational environments.
2.1.3 Mission Scenarios
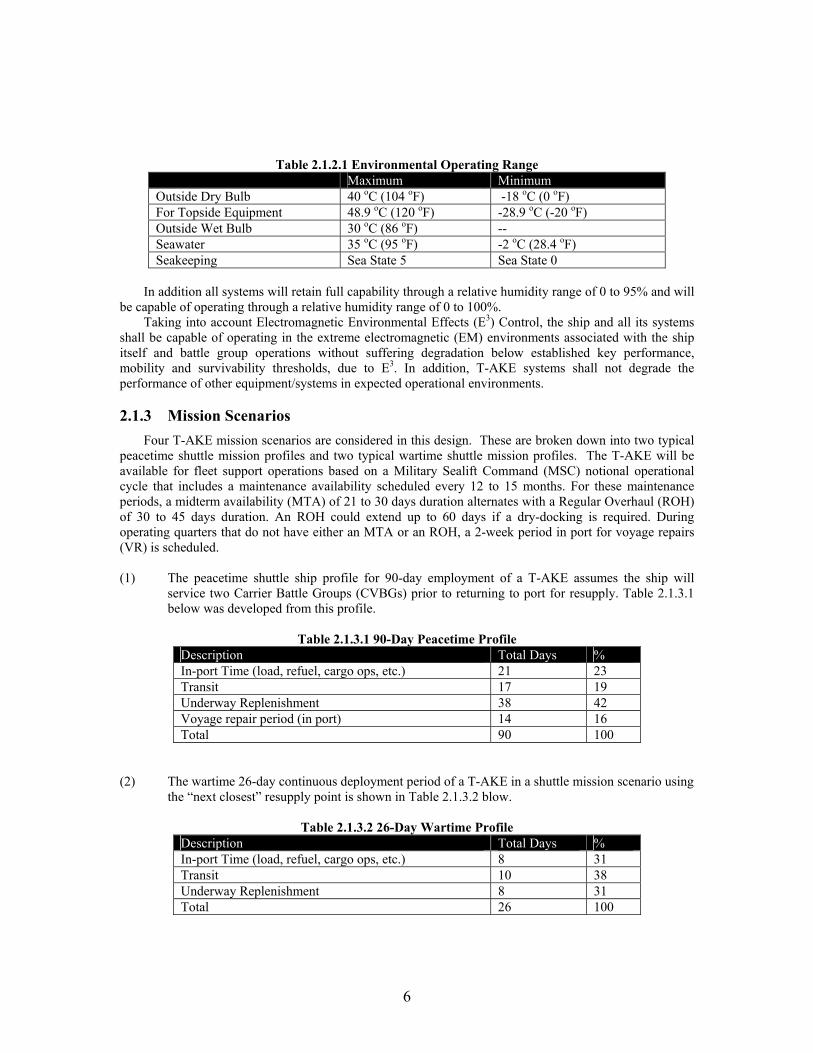
Four T-AKE mission scenarios are considered in this design. These are broken down into two typical peacetime shuttle mission profiles and two typical wartime shuttle mission profiles. The T-AKE will be available for fleet support operations based on a Military Sealift Command (MSC) notional operational cycle that includes a maintenance availability scheduled every 12 to 15 months. For these maintenance periods, a midterm availability (MTA) of 21 to 30 days duration alternates with a Regular Overhaul (ROH) of 30 to 45 days duration. An ROH could extend up to 60 days if a dry-docking is required. During operating quarters that do not have either an MTA or an ROH, a 2-week period in port for voyage repairs (VR) is scheduled. (1) The peacetime shuttle ship profile for 90-day employment of a T-AKE assumes the ship will
service two Carrier Battle Groups (CVBGs) prior to returning to port for resupply. Table 2.1.3.1 below was developed from this profile.
Table 2.1.3.1 90-Day Peacetime Profile
Description Total Days % In-port Time (load, refuel, cargo ops, etc.) 21 23 Transit 17 19 Underway Replenishment 38 42 Voyage repair period (in port) 14 16 Total 90 100
(2) The wartime 26-day continuous deployment period of a T-AKE in a shuttle mission scenario using
the “next closest” resupply point is shown in Table 2.1.3.2 blow.
Table 2.1.3.2 26-Day Wartime Profile Description Total Days % In-port Time (load, refuel, cargo ops, etc.) 8 31 Transit 10 38 Underway Replenishment 8 31 Total 26 100
7
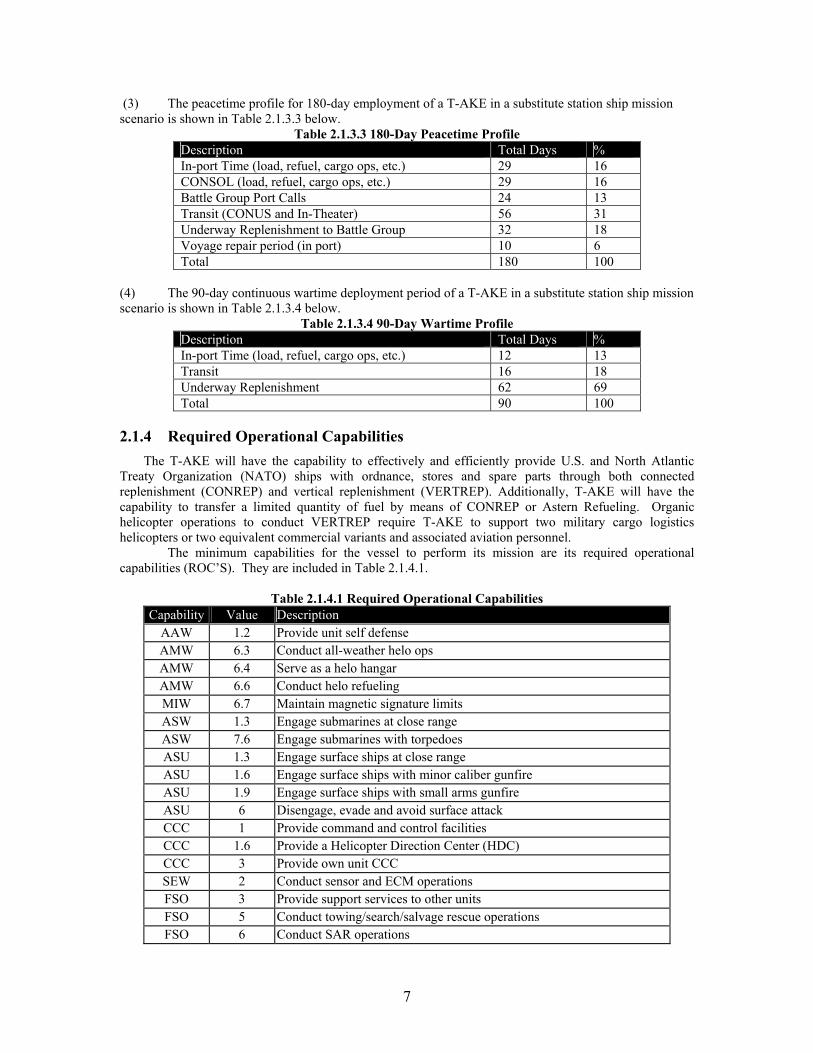
(3) The peacetime profile for 180-day employment of a T-AKE in a substitute station ship mission scenario is shown in Table 2.1.3.3 below.
Table 2.1.3.3 180-Day Peacetime Profile Description Total Days % In-port Time (load, refuel, cargo ops, etc.) 29 16 CONSOL (load, refuel, cargo ops, etc.) 29 16 Battle Group Port Calls 24 13 Transit (CONUS and In-Theater) 56 31 Underway Replenishment to Battle Group 32 18 Voyage repair period (in port) 10 6 Total 180 100
(4) The 90-day continuous wartime deployment period of a T-AKE in a substitute station ship mission scenario is shown in Table 2.1.3.4 below.
Table 2.1.3.4 90-Day Wartime Profile Description Total Days % In-port Time (load, refuel, cargo ops, etc.) 12 13 Transit 16 18 Underway Replenishment 62 69 Total 90 100
2.1.4 Required Operational Capabilities
The T-AKE will have the capability to effectively and efficiently provide U.S. and North Atlantic Treaty Organization (NATO) ships with ordnance, stores and spare parts through both connected replenishment (CONREP) and vertical replenishment (VERTREP). Additionally, T-AKE will have the capability to transfer a limited quantity of fuel by means of CONREP or Astern Refueling. Organic helicopter operations to conduct VERTREP require T-AKE to support two military cargo logistics helicopters or two equivalent commercial variants and associated aviation personnel. The minimum capabilities for the vessel to perform its mission are its required operational capabilities (ROC’S). They are included in Table 2.1.4.1.
Table 2.1.4.1 Required Operational Capabilities Capability Value Description
AAW 1.2 Provide unit self defense AMW 6.3 Conduct all-weather helo ops AMW 6.4 Serve as a helo hangar AMW 6.6 Conduct helo refueling MIW 6.7 Maintain magnetic signature limits ASW 1.3 Engage submarines at close range ASW 7.6 Engage submarines with torpedoes ASU 1.3 Engage surface ships at close range ASU 1.6 Engage surface ships with minor caliber gunfire ASU 1.9 Engage surface ships with small arms gunfire ASU 6 Disengage, evade and avoid surface attack CCC 1 Provide command and control facilities CCC 1.6 Provide a Helicopter Direction Center (HDC) CCC 3 Provide own unit CCC SEW 2 Conduct sensor and ECM operations FSO 3 Provide support services to other units FSO 5 Conduct towing/search/salvage rescue operations FSO 6 Conduct SAR operations
8
FSO 7 Provide explosive ordnance disposal services FSO 8 Conduct port control functions FSO 9 Provide routine health care INT 1 Support/conduct intelligence collection
MOB 1 Steam to design capacity in most fuel-efficient manner MOB 3 Prevent and control damage MOB 3.2 Counter and control NBC contaminants and agents MOB 5 Maneuver in formation MOB 7 Perform seamanship, airmanship and navigation tasks MOB 10 Replenish at sea MOB 12 Maintain health and well being of crew LOG 1 Conduct underway replenishment LOG 2 Transfer/receive cargo and personnel LOG 4 Support other ships and aircraft with supplies, fuel, ordnance, etc
2.2 Objective Attributes 2.2.1 Cost
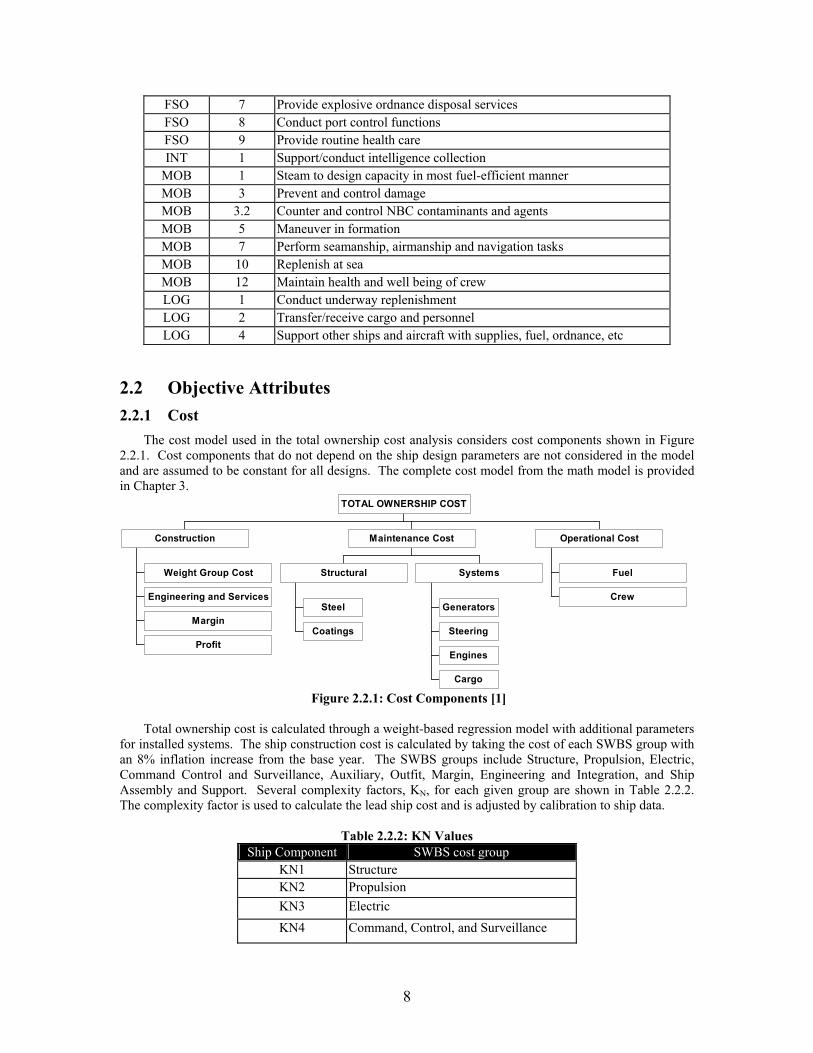
The cost model used in the total ownership cost analysis considers cost components shown in Figure 2.2.1. Cost components that do not depend on the ship design parameters are not considered in the model and are assumed to be constant for all designs. The complete cost model from the math model is provided in Chapter 3.
Weight Group Cost
Engineering and Services
Margin
Profit
Construction
Steel
Coatings
Structural
Generators
Steering
Engines
Cargo
Systems
Maintenance Cost
Fuel
Crew
Operational Cost
TOTAL OWNERSHIP COST
Figure 2.2.1: Cost Components [1]
Total ownership cost is calculated through a weight-based regression model with additional parameters
for installed systems. The ship construction cost is calculated by taking the cost of each SWBS group with an 8% inflation increase from the base year. The SWBS groups include Structure, Propulsion, Electric, Command Control and Surveillance, Auxiliary, Outfit, Margin, Engineering and Integration, and Ship Assembly and Support. Several complexity factors, KN, for each given group are shown in Table 2.2.2. The complexity factor is used to calculate the lead ship cost and is adjusted by calibration to ship data.
Table 2.2.2: KN Values
Ship Component SWBS cost group KN1 Structure KN2 Propulsion KN3 Electric KN4 Command, Control, and Surveillance
9
KN5 Auxiliary KN6 Outfit KN7 Armament KN8 Integration/Engineering
The total construction cost is found by adding each SWBS group with an additional 8% of the total for
shipyard profit. The annual cost is estimated by summing the yearly fuel cost, based on the loading, offloading and transit operating modes, with maintenance and manning costs. Through incorporating dry-docking, painting, and lost time at sea to find the life expectancy of the hull coating, the overhaul cost can be calculated. Lastly, the scrap value of the vessel is calculated for the end of its 40-year service life. The total cost is then calculated by bringing the resale profit, annual cost, overhaul cost and lead ship cost to the base year present worth.
2.2.2 Overall Measure of Effectiveness Model
In order to quantify the customer’s definition of mission effectiveness, and define its functional relationship to ship and ship system performance, designers and engineers require a working model early in the design process. This process includes Overall Measure of Effectiveness (OMOE), Measure of Performance (MOP) and Values of Performance (VOP). In order to determine the OMOE, inputs of 1) defense policy and goals; 2)threat; 3) existing force structure; 4)mission need; 5)mission scenarios; 6)modeling and simulation or war gaming results; and 7) expert opinion must be accounted for. Modeling and regression analysis can be used to determine input values, but also expert opinion can be used for all desired inputs. However, the OMOE function must include all important effectiveness and performance attributes and requires a structured and disciplined process which includes 1)defining the ship mission; 2)identifying, defining and bounding the Required Operational Capabilities (ROC’S), Capability Areas and MOP’s; 3) building a OMOE/MOP hierarchy; and 4)determining MOP values and hierarchy weighting factors.
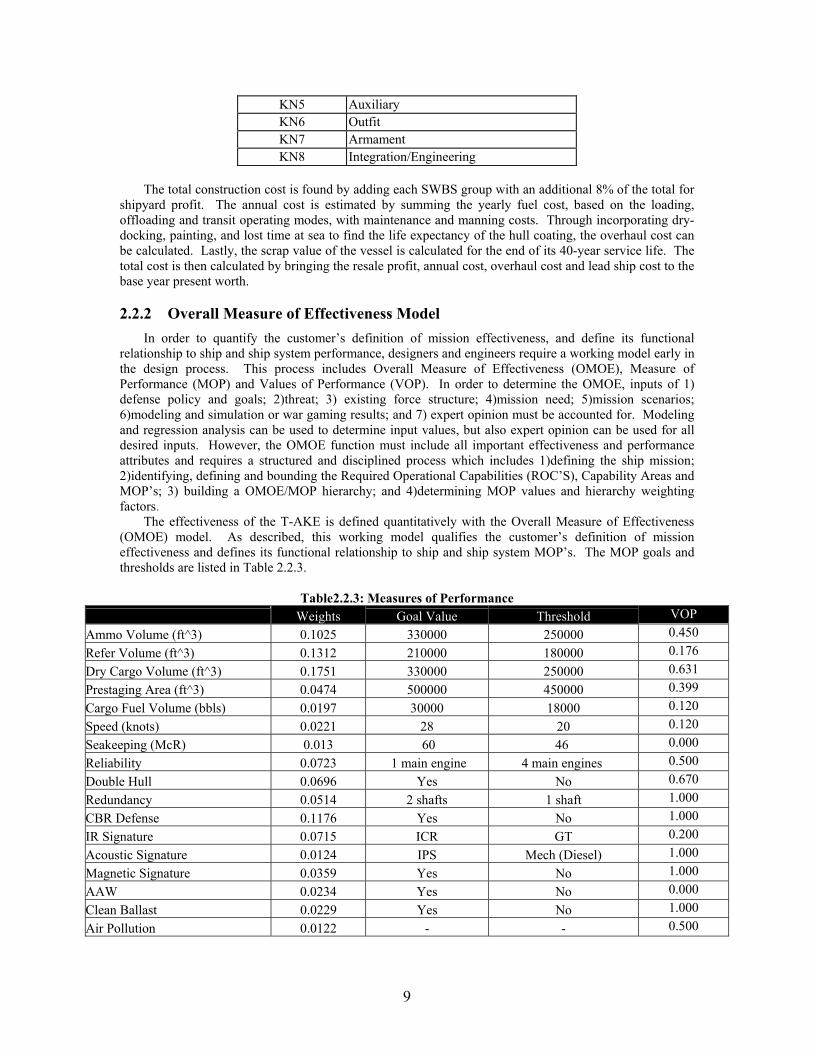
The effectiveness of the T-AKE is defined quantitatively with the Overall Measure of Effectiveness (OMOE) model. As described, this working model qualifies the customer’s definition of mission effectiveness and defines its functional relationship to ship and ship system MOP’s. The MOP goals and thresholds are listed in Table 2.2.3.
Table2.2.3: Measures of Performance
Weights Goal Value Threshold VOP Ammo Volume (ft^3) 0.1025 330000 250000 0.450 Refer Volume (ft^3) 0.1312 210000 180000 0.176 Dry Cargo Volume (ft^3) 0.1751 330000 250000 0.631 Prestaging Area (ft^3) 0.0474 500000 450000 0.399 Cargo Fuel Volume (bbls) 0.0197 30000 18000 0.120 Speed (knots) 0.0221 28 20 0.120 Seakeeping (McR) 0.013 60 46 0.000 Reliability 0.0723 1 main engine 4 main engines 0.500 Double Hull 0.0696 Yes No 0.670 Redundancy 0.0514 2 shafts 1 shaft 1.000 CBR Defense 0.1176 Yes No 1.000 IR Signature 0.0715 ICR GT 0.200 Acoustic Signature 0.0124 IPS Mech (Diesel) 1.000 Magnetic Signature 0.0359 Yes No 1.000 AAW 0.0234 Yes No 0.000 Clean Ballast 0.0229 Yes No 1.000 Air Pollution 0.0122 - - 0.500
10
Although the weight exists for Air Pollution, no goal or threshold values were developed due to unavailability of sufficient background data.
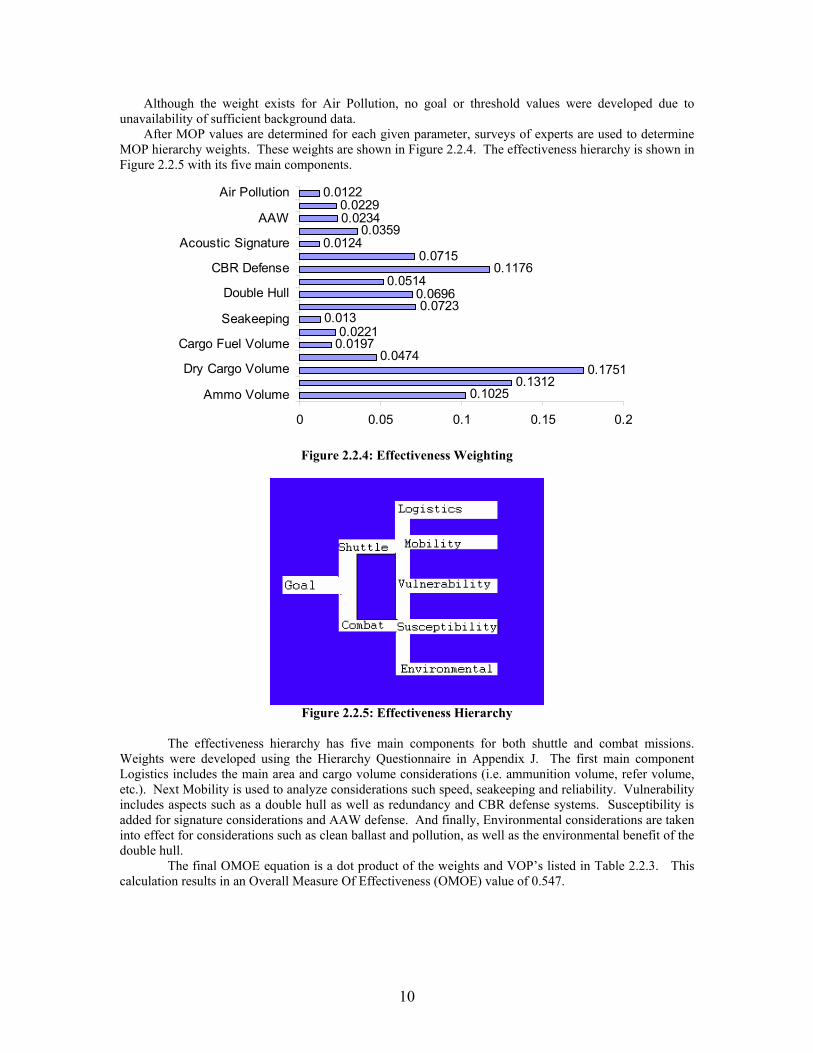
After MOP values are determined for each given parameter, surveys of experts are used to determine MOP hierarchy weights. These weights are shown in Figure 2.2.4. The effectiveness hierarchy is shown in Figure 2.2.5 with its five main components.
0.10250.1312
0.17510.0474
0.01970.0221
0.0130.0723
0.06960.0514
0.11760.0715
0.01240.0359
0.02340.0229
0.0122
0 0.05 0.1 0.15 0.2
Ammo Volume
Dry Cargo Volume
Cargo Fuel Volume
Seakeeping
Double Hull
CBR Defense
Acoustic Signature
AAW
Air Pollution
Figure 2.2.4: Effectiveness Weighting
Figure 2.2.5: Effectiveness Hierarchy
The effectiveness hierarchy has five main components for both shuttle and combat missions. Weights were developed using the Hierarchy Questionnaire in Appendix J. The first main component Logistics includes the main area and cargo volume considerations (i.e. ammunition volume, refer volume, etc.). Next Mobility is used to analyze considerations such speed, seakeeping and reliability. Vulnerability includes aspects such as a double hull as well as redundancy and CBR defense systems. Susceptibility is added for signature considerations and AAW defense. And finally, Environmental considerations are taken into effect for considerations such as clean ballast and pollution, as well as the environmental benefit of the double hull. The final OMOE equation is a dot product of the weights and VOP’s listed in Table 2.2.3. This calculation results in an Overall Measure Of Effectiveness (OMOE) value of 0.547.
11
3 Concept Exploration
3.1 Concept Exploration Model 3.1.1 Model Overview and Function
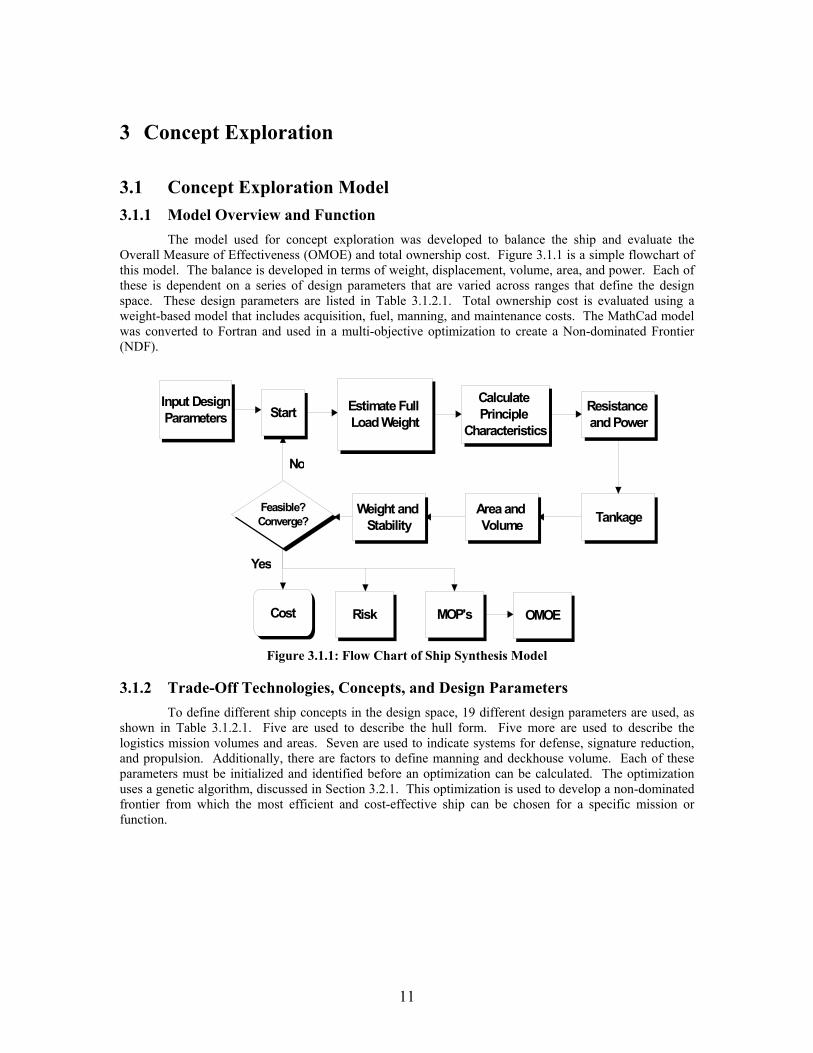
The model used for concept exploration was developed to balance the ship and evaluate the Overall Measure of Effectiveness (OMOE) and total ownership cost. Figure 3.1.1 is a simple flowchart of this model. The balance is developed in terms of weight, displacement, volume, area, and power. Each of these is dependent on a series of design parameters that are varied across ranges that define the design space. These design parameters are listed in Table 3.1.2.1. Total ownership cost is evaluated using a weight-based model that includes acquisition, fuel, manning, and maintenance costs. The MathCad model was converted to Fortran and used in a multi-objective optimization to create a Non-dominated Frontier (NDF).
StartInput Design Parameters
Calculate Principle
Characteristics
Resistance and Power
TankageArea and Volume
Weight and Stability
Feasible?Converge?
No
Yes
Cost
Estimate Full Load Weight
MOP's OMOERisk
Figure 3.1.1: Flow Chart of Ship Synthesis Model
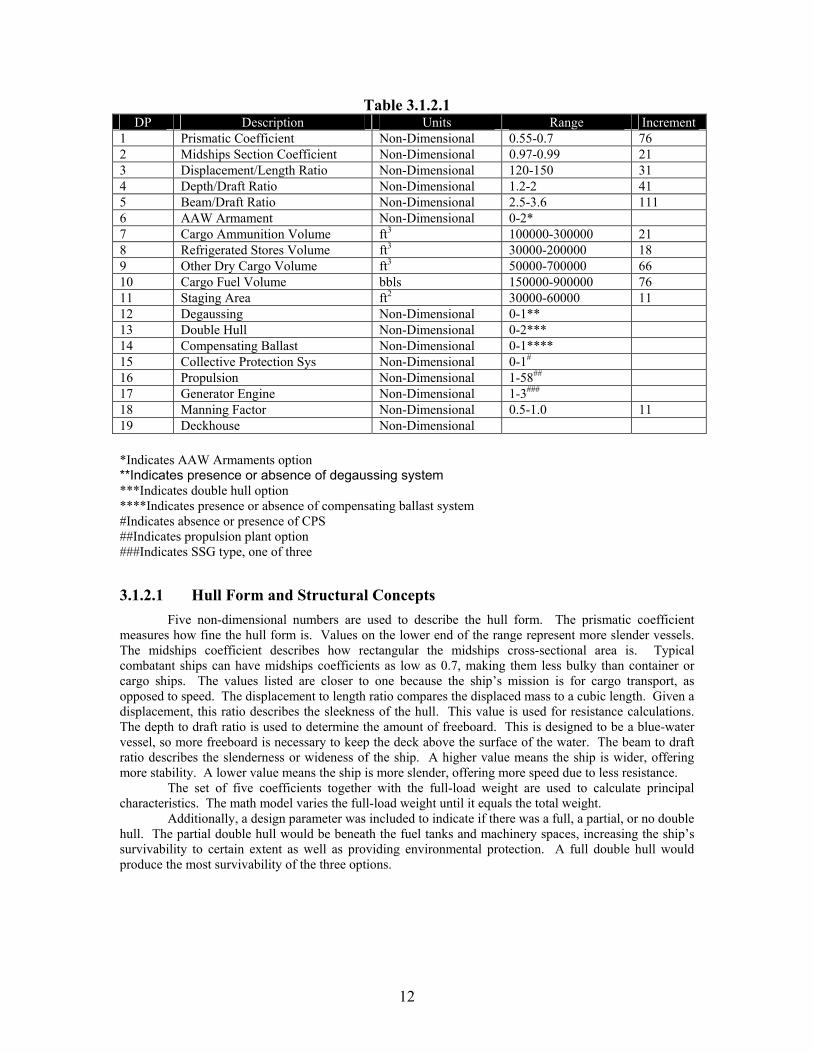
3.1.2 Trade-Off Technologies, Concepts, and Design Parameters To define different ship concepts in the design space, 19 different design parameters are used, as shown in Table 3.1.2.1. Five are used to describe the hull form. Five more are used to describe the logistics mission volumes and areas. Seven are used to indicate systems for defense, signature reduction, and propulsion. Additionally, there are factors to define manning and deckhouse volume. Each of these parameters must be initialized and identified before an optimization can be calculated. The optimization uses a genetic algorithm, discussed in Section 3.2.1. This optimization is used to develop a non-dominated frontier from which the most efficient and cost-effective ship can be chosen for a specific mission or function.
12
Table 3.1.2.1 DP Description Units Range Increment
1 Prismatic Coefficient Non-Dimensional 0.55-0.7 76 2 Midships Section Coefficient Non-Dimensional 0.97-0.99 21 3 Displacement/Length Ratio Non-Dimensional 120-150 31 4 Depth/Draft Ratio Non-Dimensional 1.2-2 41 5 Beam/Draft Ratio Non-Dimensional 2.5-3.6 111 6 AAW Armament Non-Dimensional 0-2* 7 Cargo Ammunition Volume ft3 100000-300000 21 8 Refrigerated Stores Volume ft3 30000-200000 18 9 Other Dry Cargo Volume ft3 50000-700000 66 10 Cargo Fuel Volume bbls 150000-900000 76 11 Staging Area ft2 30000-60000 11 12 Degaussing Non-Dimensional 0-1** 13 Double Hull Non-Dimensional 0-2*** 14 Compensating Ballast Non-Dimensional 0-1**** 15 Collective Protection Sys Non-Dimensional 0-1# 16 Propulsion Non-Dimensional 1-58## 17 Generator Engine Non-Dimensional 1-3### 18 Manning Factor Non-Dimensional 0.5-1.0 11 19 Deckhouse Non-Dimensional *Indicates AAW Armaments option **Indicates presence or absence of degaussing system ***Indicates double hull option ****Indicates presence or absence of compensating ballast system #Indicates absence or presence of CPS ##Indicates propulsion plant option ###Indicates SSG type, one of three
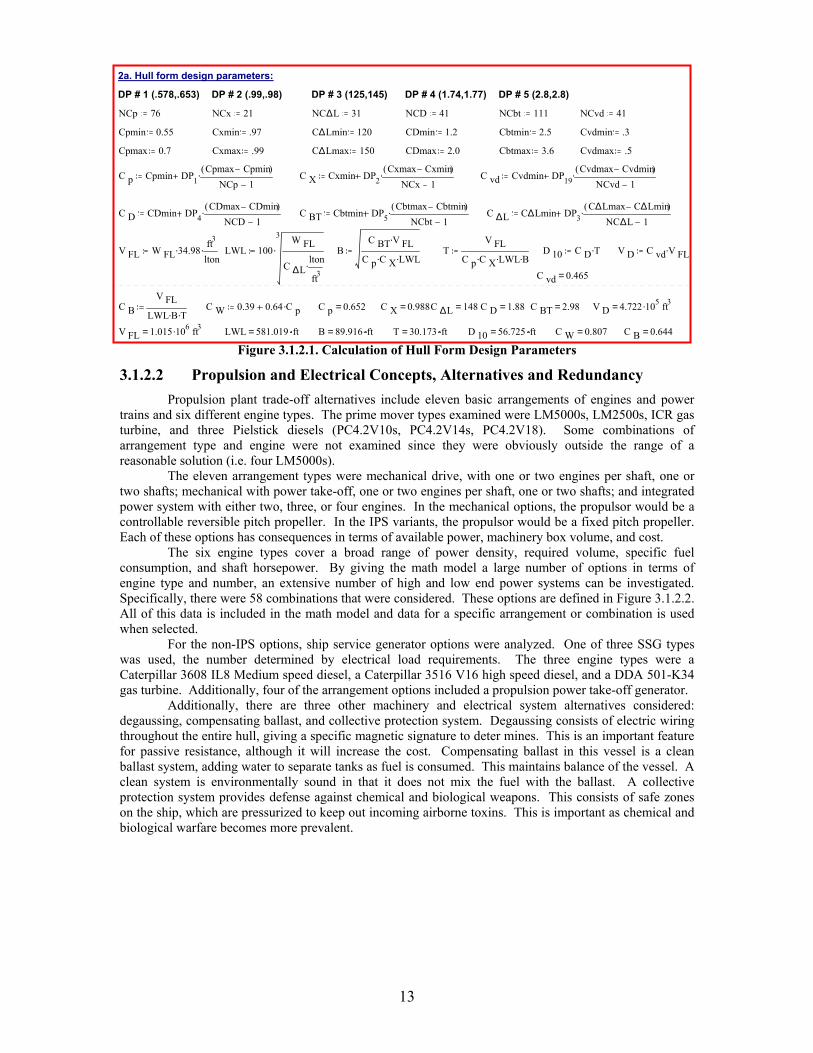
3.1.2.1 Hull Form and Structural Concepts Five non-dimensional numbers are used to describe the hull form. The prismatic coefficient measures how fine the hull form is. Values on the lower end of the range represent more slender vessels. The midships coefficient describes how rectangular the midships cross-sectional area is. Typical combatant ships can have midships coefficients as low as 0.7, making them less bulky than container or cargo ships. The values listed are closer to one because the ship’s mission is for cargo transport, as opposed to speed. The displacement to length ratio compares the displaced mass to a cubic length. Given a displacement, this ratio describes the sleekness of the hull. This value is used for resistance calculations. The depth to draft ratio is used to determine the amount of freeboard. This is designed to be a blue-water vessel, so more freeboard is necessary to keep the deck above the surface of the water. The beam to draft ratio describes the slenderness or wideness of the ship. A higher value means the ship is wider, offering more stability. A lower value means the ship is more slender, offering more speed due to less resistance.
The set of five coefficients together with the full-load weight are used to calculate principal characteristics. The math model varies the full-load weight until it equals the total weight.
Additionally, a design parameter was included to indicate if there was a full, a partial, or no double hull. The partial double hull would be beneath the fuel tanks and machinery spaces, increasing the ship’s survivability to certain extent as well as providing environmental protection. A full double hull would produce the most survivability of the three options.
13
Figure 3.1.2.1. Calculation of Hull Form Design Parameters 3.1.2.2 Propulsion and Electrical Concepts, Alternatives and Redundancy
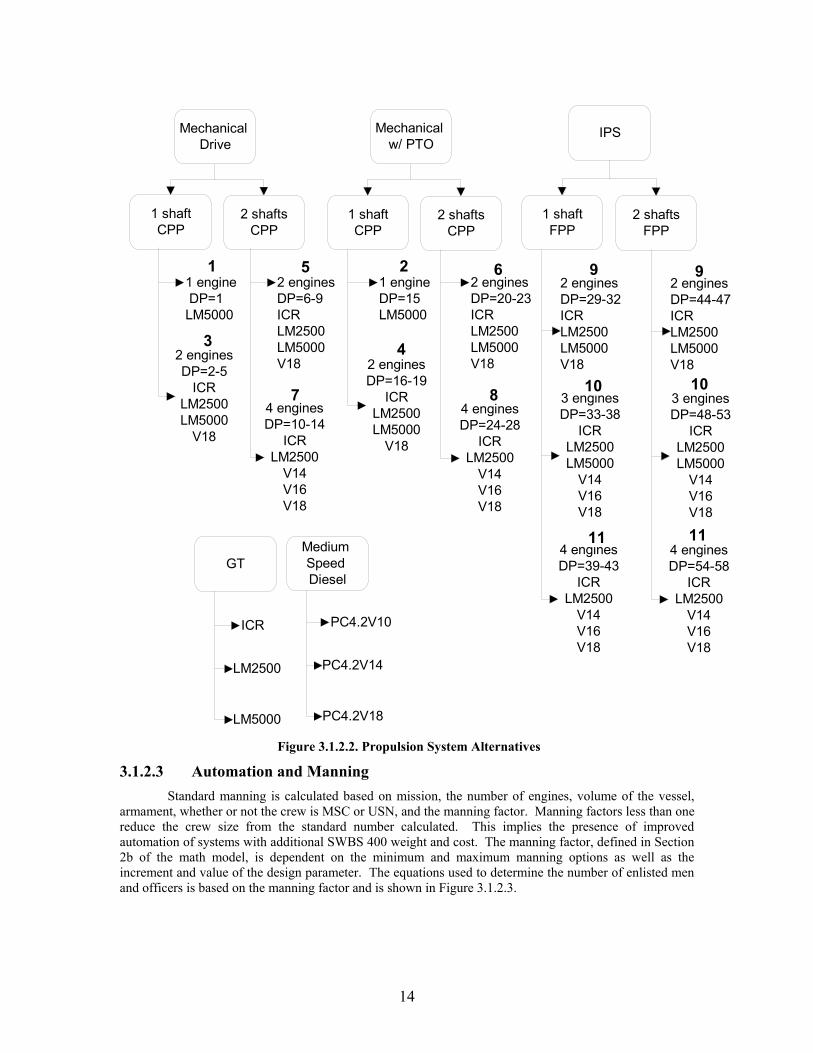
Propulsion plant trade-off alternatives include eleven basic arrangements of engines and power trains and six different engine types. The prime mover types examined were LM5000s, LM2500s, ICR gas turbine, and three Pielstick diesels (PC4.2V10s, PC4.2V14s, PC4.2V18). Some combinations of arrangement type and engine were not examined since they were obviously outside the range of a reasonable solution (i.e. four LM5000s). The eleven arrangement types were mechanical drive, with one or two engines per shaft, one or two shafts; mechanical with power take-off, one or two engines per shaft, one or two shafts; and integrated power system with either two, three, or four engines. In the mechanical options, the propulsor would be a controllable reversible pitch propeller. In the IPS variants, the propulsor would be a fixed pitch propeller. Each of these options has consequences in terms of available power, machinery box volume, and cost.
The six engine types cover a broad range of power density, required volume, specific fuel consumption, and shaft horsepower. By giving the math model a large number of options in terms of engine type and number, an extensive number of high and low end power systems can be investigated. Specifically, there were 58 combinations that were considered. These options are defined in Figure 3.1.2.2. All of this data is included in the math model and data for a specific arrangement or combination is used when selected.
For the non-IPS options, ship service generator options were analyzed. One of three SSG types was used, the number determined by electrical load requirements. The three engine types were a Caterpillar 3608 IL8 Medium speed diesel, a Caterpillar 3516 V16 high speed diesel, and a DDA 501-K34 gas turbine. Additionally, four of the arrangement options included a propulsion power take-off generator.
Additionally, there are three other machinery and electrical system alternatives considered: degaussing, compensating ballast, and collective protection system. Degaussing consists of electric wiring throughout the entire hull, giving a specific magnetic signature to deter mines. This is an important feature for passive resistance, although it will increase the cost. Compensating ballast in this vessel is a clean ballast system, adding water to separate tanks as fuel is consumed. This maintains balance of the vessel. A clean system is environmentally sound in that it does not mix the fuel with the ballast. A collective protection system provides defense against chemical and biological weapons. This consists of safe zones on the ship, which are pressurized to keep out incoming airborne toxins. This is important as chemical and biological warfare becomes more prevalent.
2a. Hull form design parameters:
DP # 1 (.578,.653) DP # 2 (.99,.98) DP # 3 (125,145) DP # 4 (1.74,1.77) DP # 5 (2.8,2.8)
NCp 76 NCx 21 NC∆L 31 NCD 41 NCbt 111 NCvd 41
Cpmin 0.55 Cxmin .97 C∆Lmin 120 CDmin 1.2 Cbtmin 2.5 Cvdmin .3
Cpmax 0.7 Cxmax .99 C∆Lmax 150 CDmax 2.0 Cbtmax 3.6 Cvdmax .5
C p Cpmin DP1Cpmax Cpmin( )
NCp 1. C X Cxmin DP2
Cxmax Cxmin( )NCx 1
. C vd Cvdmin DP19Cvdmax Cvdmin( )
NCvd 1.
C D CDmin DP4CDmax CDmin( )
NCD 1. C BT Cbtmin DP5
Cbtmax Cbtmin( )NCbt 1
. C ∆L C∆Lmin DP3C∆Lmax C∆Lmin( )
NC∆L 1.
V FL W FL 34.98. ft3
lton. LWL 100
3 W FL
C ∆Llton
ft3.
. BC BT V FL.
C p C X. LWL. TV FL
C p C X. LWL. B.D 10 C D T. V D C vd V FL.
C vd 0.465=
C BV FL
LWL B. T.C W 0.39 0.64 C p. C p 0.652= C X 0.988= C ∆L 148= C D 1.88= C BT 2.98= V D 4.722 105. ft3=
V FL 1.015 106. ft3= LWL 581.019 ft= B 89.916 ft= T 30.173 ft= D 10 56.725 ft= C W 0.807= C B 0.644=
14
Mechanical Drive
Mechanical w/ PTO
IPS
1 shaftCPP
2 shaftsCPP
1 shaftCPP
2 shaftsCPP
1 shaftFPP
2 shaftsFPP
GTMedium Speed Diesel
ICR
LM5000
LM2500
PC4.2V10
PC4.2V18
PC4.2V14
1 engine DP=1LM5000
2 enginesDP=2-5
ICRLM2500LM5000
V18
2 enginesDP=6-9ICRLM2500LM5000V18
4 enginesDP=10-14
ICRLM2500
V14V16V18
1 engineDP=15LM5000
2 enginesDP=16-19
ICRLM2500LM5000
V18
2 enginesDP=20-23ICRLM2500LM5000V18
4 enginesDP=24-28
ICRLM2500
V14V16V18
2 enginesDP=29-32ICRLM2500LM5000V18
4 enginesDP=39-43
ICRLM2500
V14V16V18
3 enginesDP=33-38
ICRLM2500LM5000
V14V16V18
2 enginesDP=44-47ICRLM2500LM5000V18
4 enginesDP=54-58
ICRLM2500
V14V16V18
3 enginesDP=48-53
ICRLM2500LM5000
V14V16V18
1 2
3 4
5 6
7 8
9 9
10 10
11 11
Figure 3.1.2.2. Propulsion System Alternatives 3.1.2.3 Automation and Manning
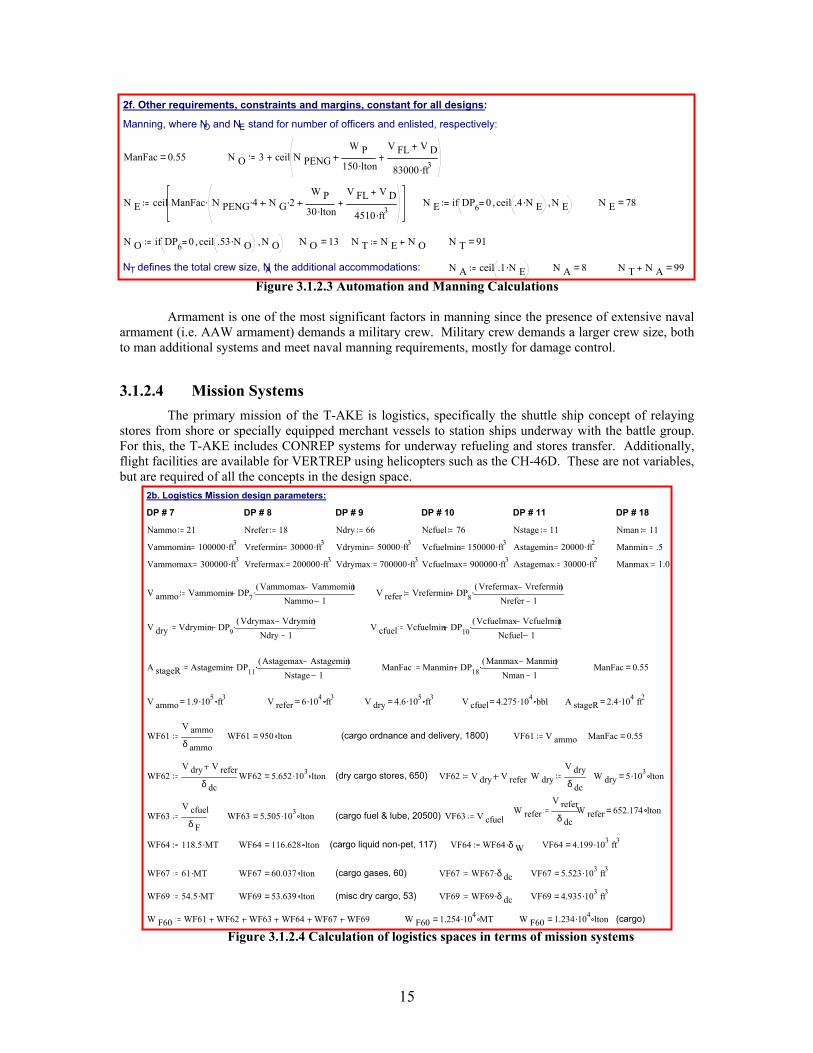
Standard manning is calculated based on mission, the number of engines, volume of the vessel, armament, whether or not the crew is MSC or USN, and the manning factor. Manning factors less than one reduce the crew size from the standard number calculated. This implies the presence of improved automation of systems with additional SWBS 400 weight and cost. The manning factor, defined in Section 2b of the math model, is dependent on the minimum and maximum manning options as well as the increment and value of the design parameter. The equations used to determine the number of enlisted men and officers is based on the manning factor and is shown in Figure 3.1.2.3.
15
Figure 3.1.2.3 Automation and Manning Calculations Armament is one of the most significant factors in manning since the presence of extensive naval
armament (i.e. AAW armament) demands a military crew. Military crew demands a larger crew size, both to man additional systems and meet naval manning requirements, mostly for damage control.
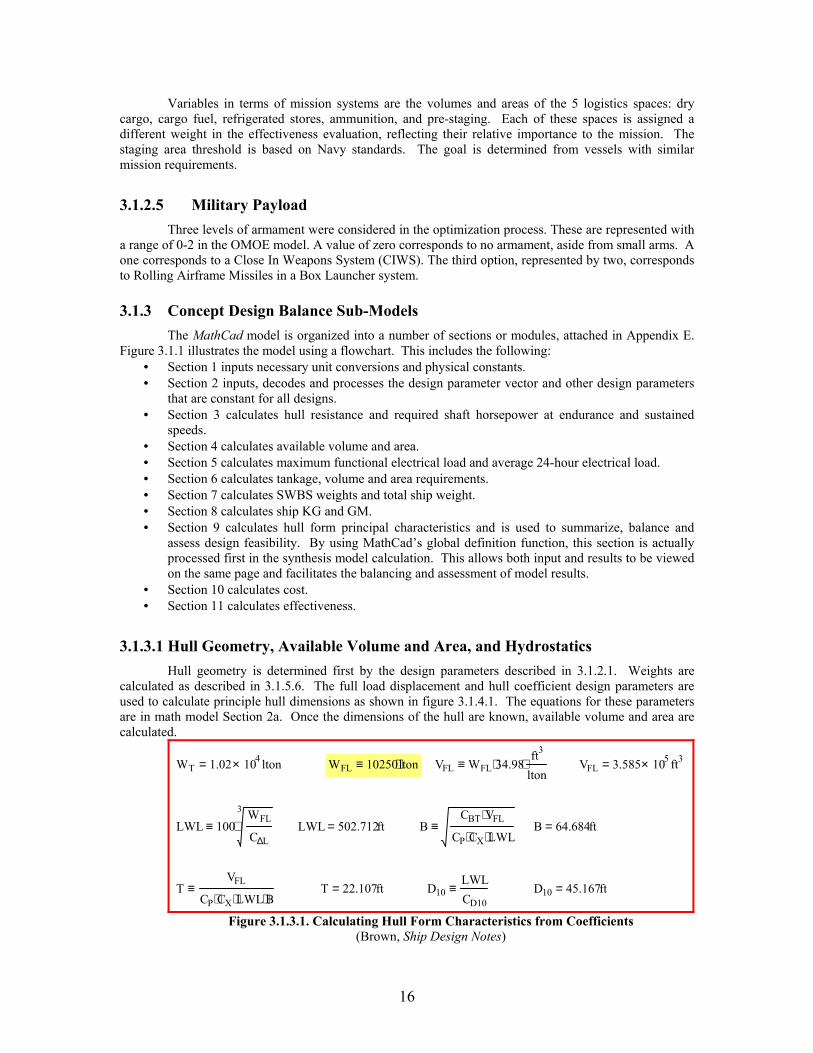
3.1.2.4 Mission Systems The primary mission of the T-AKE is logistics, specifically the shuttle ship concept of relaying
stores from shore or specially equipped merchant vessels to station ships underway with the battle group. For this, the T-AKE includes CONREP systems for underway refueling and stores transfer. Additionally, flight facilities are available for VERTREP using helicopters such as the CH-46D. These are not variables, but are required of all the concepts in the design space.
Figure 3.1.2.4 Calculation of logistics spaces in terms of mission systems
2f. Other requirements, constraints and margins, constant for all designs:
Manning, where NO and NE stand for number of officers and enlisted, respectively:
ManFac 0.55= N O 3 ceil N PENGW P
150 lton.
V FL V D
83000 ft3.
N E ceil ManFac N PENG 4. N G 2.W P
30 lton.
V FL V D
4510 ft3.. N E if DP6 0 ceil .4 N E., N E, N E 78=
N O if DP6 0 ceil .53 N O., N O, N O 13= N T N E N O N T 91=
NT defines the total crew size, NA the additional accommodations: N A ceil .1 N E. N A 8= N T N A 99=
2b. Logistics Mission design parameters:
DP # 7 DP # 8 DP # 9 DP # 10 DP # 11 DP # 18
Nammo 21 Nrefer 18 Ndry 66 Ncfuel 76 Nstage 11 Nman 11
Vammomin 100000 ft3. Vrefermin 30000 ft3. Vdrymin 50000 ft3. Vcfuelmin 150000 ft3. Astagemin 20000 ft2. Manmin .5
Vammomax 300000 ft3. Vrefermax 200000 ft3. Vdrymax 700000 ft3. Vcfuelmax 900000 ft3. Astagemax 30000 ft2. Manmax 1.0
V ammo Vammomin DP7Vammomax Vammomin( )
Nammo 1. V refer Vrefermin DP8
Vrefermax Vrefermin( )Nrefer 1
.
V dry Vdrymin DP9Vdrymax Vdrymin( )
Ndry 1. V cfuel Vcfuelmin DP10
Vcfuelmax Vcfuelmin( )Ncfuel 1
.
A stageR Astagemin DP11Astagemax Astagemin( )
Nstage 1. ManFac Manmin DP18
Manmax Manmin( )Nman 1
. ManFac 0.55=
V ammo 1.9 105. ft3= V refer 6 104. ft3= V dry 4.6 105. ft3= V cfuel 4.275 104. bbl= A stageR 2.4 104. ft2=
WF61V ammoδ ammo
WF61 950 lton= (cargo ordnance and delivery, 1800) VF61 V ammo ManFac 0.55=
WF62V dry V refer
δ dcWF62 5.652 103. lton= (dry cargo stores, 650) VF62 V dry V refer W dry
V dryδ dc
W dry 5 103. lton=
W referV referδ dc
W refer 652.174 lton=WF63V cfuel
δ FWF63 5.505 103. lton= (cargo fuel & lube, 20500) VF63 V cfuel
WF64 118.5 MT. WF64 116.628 lton= (cargo liquid non-pet, 117) VF64 WF64 δ W. VF64 4.199 103. ft3=
WF67 61 MT. WF67 60.037 lton= (cargo gases, 60) VF67 WF67 δ dc. VF67 5.523 103. ft3=
WF69 54.5 MT. WF69 53.639 lton= (misc dry cargo, 53) VF69 WF69 δ dc. VF69 4.935 103. ft3=
W F60 WF61 WF62 WF63 WF64 WF67 WF69 W F60 1.254 104. MT= W F60 1.234 104. lton= (cargo)
16
Variables in terms of mission systems are the volumes and areas of the 5 logistics spaces: dry cargo, cargo fuel, refrigerated stores, ammunition, and pre-staging. Each of these spaces is assigned a different weight in the effectiveness evaluation, reflecting their relative importance to the mission. The staging area threshold is based on Navy standards. The goal is determined from vessels with similar mission requirements.
3.1.2.5 Military Payload Three levels of armament were considered in the optimization process. These are represented with
a range of 0-2 in the OMOE model. A value of zero corresponds to no armament, aside from small arms. A one corresponds to a Close In Weapons System (CIWS). The third option, represented by two, corresponds to Rolling Airframe Missiles in a Box Launcher system. 3.1.3 Concept Design Balance Sub-Models The MathCad model is organized into a number of sections or modules, attached in Appendix E. Figure 3.1.1 illustrates the model using a flowchart. This includes the following:
• Section 1 inputs necessary unit conversions and physical constants. • Section 2 inputs, decodes and processes the design parameter vector and other design parameters
that are constant for all designs. • Section 3 calculates hull resistance and required shaft horsepower at endurance and sustained
speeds. • Section 4 calculates available volume and area. • Section 5 calculates maximum functional electrical load and average 24-hour electrical load. • Section 6 calculates tankage, volume and area requirements. • Section 7 calculates SWBS weights and total ship weight. • Section 8 calculates ship KG and GM. • Section 9 calculates hull form principal characteristics and is used to summarize, balance and
assess design feasibility. By using MathCad’s global definition function, this section is actually processed first in the synthesis model calculation. This allows both input and results to be viewed on the same page and facilitates the balancing and assessment of model results.
• Section 10 calculates cost. • Section 11 calculates effectiveness.
3.1.3.1 Hull Geometry, Available Volume and Area, and Hydrostatics Hull geometry is determined first by the design parameters described in 3.1.2.1. Weights are
calculated as described in 3.1.5.6. The full load displacement and hull coefficient design parameters are used to calculate principle hull dimensions as shown in figure 3.1.4.1. The equations for these parameters are in math model Section 2a. Once the dimensions of the hull are known, available volume and area are calculated.
WT 1.02 104× lton= WFL 10250lton⋅≡ VFL WFL 34.98⋅ft3
lton⋅≡ VFL 3.585 105× ft3=
LWL 1003 WFL
C∆L⋅≡ LWL 502.712ft= B
CBT VFL⋅
CP CX⋅ LWL⋅≡ B 64.684ft=
TVFL
CP CX⋅ LWL⋅ B⋅≡ T 22.107ft= D10
LWLCD10
≡ D10 45.167ft=
Figure 3.1.3.1. Calculating Hull Form Characteristics from Coefficients (Brown, Ship Design Notes)
17
Correlation allowance: C A .0005 (.0005)
S SD 80 ft2. A BTS SD
5.A BT 16 ft2=
C M C XS S LWL 2 T. B( ). C M. .453 .4425 C B. .2862 C M. .003467BT
. .3696 C W.. 2.38A BTC B
.
S S S S SD S 6.464 104. ft2= S S 6.456 104. ft2=
L R 1 C p LWL. L R 202.195 ft= (Run length) C M C X
formfac 1.03 .93T
LWL
.22284 BL R
.92497. .95 C p
.521448. 1 C p .05 .6906.. 2.7S SD
S. formfac 1.212=
Using the ITTC friction expression: Ri
Vi
LWLR Ni
LWLVi
υ SW. C Fi
0.075
log R Ni2 2
C F41.453 10 3.=
R Vi
12
ρ SW. S. C Fi. Vi
2. formfac.R V4
1.294 105. lbf=
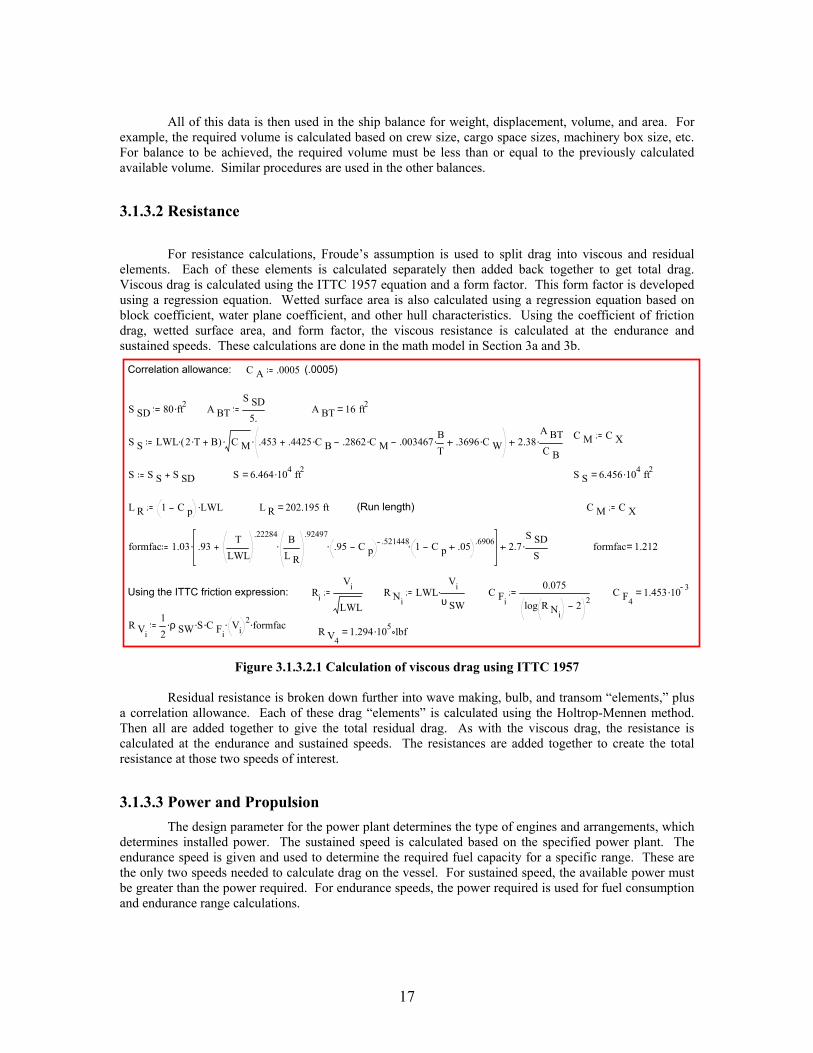
All of this data is then used in the ship balance for weight, displacement, volume, and area. For example, the required volume is calculated based on crew size, cargo space sizes, machinery box size, etc. For balance to be achieved, the required volume must be less than or equal to the previously calculated available volume. Similar procedures are used in the other balances.
3.1.3.2 Resistance
For resistance calculations, Froude’s assumption is used to split drag into viscous and residual elements. Each of these elements is calculated separately then added back together to get total drag. Viscous drag is calculated using the ITTC 1957 equation and a form factor. This form factor is developed using a regression equation. Wetted surface area is also calculated using a regression equation based on block coefficient, water plane coefficient, and other hull characteristics. Using the coefficient of friction drag, wetted surface area, and form factor, the viscous resistance is calculated at the endurance and sustained speeds. These calculations are done in the math model in Section 3a and 3b.
Figure 3.1.3.2.1 Calculation of viscous drag using ITTC 1957
Residual resistance is broken down further into wave making, bulb, and transom “elements,” plus a correlation allowance. Each of these drag “elements” is calculated using the Holtrop-Mennen method. Then all are added together to give the total residual drag. As with the viscous drag, the resistance is calculated at the endurance and sustained speeds. The resistances are added together to create the total resistance at those two speeds of interest.
3.1.3.3 Power and Propulsion The design parameter for the power plant determines the type of engines and arrangements, which determines installed power. The sustained speed is calculated based on the specified power plant. The endurance speed is given and used to determine the required fuel capacity for a specific range. These are the only two speeds needed to calculate drag on the vessel. For sustained speed, the available power must be greater than the power required. For endurance speeds, the power required is used for fuel consumption and endurance range calculations.
18
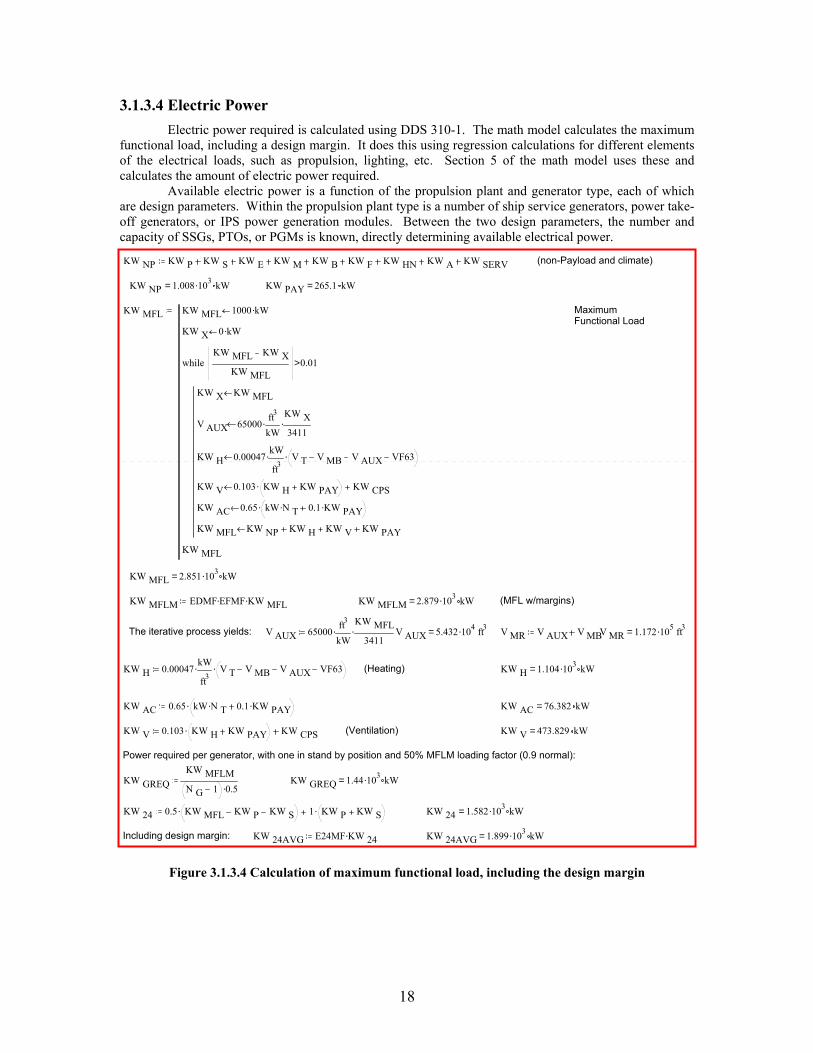
3.1.3.4 Electric Power Electric power required is calculated using DDS 310-1. The math model calculates the maximum functional load, including a design margin. It does this using regression calculations for different elements of the electrical loads, such as propulsion, lighting, etc. Section 5 of the math model uses these and calculates the amount of electric power required. Available electric power is a function of the propulsion plant and generator type, each of which are design parameters. Within the propulsion plant type is a number of ship service generators, power take-off generators, or IPS power generation modules. Between the two design parameters, the number and capacity of SSGs, PTOs, or PGMs is known, directly determining available electrical power.
Figure 3.1.3.4 Calculation of maximum functional load, including the design margin
KW NP KW P KW S KW E KW M KW B KW F KW HN KW A KW SERV (non-Payload and climate)
KW NP 1.008 103. kW= KW PAY 265.1 kW=
KW MFL KW MFL 1000 kW.
KW X 0 kW.
KW X KW MFL
V AUX 65000ft3
kW.
KW X3411
.
KW H 0.00047kW
ft3. V T V MB V AUX VF63.
KW V 0.103 KW H KW PAY. KW CPS
KW AC 0.65 kW N T. 0.1 KW PAY..
KW MFL KW NP KW H KW V KW PAY
KW MFL KW XKW MFL
0.01>while
KW MFL
MaximumFunctional Load
KW MFL 2.851 103. kW=
KW MFLM EDMF EFMF. KW MFL. KW MFLM 2.879 103. kW= (MFL w/margins)
The iterative process yields: V AUX 65000ft3
kW.
KW MFL3411
. V AUX 5.432 104. ft3= V MR V AUX V MBV MR 1.172 105. ft3=
KW H 0.00047kW
ft3. V T V MB V AUX VF63. (Heating) KW H 1.104 103. kW=
KW AC 0.65 kW N T. 0.1 KW PAY.. KW AC 76.382 kW=
KW V 0.103 KW H KW PAY. KW CPS (Ventilation) KW V 473.829 kW=
Power required per generator, with one in stand by position and 50% MFLM loading factor (0.9 normal):
KW GREQKW MFLMN G 1 0.5. KW GREQ 1.44 103. kW=
KW 24 0.5 KW MFL KW P KW S. 1 KW P KW S. KW 24 1.582 103. kW=
Including design margin: KW 24AVG E24MF KW 24. KW 24AVG 1.899 103. kW=
19
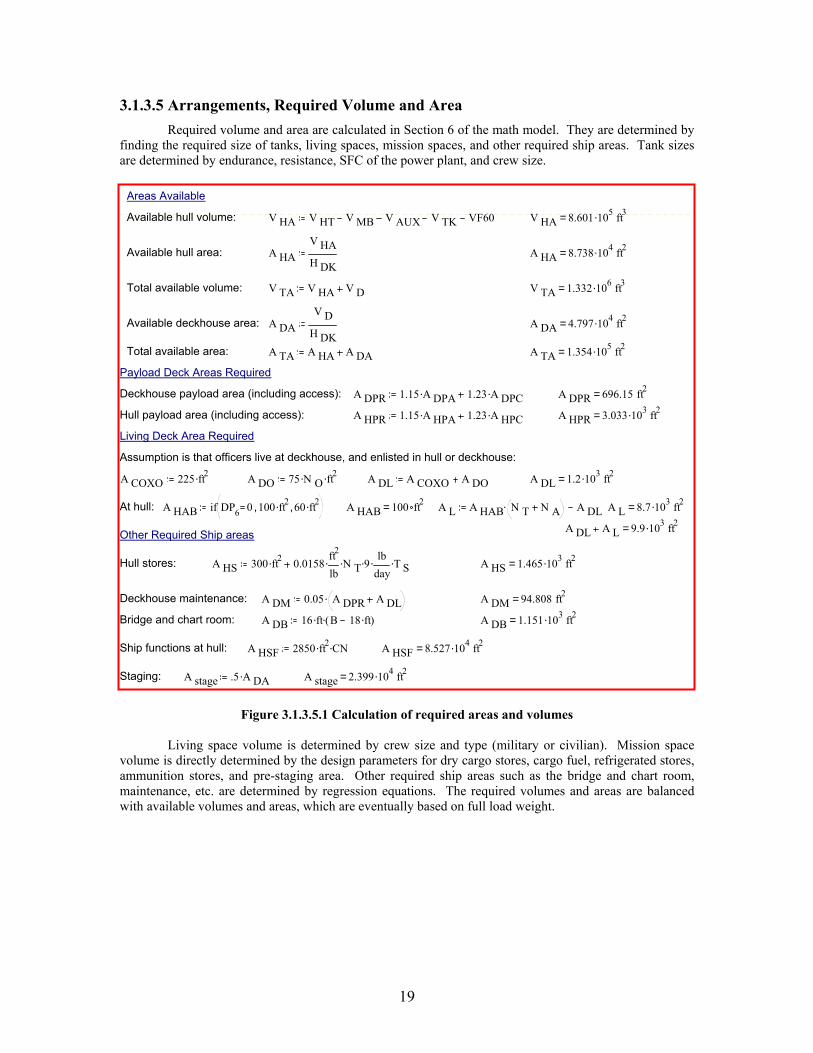
3.1.3.5 Arrangements, Required Volume and Area Required volume and area are calculated in Section 6 of the math model. They are determined by finding the required size of tanks, living spaces, mission spaces, and other required ship areas. Tank sizes are determined by endurance, resistance, SFC of the power plant, and crew size.
Figure 3.1.3.5.1 Calculation of required areas and volumes
Living space volume is determined by crew size and type (military or civilian). Mission space
volume is directly determined by the design parameters for dry cargo stores, cargo fuel, refrigerated stores, ammunition stores, and pre-staging area. Other required ship areas such as the bridge and chart room, maintenance, etc. are determined by regression equations. The required volumes and areas are balanced with available volumes and areas, which are eventually based on full load weight.
Areas Available
Available hull volume: V HA V HT V MB V AUX V TK VF60 V HA 8.601 105. ft3=
Available hull area: A HAV HAH DK
A HA 8.738 104. ft2=
Total available volume: V TA V HA V D V TA 1.332 106. ft3=
Available deckhouse area: A DAV D
H DKA DA 4.797 104. ft2=
Total available area: A TA A HA A DA A TA 1.354 105. ft2=
Payload Deck Areas Required
Deckhouse payload area (including access): A DPR 1.15 A DPA. 1.23 A DPC. A DPR 696.15 ft2=
Hull payload area (including access): A HPR 1.15 A HPA. 1.23 A HPC. A HPR 3.033 103. ft2=
Living Deck Area Required
Assumption is that officers live at deckhouse, and enlisted in hull or deckhouse:
A COXO 225 ft2. A DO 75 N O. ft2. A DL A COXO A DO A DL 1.2 103. ft2=
At hull: A HAB if DP6 0 100 ft2., 60 ft2., A HAB 100 ft2= A L A HAB N T N A. A DL A L 8.7 103. ft2=
A DL A L 9.9 103. ft2=Other Required Ship areas
Hull stores: A HS 300 ft2. 0.0158ft2
lb. N T. 9.
lbday
. T S. A HS 1.465 103. ft2=
Deckhouse maintenance: A DM 0.05 A DPR A DL. A DM 94.808 ft2=
Bridge and chart room: A DB 16 ft. B 18 ft.( ). A DB 1.151 103. ft2=
Ship functions at hull: A HSF 2850 ft2. CN. A HSF 8.527 104. ft2=
Staging: A stage .5 A DA. A stage 2.399 104. ft2=
20
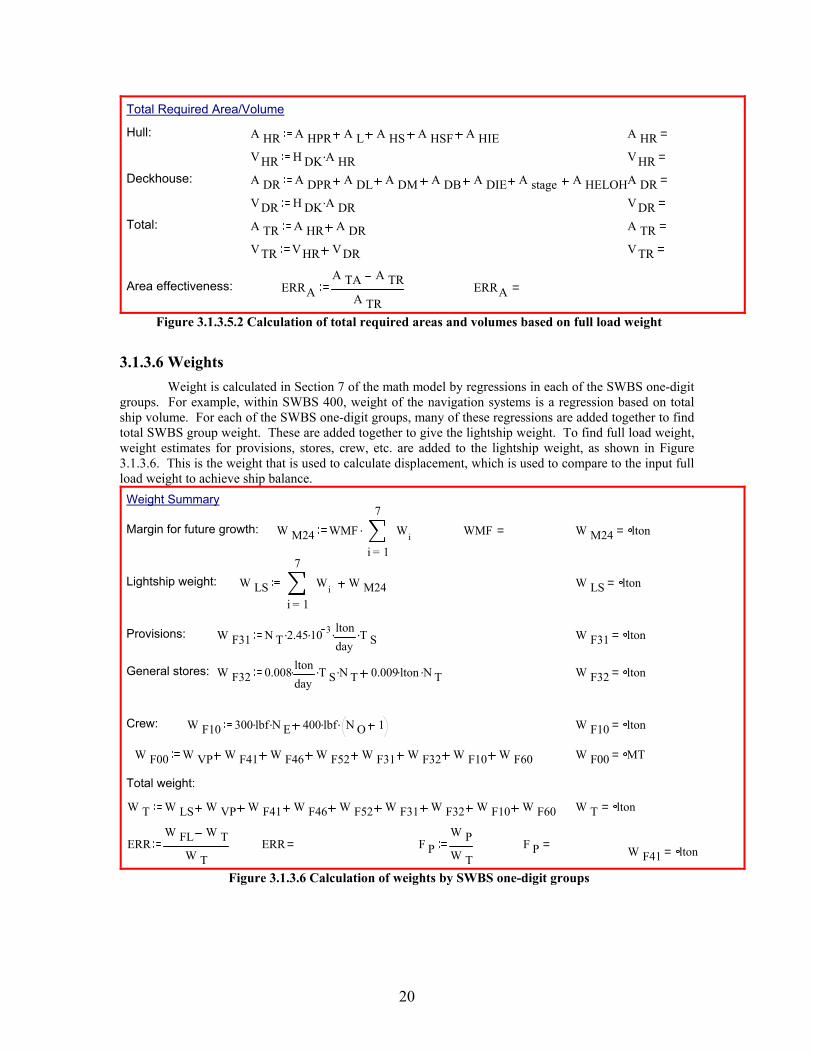
Total Required Area/Volume
Hull: A HR A HPR A L A HS A HSF A HIE A HR =
VHR H DK A HR. V HR =
Deckhouse: A DR A DPR A DL A DM A DB A DIE A stage A HELOHA DR =
VDR H DK A DR. V DR =
Total: A TR A HR A DR A TR =
VTR VHR VDR V TR =
Area effectiveness: ERRAA TA A TR
A TRERRA =
Figure 3.1.3.5.2 Calculation of total required areas and volumes based on full load weight
3.1.3.6 Weights Weight is calculated in Section 7 of the math model by regressions in each of the SWBS one-digit groups. For example, within SWBS 400, weight of the navigation systems is a regression based on total ship volume. For each of the SWBS one-digit groups, many of these regressions are added together to find total SWBS group weight. These are added together to give the lightship weight. To find full load weight, weight estimates for provisions, stores, crew, etc. are added to the lightship weight, as shown in Figure 3.1.3.6. This is the weight that is used to calculate displacement, which is used to compare to the input full load weight to achieve ship balance. Weight Summary
Margin for future growth: W M24 WMF
1
7
i
Wi
=
. WMF = W M24 lton=
Lightship weight: W LS1
7
i
Wi
=
W M24 W LS lton=
Provisions: W F31 N T 2.45. 10 3. ltonday
. T S. W F31 lton=
General stores: W F32 0.008 ltonday
. T S. N T. 0.009 lton. N T. W F32 lton=
Crew: W F10 300 lbf. N E. 400 lbf. N O 1. W F10 lton=
W F00 W VP W F41 W F46 W F52 W F31 W F32 W F10 W F60 W F00 MT=
Total weight:
W T W LS W VP W F41 W F46 W F52 W F31 W F32 W F10 W F60 W T lton=
ERRW FL W T
W TERR = F P
W PW T
F P = W F41 lton=
Figure 3.1.3.6 Calculation of weights by SWBS one-digit groups
21
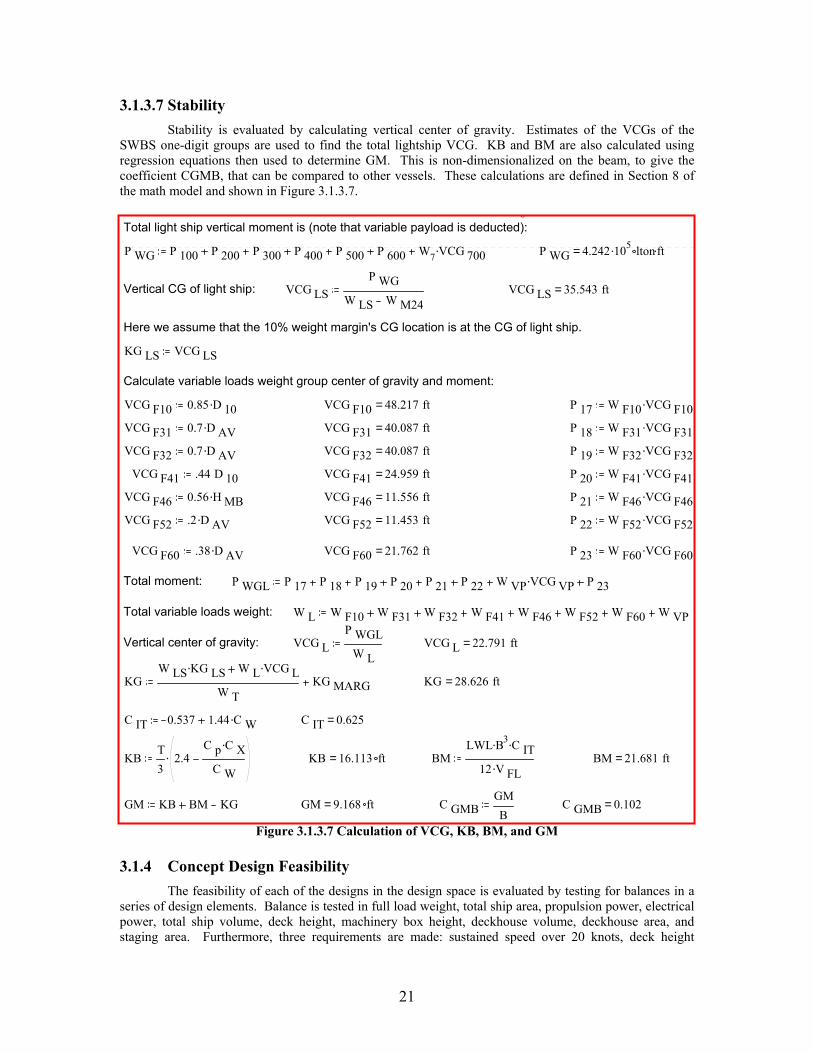
3.1.3.7 Stability Stability is evaluated by calculating vertical center of gravity. Estimates of the VCGs of the SWBS one-digit groups are used to find the total lightship VCG. KB and BM are also calculated using regression equations then used to determine GM. This is non-dimensionalized on the beam, to give the coefficient CGMB, that can be compared to other vessels. These calculations are defined in Section 8 of the math model and shown in Figure 3.1.3.7.
Figure 3.1.3.7 Calculation of VCG, KB, BM, and GM 3.1.4 Concept Design Feasibility The feasibility of each of the designs in the design space is evaluated by testing for balances in a series of design elements. Balance is tested in full load weight, total ship area, propulsion power, electrical power, total ship volume, deck height, machinery box height, deckhouse volume, deckhouse area, and staging area. Furthermore, three requirements are made: sustained speed over 20 knots, deck height
6Total light ship vertical moment is (note that variable payload is deducted):
P WG P 100 P 200 P 300 P 400 P 500 P 600 W7 VCG 700. P WG 4.242 105. lton ft.=
Vertical CG of light ship: VCG LSP WG
W LS W M24VCG LS 35.543 ft=
Here we assume that the 10% weight margin's CG location is at the CG of light ship.
KG LS VCG LS
Calculate variable loads weight group center of gravity and moment:
VCG F10 0.85 D 10. VCG F10 48.217 ft= P 17 W F10 VCG F10.
VCG F31 0.7 D AV. VCG F31 40.087 ft= P 18 W F31 VCG F31.
VCG F32 0.7 D AV. VCG F32 40.087 ft= P 19 W F32 VCG F32.
VCG F41 .44 D 10 VCG F41 24.959 ft= P 20 W F41 VCG F41.
VCG F46 0.56 H MB. VCG F46 11.556 ft= P 21 W F46 VCG F46.
VCG F52 .2 D AV. VCG F52 11.453 ft= P 22 W F52 VCG F52.
VCG F60 .38 D AV. VCG F60 21.762 ft= P 23 W F60 VCG F60.
Total moment: P WGL P 17 P 18 P 19 P 20 P 21 P 22 W VP VCG VP. P 23
Total variable loads weight: W L W F10 W F31 W F32 W F41 W F46 W F52 W F60 W VP
Vertical center of gravity: VCG LP WGL
W LVCG L 22.791 ft=
KGW LS KG LS. W L VCG L.
W TKG MARG KG 28.626 ft=
C IT 0.537 1.44 C W. C IT 0.625=
KBT3
2.4C p C X.
C W. KB 16.113 ft= BM
LWL B3. C IT.
12 V FL. BM 21.681 ft=
GM KB BM KG GM 9.168 ft= C GMBGMB
C GMB 0.102=
22
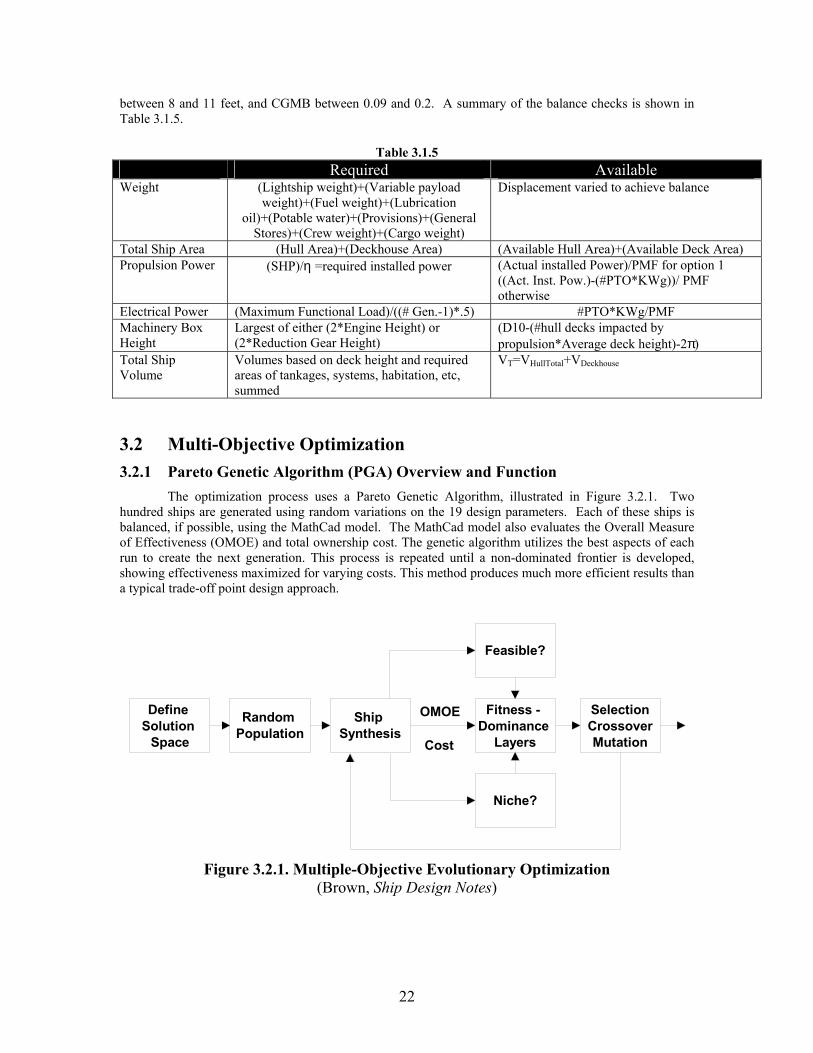
between 8 and 11 feet, and CGMB between 0.09 and 0.2. A summary of the balance checks is shown in Table 3.1.5.
Table 3.1.5 Required Available
Weight (Lightship weight)+(Variable payload weight)+(Fuel weight)+(Lubrication
oil)+(Potable water)+(Provisions)+(General Stores)+(Crew weight)+(Cargo weight)
Displacement varied to achieve balance
Total Ship Area (Hull Area)+(Deckhouse Area) (Available Hull Area)+(Available Deck Area) Propulsion Power (SHP)/η =required installed power (Actual installed Power)/PMF for option 1
((Act. Inst. Pow.)-(#PTO*KWg))/ PMF otherwise
Electrical Power (Maximum Functional Load)/((# Gen.-1)*.5) #PTO*KWg/PMF Machinery Box Height
Largest of either (2*Engine Height) or (2*Reduction Gear Height)
(D10-(#hull decks impacted by propulsion*Average deck height)-2π)
Total Ship Volume
Volumes based on deck height and required areas of tankages, systems, habitation, etc, summed
VT=VHullTotal+VDeckhouse
3.2 Multi-Objective Optimization 3.2.1 Pareto Genetic Algorithm (PGA) Overview and Function The optimization process uses a Pareto Genetic Algorithm, illustrated in Figure 3.2.1. Two hundred ships are generated using random variations on the 19 design parameters. Each of these ships is balanced, if possible, using the MathCad model. The MathCad model also evaluates the Overall Measure of Effectiveness (OMOE) and total ownership cost. The genetic algorithm utilizes the best aspects of each run to create the next generation. This process is repeated until a non-dominated frontier is developed, showing effectiveness maximized for varying costs. This method produces much more efficient results than a typical trade-off point design approach.
Define Solution
Space
Random Population
Ship Synthesis
Feasible?
Niche?
Fitness - Dominance
Layers
SelectionCrossoverMutation
OMOE
Cost
Figure 3.2.1. Multiple-Objective Evolutionary Optimization
(Brown, Ship Design Notes)
23
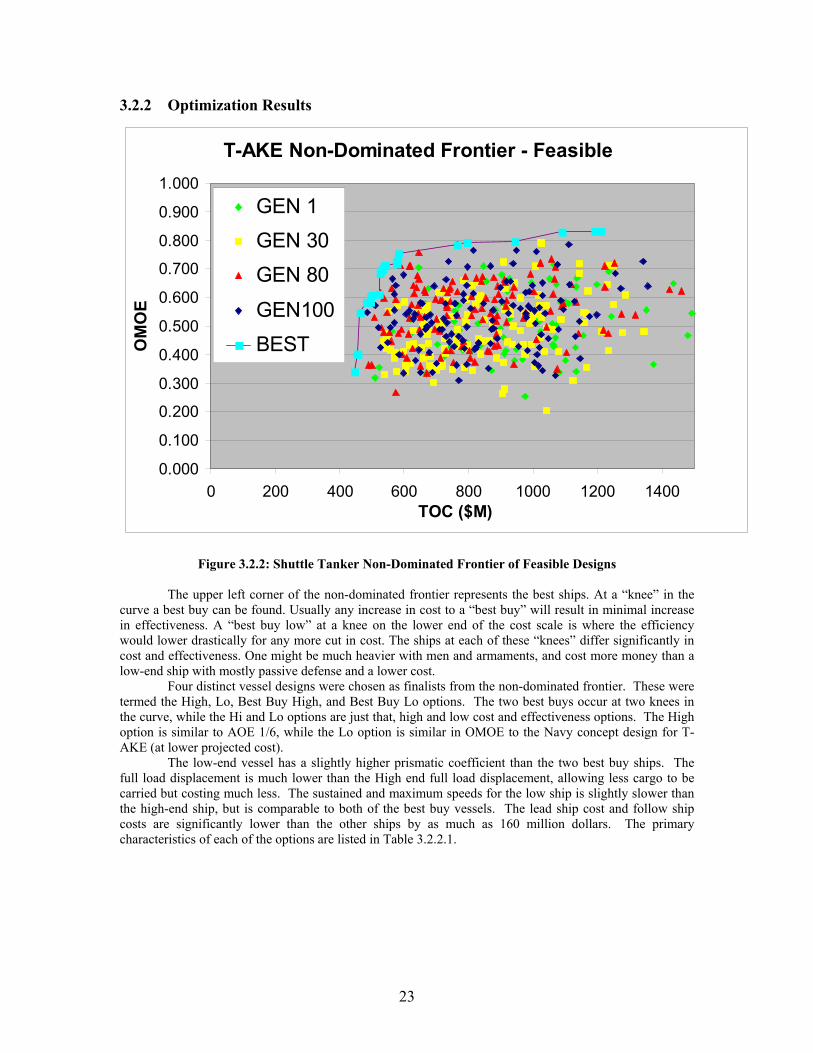
3.2.2 Optimization Results
T-AKE Non-Dominated Frontier - Feasible
0.000
0.100
0.200
0.300
0.400
0.500
0.600
0.700
0.800
0.900
1.000
0 200 400 600 800 1000 1200 1400TOC ($M)
OM
OE
GEN 1GEN 30GEN 80
GEN100BEST
Figure 3.2.2: Shuttle Tanker Non-Dominated Frontier of Feasible Designs
The upper left corner of the non-dominated frontier represents the best ships. At a “knee” in the
curve a best buy can be found. Usually any increase in cost to a “best buy” will result in minimal increase in effectiveness. A “best buy low” at a knee on the lower end of the cost scale is where the efficiency would lower drastically for any more cut in cost. The ships at each of these “knees” differ significantly in cost and effectiveness. One might be much heavier with men and armaments, and cost more money than a low-end ship with mostly passive defense and a lower cost. Four distinct vessel designs were chosen as finalists from the non-dominated frontier. These were termed the High, Lo, Best Buy High, and Best Buy Lo options. The two best buys occur at two knees in the curve, while the Hi and Lo options are just that, high and low cost and effectiveness options. The High option is similar to AOE 1/6, while the Lo option is similar in OMOE to the Navy concept design for T-AKE (at lower projected cost).
The low-end vessel has a slightly higher prismatic coefficient than the two best buy ships. The full load displacement is much lower than the High end full load displacement, allowing less cargo to be carried but costing much less. The sustained and maximum speeds for the low ship is slightly slower than the high-end ship, but is comparable to both of the best buy vessels. The lead ship cost and follow ship costs are significantly lower than the other ships by as much as 160 million dollars. The primary characteristics of each of the options are listed in Table 3.2.2.1.
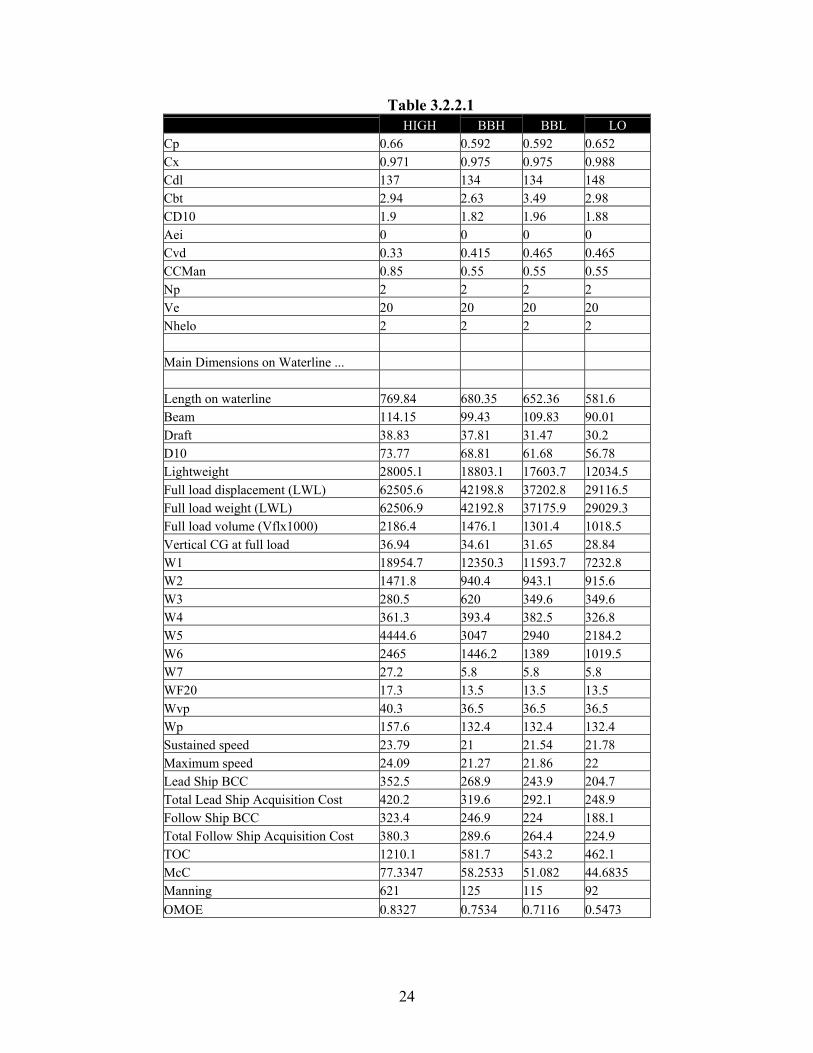
24
Table 3.2.2.1 HIGH BBH BBL LO
Cp 0.66 0.592 0.592 0.652 Cx 0.971 0.975 0.975 0.988 Cdl 137 134 134 148 Cbt 2.94 2.63 3.49 2.98 CD10 1.9 1.82 1.96 1.88 Aei 0 0 0 0 Cvd 0.33 0.415 0.465 0.465 CCMan 0.85 0.55 0.55 0.55 Np 2 2 2 2 Ve 20 20 20 20 Nhelo 2 2 2 2 Main Dimensions on Waterline ... Length on waterline 769.84 680.35 652.36 581.6 Beam 114.15 99.43 109.83 90.01 Draft 38.83 37.81 31.47 30.2 D10 73.77 68.81 61.68 56.78 Lightweight 28005.1 18803.1 17603.7 12034.5 Full load displacement (LWL) 62505.6 42198.8 37202.8 29116.5 Full load weight (LWL) 62506.9 42192.8 37175.9 29029.3 Full load volume (Vflx1000) 2186.4 1476.1 1301.4 1018.5 Vertical CG at full load 36.94 34.61 31.65 28.84 W1 18954.7 12350.3 11593.7 7232.8 W2 1471.8 940.4 943.1 915.6 W3 280.5 620 349.6 349.6 W4 361.3 393.4 382.5 326.8 W5 4444.6 3047 2940 2184.2 W6 2465 1446.2 1389 1019.5 W7 27.2 5.8 5.8 5.8 WF20 17.3 13.5 13.5 13.5 Wvp 40.3 36.5 36.5 36.5 Wp 157.6 132.4 132.4 132.4 Sustained speed 23.79 21 21.54 21.78 Maximum speed 24.09 21.27 21.86 22 Lead Ship BCC 352.5 268.9 243.9 204.7 Total Lead Ship Acquisition Cost 420.2 319.6 292.1 248.9 Follow Ship BCC 323.4 246.9 224 188.1 Total Follow Ship Acquisition Cost 380.3 289.6 264.4 224.9 TOC 1210.1 581.7 543.2 462.1 McC 77.3347 58.2533 51.082 44.6835 Manning 621 125 115 92 OMOE 0.8327 0.7534 0.7116 0.5473
25
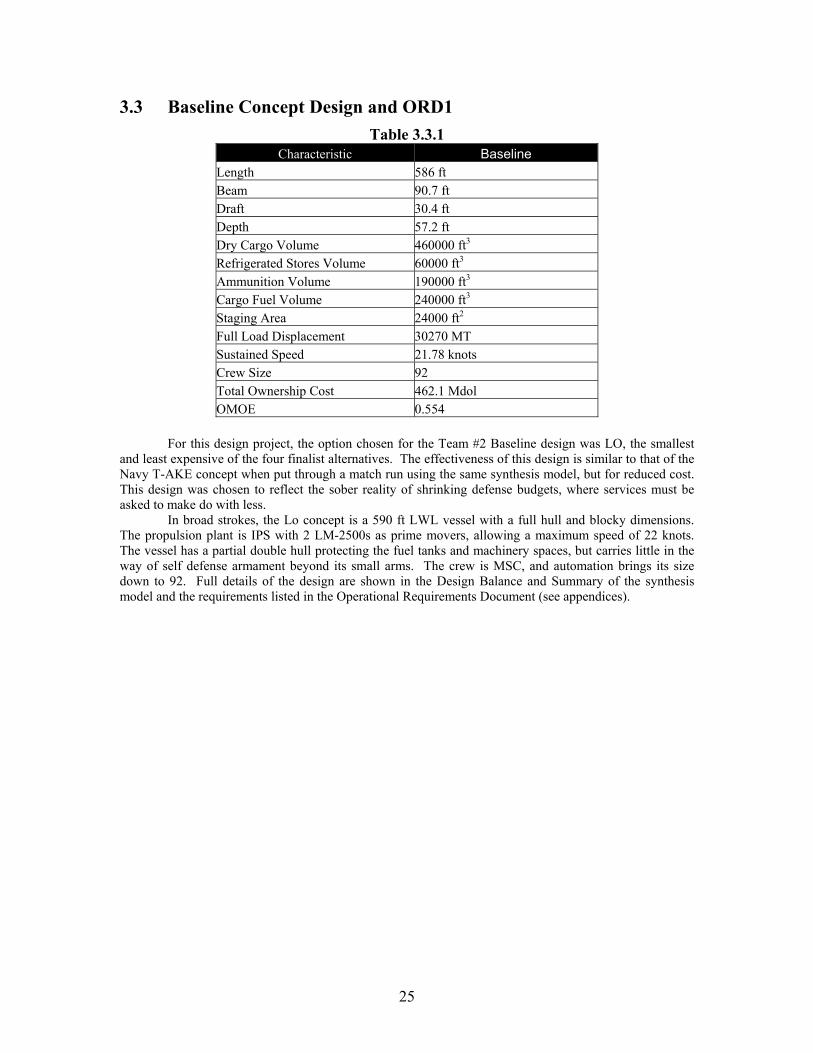
3.3 Baseline Concept Design and ORD1 Table 3.3.1
Characteristic Baseline Length 586 ft Beam 90.7 ft Draft 30.4 ft Depth 57.2 ft Dry Cargo Volume 460000 ft3
Refrigerated Stores Volume 60000 ft3
Ammunition Volume 190000 ft3 Cargo Fuel Volume 240000 ft3 Staging Area 24000 ft2 Full Load Displacement 30270 MT Sustained Speed 21.78 knots Crew Size 92 Total Ownership Cost 462.1 Mdol OMOE 0.554
For this design project, the option chosen for the Team #2 Baseline design was LO, the smallest and least expensive of the four finalist alternatives. The effectiveness of this design is similar to that of the Navy T-AKE concept when put through a match run using the same synthesis model, but for reduced cost. This design was chosen to reflect the sober reality of shrinking defense budgets, where services must be asked to make do with less. In broad strokes, the Lo concept is a 590 ft LWL vessel with a full hull and blocky dimensions. The propulsion plant is IPS with 2 LM-2500s as prime movers, allowing a maximum speed of 22 knots. The vessel has a partial double hull protecting the fuel tanks and machinery spaces, but carries little in the way of self defense armament beyond its small arms. The crew is MSC, and automation brings its size down to 92. Full details of the design are shown in the Design Balance and Summary of the synthesis model and the requirements listed in the Operational Requirements Document (see appendices).
26
4 Concept Development
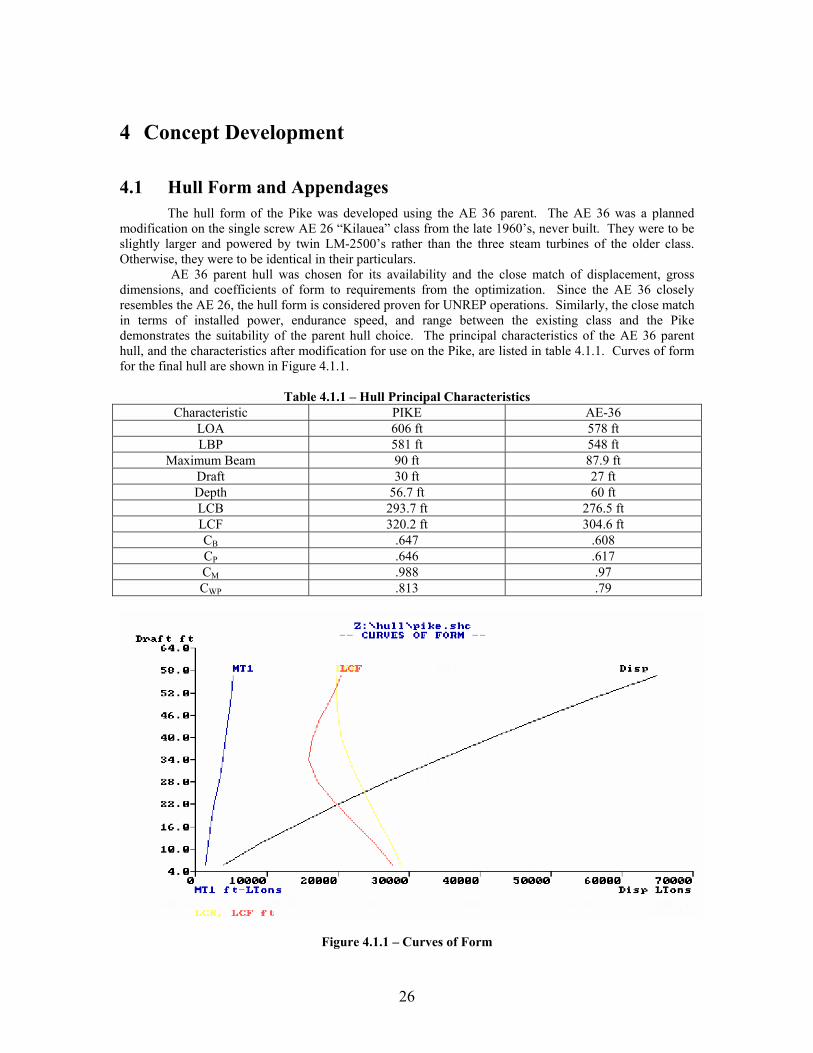
4.1 Hull Form and Appendages The hull form of the Pike was developed using the AE 36 parent. The AE 36 was a planned modification on the single screw AE 26 “Kilauea” class from the late 1960’s, never built. They were to be slightly larger and powered by twin LM-2500’s rather than the three steam turbines of the older class. Otherwise, they were to be identical in their particulars. AE 36 parent hull was chosen for its availability and the close match of displacement, gross dimensions, and coefficients of form to requirements from the optimization. Since the AE 36 closely resembles the AE 26, the hull form is considered proven for UNREP operations. Similarly, the close match in terms of installed power, endurance speed, and range between the existing class and the Pike demonstrates the suitability of the parent hull choice. The principal characteristics of the AE 36 parent hull, and the characteristics after modification for use on the Pike, are listed in table 4.1.1. Curves of form for the final hull are shown in Figure 4.1.1.
Table 4.1.1 – Hull Principal Characteristics Characteristic PIKE AE-36
LOA 606 ft 578 ft LBP 581 ft 548 ft
Maximum Beam 90 ft 87.9 ft Draft 30 ft 27 ft Depth 56.7 ft 60 ft LCB 293.7 ft 276.5 ft LCF 320.2 ft 304.6 ft CB .647 .608 CP .646 .617 CM .988 .97 CWP .813 .79
Figure 4.1.1 – Curves of Form
27
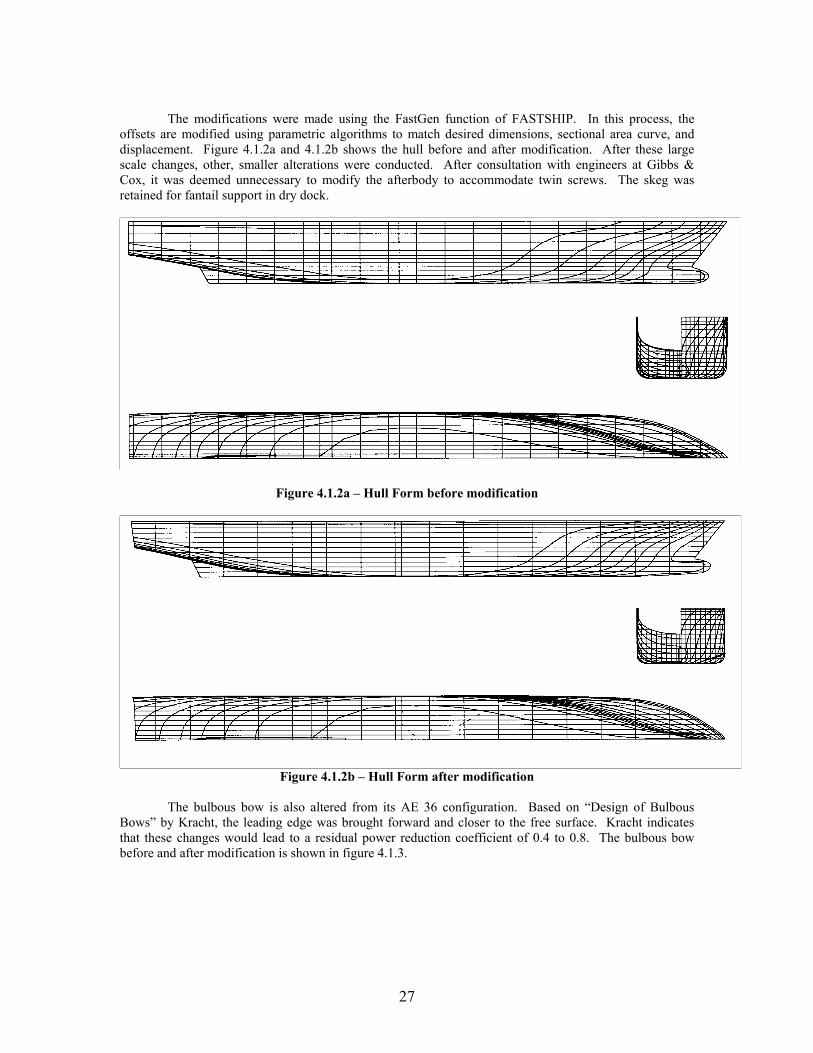
The modifications were made using the FastGen function of FASTSHIP. In this process, the offsets are modified using parametric algorithms to match desired dimensions, sectional area curve, and displacement. Figure 4.1.2a and 4.1.2b shows the hull before and after modification. After these large scale changes, other, smaller alterations were conducted. After consultation with engineers at Gibbs & Cox, it was deemed unnecessary to modify the afterbody to accommodate twin screws. The skeg was retained for fantail support in dry dock.
Figure 4.1.2a – Hull Form before modification
Figure 4.1.2b – Hull Form after modification
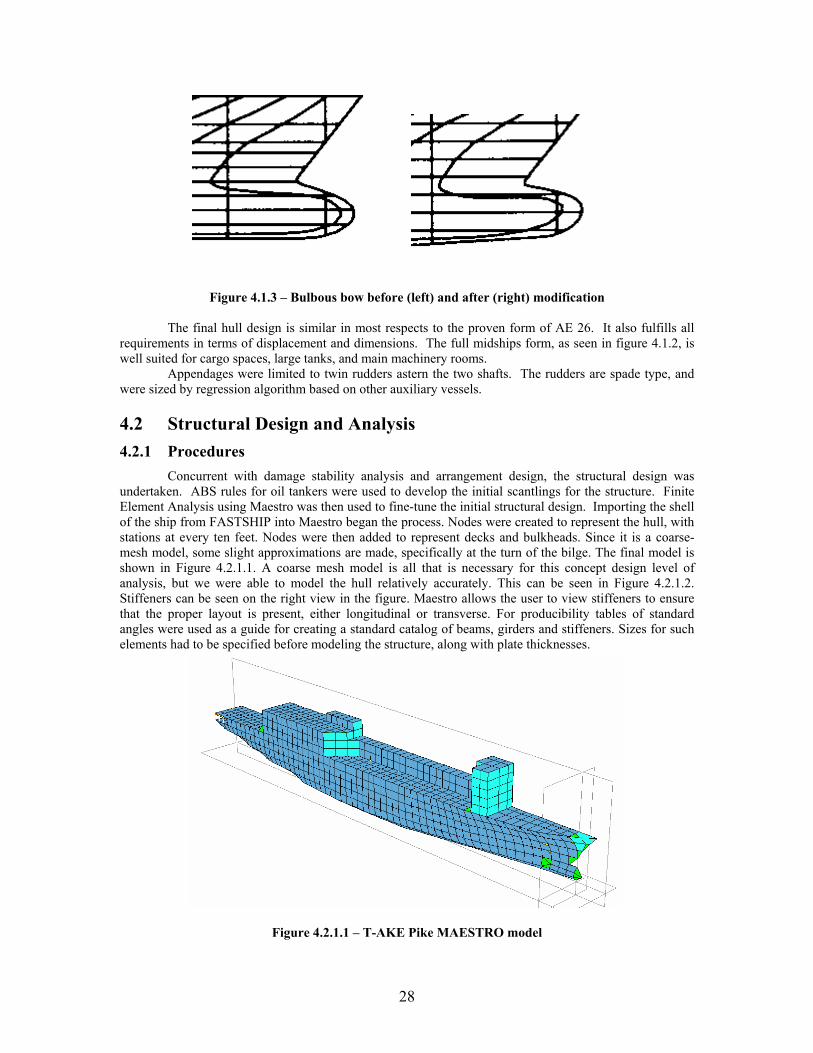
The bulbous bow is also altered from its AE 36 configuration. Based on “Design of Bulbous Bows” by Kracht, the leading edge was brought forward and closer to the free surface. Kracht indicates that these changes would lead to a residual power reduction coefficient of 0.4 to 0.8. The bulbous bow before and after modification is shown in figure 4.1.3.
28
Figure 4.1.3 – Bulbous bow before (left) and after (right) modification The final hull design is similar in most respects to the proven form of AE 26. It also fulfills all requirements in terms of displacement and dimensions. The full midships form, as seen in figure 4.1.2, is well suited for cargo spaces, large tanks, and main machinery rooms. Appendages were limited to twin rudders astern the two shafts. The rudders are spade type, and were sized by regression algorithm based on other auxiliary vessels.
4.2 Structural Design and Analysis 4.2.1 Procedures
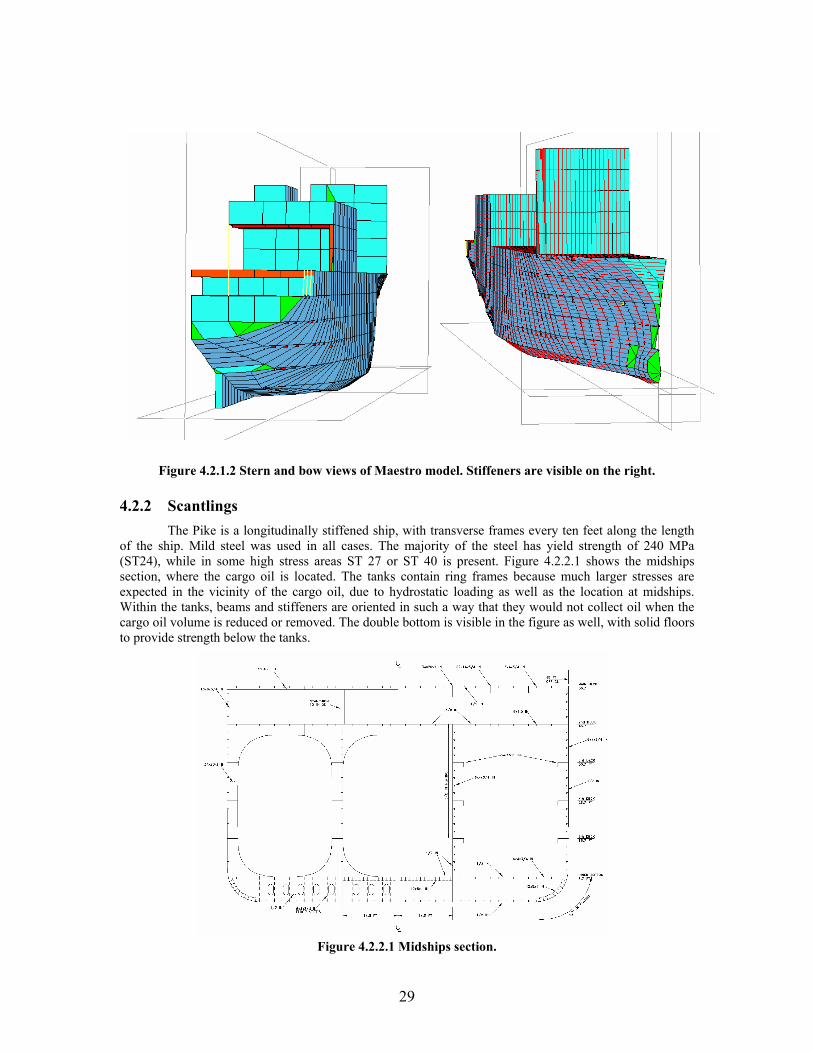
Concurrent with damage stability analysis and arrangement design, the structural design was undertaken. ABS rules for oil tankers were used to develop the initial scantlings for the structure. Finite Element Analysis using Maestro was then used to fine-tune the initial structural design. Importing the shell of the ship from FASTSHIP into Maestro began the process. Nodes were created to represent the hull, with stations at every ten feet. Nodes were then added to represent decks and bulkheads. Since it is a coarse-mesh model, some slight approximations are made, specifically at the turn of the bilge. The final model is shown in Figure 4.2.1.1. A coarse mesh model is all that is necessary for this concept design level of analysis, but we were able to model the hull relatively accurately. This can be seen in Figure 4.2.1.2. Stiffeners can be seen on the right view in the figure. Maestro allows the user to view stiffeners to ensure that the proper layout is present, either longitudinal or transverse. For producibility tables of standard angles were used as a guide for creating a standard catalog of beams, girders and stiffeners. Sizes for such elements had to be specified before modeling the structure, along with plate thicknesses.
Figure 4.2.1.1 – T-AKE Pike MAESTRO model
29
Figure 4.2.1.2 Stern and bow views of Maestro model. Stiffeners are visible on the right. 4.2.2 Scantlings
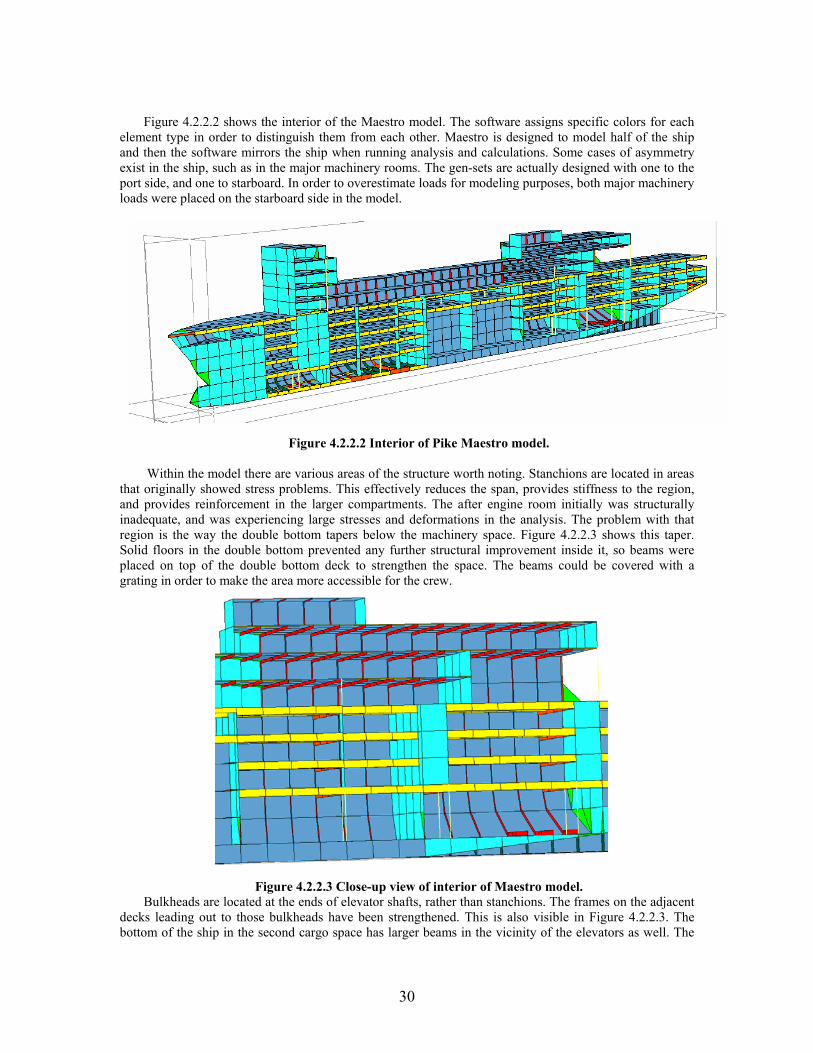
The Pike is a longitudinally stiffened ship, with transverse frames every ten feet along the length of the ship. Mild steel was used in all cases. The majority of the steel has yield strength of 240 MPa (ST24), while in some high stress areas ST 27 or ST 40 is present. Figure 4.2.2.1 shows the midships section, where the cargo oil is located. The tanks contain ring frames because much larger stresses are expected in the vicinity of the cargo oil, due to hydrostatic loading as well as the location at midships. Within the tanks, beams and stiffeners are oriented in such a way that they would not collect oil when the cargo oil volume is reduced or removed. The double bottom is visible in the figure as well, with solid floors to provide strength below the tanks.
Figure 4.2.2.1 Midships section.
30
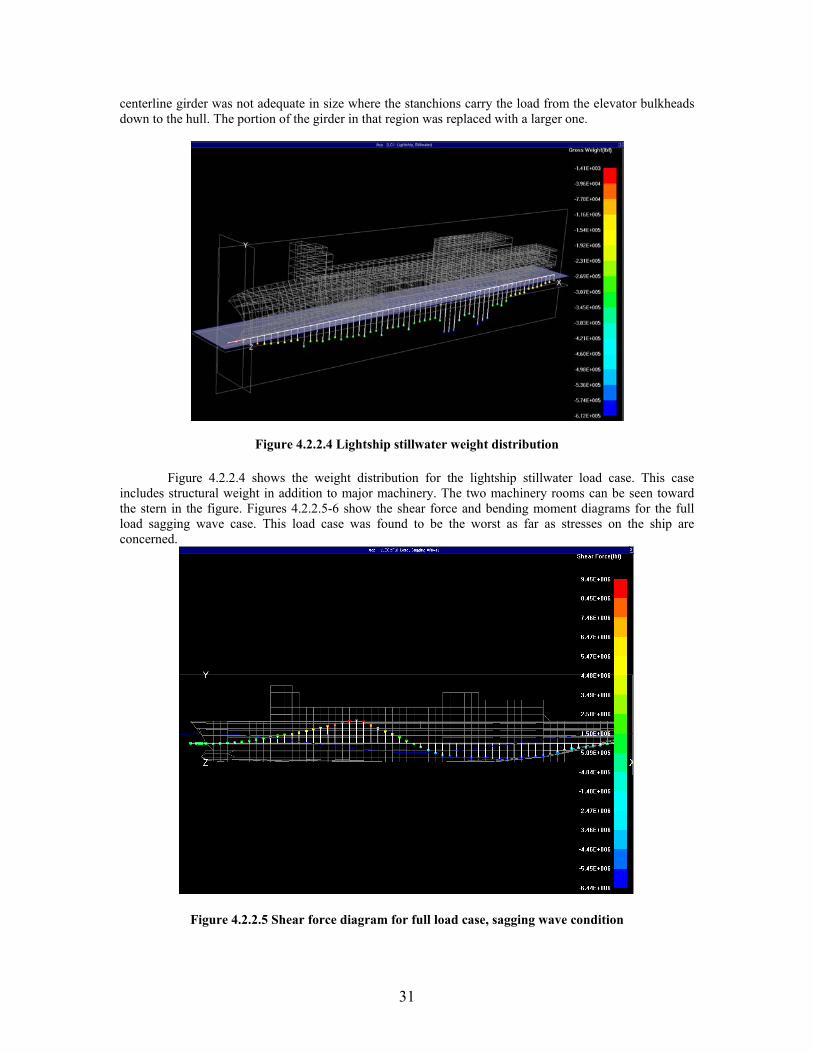
Figure 4.2.2.2 shows the interior of the Maestro model. The software assigns specific colors for each
element type in order to distinguish them from each other. Maestro is designed to model half of the ship and then the software mirrors the ship when running analysis and calculations. Some cases of asymmetry exist in the ship, such as in the major machinery rooms. The gen-sets are actually designed with one to the port side, and one to starboard. In order to overestimate loads for modeling purposes, both major machinery loads were placed on the starboard side in the model.
Figure 4.2.2.2 Interior of Pike Maestro model.
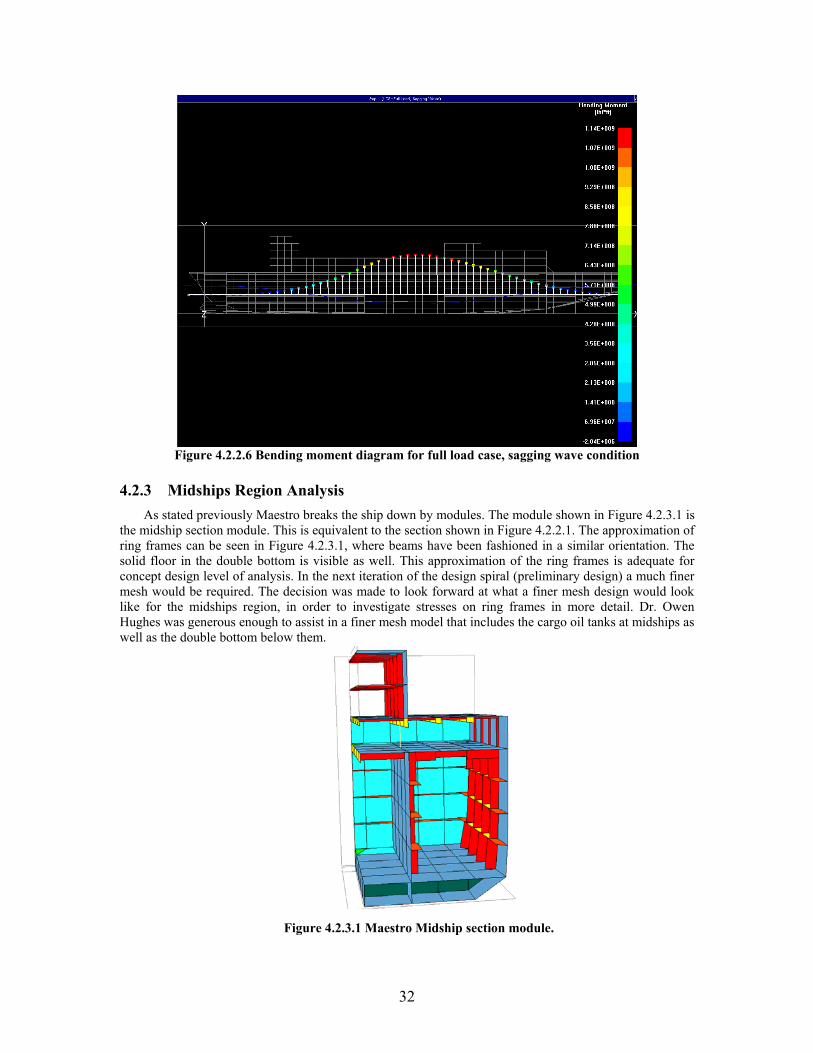
Within the model there are various areas of the structure worth noting. Stanchions are located in areas that originally showed stress problems. This effectively reduces the span, provides stiffness to the region, and provides reinforcement in the larger compartments. The after engine room initially was structurally inadequate, and was experiencing large stresses and deformations in the analysis. The problem with that region is the way the double bottom tapers below the machinery space. Figure 4.2.2.3 shows this taper. Solid floors in the double bottom prevented any further structural improvement inside it, so beams were placed on top of the double bottom deck to strengthen the space. The beams could be covered with a grating in order to make the area more accessible for the crew.
Figure 4.2.2.3 Close-up view of interior of Maestro model. Bulkheads are located at the ends of elevator shafts, rather than stanchions. The frames on the adjacent
decks leading out to those bulkheads have been strengthened. This is also visible in Figure 4.2.2.3. The bottom of the ship in the second cargo space has larger beams in the vicinity of the elevators as well. The
31
centerline girder was not adequate in size where the stanchions carry the load from the elevator bulkheads down to the hull. The portion of the girder in that region was replaced with a larger one.
Figure 4.2.2.4 Lightship stillwater weight distribution
Figure 4.2.2.4 shows the weight distribution for the lightship stillwater load case. This case includes structural weight in addition to major machinery. The two machinery rooms can be seen toward the stern in the figure. Figures 4.2.2.5-6 show the shear force and bending moment diagrams for the full load sagging wave case. This load case was found to be the worst as far as stresses on the ship are concerned.
Figure 4.2.2.5 Shear force diagram for full load case, sagging wave condition
32
Figure 4.2.2.6 Bending moment diagram for full load case, sagging wave condition
4.2.3 Midships Region Analysis
As stated previously Maestro breaks the ship down by modules. The module shown in Figure 4.2.3.1 is the midship section module. This is equivalent to the section shown in Figure 4.2.2.1. The approximation of ring frames can be seen in Figure 4.2.3.1, where beams have been fashioned in a similar orientation. The solid floor in the double bottom is visible as well. This approximation of the ring frames is adequate for concept design level of analysis. In the next iteration of the design spiral (preliminary design) a much finer mesh would be required. The decision was made to look forward at what a finer mesh design would look like for the midships region, in order to investigate stresses on ring frames in more detail. Dr. Owen Hughes was generous enough to assist in a finer mesh model that includes the cargo oil tanks at midships as well as the double bottom below them.
Figure 4.2.3.1 Maestro Midship section module.
33
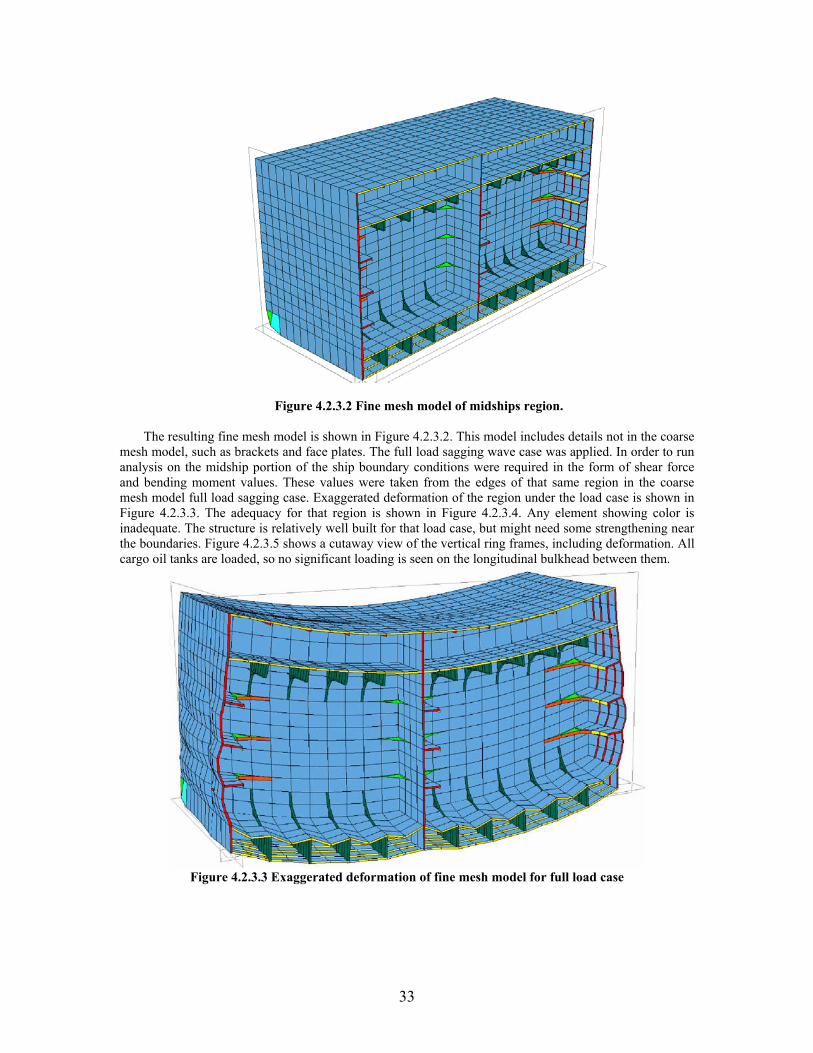
Figure 4.2.3.2 Fine mesh model of midships region. The resulting fine mesh model is shown in Figure 4.2.3.2. This model includes details not in the coarse
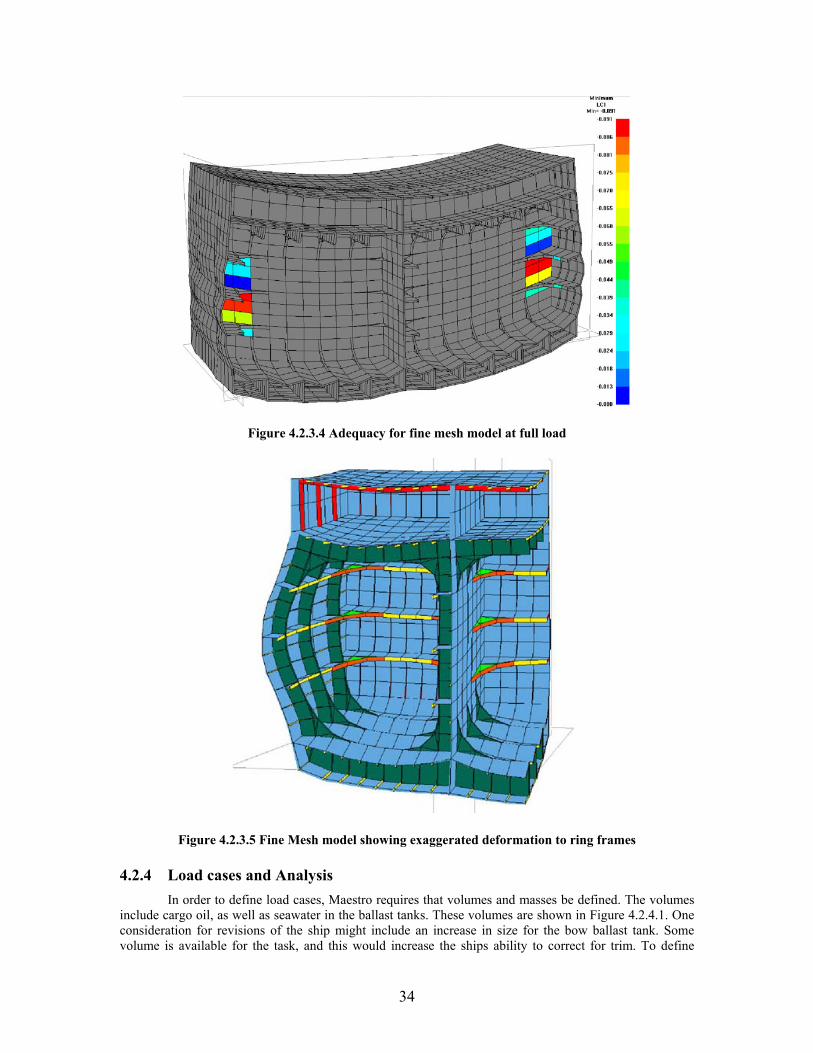
mesh model, such as brackets and face plates. The full load sagging wave case was applied. In order to run analysis on the midship portion of the ship boundary conditions were required in the form of shear force and bending moment values. These values were taken from the edges of that same region in the coarse mesh model full load sagging case. Exaggerated deformation of the region under the load case is shown in Figure 4.2.3.3. The adequacy for that region is shown in Figure 4.2.3.4. Any element showing color is inadequate. The structure is relatively well built for that load case, but might need some strengthening near the boundaries. Figure 4.2.3.5 shows a cutaway view of the vertical ring frames, including deformation. All cargo oil tanks are loaded, so no significant loading is seen on the longitudinal bulkhead between them.
Figure 4.2.3.3 Exaggerated deformation of fine mesh model for full load case
34
Figure 4.2.3.4 Adequacy for fine mesh model at full load
Figure 4.2.3.5 Fine Mesh model showing exaggerated deformation to ring frames 4.2.4 Load cases and Analysis
In order to define load cases, Maestro requires that volumes and masses be defined. The volumes include cargo oil, as well as seawater in the ballast tanks. These volumes are shown in Figure 4.2.4.1. One consideration for revisions of the ship might include an increase in size for the bow ballast tank. Some volume is available for the task, and this would increase the ships ability to correct for trim. To define
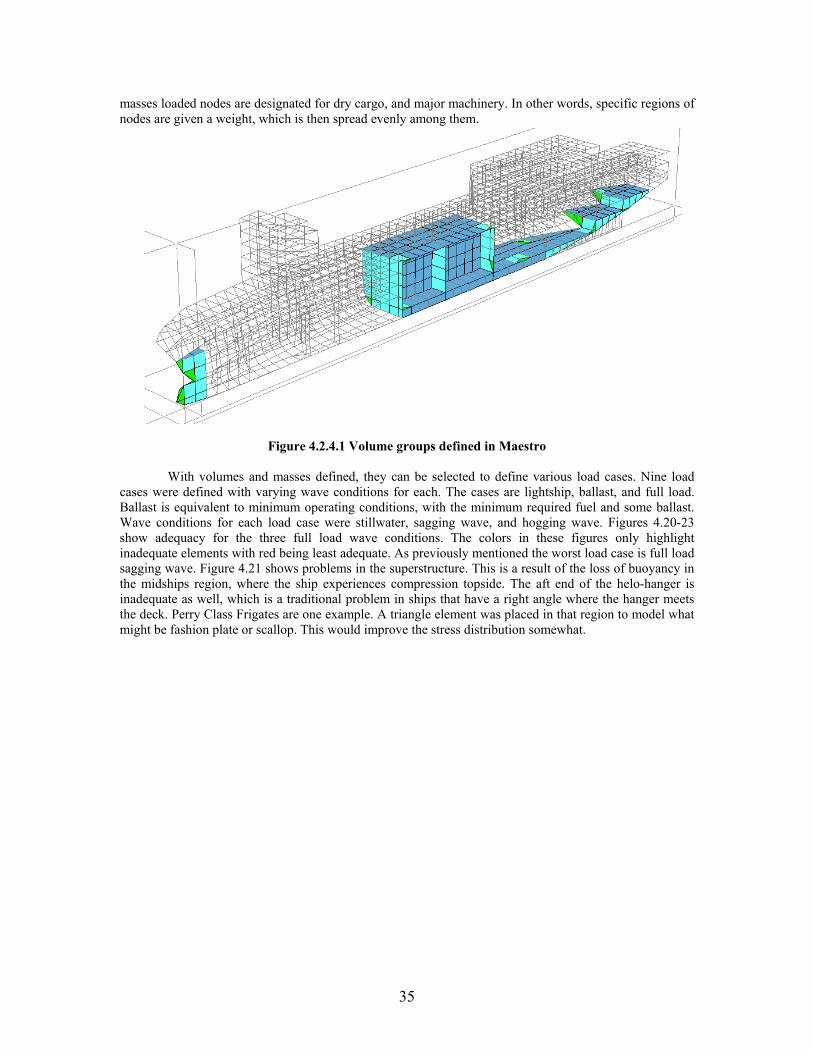
35
masses loaded nodes are designated for dry cargo, and major machinery. In other words, specific regions of nodes are given a weight, which is then spread evenly among them.
Figure 4.2.4.1 Volume groups defined in Maestro
With volumes and masses defined, they can be selected to define various load cases. Nine load cases were defined with varying wave conditions for each. The cases are lightship, ballast, and full load. Ballast is equivalent to minimum operating conditions, with the minimum required fuel and some ballast. Wave conditions for each load case were stillwater, sagging wave, and hogging wave. Figures 4.20-23 show adequacy for the three full load wave conditions. The colors in these figures only highlight inadequate elements with red being least adequate. As previously mentioned the worst load case is full load sagging wave. Figure 4.21 shows problems in the superstructure. This is a result of the loss of buoyancy in the midships region, where the ship experiences compression topside. The aft end of the helo-hanger is inadequate as well, which is a traditional problem in ships that have a right angle where the hanger meets the deck. Perry Class Frigates are one example. A triangle element was placed in that region to model what might be fashion plate or scallop. This would improve the stress distribution somewhat.
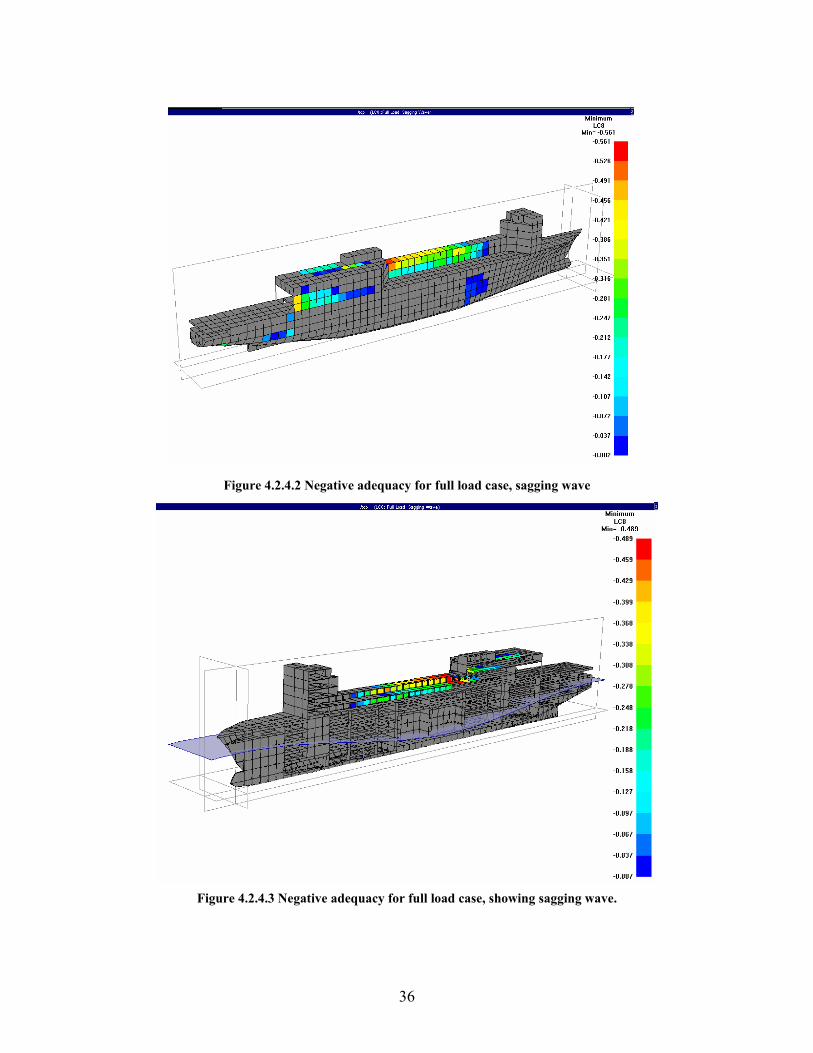
36
Figure 4.2.4.2 Negative adequacy for full load case, sagging wave
Figure 4.2.4.3 Negative adequacy for full load case, showing sagging wave.
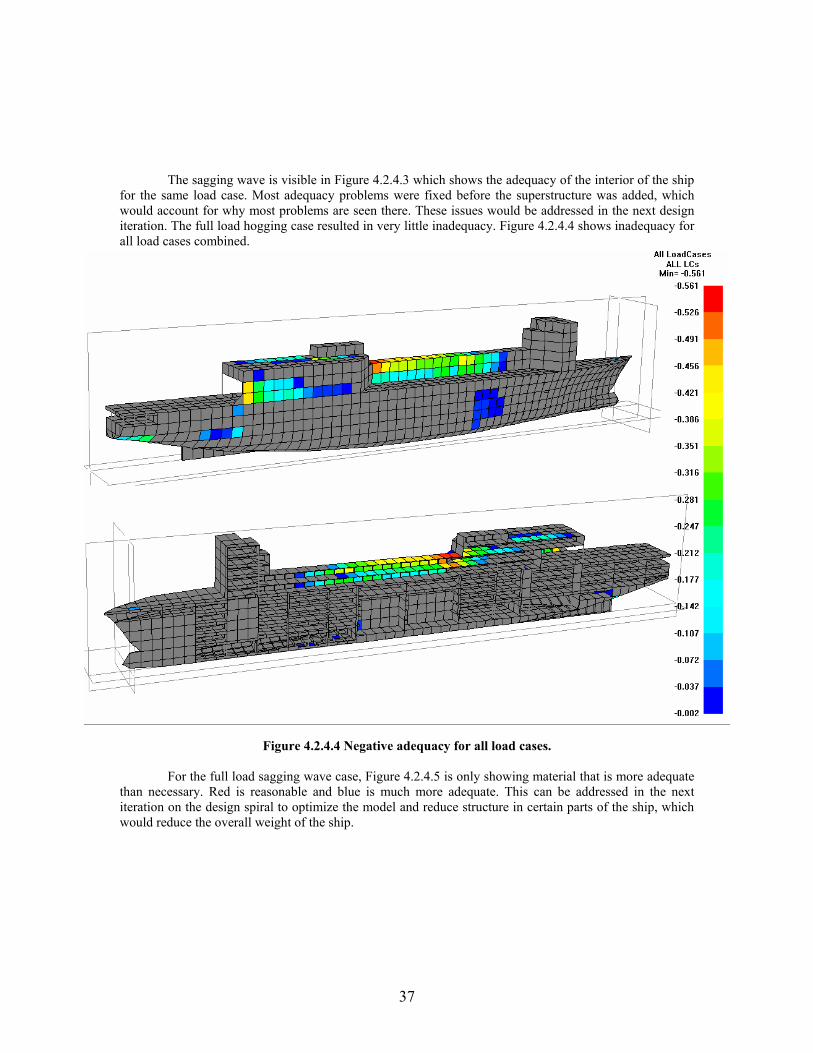
37
The sagging wave is visible in Figure 4.2.4.3 which shows the adequacy of the interior of the ship for the same load case. Most adequacy problems were fixed before the superstructure was added, which would account for why most problems are seen there. These issues would be addressed in the next design iteration. The full load hogging case resulted in very little inadequacy. Figure 4.2.4.4 shows inadequacy for all load cases combined.
Figure 4.2.4.4 Negative adequacy for all load cases.
For the full load sagging wave case, Figure 4.2.4.5 is only showing material that is more adequate than necessary. Red is reasonable and blue is much more adequate. This can be addressed in the next iteration on the design spiral to optimize the model and reduce structure in certain parts of the ship, which would reduce the overall weight of the ship.

38
Figure 4.2.4.5 Positive adequacy for full load case, sagging wave condition.
4.3 Resistance, Power and Propulsion Resistance calculations were conducted using Holtrop-Mennen and ITTC methods. Inputs for Holtrop-Mennen include ship principal characteristics such as LBP, draft, coefficients of form, and beam, as well as other data such as sail area and center of effort. Analysis was performed over the range of required operating speeds in calm seas. Resistance components under analysis were bare hull, wind, and appendage. Results are shown in figure 4.3.1 and table 4.3.1.
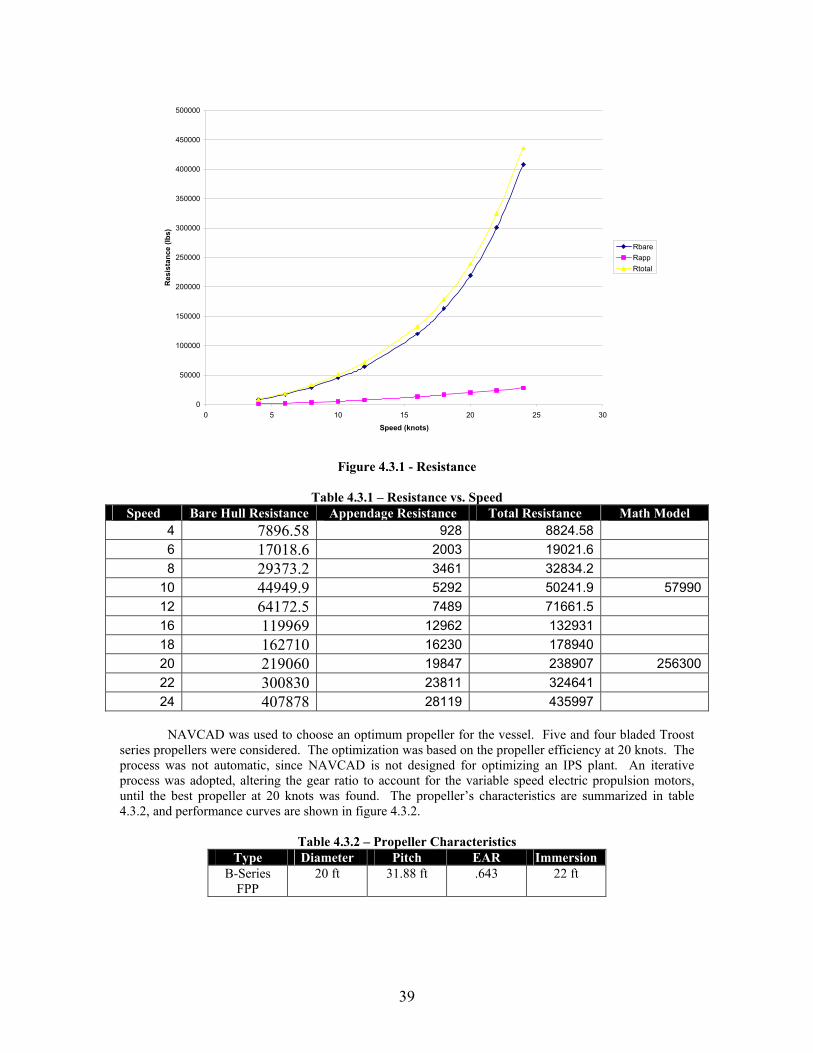
39
0
50000
100000
150000
200000
250000
300000
350000
400000
450000
500000
0 5 10 15 20 25 30
Speed (knots)
Res
ista
nce
(lbs)
RbareRappRtotal
Figure 4.3.1 - Resistance
Table 4.3.1 – Resistance vs. Speed Speed Bare Hull Resistance Appendage Resistance Total Resistance Math Model
4 7896.58 928 8824.58 6 17018.6 2003 19021.6 8 29373.2 3461 32834.2
10 44949.9 5292 50241.9 5799012 64172.5 7489 71661.5 16 119969 12962 132931 18 162710 16230 178940 20 219060 19847 238907 25630022 300830 23811 324641 24 407878 28119 435997
NAVCAD was used to choose an optimum propeller for the vessel. Five and four bladed Troost series propellers were considered. The optimization was based on the propeller efficiency at 20 knots. The process was not automatic, since NAVCAD is not designed for optimizing an IPS plant. An iterative process was adopted, altering the gear ratio to account for the variable speed electric propulsion motors, until the best propeller at 20 knots was found. The propeller’s characteristics are summarized in table 4.3.2, and performance curves are shown in figure 4.3.2.
Table 4.3.2 – Propeller Characteristics Type Diameter Pitch EAR Immersion
B-Series FPP
20 ft 31.88 ft .643 22 ft
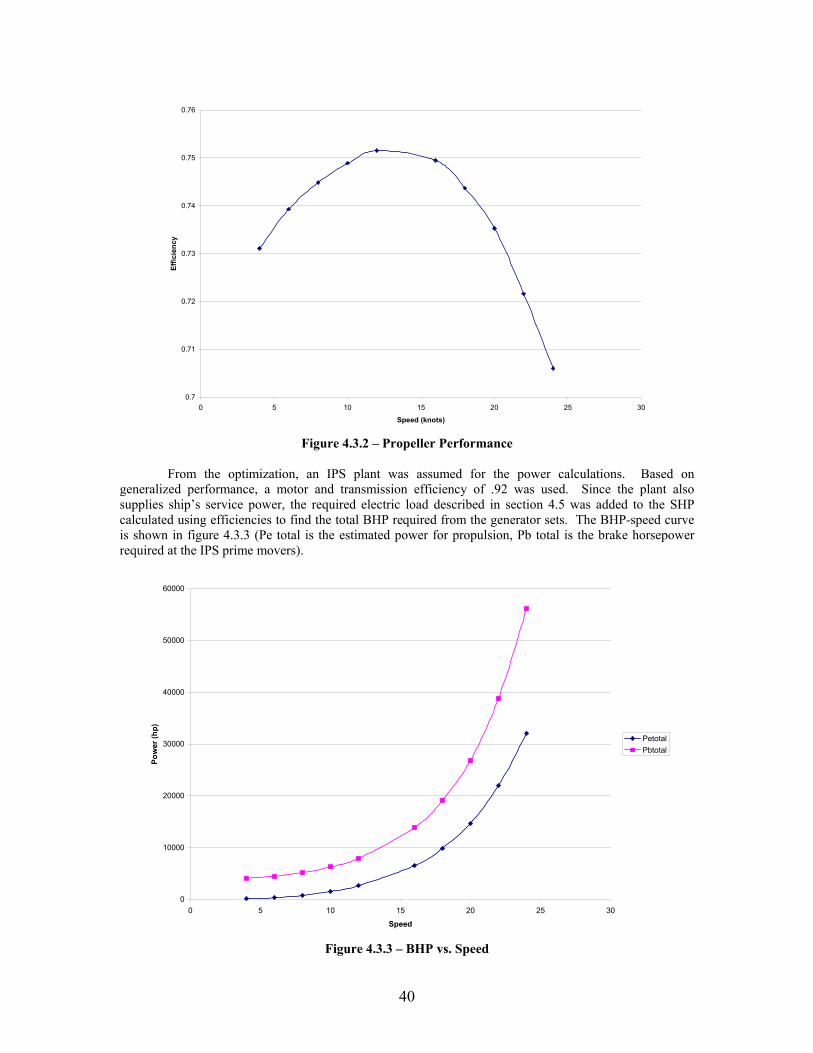
40
0.7
0.71
0.72
0.73
0.74
0.75
0.76
0 5 10 15 20 25 30
Speed (knots)
Effic
ienc
y
Figure 4.3.2 – Propeller Performance
From the optimization, an IPS plant was assumed for the power calculations. Based on generalized performance, a motor and transmission efficiency of .92 was used. Since the plant also supplies ship’s service power, the required electric load described in section 4.5 was added to the SHP calculated using efficiencies to find the total BHP required from the generator sets. The BHP-speed curve is shown in figure 4.3.3 (Pe total is the estimated power for propulsion, Pb total is the brake horsepower required at the IPS prime movers).
0
10000
20000
30000
40000
50000
60000
0 5 10 15 20 25 30
Speed
Pow
er (h
p)
PetotalPbtotal
Figure 4.3.3 – BHP vs. Speed
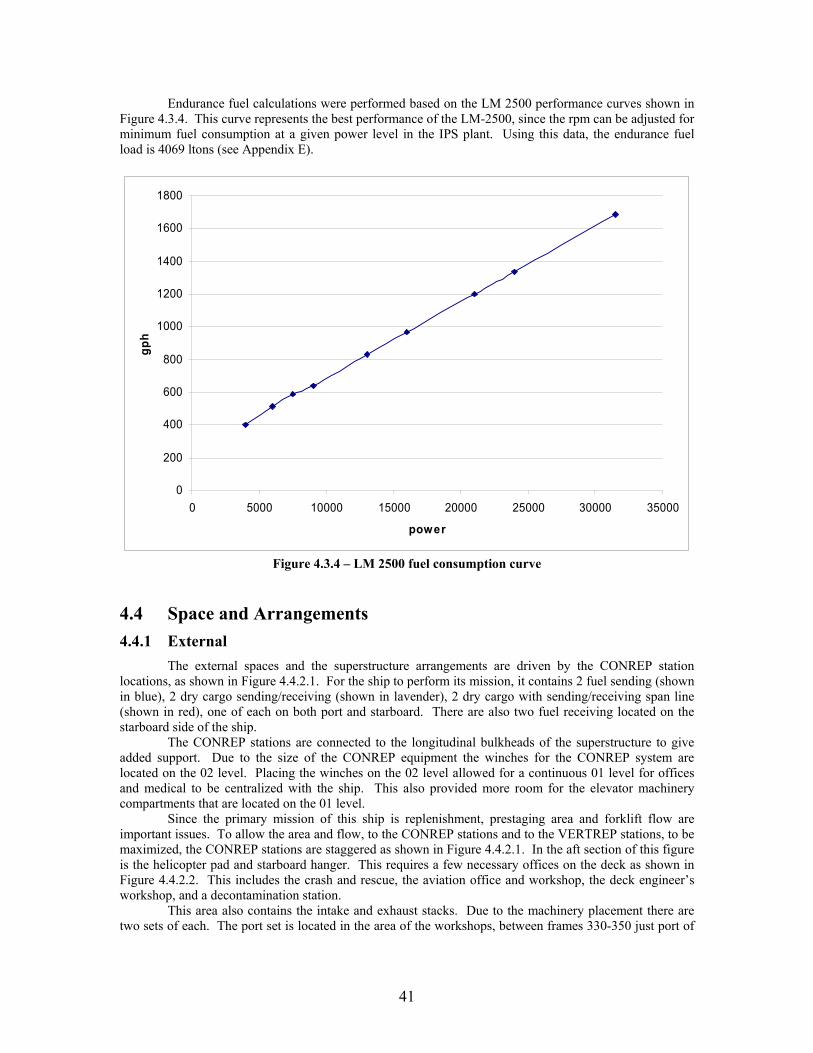
41
Endurance fuel calculations were performed based on the LM 2500 performance curves shown in Figure 4.3.4. This curve represents the best performance of the LM-2500, since the rpm can be adjusted for minimum fuel consumption at a given power level in the IPS plant. Using this data, the endurance fuel load is 4069 ltons (see Appendix E).
0
200
400
600
800
1000
1200
1400
1600
1800
0 5000 10000 15000 20000 25000 30000 35000
power
gph
Figure 4.3.4 – LM 2500 fuel consumption curve
4.4 Space and Arrangements 4.4.1 External The external spaces and the superstructure arrangements are driven by the CONREP station locations, as shown in Figure 4.4.2.1. For the ship to perform its mission, it contains 2 fuel sending (shown in blue), 2 dry cargo sending/receiving (shown in lavender), 2 dry cargo with sending/receiving span line (shown in red), one of each on both port and starboard. There are also two fuel receiving located on the starboard side of the ship. The CONREP stations are connected to the longitudinal bulkheads of the superstructure to give added support. Due to the size of the CONREP equipment the winches for the CONREP system are located on the 02 level. Placing the winches on the 02 level allowed for a continuous 01 level for offices and medical to be centralized with the ship. This also provided more room for the elevator machinery compartments that are located on the 01 level. Since the primary mission of this ship is replenishment, prestaging area and forklift flow are important issues. To allow the area and flow, to the CONREP stations and to the VERTREP stations, to be maximized, the CONREP stations are staggered as shown in Figure 4.4.2.1. In the aft section of this figure is the helicopter pad and starboard hanger. This requires a few necessary offices on the deck as shown in Figure 4.4.2.2. This includes the crash and rescue, the aviation office and workshop, the deck engineer’s workshop, and a decontamination station. This area also contains the intake and exhaust stacks. Due to the machinery placement there are two sets of each. The port set is located in the area of the workshops, between frames 330-350 just port of
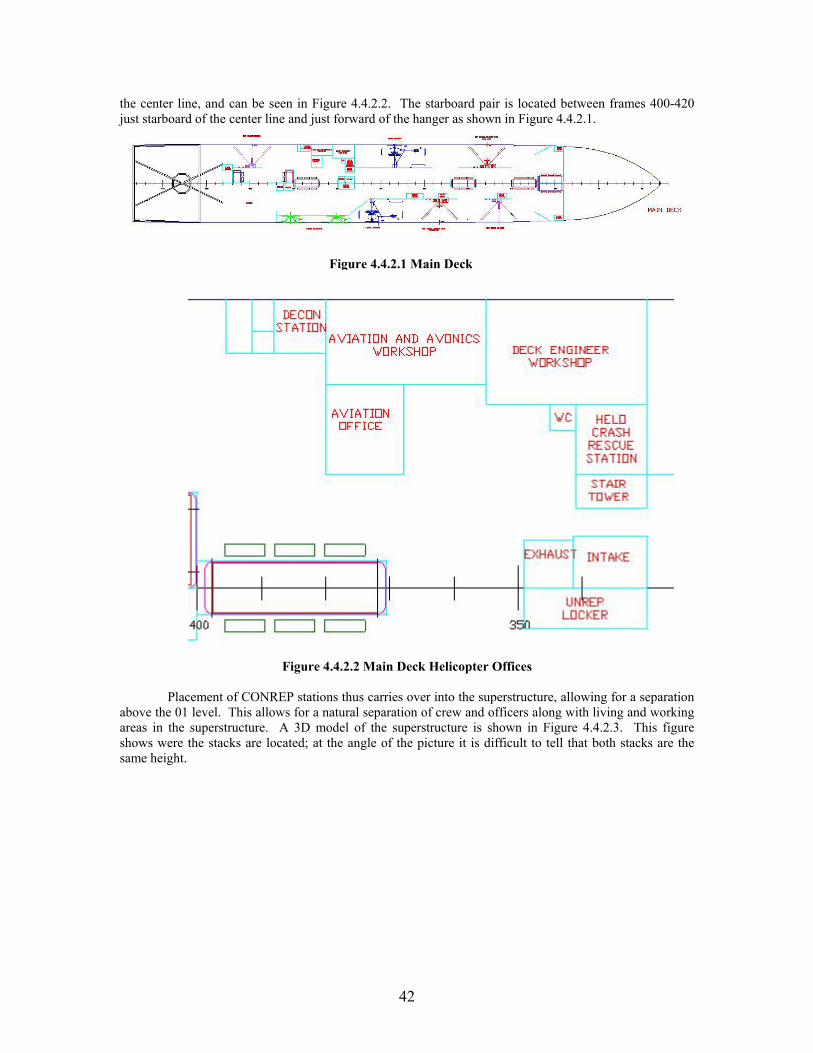
42
the center line, and can be seen in Figure 4.4.2.2. The starboard pair is located between frames 400-420 just starboard of the center line and just forward of the hanger as shown in Figure 4.4.2.1.
Figure 4.4.2.2 Main Deck Helicopter Offices
Placement of CONREP stations thus carries over into the superstructure, allowing for a separation above the 01 level. This allows for a natural separation of crew and officers along with living and working areas in the superstructure. A 3D model of the superstructure is shown in Figure 4.4.2.3. This figure shows were the stacks are located; at the angle of the picture it is difficult to tell that both stacks are the same height.
Figure 4.4.2.1 Main Deck
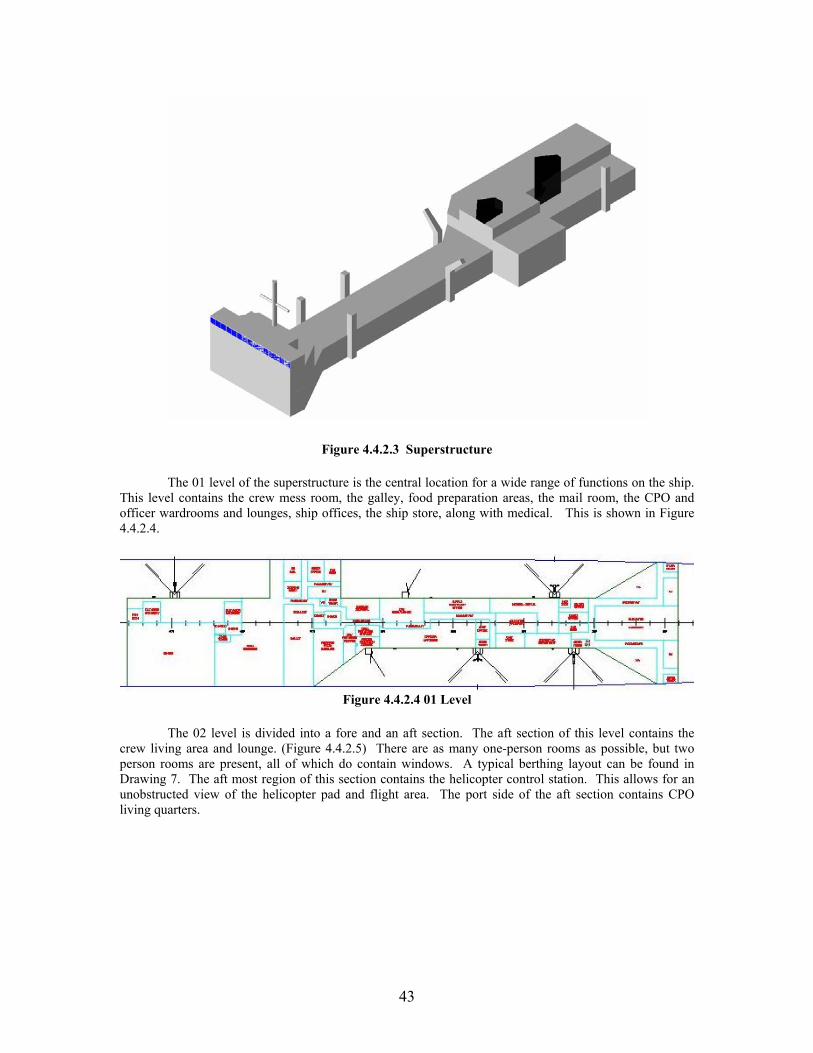
43
The 01 level of the superstructure is the central location for a wide range of functions on the ship. This level contains the crew mess room, the galley, food preparation areas, the mail room, the CPO and officer wardrooms and lounges, ship offices, the ship store, along with medical. This is shown in Figure 4.4.2.4.
Figure 4.4.2.4 01 Level
The 02 level is divided into a fore and an aft section. The aft section of this level contains the crew living area and lounge. (Figure 4.4.2.5) There are as many one-person rooms as possible, but two person rooms are present, all of which do contain windows. A typical berthing layout can be found in Drawing 7. The aft most region of this section contains the helicopter control station. This allows for an unobstructed view of the helicopter pad and flight area. The port side of the aft section contains CPO living quarters.
Figure 4.4.2.3 Superstructure
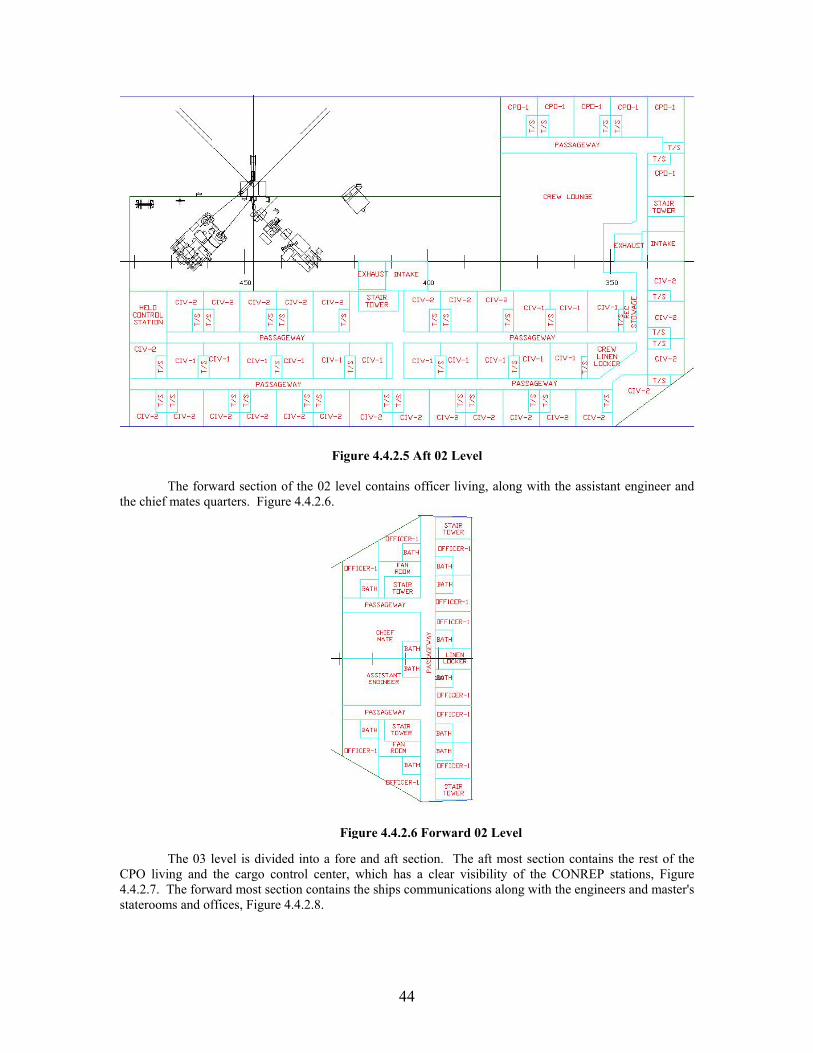
44
Figure 4.4.2.5 Aft 02 Level The forward section of the 02 level contains officer living, along with the assistant engineer and the chief mates quarters. Figure 4.4.2.6.
The 03 level is divided into a fore and aft section. The aft most section contains the rest of the CPO living and the cargo control center, which has a clear visibility of the CONREP stations, Figure 4.4.2.7. The forward most section contains the ships communications along with the engineers and master's staterooms and offices, Figure 4.4.2.8.
Figure 4.4.2.6 Forward 02 Level
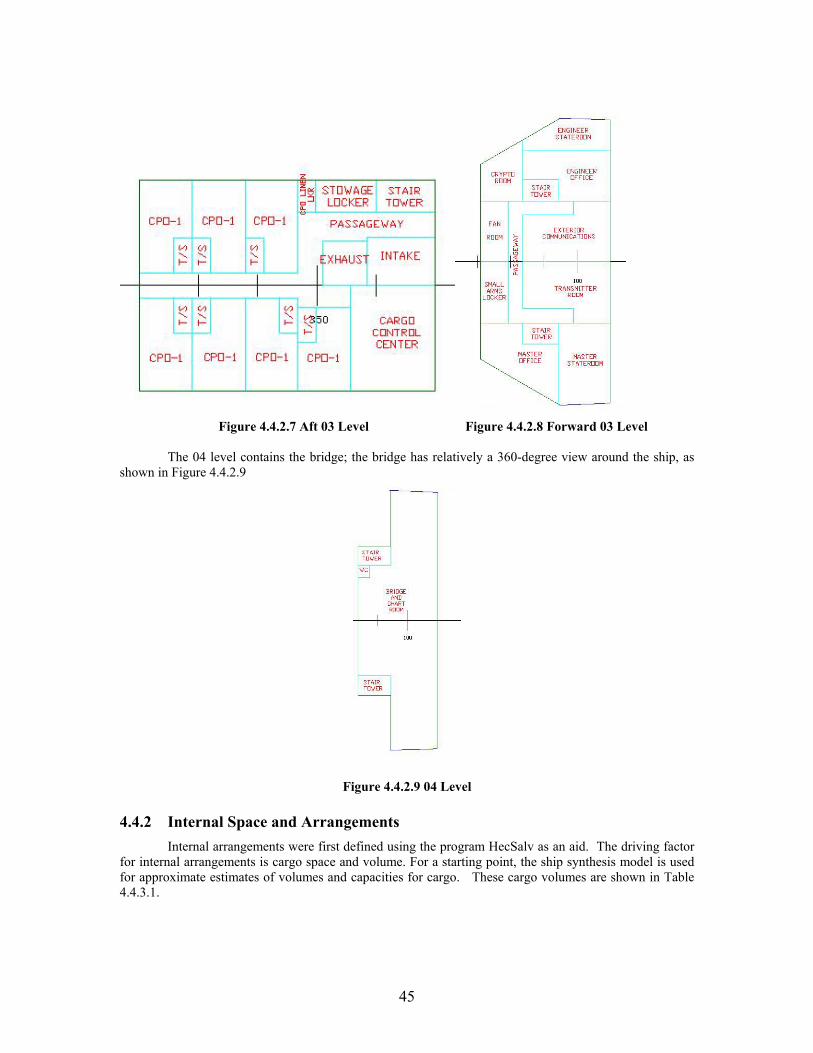
45
Figure 4.4.2.7 Aft 03 Level Figure 4.4.2.8 Forward 03 Level
The 04 level contains the bridge; the bridge has relatively a 360-degree view around the ship, as
shown in Figure 4.4.2.9
Figure 4.4.2.9 04 Level
4.4.2 Internal Space and Arrangements
Internal arrangements were first defined using the program HecSalv as an aid. The driving factor for internal arrangements is cargo space and volume. For a starting point, the ship synthesis model is used for approximate estimates of volumes and capacities for cargo. These cargo volumes are shown in Table 4.4.3.1.
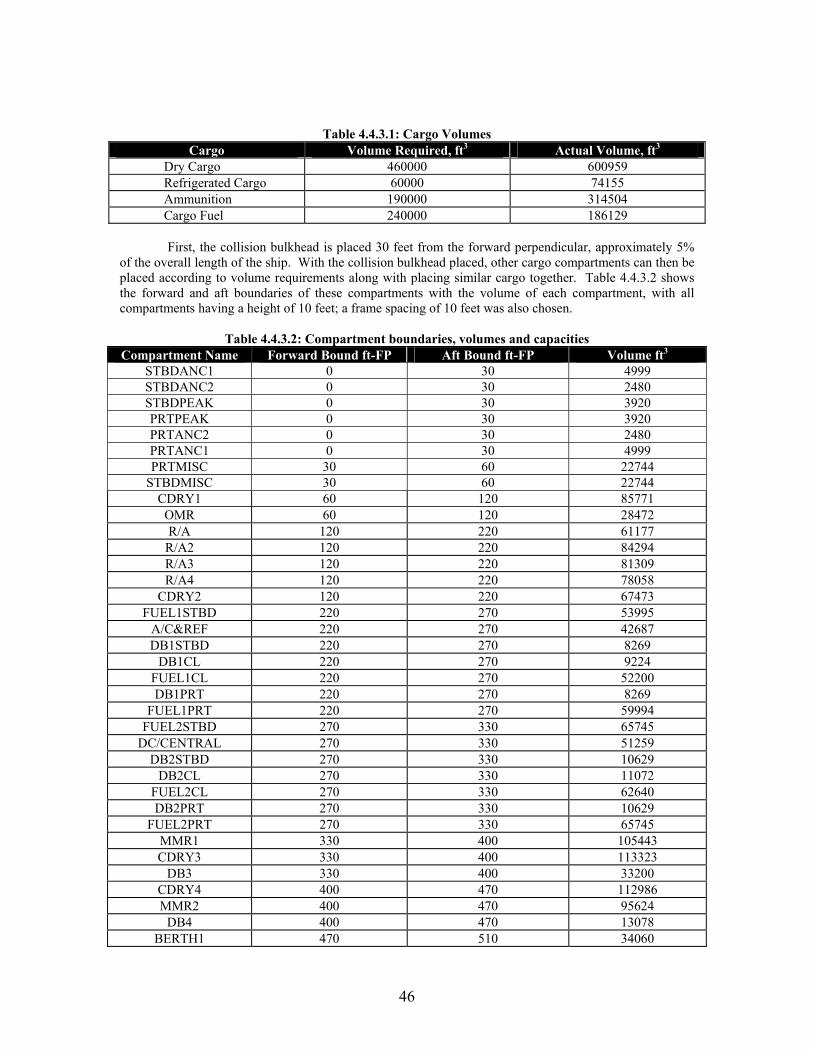
46
Table 4.4.3.1: Cargo Volumes Cargo Volume Required, ft3 Actual Volume, ft3
Dry Cargo 460000 600959 Refrigerated Cargo 60000 74155 Ammunition 190000 314504 Cargo Fuel 240000 186129
First, the collision bulkhead is placed 30 feet from the forward perpendicular, approximately 5%
of the overall length of the ship. With the collision bulkhead placed, other cargo compartments can then be placed according to volume requirements along with placing similar cargo together. Table 4.4.3.2 shows the forward and aft boundaries of these compartments with the volume of each compartment, with all compartments having a height of 10 feet; a frame spacing of 10 feet was also chosen.
Table 4.4.3.2: Compartment boundaries, volumes and capacities
Compartment Name Forward Bound ft-FP Aft Bound ft-FP Volume ft3 STBDANC1 0 30 4999 STBDANC2 0 30 2480 STBDPEAK 0 30 3920 PRTPEAK 0 30 3920 PRTANC2 0 30 2480 PRTANC1 0 30 4999 PRTMISC 30 60 22744
STBDMISC 30 60 22744 CDRY1 60 120 85771
OMR 60 120 28472 R/A 120 220 61177
R/A2 120 220 84294 R/A3 120 220 81309 R/A4 120 220 78058
CDRY2 120 220 67473 FUEL1STBD 220 270 53995
A/C&REF 220 270 42687 DB1STBD 220 270 8269
DB1CL 220 270 9224 FUEL1CL 220 270 52200 DB1PRT 220 270 8269
FUEL1PRT 220 270 59994 FUEL2STBD 270 330 65745
DC/CENTRAL 270 330 51259 DB2STBD 270 330 10629
DB2CL 270 330 11072 FUEL2CL 270 330 62640 DB2PRT 270 330 10629
FUEL2PRT 270 330 65745 MMR1 330 400 105443 CDRY3 330 400 113323
DB3 330 400 33200 CDRY4 400 470 112986 MMR2 400 470 95624
DB4 400 470 13078 BERTH1 470 510 34060

47
STORES1 470 510 33986 STORES2 470 510 32877
COMBOTANK 470 510 28657 VOID1 470 510 12806
SHAFTALLEY 470 510 814 BERTH2 510 550 34032
SHOPS/STORES 510 550 33441 ENGOFFICE 510 550 29918 STERNTANK 510 550 15633 TOW/MOOR 550 580 25179
STEERINGGREAR 550 580 23906 VOID2 550 580 16584
Wanting to conform to commercial environmental standards, that require a double bottom to be
placed under fuel tanks, a double bottom is placed under the fuel tanks and the machinery compartments. The double bottom has a height of 2 meters and stretches from frame 220-470. To assist in structural continuity, the cargo fuel tanks were moved aft of their typical location and placed forward of the main machinery rooms. There are a total of six tanks located between frames 220-330, from the third deck down to the double bottom. Three tanks are located between frames 220-270, and have a beam of 30 feet each, running longitudinally as shown in Figure 4.4.3.1. This is true for the other three cargo fuel tanks, between frames 270-330, as well.
Figure 4.4.3.1 Cargo Fuel Tanks 1 and 2
Dry Cargo 1, 3, and 4 are located between the second and fifth deck, while Dry Cargo 2 is located
above the double bottom. For redundancy, every cargo compartment on the ship contains two elevators, except for Dry Cargo 3. The elevators in Dry Cargo 1 and 2 are 30-foot long and are capable of carrying ammunition. The elevators in Dry Cargo 4 are 15-foot long. Dry Cargo 3 only contains one 30-foot elevator. As in other similar ships, a watertight sliding door between Dry Cargo 3 and 4 is currently being investigated to promote redundancy, due to only having one elevator in Dry Cargo 3; if the watertight sliding door is proven infeasible the larger elevator will be replaced with two smaller 15-foot elevators. This would be determined in a second iteration.
The ammunition compartments span decks 2 through 4, while the refrigerated cargo is on the fifth deck. As stated above each of these compartments will contain two elevators for redundancy.
Additional spaces forward of amidships includes an auxiliary machinery room, which contain the ship service generators, which are separated to promote passive survivability. This is placed on deck six just below Dry Cargo 1.
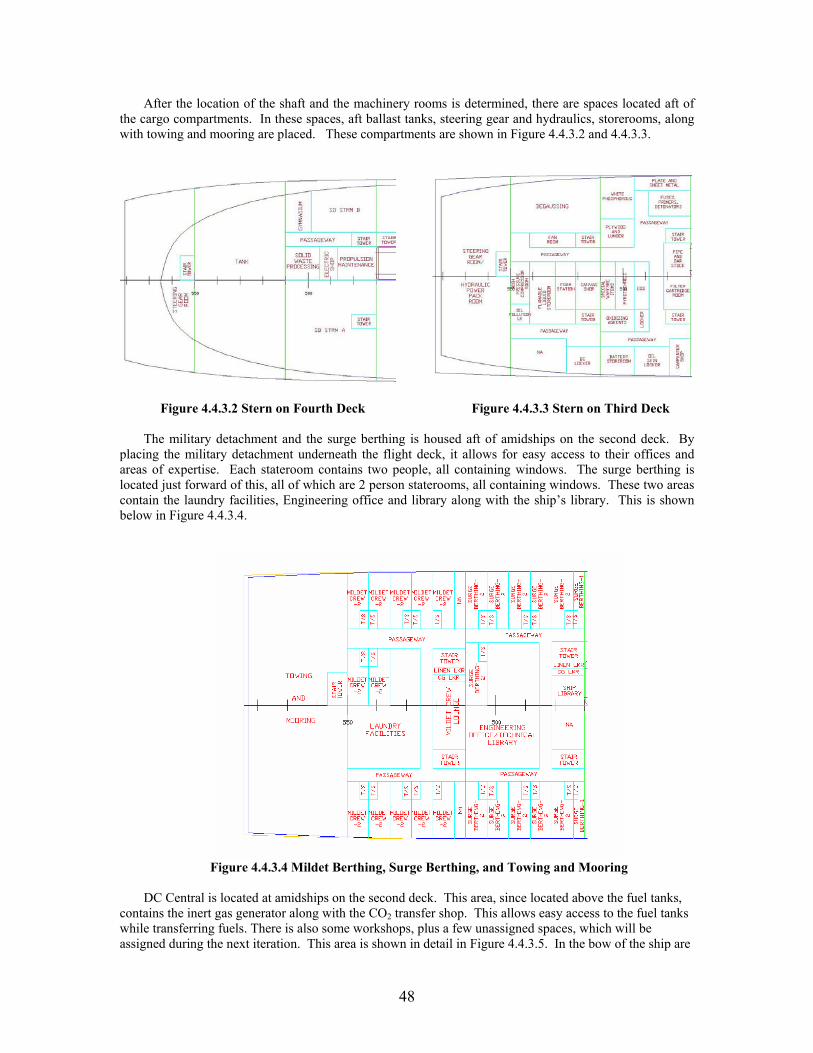
48
After the location of the shaft and the machinery rooms is determined, there are spaces located aft of the cargo compartments. In these spaces, aft ballast tanks, steering gear and hydraulics, storerooms, along with towing and mooring are placed. These compartments are shown in Figure 4.4.3.2 and 4.4.3.3.
Figure 4.4.3.2 Stern on Fourth Deck Figure 4.4.3.3 Stern on Third Deck
The military detachment and the surge berthing is housed aft of amidships on the second deck. By
placing the military detachment underneath the flight deck, it allows for easy access to their offices and areas of expertise. Each stateroom contains two people, all containing windows. The surge berthing is located just forward of this, all of which are 2 person staterooms, all containing windows. These two areas contain the laundry facilities, Engineering office and library along with the ship’s library. This is shown below in Figure 4.4.3.4.
Figure 4.4.3.4 Mildet Berthing, Surge Berthing, and Towing and Mooring
DC Central is located at amidships on the second deck. This area, since located above the fuel tanks,
contains the inert gas generator along with the CO2 transfer shop. This allows easy access to the fuel tanks while transferring fuels. There is also some workshops, plus a few unassigned spaces, which will be assigned during the next iteration. This area is shown in detail in Figure 4.4.3.5. In the bow of the ship are
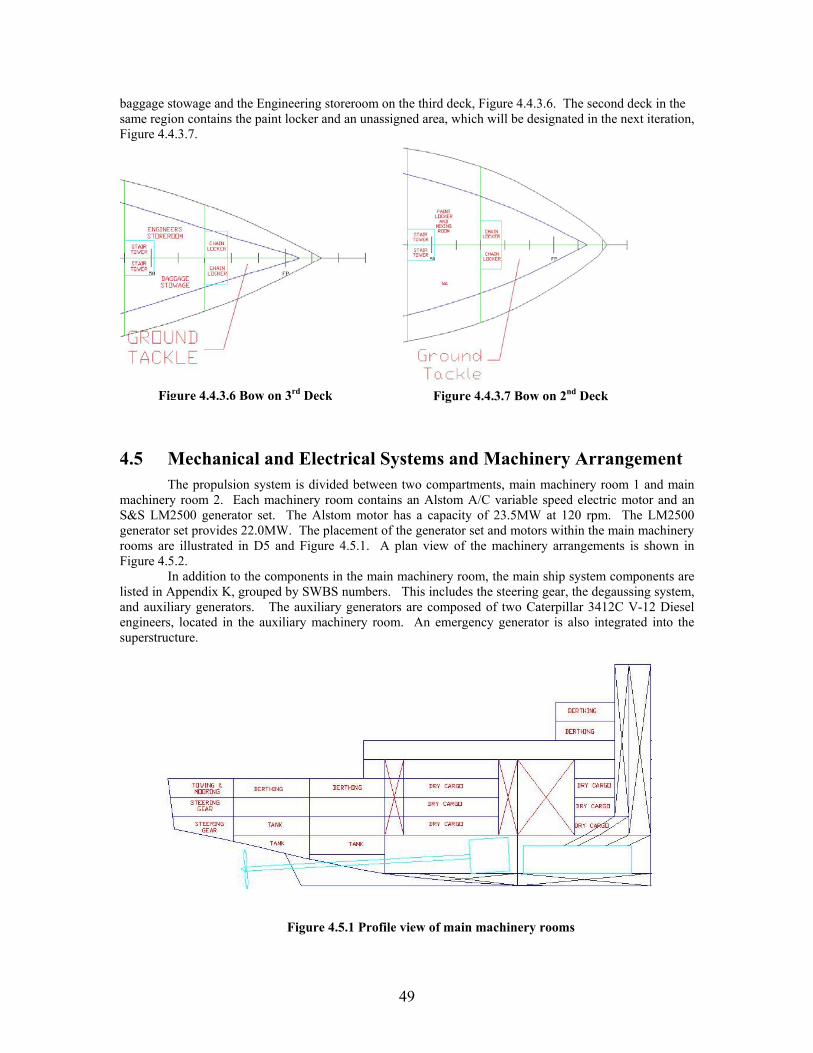
49
baggage stowage and the Engineering storeroom on the third deck, Figure 4.4.3.6. The second deck in the same region contains the paint locker and an unassigned area, which will be designated in the next iteration, Figure 4.4.3.7.
4.5 Mechanical and Electrical Systems and Machinery Arrangement The propulsion system is divided between two compartments, main machinery room 1 and main
machinery room 2. Each machinery room contains an Alstom A/C variable speed electric motor and an S&S LM2500 generator set. The Alstom motor has a capacity of 23.5MW at 120 rpm. The LM2500 generator set provides 22.0MW. The placement of the generator set and motors within the main machinery rooms are illustrated in D5 and Figure 4.5.1. A plan view of the machinery arrangements is shown in Figure 4.5.2.
In addition to the components in the main machinery room, the main ship system components are listed in Appendix K, grouped by SWBS numbers. This includes the steering gear, the degaussing system, and auxiliary generators. The auxiliary generators are composed of two Caterpillar 3412C V-12 Diesel engineers, located in the auxiliary machinery room. An emergency generator is also integrated into the superstructure.
Figure 4.5.1 Profile view of main machinery rooms
Figure 4.4.3.6 Bow on 3rd Deck Figure 4.4.3.7 Bow on 2nd Deck
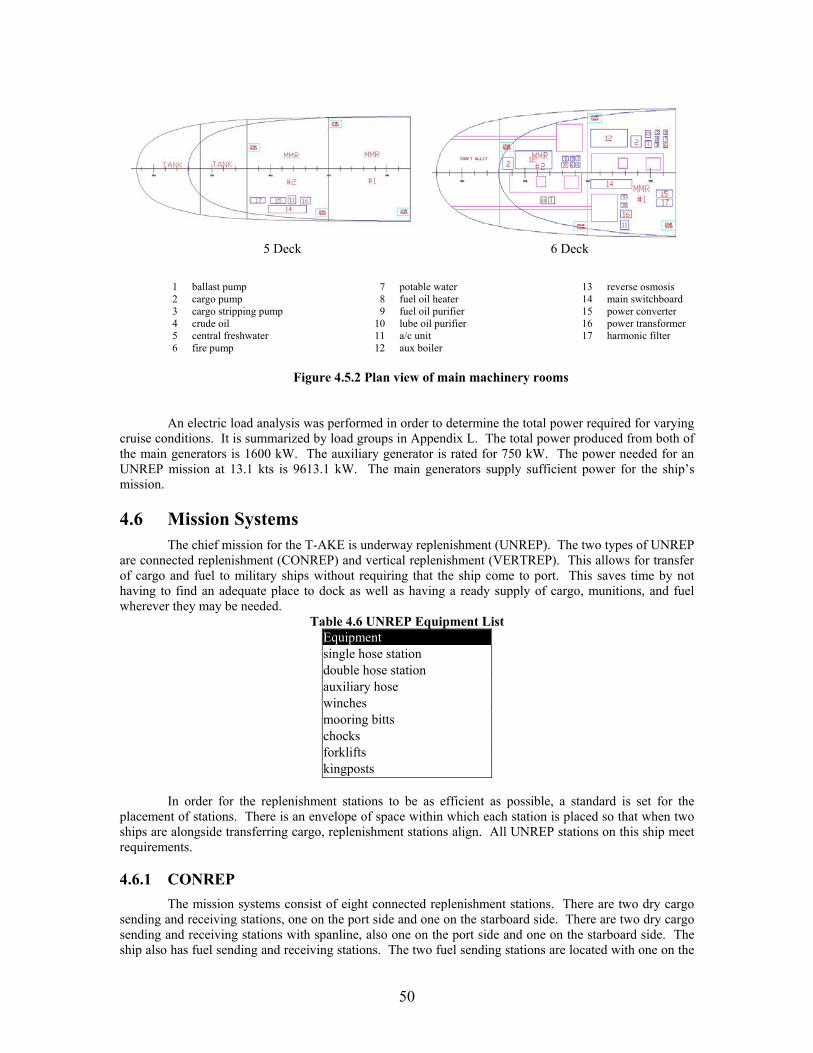
50
5 Deck 6 Deck
1 ballast pump 2 cargo pump 3 cargo stripping pump 4 crude oil 5 central freshwater 6 fire pump
7 potable water 8 fuel oil heater 9 fuel oil purifier
10 lube oil purifier 11 a/c unit 12 aux boiler
13 reverse osmosis 14 main switchboard 15 power converter 16 power transformer 17 harmonic filter
Figure 4.5.2 Plan view of main machinery rooms
An electric load analysis was performed in order to determine the total power required for varying
cruise conditions. It is summarized by load groups in Appendix L. The total power produced from both of the main generators is 1600 kW. The auxiliary generator is rated for 750 kW. The power needed for an UNREP mission at 13.1 kts is 9613.1 kW. The main generators supply sufficient power for the ship’s mission.
4.6 Mission Systems The chief mission for the T-AKE is underway replenishment (UNREP). The two types of UNREP
are connected replenishment (CONREP) and vertical replenishment (VERTREP). This allows for transfer of cargo and fuel to military ships without requiring that the ship come to port. This saves time by not having to find an adequate place to dock as well as having a ready supply of cargo, munitions, and fuel wherever they may be needed.
Table 4.6 UNREP Equipment List Equipment single hose station double hose station auxiliary hose winches mooring bitts chocks forklifts kingposts
In order for the replenishment stations to be as efficient as possible, a standard is set for the
placement of stations. There is an envelope of space within which each station is placed so that when two ships are alongside transferring cargo, replenishment stations align. All UNREP stations on this ship meet requirements. 4.6.1 CONREP
The mission systems consist of eight connected replenishment stations. There are two dry cargo sending and receiving stations, one on the port side and one on the starboard side. There are two dry cargo sending and receiving stations with spanline, also one on the port side and one on the starboard side. The ship also has fuel sending and receiving stations. The two fuel sending stations are located with one on the
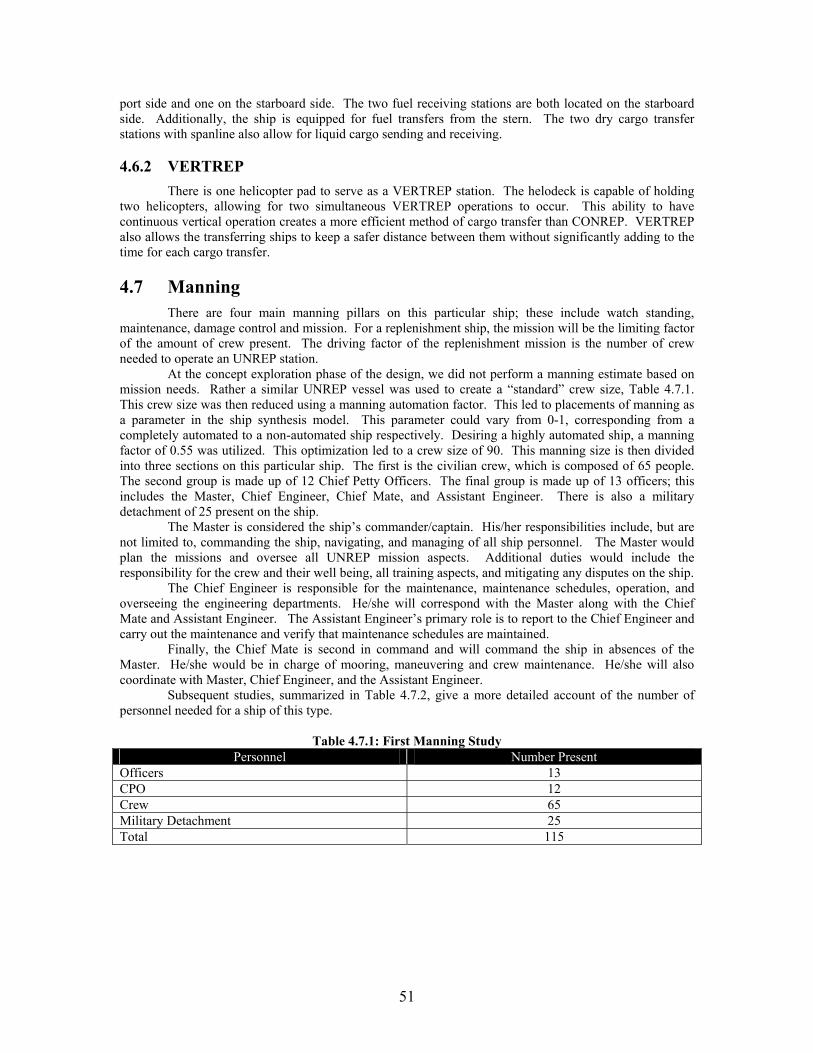
51
port side and one on the starboard side. The two fuel receiving stations are both located on the starboard side. Additionally, the ship is equipped for fuel transfers from the stern. The two dry cargo transfer stations with spanline also allow for liquid cargo sending and receiving.
4.6.2 VERTREP
There is one helicopter pad to serve as a VERTREP station. The helodeck is capable of holding two helicopters, allowing for two simultaneous VERTREP operations to occur. This ability to have continuous vertical operation creates a more efficient method of cargo transfer than CONREP. VERTREP also allows the transferring ships to keep a safer distance between them without significantly adding to the time for each cargo transfer.
4.7 Manning There are four main manning pillars on this particular ship; these include watch standing,
maintenance, damage control and mission. For a replenishment ship, the mission will be the limiting factor of the amount of crew present. The driving factor of the replenishment mission is the number of crew needed to operate an UNREP station.
At the concept exploration phase of the design, we did not perform a manning estimate based on mission needs. Rather a similar UNREP vessel was used to create a “standard” crew size, Table 4.7.1. This crew size was then reduced using a manning automation factor. This led to placements of manning as a parameter in the ship synthesis model. This parameter could vary from 0-1, corresponding from a completely automated to a non-automated ship respectively. Desiring a highly automated ship, a manning factor of 0.55 was utilized. This optimization led to a crew size of 90. This manning size is then divided into three sections on this particular ship. The first is the civilian crew, which is composed of 65 people. The second group is made up of 12 Chief Petty Officers. The final group is made up of 13 officers; this includes the Master, Chief Engineer, Chief Mate, and Assistant Engineer. There is also a military detachment of 25 present on the ship.
The Master is considered the ship’s commander/captain. His/her responsibilities include, but are not limited to, commanding the ship, navigating, and managing of all ship personnel. The Master would plan the missions and oversee all UNREP mission aspects. Additional duties would include the responsibility for the crew and their well being, all training aspects, and mitigating any disputes on the ship.
The Chief Engineer is responsible for the maintenance, maintenance schedules, operation, and overseeing the engineering departments. He/she will correspond with the Master along with the Chief Mate and Assistant Engineer. The Assistant Engineer’s primary role is to report to the Chief Engineer and carry out the maintenance and verify that maintenance schedules are maintained.
Finally, the Chief Mate is second in command and will command the ship in absences of the Master. He/she would be in charge of mooring, maneuvering and crew maintenance. He/she will also coordinate with Master, Chief Engineer, and the Assistant Engineer.
Subsequent studies, summarized in Table 4.7.2, give a more detailed account of the number of personnel needed for a ship of this type.
Table 4.7.1: First Manning Study
Personnel Number Present Officers 13 CPO 12 Crew 65 Military Detachment 25 Total 115
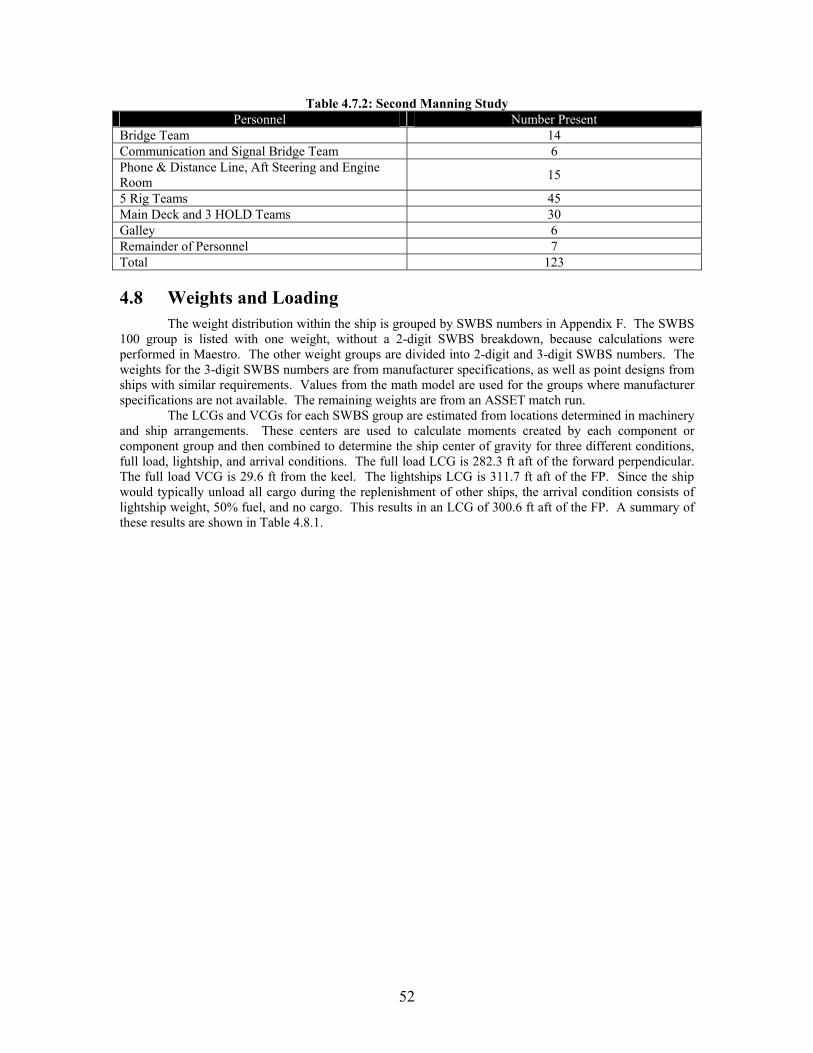
52
Table 4.7.2: Second Manning Study Personnel Number Present
Bridge Team 14 Communication and Signal Bridge Team 6 Phone & Distance Line, Aft Steering and Engine Room 15
5 Rig Teams 45 Main Deck and 3 HOLD Teams 30 Galley 6 Remainder of Personnel 7 Total 123
4.8 Weights and Loading The weight distribution within the ship is grouped by SWBS numbers in Appendix F. The SWBS
100 group is listed with one weight, without a 2-digit SWBS breakdown, because calculations were performed in Maestro. The other weight groups are divided into 2-digit and 3-digit SWBS numbers. The weights for the 3-digit SWBS numbers are from manufacturer specifications, as well as point designs from ships with similar requirements. Values from the math model are used for the groups where manufacturer specifications are not available. The remaining weights are from an ASSET match run. The LCGs and VCGs for each SWBS group are estimated from locations determined in machinery and ship arrangements. These centers are used to calculate moments created by each component or component group and then combined to determine the ship center of gravity for three different conditions, full load, lightship, and arrival conditions. The full load LCG is 282.3 ft aft of the forward perpendicular. The full load VCG is 29.6 ft from the keel. The lightships LCG is 311.7 ft aft of the FP. Since the ship would typically unload all cargo during the replenishment of other ships, the arrival condition consists of lightship weight, 50% fuel, and no cargo. This results in an LCG of 300.6 ft aft of the FP. A summary of these results are shown in Table 4.8.1.
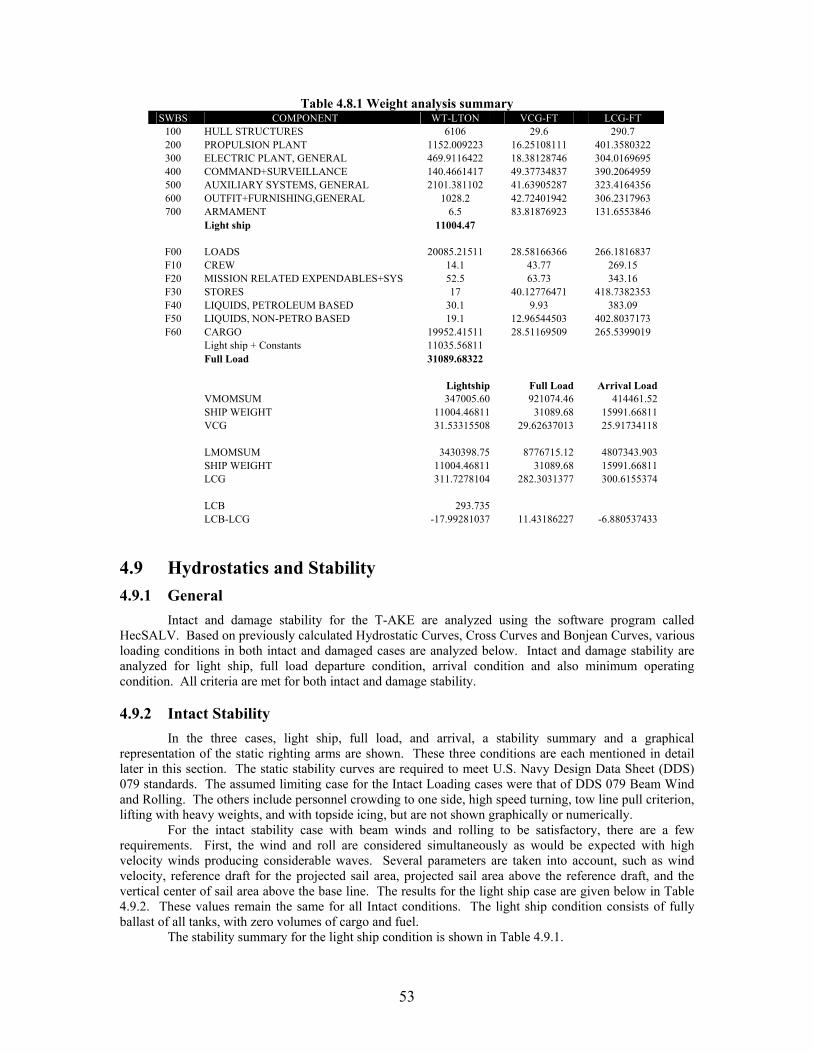
53
Table 4.8.1 Weight analysis summary SWBS COMPONENT WT-LTON VCG-FT LCG-FT
100 HULL STRUCTURES 6106 29.6 290.7 200 PROPULSION PLANT 1152.009223 16.25108111 401.3580322 300 ELECTRIC PLANT, GENERAL 469.9116422 18.38128746 304.0169695 400 COMMAND+SURVEILLANCE 140.4661417 49.37734837 390.2064959 500 AUXILIARY SYSTEMS, GENERAL 2101.381102 41.63905287 323.4164356 600 OUTFIT+FURNISHING,GENERAL 1028.2 42.72401942 306.2317963 700 ARMAMENT 6.5 83.81876923 131.6553846
Light ship 11004.47
F00 LOADS 20085.21511 28.58166366 266.1816837 F10 CREW 14.1 43.77 269.15 F20 MISSION RELATED EXPENDABLES+SYS 52.5 63.73 343.16 F30 STORES 17 40.12776471 418.7382353 F40 LIQUIDS, PETROLEUM BASED 30.1 9.93 383.09 F50 LIQUIDS, NON-PETRO BASED 19.1 12.96544503 402.8037173 F60 CARGO 19952.41511 28.51169509 265.5399019
Light ship + Constants 11035.56811 Full Load 31089.68322 Lightship Full Load Arrival Load VMOMSUM 347005.60 921074.46 414461.52 SHIP WEIGHT 11004.46811 31089.68 15991.66811 VCG 31.53315508 29.62637013 25.91734118 LMOMSUM 3430398.75 8776715.12 4807343.903 SHIP WEIGHT 11004.46811 31089.68 15991.66811 LCG 311.7278104 282.3031377 300.6155374
LCB 293.735 LCB-LCG -17.99281037 11.43186227 -6.880537433
4.9 Hydrostatics and Stability 4.9.1 General
Intact and damage stability for the T-AKE are analyzed using the software program called HecSALV. Based on previously calculated Hydrostatic Curves, Cross Curves and Bonjean Curves, various loading conditions in both intact and damaged cases are analyzed below. Intact and damage stability are analyzed for light ship, full load departure condition, arrival condition and also minimum operating condition. All criteria are met for both intact and damage stability.
4.9.2 Intact Stability
In the three cases, light ship, full load, and arrival, a stability summary and a graphical representation of the static righting arms are shown. These three conditions are each mentioned in detail later in this section. The static stability curves are required to meet U.S. Navy Design Data Sheet (DDS) 079 standards. The assumed limiting case for the Intact Loading cases were that of DDS 079 Beam Wind and Rolling. The others include personnel crowding to one side, high speed turning, tow line pull criterion, lifting with heavy weights, and with topside icing, but are not shown graphically or numerically.
For the intact stability case with beam winds and rolling to be satisfactory, there are a few requirements. First, the wind and roll are considered simultaneously as would be expected with high velocity winds producing considerable waves. Several parameters are taken into account, such as wind velocity, reference draft for the projected sail area, projected sail area above the reference draft, and the vertical center of sail area above the base line. The results for the light ship case are given below in Table 4.9.2. These values remain the same for all Intact conditions. The light ship condition consists of fully ballast of all tanks, with zero volumes of cargo and fuel.
The stability summary for the light ship condition is shown in Table 4.9.1.
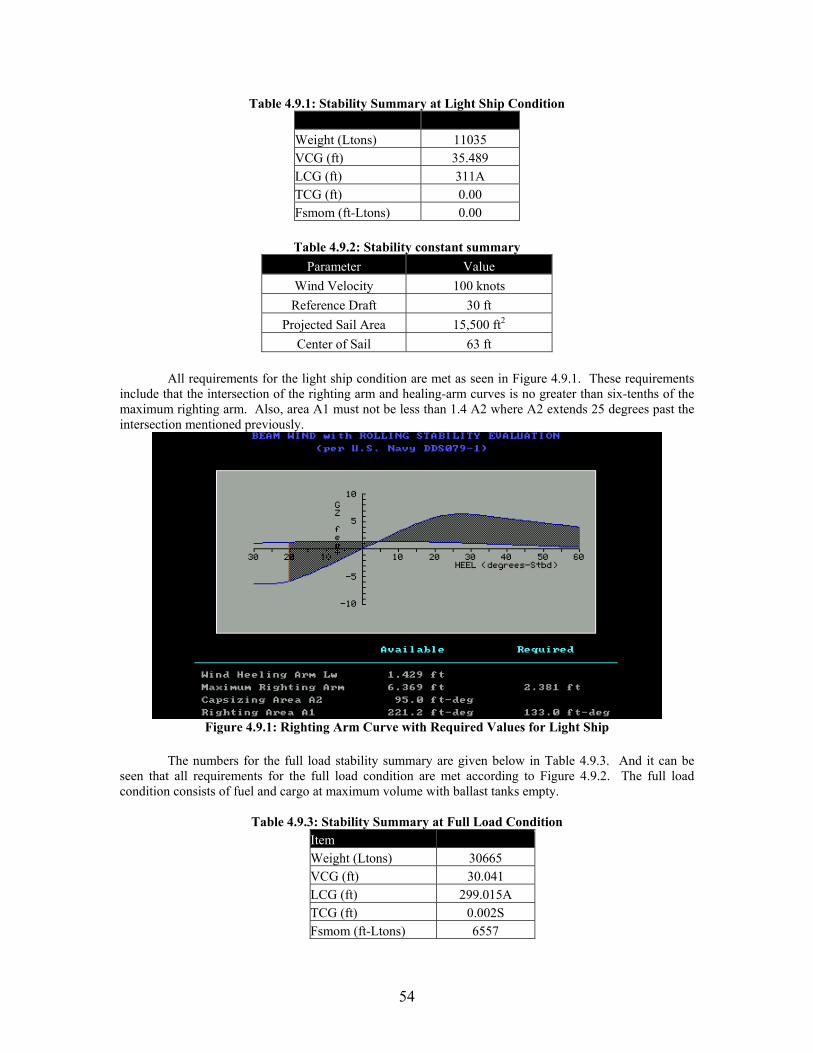
54
Table 4.9.1: Stability Summary at Light Ship Condition
Weight (Ltons) 11035 VCG (ft) 35.489 LCG (ft) 311A TCG (ft) 0.00 Fsmom (ft-Ltons) 0.00
Table 4.9.2: Stability constant summary
Parameter Value Wind Velocity 100 knots Reference Draft 30 ft
Projected Sail Area 15,500 ft2 Center of Sail 63 ft
All requirements for the light ship condition are met as seen in Figure 4.9.1. These requirements
include that the intersection of the righting arm and healing-arm curves is no greater than six-tenths of the maximum righting arm. Also, area A1 must not be less than 1.4 A2 where A2 extends 25 degrees past the intersection mentioned previously.
Figure 4.9.1: Righting Arm Curve with Required Values for Light Ship
The numbers for the full load stability summary are given below in Table 4.9.3. And it can be
seen that all requirements for the full load condition are met according to Figure 4.9.2. The full load condition consists of fuel and cargo at maximum volume with ballast tanks empty.
Table 4.9.3: Stability Summary at Full Load Condition
Item Weight (Ltons) 30665 VCG (ft) 30.041 LCG (ft) 299.015A TCG (ft) 0.002S Fsmom (ft-Ltons) 6557
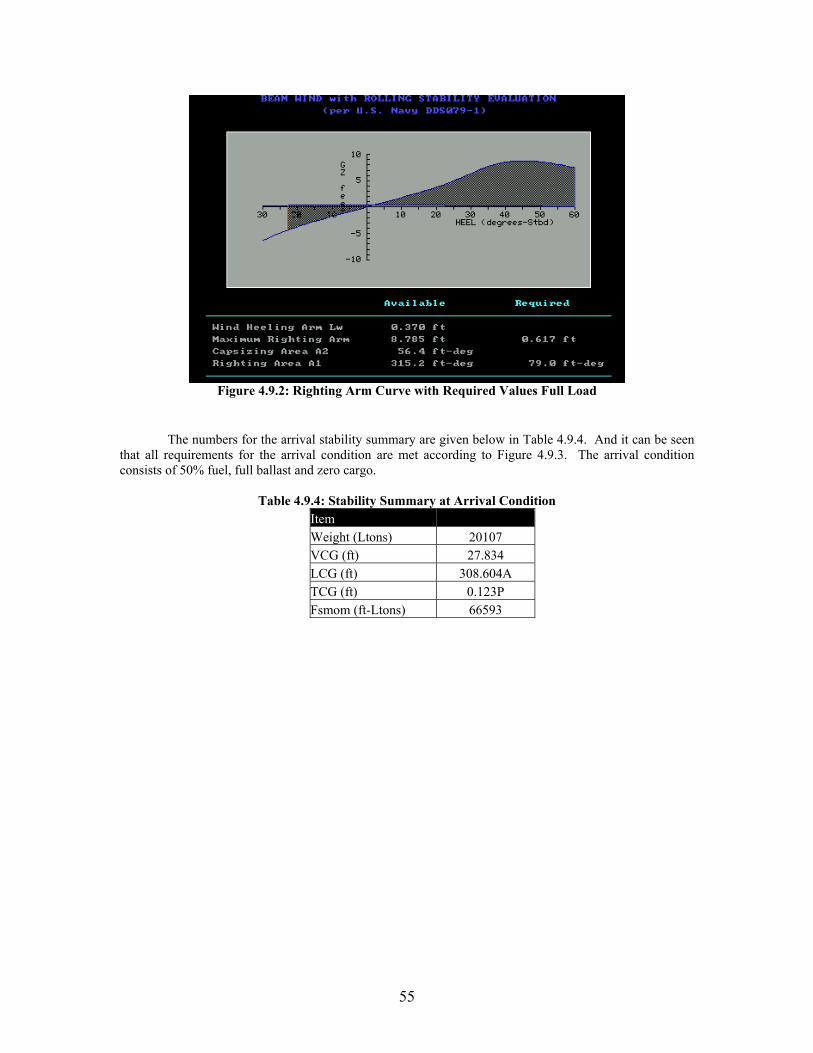
55
Figure 4.9.2: Righting Arm Curve with Required Values Full Load
The numbers for the arrival stability summary are given below in Table 4.9.4. And it can be seen
that all requirements for the arrival condition are met according to Figure 4.9.3. The arrival condition consists of 50% fuel, full ballast and zero cargo.
Table 4.9.4: Stability Summary at Arrival Condition
Item Weight (Ltons) 20107 VCG (ft) 27.834 LCG (ft) 308.604A TCG (ft) 0.123P Fsmom (ft-Ltons) 66593
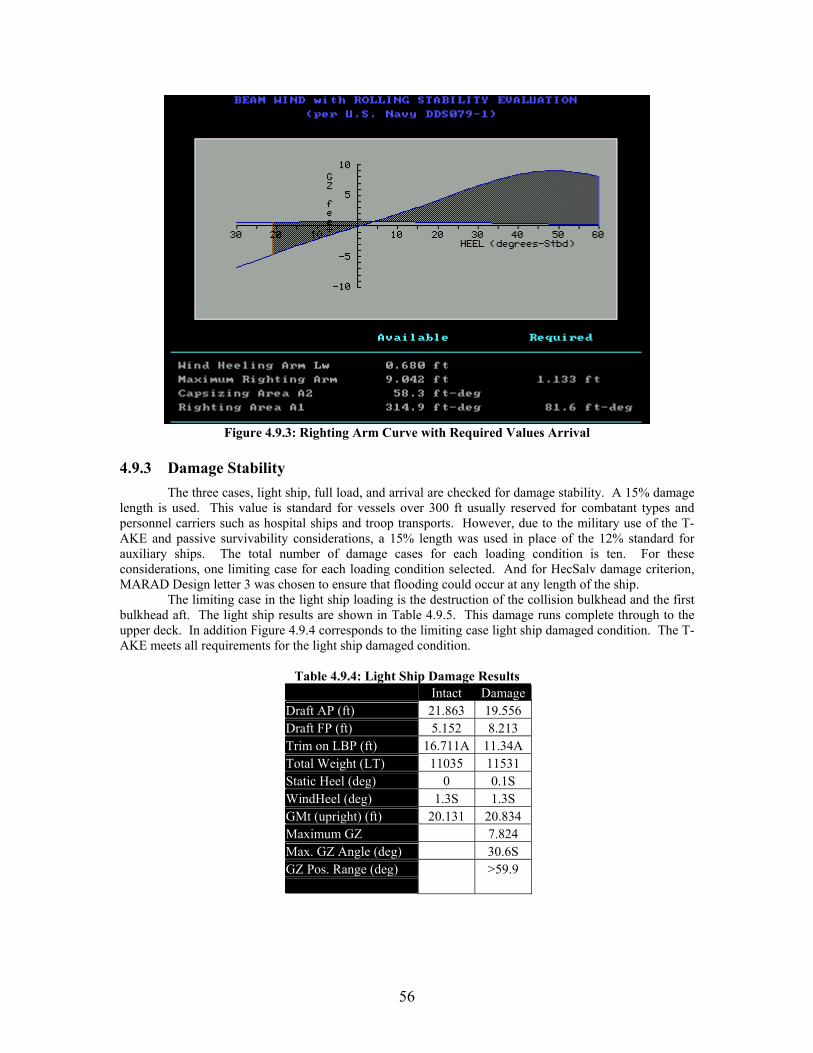
56
Figure 4.9.3: Righting Arm Curve with Required Values Arrival
4.9.3 Damage Stability
The three cases, light ship, full load, and arrival are checked for damage stability. A 15% damage length is used. This value is standard for vessels over 300 ft usually reserved for combatant types and personnel carriers such as hospital ships and troop transports. However, due to the military use of the T-AKE and passive survivability considerations, a 15% length was used in place of the 12% standard for auxiliary ships. The total number of damage cases for each loading condition is ten. For these considerations, one limiting case for each loading condition selected. And for HecSalv damage criterion, MARAD Design letter 3 was chosen to ensure that flooding could occur at any length of the ship.
The limiting case in the light ship loading is the destruction of the collision bulkhead and the first bulkhead aft. The light ship results are shown in Table 4.9.5. This damage runs complete through to the upper deck. In addition Figure 4.9.4 corresponds to the limiting case light ship damaged condition. The T-AKE meets all requirements for the light ship damaged condition.
Table 4.9.4: Light Ship Damage Results
Intact DamageDraft AP (ft) 21.863 19.556 Draft FP (ft) 5.152 8.213 Trim on LBP (ft) 16.711A 11.34A Total Weight (LT) 11035 11531 Static Heel (deg) 0 0.1S WindHeel (deg) 1.3S 1.3S GMt (upright) (ft) 20.131 20.834 Maximum GZ 7.824 Max. GZ Angle (deg) 30.6S GZ Pos. Range (deg) >59.9
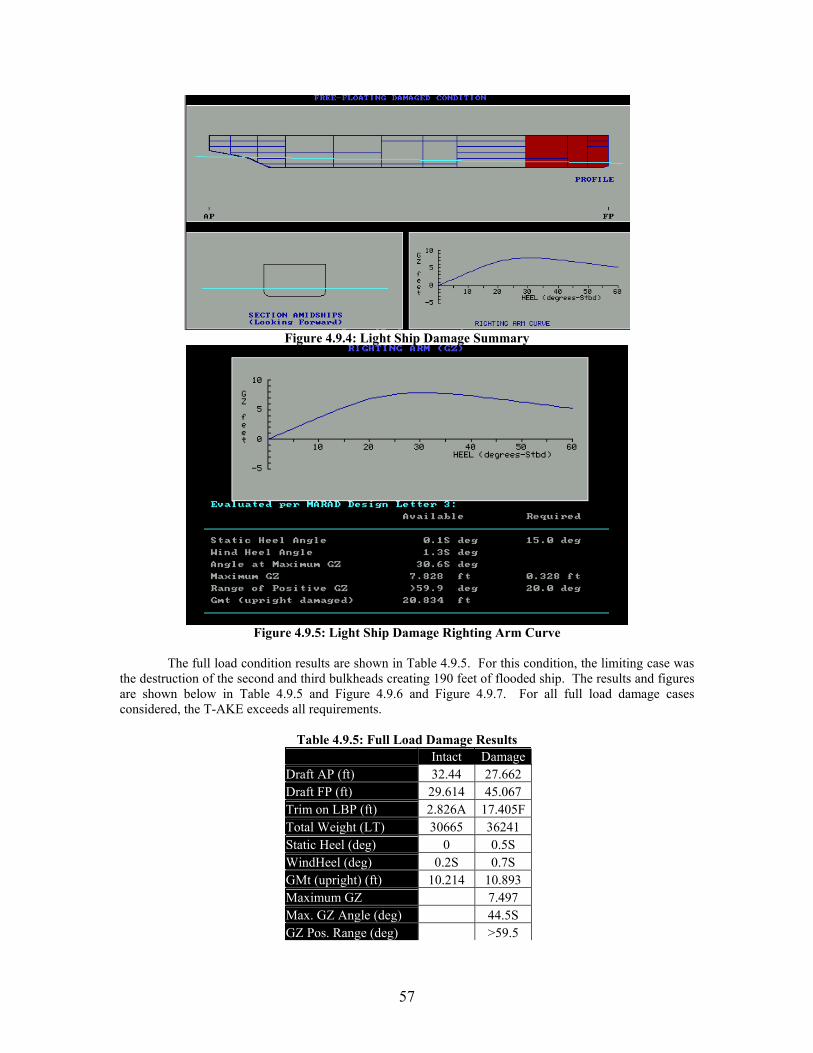
57
Figure 4.9.4: Light Ship Damage Summary
Figure 4.9.5: Light Ship Damage Righting Arm Curve
The full load condition results are shown in Table 4.9.5. For this condition, the limiting case was
the destruction of the second and third bulkheads creating 190 feet of flooded ship. The results and figures are shown below in Table 4.9.5 and Figure 4.9.6 and Figure 4.9.7. For all full load damage cases considered, the T-AKE exceeds all requirements.
Table 4.9.5: Full Load Damage Results
Intact DamageDraft AP (ft) 32.44 27.662 Draft FP (ft) 29.614 45.067 Trim on LBP (ft) 2.826A 17.405FTotal Weight (LT) 30665 36241 Static Heel (deg) 0 0.5S WindHeel (deg) 0.2S 0.7S GMt (upright) (ft) 10.214 10.893 Maximum GZ 7.497 Max. GZ Angle (deg) 44.5S GZ Pos. Range (deg) >59.5
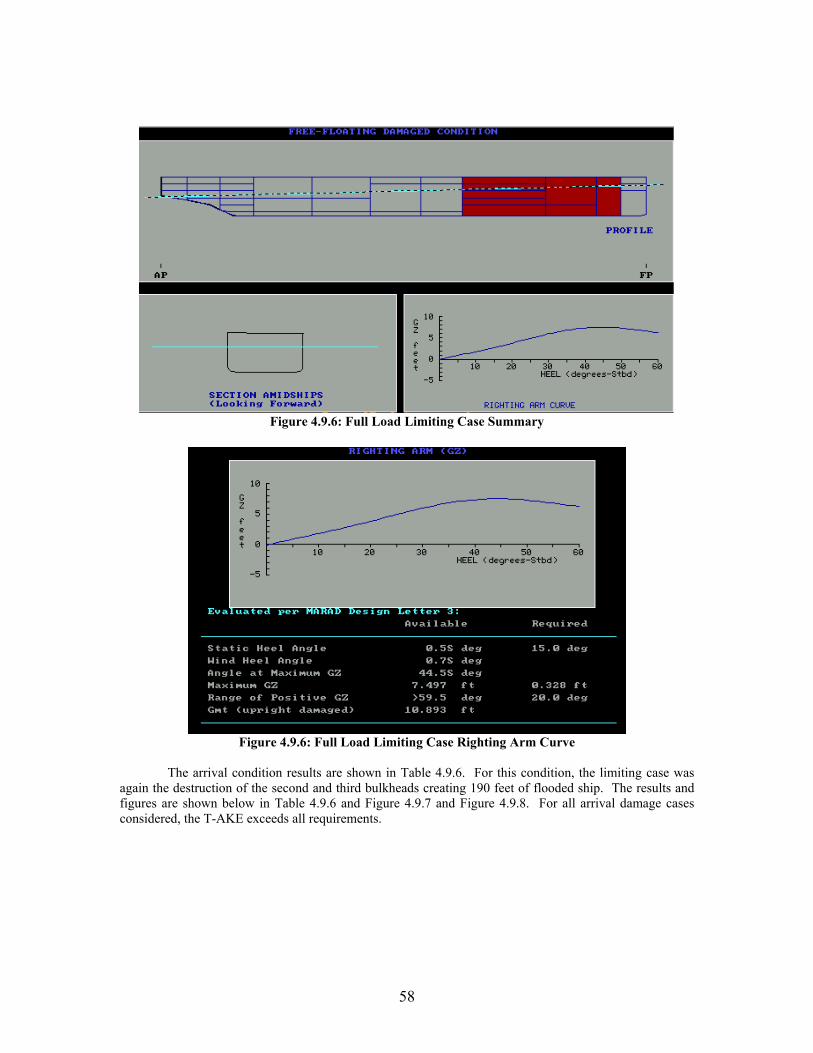
58
Figure 4.9.6: Full Load Limiting Case Summary
Figure 4.9.6: Full Load Limiting Case Righting Arm Curve
The arrival condition results are shown in Table 4.9.6. For this condition, the limiting case was
again the destruction of the second and third bulkheads creating 190 feet of flooded ship. The results and figures are shown below in Table 4.9.6 and Figure 4.9.7 and Figure 4.9.8. For all arrival damage cases considered, the T-AKE exceeds all requirements.
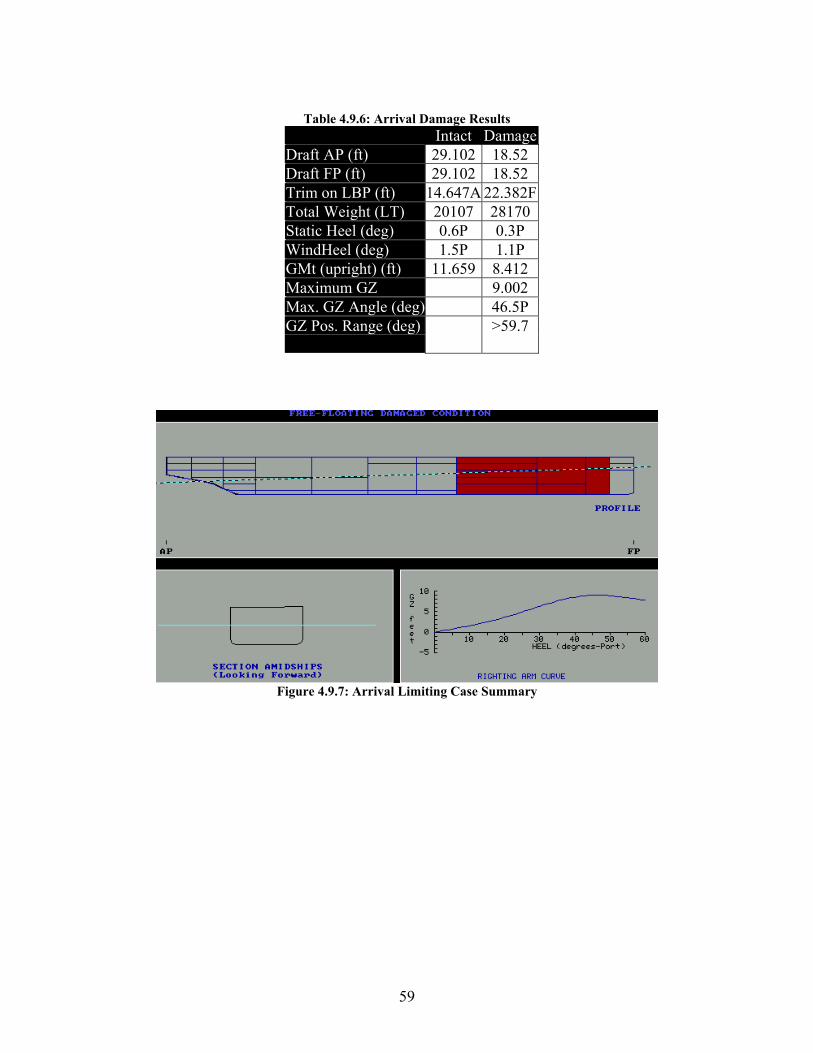
59
Table 4.9.6: Arrival Damage Results
Figure 4.9.7: Arrival Limiting Case Summary
Intact DamageDraft AP (ft) 29.102 18.52 Draft FP (ft) 29.102 18.52 Trim on LBP (ft) 14.647A 22.382FTotal Weight (LT) 20107 28170 Static Heel (deg) 0.6P 0.3P WindHeel (deg) 1.5P 1.1P GMt (upright) (ft) 11.659 8.412 Maximum GZ 9.002 Max. GZ Angle (deg) 46.5P GZ Pos. Range (deg) >59.7
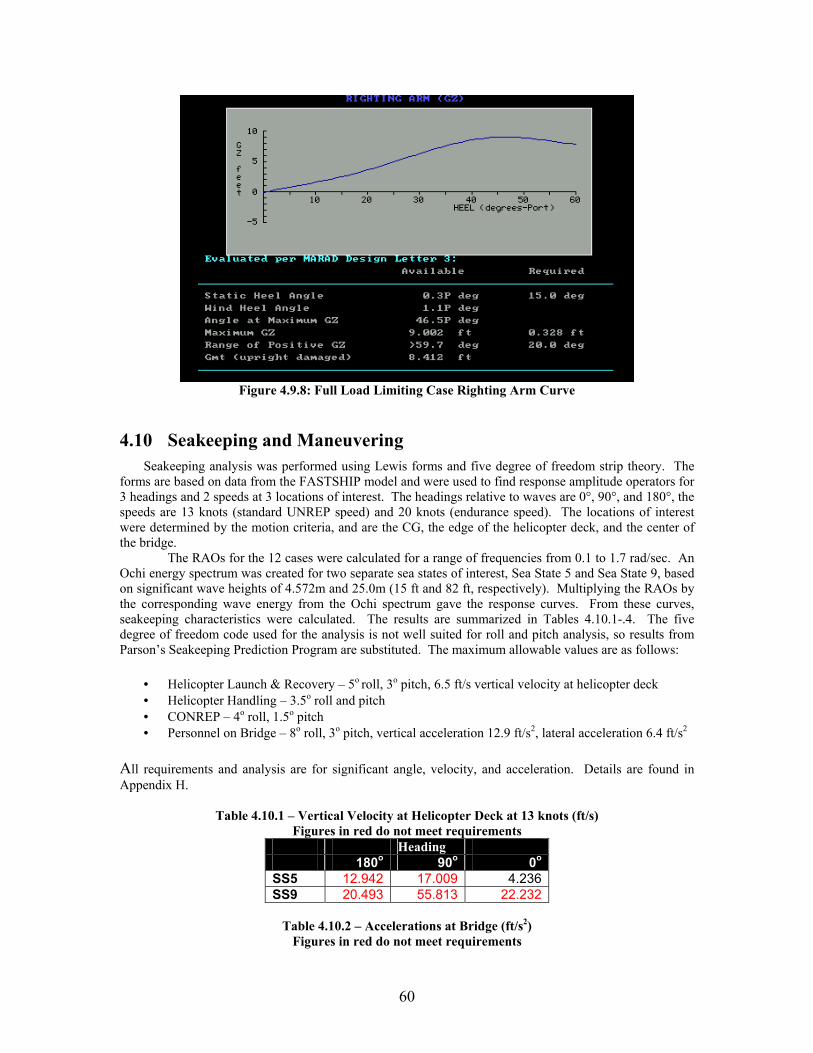
60
Figure 4.9.8: Full Load Limiting Case Righting Arm Curve
4.10 Seakeeping and Maneuvering Seakeeping analysis was performed using Lewis forms and five degree of freedom strip theory. The
forms are based on data from the FASTSHIP model and were used to find response amplitude operators for 3 headings and 2 speeds at 3 locations of interest. The headings relative to waves are 0°, 90°, and 180°, the speeds are 13 knots (standard UNREP speed) and 20 knots (endurance speed). The locations of interest were determined by the motion criteria, and are the CG, the edge of the helicopter deck, and the center of the bridge.
The RAOs for the 12 cases were calculated for a range of frequencies from 0.1 to 1.7 rad/sec. An Ochi energy spectrum was created for two separate sea states of interest, Sea State 5 and Sea State 9, based on significant wave heights of 4.572m and 25.0m (15 ft and 82 ft, respectively). Multiplying the RAOs by the corresponding wave energy from the Ochi spectrum gave the response curves. From these curves, seakeeping characteristics were calculated. The results are summarized in Tables 4.10.1-.4. The five degree of freedom code used for the analysis is not well suited for roll and pitch analysis, so results from Parson’s Seakeeping Prediction Program are substituted. The maximum allowable values are as follows:
• Helicopter Launch & Recovery – 5o roll, 3o pitch, 6.5 ft/s vertical velocity at helicopter deck • Helicopter Handling – 3.5o roll and pitch • CONREP – 4o roll, 1.5o pitch • Personnel on Bridge – 8o roll, 3o pitch, vertical acceleration 12.9 ft/s2, lateral acceleration 6.4 ft/s2
All requirements and analysis are for significant angle, velocity, and acceleration. Details are found in Appendix H.
Table 4.10.1 – Vertical Velocity at Helicopter Deck at 13 knots (ft/s) Figures in red do not meet requirements
Heading 180o 90o 0o
SS5 12.942 17.009 4.236SS9 20.493 55.813 22.232
Table 4.10.2 – Accelerations at Bridge (ft/s2)
Figures in red do not meet requirements
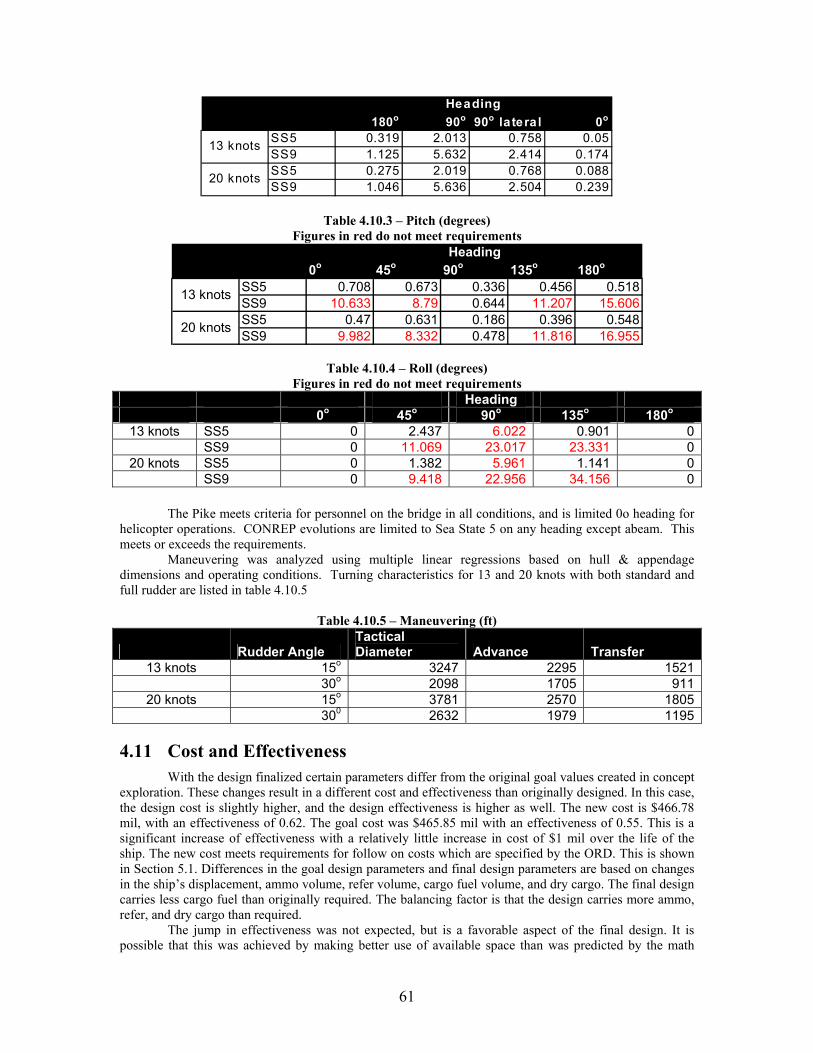
61
180o 90o 90o lateral 0o
SS5 0.319 2.013 0.758 0.05SS9 1.125 5.632 2.414 0.174SS5 0.275 2.019 0.768 0.088SS9 1.046 5.636 2.504 0.239
Heading
13 knots
20 knots
Table 4.10.3 – Pitch (degrees)
Figures in red do not meet requirements
0o 45o 90o 135o 180o
SS5 0.708 0.673 0.336 0.456 0.518SS9 10.633 8.79 0.644 11.207 15.606SS5 0.47 0.631 0.186 0.396 0.548SS9 9.982 8.332 0.478 11.816 16.955
Heading
13 knots
20 knots
Table 4.10.4 – Roll (degrees)
Figures in red do not meet requirements Heading 0o 45o 90o 135o 180o
13 knots SS5 0 2.437 6.022 0.901 0 SS9 0 11.069 23.017 23.331 0
20 knots SS5 0 1.382 5.961 1.141 0 SS9 0 9.418 22.956 34.156 0
The Pike meets criteria for personnel on the bridge in all conditions, and is limited 0o heading for helicopter operations. CONREP evolutions are limited to Sea State 5 on any heading except abeam. This meets or exceeds the requirements.
Maneuvering was analyzed using multiple linear regressions based on hull & appendage dimensions and operating conditions. Turning characteristics for 13 and 20 knots with both standard and full rudder are listed in table 4.10.5
Table 4.10.5 – Maneuvering (ft)
Rudder Angle Tactical Diameter Advance Transfer
13 knots 15o 3247 2295 1521 30o 2098 1705 911
20 knots 15o 3781 2570 1805 300 2632 1979 1195
4.11 Cost and Effectiveness With the design finalized certain parameters differ from the original goal values created in concept
exploration. These changes result in a different cost and effectiveness than originally designed. In this case, the design cost is slightly higher, and the design effectiveness is higher as well. The new cost is $466.78 mil, with an effectiveness of 0.62. The goal cost was $465.85 mil with an effectiveness of 0.55. This is a significant increase of effectiveness with a relatively little increase in cost of $1 mil over the life of the ship. The new cost meets requirements for follow on costs which are specified by the ORD. This is shown in Section 5.1. Differences in the goal design parameters and final design parameters are based on changes in the ship’s displacement, ammo volume, refer volume, cargo fuel volume, and dry cargo. The final design carries less cargo fuel than originally required. The balancing factor is that the design carries more ammo, refer, and dry cargo than required.
The jump in effectiveness was not expected, but is a favorable aspect of the final design. It is possible that this was achieved by making better use of available space than was predicted by the math
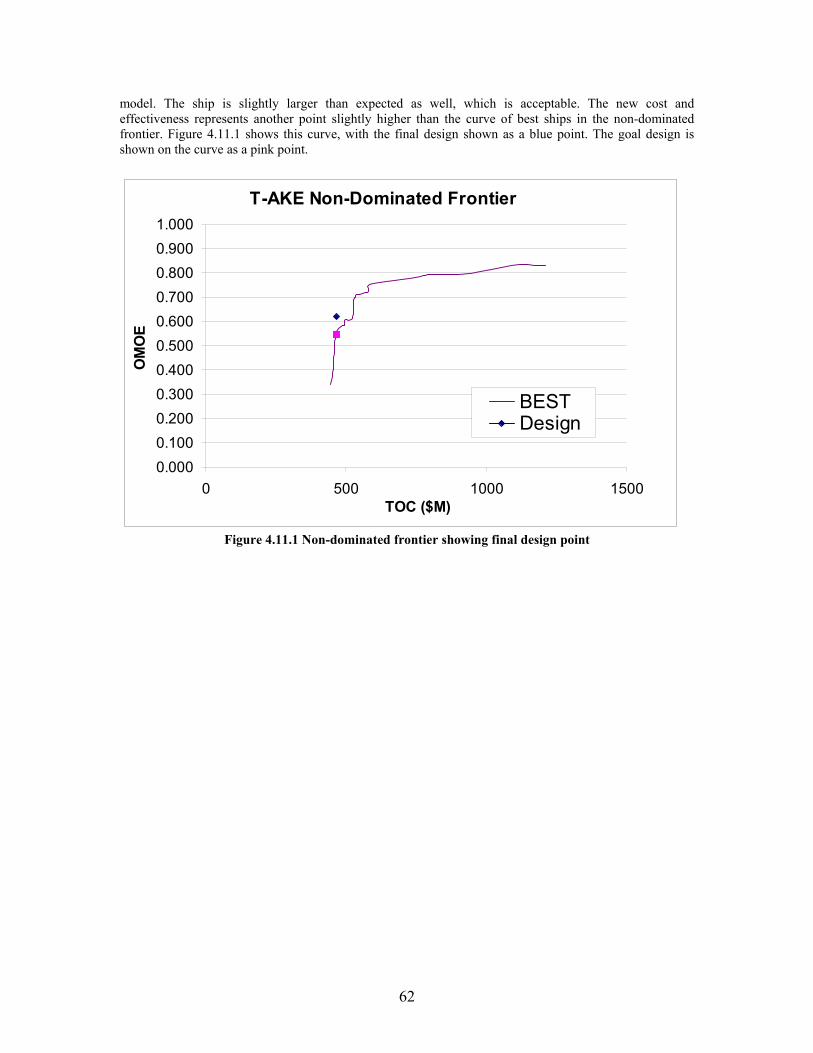
62
model. The ship is slightly larger than expected as well, which is acceptable. The new cost and effectiveness represents another point slightly higher than the curve of best ships in the non-dominated frontier. Figure 4.11.1 shows this curve, with the final design shown as a blue point. The goal design is shown on the curve as a pink point.
T-AKE Non-Dominated Frontier
0.0000.1000.2000.3000.4000.5000.6000.7000.8000.9001.000
0 500 1000 1500TOC ($M)
OM
OE
BESTDesign
Figure 4.11.1 Non-dominated frontier showing final design point
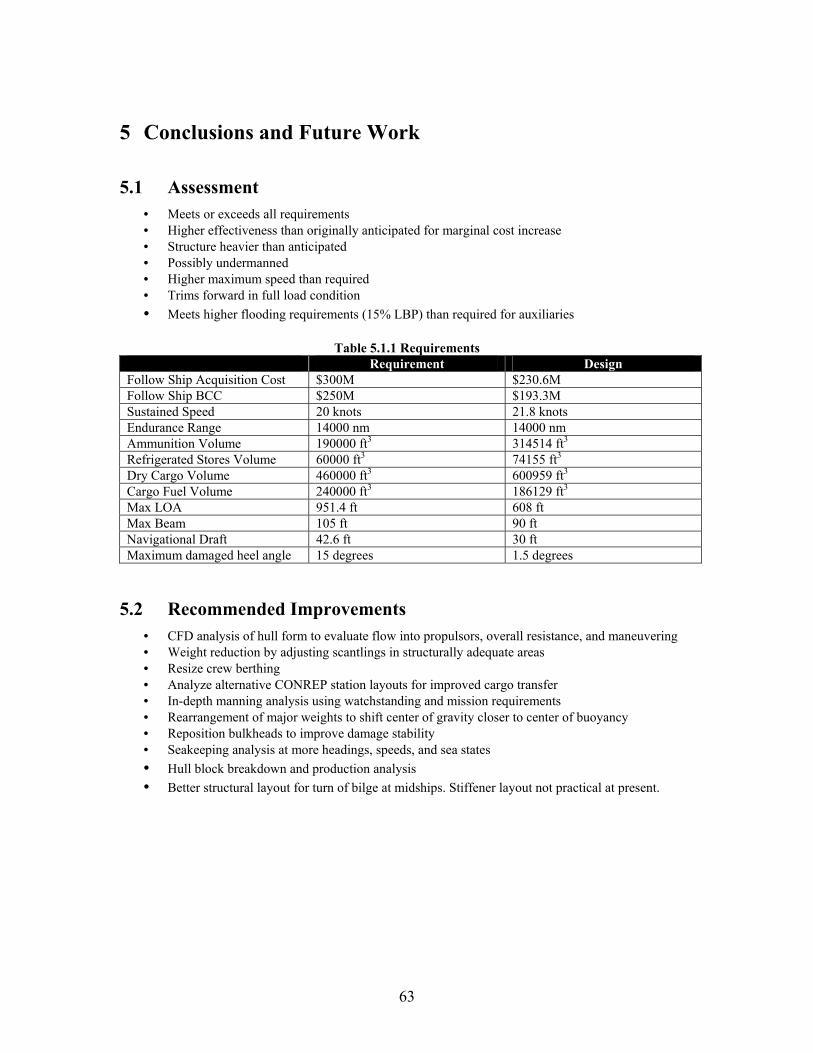
63
5 Conclusions and Future Work
5.1 Assessment • Meets or exceeds all requirements • Higher effectiveness than originally anticipated for marginal cost increase • Structure heavier than anticipated • Possibly undermanned • Higher maximum speed than required • Trims forward in full load condition • Meets higher flooding requirements (15% LBP) than required for auxiliaries
Table 5.1.1 Requirements Requirement Design
Follow Ship Acquisition Cost $300M $230.6M Follow Ship BCC $250M $193.3M Sustained Speed 20 knots 21.8 knots Endurance Range 14000 nm 14000 nm Ammunition Volume 190000 ft3 314514 ft3
Refrigerated Stores Volume 60000 ft3 74155 ft3
Dry Cargo Volume 460000 ft3 600959 ft3
Cargo Fuel Volume 240000 ft3 186129 ft3
Max LOA 951.4 ft 608 ft Max Beam 105 ft 90 ft Navigational Draft 42.6 ft 30 ft Maximum damaged heel angle 15 degrees 1.5 degrees
5.2 Recommended Improvements • CFD analysis of hull form to evaluate flow into propulsors, overall resistance, and maneuvering • Weight reduction by adjusting scantlings in structurally adequate areas • Resize crew berthing • Analyze alternative CONREP station layouts for improved cargo transfer • In-depth manning analysis using watchstanding and mission requirements • Rearrangement of major weights to shift center of gravity closer to center of buoyancy • Reposition bulkheads to improve damage stability • Seakeeping analysis at more headings, speeds, and sea states • Hull block breakdown and production analysis • Better structural layout for turn of bilge at midships. Stiffener layout not practical at present.