autoslope manual module 2 - members.iinet.net.aumembers.iinet.net.au/~softrock/support/module 2 -...
TRANSCRIPT

Autoslope Manual
June 2009, Rev.2.50
Autoslope Manual Module 2
Software Version 6
SoftRock Solutions specialise in slope monitoring. We have developed software and systems that will assist you with your slope monitoring needs.
Autoslope Manual
June 2009 , Rev.2.50 2
Release Information
Prepared By : Harsha Seneviratne (HS) Reviewed By : Bernie Malone (BM) Authorised By : Bernie Malone
Configuration History Version No. Date Change
Details Author
2.33 Jan 2007 Old format BM 2.50 Jun 2009 Upgrade to
new template
HS
Distribution Copy No. Date Name(s) 1 Jun 2009 SoftRock File 2 Jun 2009 Website Release
Autoslope Manual
June 2009 , Rev.2.50 3
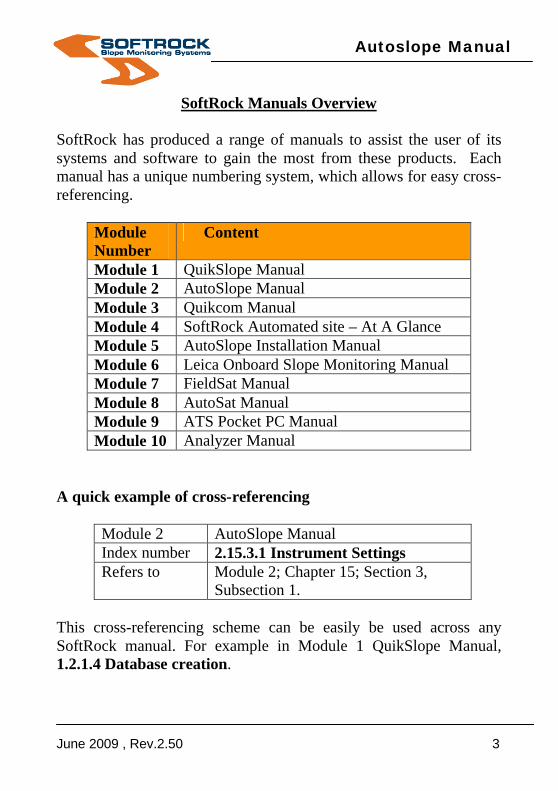
SoftRock Manuals Overview SoftRock has produced a range of manuals to assist the user of its systems and software to gain the most from these products. Each manual has a unique numbering system, which allows for easy cross-referencing.
Module Number
Content
Module 1 QuikSlope Manual Module 2 AutoSlope Manual Module 3 Quikcom Manual Module 4 SoftRock Automated site – At A Glance Module 5 AutoSlope Installation Manual Module 6 Leica Onboard Slope Monitoring Manual Module 7 FieldSat Manual Module 8 AutoSat Manual Module 9 ATS Pocket PC Manual Module 10 Analyzer Manual
A quick example of cross-referencing
Module 2 AutoSlope Manual Index number 2.15.3.1 Instrument Settings Refers to Module 2; Chapter 15; Section 3,
Subsection 1. This cross-referencing scheme can be easily be used across any SoftRock manual. For example in Module 1 QuikSlope Manual, 1.2.1.4 Database creation.

Autoslope Manual
June 2009 , Rev.2.50 4
We regularly make use of cross-referencing to other manuals within our software collection. This avoids repetition, and makes for easy updating, and provides an efficient method to record information. It is therefore important the user understands this unique numbering system, as all the information for our programs cannot fit into one single manual.

Autoslope Manual
June 2009 , Rev.2.50 5
CONTENTS
INTRODUCTION ................................................................................................8
PART 1 PREPARATION ..................................................................................9 2.0 GETTING STARTED......................................................................................9 2.1.0 INSTRUMENT SETUP ...............................................................................13
2.1.1 Configuring Geodimeter ATS for Automatic Monitoring .............13 2.1.1.1 To Set Correct Units of Measure........................................................... 13 2.1.1.2 To Set Prism Constant .......................................................................... 16 2.1.1.3 To Check Units .................................................................................... 18 2.1.1.4 To Check PPM..................................................................................... 18 2.1.1.5 To Check Prism Constant ..................................................................... 18 2.1.1.6 To Check Temperature ......................................................................... 19 2.1.1.7 To Check Pressure................................................................................ 19 2.1.1.8 To Set RPU.......................................................................................... 20
2.1.2 Configuring Leica TCA1100 & 1800 for Automatic Monitoring ..21 2.1.2.1 GSI Mode ............................................................................................ 21 2.1.2.2 Communication protocol ...................................................................... 21 2.1.2.3 Rec mask to 8 bit.................................................................................. 22 2.1.2.4 Turn ATR ON...................................................................................... 22 2.1.2.5 Set EDM measure mode to Standard ..................................................... 23 2.1.2.6 Set Sleep Time ..................................................................................... 24 2.1.2.7 Check prism constant............................................................................ 25 2.1.2.8 Check ppm settings .............................................................................. 26
2.1.2 Configuring Leica TPS1200 & TM30 ...........................................27 2.2.0 AUTOSLOPE SECURITY & REGISTRATION................................................28
2.2.1 Auto Start AutoSlope Program.....................................................28 2.2.2 AutoSlope to Run at Startup For 24 Hour Scheduler .................30 2.2.3 AutoSlope to Run at Startup For Scheduler List.........................32
2.3.0 STARTING AUTOSLOPE...........................................................................34 2.3.1 Autoslope Main Window ...............................................................37
2.3.1.1 Data Window ....................................................................................... 37 2.3.1.2 Critical Errors & Notes......................................................................... 38 2.3.1.3 Prism group name................................................................................. 38 2.3.1.4 Instrument (or Radio) number............................................................... 38 2.3.1.5 Additional Buttons and Information ...................................................... 38 2.3.1.5.1 Instrument Status............................................................................... 38 2.3.1.5.2 Test and information buttons.............................................................. 39 2.3.1.5.3 Add New Prisms................................................................................ 39 2.3.1.5.4 Pocketview Window.......................................................................... 42

Autoslope Manual
June 2009 , Rev.2.50 6
2.4.0 GRAPHICS SETUP ...................................................................................45 2.4.1 Setting up Graphics ......................................................................47 2.4.2 Setup for XYZ Coordinate System...............................................48
2.5.0 DATA WINDOW......................................................................................49 2.6.0 TIMING & SCHEDULE .............................................................................52
2.6.1 Manual Mode.................................................................................53 2.6.2 24 Hour Scheduler ........................................................................54 2.6.3 Continuous ....................................................................................57 2.6.4 Delayed..........................................................................................58 2.6.5 Schedule List.................................................................................59
2.7.0 ALARMS ................................................................................................61 2.7.1 Alarm Controls...............................................................................61 2.7.2 Alarm Thresholds ..........................................................................71
2.7.2.1 Threshold Settings................................................................................ 73 2.8.0 HISTORY................................................................................................76 2.9.0 REPORTS ...............................................................................................77
2.9.1 Delinquent Prisms Management Report .....................................78 2.9.2 Homeless Prism Report................................................................81 2.9.3 Group Prism Coordinate Report ..................................................82 2.9.4 Survey Control Co-ordinate Report .............................................83 2.9.5 Quality Of Measurements.............................................................84 2.9.6 Manual Basic Reports...................................................................86 2.9.7 Automatic Reports ........................................................................87
2.10.0 SETTINGS.............................................................................................90 2.11.0 GRAPHING ...........................................................................................92 2.12.0 UTILITY ...............................................................................................94
2.12.1 Update Proxy to Dbase ..............................................................94 2.13.0 HELP AND EXIT ....................................................................................95
2.13.1 View pdf Help ..............................................................................95 2.13.2 About AutoSlope .........................................................................96 2.13.3 Exit ...............................................................................................97
2.14.0 DATA COMMUNICATION: EXPLANATION OF DATA.................................98 2.14.1 Data Window Geodimeter ..........................................................98 2.14.2 Data Window Leica.....................................................................99 2.14.3 Reading Sequence .....................................................................99
2.15.0 SMS ALARM SETUP ...........................................................................101 PART 3 AUTOTOOLS PROGRAM .............................................................102
2.16.0 STARTING AUTOTOOLS.......................................................................102 2.16.1 To Select an existing Project....................................................104

Autoslope Manual
June 2009 , Rev.2.50 7
2.16.2 To Add a New Project...............................................................104 2.16.2.1 Files & Paths Tab ............................................................................. 106
Working dbase (Benchmarks) ..................................................................107 2.16.2.2 Switches........................................................................................... 111 2.16.2.3 Alarm Configuration......................................................................... 115
2.16.3 Communication Settings ..........................................................121 2.16.3.1 Instrumentation Settings ................................................................... 121 2.16.3.2 Program License Information............................................................ 123 2.16.3.3 Control Adjustments......................................................................... 125 2.16.3.4 Instrument Communication Settings.................................................. 127 2.16.3.5 Weather Station Communication Settings.......................................... 130 2.16.3.6 AutoWeather Program...................................................................... 133
PART 4 AUTOXYZ PROGRAM...................................................................140 2.17.0 AUTOXYZ.........................................................................................140
2.17.1 Control Database ......................................................................142 2.17.2 Prism Database.........................................................................147 2.17.3 Prism Group Management .......................................................154
2.17.3.1 Edit Group ....................................................................................... 155 Multiple REF Prisms ..................................................................................... 159 2.17.3.2 New Group....................................................................................... 160 2.17.3.3 Delete Group.................................................................................... 163 2.17.3.4 Copy Group ..................................................................................... 163 2.17.3.5 Export Windows CE......................................................................... 165
PART 5 ADDITIONAL INFORMATION.......................................................167 2.18.0 QUIKSLOPE........................................................................................167 2.19.0 BACKING UP FILES.............................................................................168 2.20.0 RADIO SELECTION..............................................................................169
2.20.1.1 Cable......................................................................................... 169 2.20.1.2 RFI595F.................................................................................... 171 2.20.1.3 ELPRO 905U-D ........................................................................ 173 2.20.1.4 Elpro 905U-E ............................................................................ 175 2.20.1.5 Georadio ................................................................................... 176 2.20.1.6 PDL .......................................................................................... 177 2.20.1.7 PDL-R........................................................................................ 178
2.21.0 DATA GRID EDITING ..........................................................................179

Autoslope Manual
June 2009 , Rev.2.50 8
Introduction There are three programs associated with the AutoSlope system. 1. AutoTools 2. AutoXYZ Program. 3. The AutoSlope Program. AutoTools This is where you enter the AutoSlope Program Settings. This includes communication parameters, radios, control adjustments, atmospheric corrections etc. Here you also create new projects. AutoXYZ This where you setup all the site information associated with the monitoring process, including station information, prism coordinates, editing data and group monitoring etc. AutoSlope This is the program that drives and manages the instruments and associated peripherals (weather station, alarms etc.) through the monitoring process. Note: AutoSlope can control multiple project areas. This allows for separate project files for 1. Graphics and coordinate settings 2. QuikSlope Database Hence if you have 2 distinct pits that are far apart, they can be controlled (if the telemetry is possible) from one computer using AutoSlope. The Scheduler can be used to switch from project to project, the graphic will depict each project, and the data can be sent to different QuikSlope databases.

Autoslope Manual
June 2009 , Rev.2.50 9
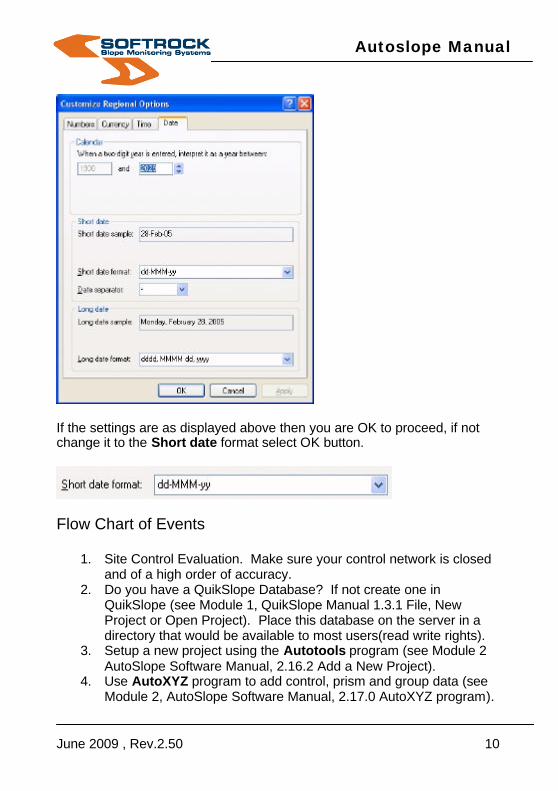
Part 1 Preparation 2.0 Getting Started Date Format It is very important to understand how the software looks at dates. You must have it in the short date format. The short date format is Day Month Year shown at 1 Jan 2000 (dd-mmm-yy). This is to avoid confusion between the many formats that can be used. Please do this on your computer before you install me. How to check if the regional settings on your computer are correct-
? Go to the start button ? Settings ? Left Click Control Panel ? Look for regional and Language Options, double click this option
? Select the short date box and highlight it. Select the customize button.
Autoslope Manual
June 2009 , Rev.2.50 10
If the settings are as displayed above then you are OK to proceed, if not change it to the Short date format select OK button.
Flow Chart of Events
1. Site Control Evaluation. Make sure your control network is closed and of a high order of accuracy.
2. Do you have a QuikSlope Database? If not create one in QuikSlope (see Module 1, QuikSlope Manual 1.3.1 File, New Project or Open Project). Place this database on the server in a directory that would be available to most users(read write rights).
3. Setup a new project using the Autotools program (see Module 2 AutoSlope Software Manual, 2.16.2 Add a New Project).
4. Use AutoXYZ program to add control, prism and group data (see Module 2, AutoSlope Software Manual, 2.17.0 AutoXYZ program).
Autoslope Manual
June 2009 , Rev.2.50 11
5. Start the AutoSlope Program for Monitoring (see Module 2 AutoSlope Software Manual, 2.3.0 Starting AutoSlope).
6. Use the Scheduler in AutoSlope Program to time your monitoring. (see Module 2 AutoSlope Software Manual, 2.6.0 Timing & Schedule).
Files(Please read me!) Quiklsope The QuikSlope Database once created will have an extension of .mdb, It will look like xxxxxx.mdb (any length alpha only). It must be a unique name as all the AutoSlope monitoring data will be placed here. You can then access this information by starting the QuikSlope program and creating your graphs, reports or for viewing purposes only. Autotools This is where you create the project. This is a name with the extension .ini, it will look like xxxxxx.ini (any length alpha only). Here you set the path to where your QuikSlope database lives on the server. Also to the dbases, log and inp file addresses. All the communication settings, alarm profiles, control adjustments, and weather station information is filled in at this program. AutoXYZ This is where you add your control stations, Reference targets, prisms and groups for the monitoring process. It basically stores all the data that the instrument is required to use when monitoring a group of prisms. Remember to put any new control stations, reference targets or monitoring prisms here. You must then create groups of prisms for the instrument to monitor. AutoSlope Program This is the program that runs the instrument and captures all the field data and then places this information in the QuikSlope database. To enter this program you must use the Project name created in Autotools. AutoSlope program creates files with extensions .inp and log. The inp and log file is automatically created and the format being group name=month day time. Example: East=11-01~0132.inp and east=11-01~0132.log

Autoslope Manual
June 2009 , Rev.2.50 12
The AutoSlope program processes the inp file, calculates the adjusted Northing, Easting and Elevation and places this information in the QuikSlope database. The adjustments, calculations and control reference checks are carried out by the program. All the user is required to do is view the data. The log files are created for sorting out any errors in the monitoring process. These two files can be sent to Softrock for error analysis if required. These inp and log files are automatically archived and zipped using the month and year they were created e.g. logs2005-06.zip and inps2005-06.zip. For this example, the 06 is the month being June and 2005 the year. To extract any of these files the program uses Winzip. This allows for easy housekeeping, without the need for the user to do any of this.
Autoslope Manual
June 2009 , Rev.2.50 13
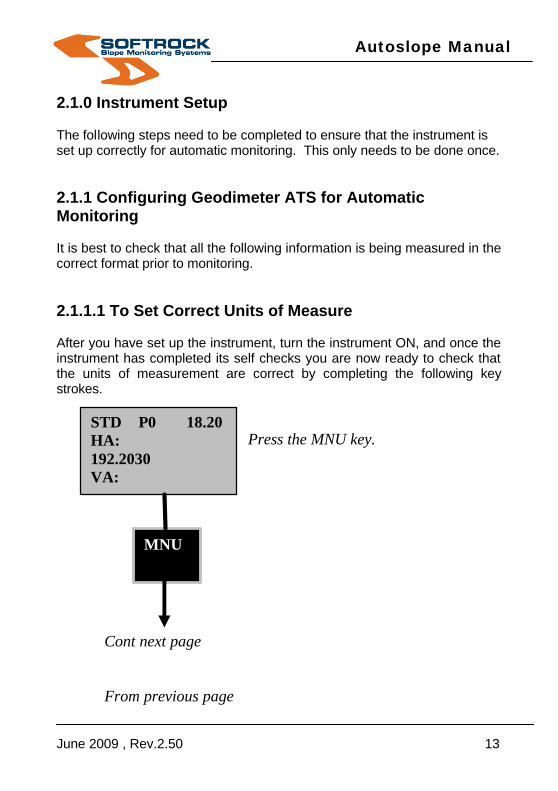
2.1.0 Instrument Setup The following steps need to be completed to ensure that the instrument is set up correctly for automatic monitoring. This only needs to be done once. 2.1.1 Configuring Geodimeter ATS for Automatic Monitoring It is best to check that all the following information is being measured in the correct format prior to monitoring. 2.1.1.1 To Set Correct Units of Measure After you have set up the instrument, turn the instrument ON, and once the instrument has completed its self checks you are now ready to check that the units of measurement are correct by completing the following key strokes.
Press the MNU key. Cont next page
From previous page
STD P0 18.20 HA: 192.2030 VA: 91.4723
MNU

Autoslope Manual
June 2009 , Rev.2.50 14
Enter the SET routine
Press 1.
Set has a number of options which you can get to by pressing ENT. But you can get to the option we want by just pressing 7.
Cont next page From previous page
Menu 18.20 1. Set 2. Editor 3. Coords
1
1
Set 18.21 1. PPM 2. Preset 3. Decimals
7
Autoslope Manual
June 2009 , Rev.2.50 15
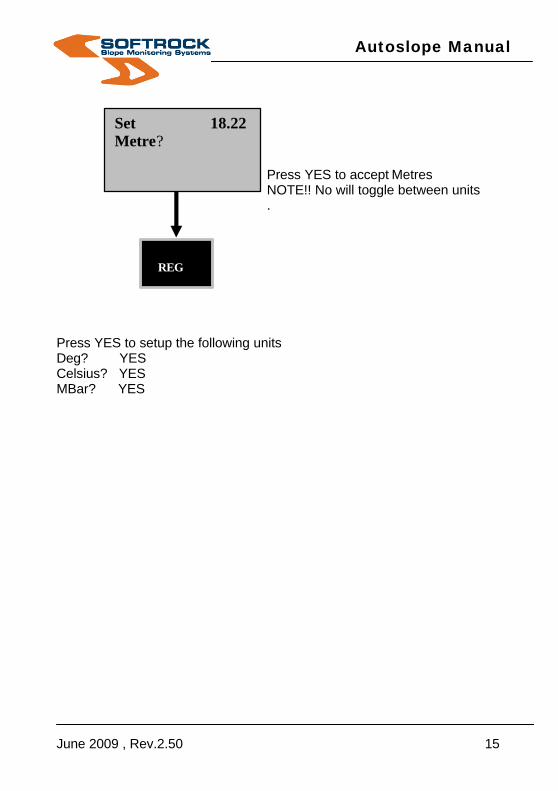
Press YES to accept Metres NOTE!! No will toggle between units .
Press YES to setup the following units Deg? YES Celsius? YES MBar? YES
Set 18.22 Metre?
REG

Autoslope Manual
June 2009 , Rev.2.50 16
2.1.1.2 To Set Prism Constant Also see Prism Constant in Module 2, AutoSlope Software Manual, 2.17.3 Prism Group Management. Depending on the geometry of the prism and its refractive index (a property of the sort of prism glass) the measured distance will be bigger than the true one. This difference is the prism constant. Read the manufacturers manual for their specifications on the instruments or prism requirements. Usually, we set zero prism constant in all instruments. AutoSlope will alert you if a non zero constant is set in the instrument. There are situations where a non zero constant has to be used. For example, if there is a change in instrument type from Leica to Geodimeter, then there will be a distance differential of 33mm . We can set + 0.033 or –0.033 in the instrument prism constant to blend in with historical data. This is unusual and it is best to stay in zero constant wherever possible. Be aware of the other aspect of prism constants to Ref Prisms (under Control Information Panel in Module 2, AutoSlope Software Manual, 2.17.3.2 New Group), by using this AutoSlope setting, we can apply a one off prism constant to the Ref prism only. Here the prism constant is only applied once and not to the remainder of the prisms in that group. This is an AutoSlope setting Not an instrument setting. The prism constant can be edited in the Instrument, see following key- strokes.
MNU
6
1
Autoslope Manual
June 2009 , Rev.2.50 17
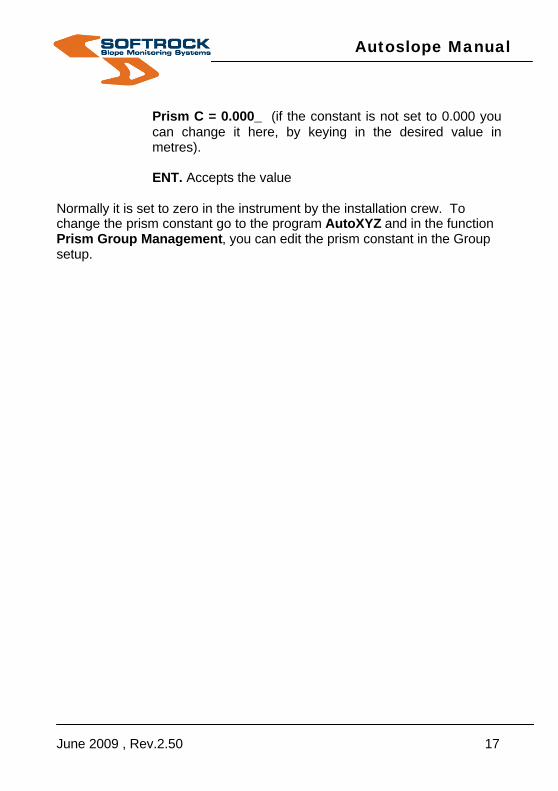
Prism C = 0.000_ (if the constant is not set to 0.000 you can change it here, by keying in the desired value in metres).
ENT. Accepts the value
Normally it is set to zero in the instrument by the installation crew. To change the prism constant go to the program AutoXYZ and in the function Prism Group Management, you can edit the prism constant in the Group setup.

Autoslope Manual
June 2009 , Rev.2.50 18
2.1.1.3 To Check Units Alternatively you can view and change the various units using the following key-strokes: Check Units By pressing F23 you can see the units you have chosen according to the following: xxx1=Grads (400), xxx2=Degrees (360, min,sec), xxx3=Decimal Degrees (360), xxx4=Mills (6400), xx1x=Metre, xx2x=Feet, x1xx=Celsius, x2xx=Fahrenheit, 1xxx=mbar, 2xxx=mmHg, 3xxx=inchHg. So for our purposes F23 should read ‘2113’ 2.1.1.4 To Check PPM Function key PPM= 0 2.1.1.5 To Check Prism Constant Function key Prism C= 0
F
3 0
F
3 3

Autoslope Manual
June 2009 , Rev.2.50 19
2.1.1.6 To Check Temperature
Function Temp= 0 (adjust the temperature to suit average local reading). If using a weather station, this data will be continually updated. 2.1.1.7 To Check Pressure Function Pressure= 940 (adjust the pressure to suit average local reading). If using a weather station, this data will be continually updated.
F
5 6
F
7 4

Autoslope Manual
June 2009 , Rev.2.50 20
2.1.1.8 To Set RPU Before you can run AutoSlope with the Geodimeter ATS-PM you have to set the instrument to accept commands remotely. These steps must be carried out when resetting or relocating the instrument. 1. Setup instrument, turn on and level A/M 2. RPU 3 Remote 3 None 3. Set Sector? No 4. Ref Target? No 5. RMT Full Circle? No 6. PrismC=0.000 Yes Enter Connect PC RS232 7. Turn the instrument off The instrument is now ready to receive instructions from the AutoSlope Software.

Autoslope Manual
June 2009 , Rev.2.50 21
2.1.2 Configuring Leica TCA1100 & 1800 for Automatic Monitoring The Leica total station needs to be reconfigured to allow it to communicate with the AutoSlope monitoring system. There are 5 quick and easy steps to work through to check that the instrument is configured correctly:
1. Set instrument in GSI mode 2. Check communication protocol 3. Set record mask to 8 bit. 4. Switch ATR on. 5. Check prism constant. 6. Check ppm settings when using weather station.
2.1.2.1 GSI Mode
? Turn instrument on. ? Goto main menu. ? Select F3 (CONF)
i. Select 6 “Autoexec.app1:equals Meas & Rec Meas ii. Use the List key to change.
? Press CONT white key ? Turn instrument Off ? Turn instrument on
i. There should be a GSI symbol appear in top right hand of the screen under the battery symbol.
2.1.2.2 Communication protocol
? Turn instrument on ? Goto main menu ? Select F3 (CONF) ? Select 3 “GSI Communication param”
? Check and change the following
Autoslope Manual
June 2009 , Rev.2.50 22
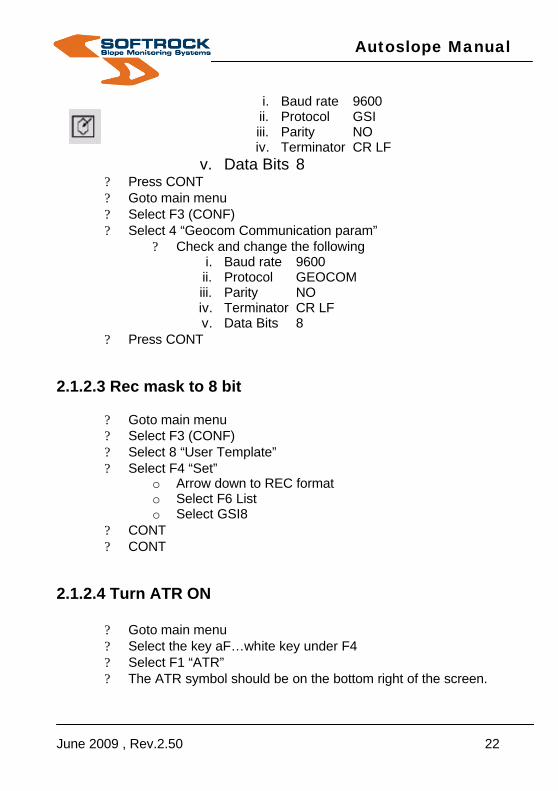
i. Baud rate 9600 ii. Protocol GSI iii. Parity NO iv. Terminator CR LF
v. Data Bits 8 ? Press CONT ? Goto main menu ? Select F3 (CONF) ? Select 4 “Geocom Communication param”
? Check and change the following i. Baud rate 9600 ii. Protocol GEOCOM iii. Parity NO iv. Terminator CR LF v. Data Bits 8
? Press CONT
2.1.2.3 Rec mask to 8 bit
? Goto main menu ? Select F3 (CONF) ? Select 8 “User Template” ? Select F4 “Set”
o Arrow down to REC format o Select F6 List o Select GSI8
? CONT ? CONT
2.1.2.4 Turn ATR ON
? Goto main menu ? Select the key aF…white key under F4 ? Select F1 “ATR” ? The ATR symbol should be on the bottom right of the screen.

Autoslope Manual
June 2009 , Rev.2.50 23
2.1.2.5 Set EDM measure mode to Standard
? Goto main menu ? Select the key “aF…” white key under F4 ? Select “2 EDM Measuring Program”
? Press F1 for Standard measurement mode.

Autoslope Manual
June 2009 , Rev.2.50 24
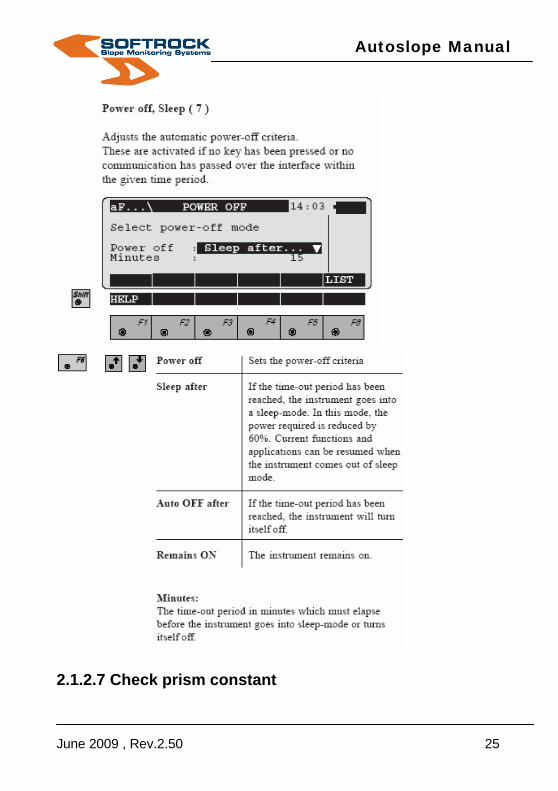
2.1.2.6 Set Sleep Time Regardless of Instrument type we now suggest the following setup for sleep time-
? • Goto “main menu“ ? • Select the key “aF…” white key under F4 ? • Select “7 Power Off, Sleep” ? • Select “Remains ON”
Autoslope Manual
June 2009 , Rev.2.50 25
2.1.2.7 Check prism constant

Autoslope Manual
June 2009 , Rev.2.50 26
? Goto main menu ? Select F6 “Measure” ? Select F4 “Target” ? Select F1 “Prism”
o Check to see that the “Leica circ.prism:0.0mm” is selected
? CONT
2.1.2.8 Check ppm settings
? From the measure mode window select F4 “Target” ? Select F2 “ppm” ? Set “ppm atmospheric” to zero. ? Set “ppm geometric” to zero. ? When the ppm is set, it changes the geometric ppm, so it is
important to zero the atmospheric ppm.

Autoslope Manual
June 2009 , Rev.2.50 27
2.1.2 Configuring Leica TPS1200 & TM30
Step 1 – 5 Config
Step 2 – 4 Interfaces
Step 3 – Edit Geocom Mode
Step 4 – Edit RS232 Geocom
Step 5 – Edit parameters & Store

Autoslope Manual
June 2009 , Rev.2.50 28
Part 2 AutoSlope Program 2.2.0 AutoSlope Security & Registration
? Passwords-levels ? User Password ? Administration password ? Reason for Passwords ? Licensing agreements ? Program Registration
Program Registration Upon installation, a License File will be installed by Softrock Solutions. This file is placed in the program file directory under AutoSlope. If further instruments are required later on, Softrock Solutions will provide a new license file and send it to you. You can have up to 8 instruments registered for one AutoSlope Installation. You are now a registered user, and a yearly maintenance fee will come into force after 12 months registration. See in the main AutoSlope menu, Help, About AutoSlope, the maintenance due date, computer id number and the number of registered instrument details are all listed. Licensing Agreements Please refer to your AutoSlope contract agreement for specific details. 2.2.1 Auto Start AutoSlope Program You may have a situation where the IT for your computer which is running AutoSlope is controlled remotely ie. Your operating system is periodically updated from head office, and the computer is rebooted, thereby stopping AutoSlope from running. To overcome this situation you can insert a small file in your “Startup” menu option of Windows to automatically restart AutoSlope.
? Right click on the Start button on your windows desktop, and select Explore All Users.
Autoslope Manual
June 2009 , Rev.2.50 29
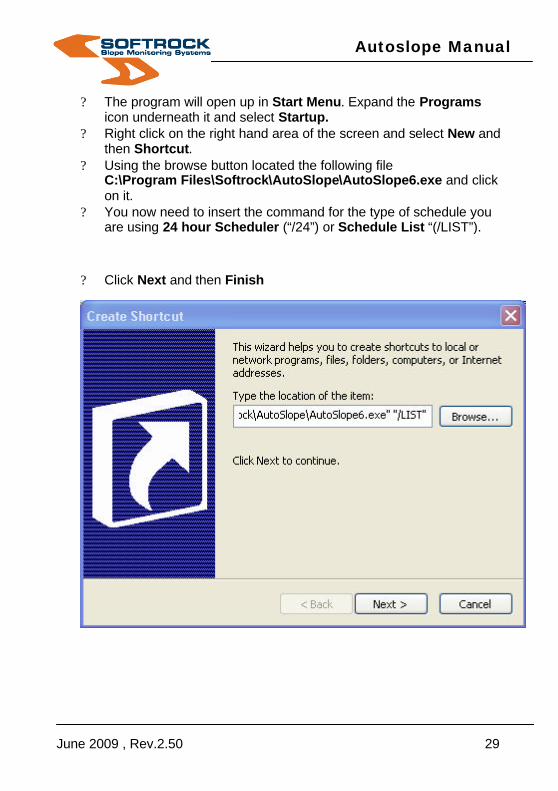
? The program will open up in Start Menu. Expand the Programs icon underneath it and select Startup.
? Right click on the right hand area of the screen and select New and then Shortcut.
? Using the browse button located the following file C:\Program Files\Softrock\AutoSlope\AutoSlope6.exe and click on it.
? You now need to insert the command for the type of schedule you are using 24 hour Scheduler (“/24”) or Schedule List “(/LIST”).
? Click Next and then Finish

Autoslope Manual
June 2009 , Rev.2.50 30
2.2.2 AutoSlope to Run at Startup For 24 Hour Scheduler If you are networked you are required to go through the log on process before you can start AutoSlope using the shortcut icon for the automatic startup in this mode.
? Select your short cut icon for the AutoSlope program, Right click to Properties
? The properties window will now be displayed
Autoslope Manual
June 2009 , Rev.2.50 31
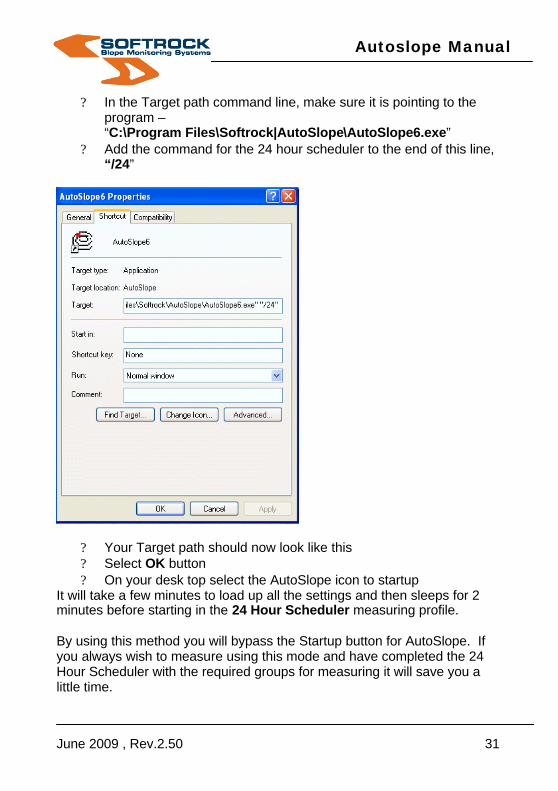
? In the Target path command line, make sure it is pointing to the program – “C:\Program Files\Softrock|AutoSlope\AutoSlope6.exe”
? Add the command for the 24 hour scheduler to the end of this line, “/24”
? Your Target path should now look like this ? Select OK button ? On your desk top select the AutoSlope icon to startup
It will take a few minutes to load up all the settings and then sleeps for 2 minutes before starting in the 24 Hour Scheduler measuring profile. By using this method you will bypass the Startup button for AutoSlope. If you always wish to measure using this mode and have completed the 24 Hour Scheduler with the required groups for measuring it will save you a little time.
Autoslope Manual
June 2009 , Rev.2.50 32
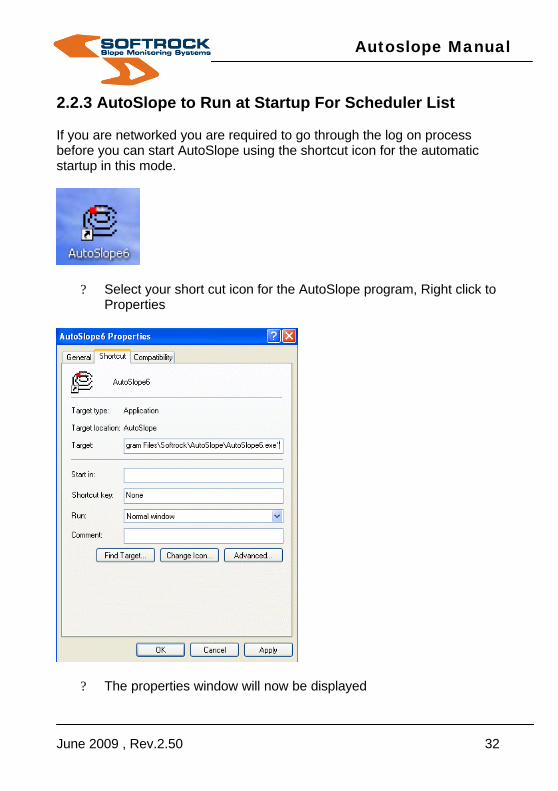
2.2.3 AutoSlope to Run at Startup For Scheduler List If you are networked you are required to go through the log on process before you can start AutoSlope using the shortcut icon for the automatic startup in this mode.
? Select your short cut icon for the AutoSlope program, Right click to Properties
? The properties window will now be displayed

Autoslope Manual
June 2009 , Rev.2.50 33
? In the Target path command line, make sure it is pointing to the program – “C:\Program Files\Softrock|AutoSlope\AutoSlope6.exe”
? Add the command for the 24 hour scheduler to the end of this line, “/List”
? Your Target path should now look like this ? Select OK button ? On your desk top select the AutoSlope icon to startup
It will take a few minutes to load up all the settings and then sleeps for 2 minutes before starting in the Scheduler List measuring profile. Make sure your Schedule list is up to date prior to making these changes. By using this method you will bypass the Startup button for AutoSlope.
Autoslope Manual
June 2009 , Rev.2.50 34
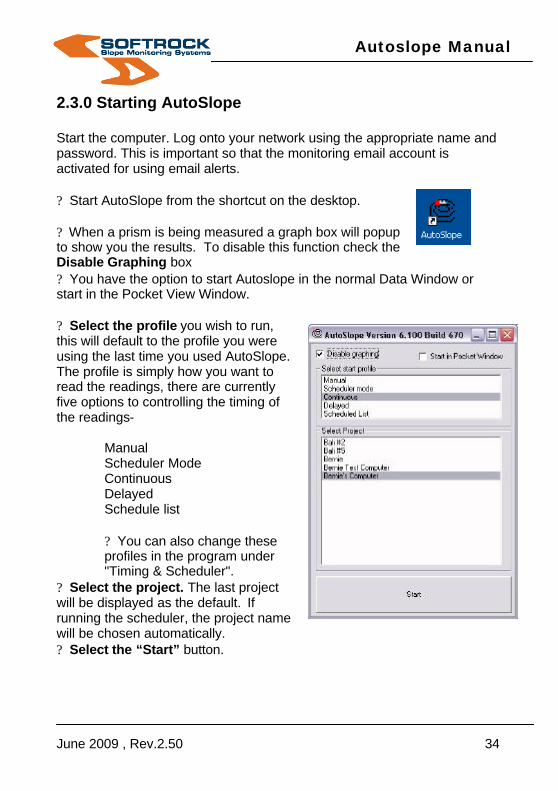
2.3.0 Starting AutoSlope Start the computer. Log onto your network using the appropriate name and password. This is important so that the monitoring email account is activated for using email alerts. ? Start AutoSlope from the shortcut on the desktop. ? When a prism is being measured a graph box will popup to show you the results. To disable this function check the Disable Graphing box ? You have the option to start Autoslope in the normal Data Window or start in the Pocket View Window. ? Select the profile you wish to run, this will default to the profile you were using the last time you used AutoSlope. The profile is simply how you want to read the readings, there are currently five options to controlling the timing of the readings-
Manual Scheduler Mode Continuous Delayed Schedule list ? You can also change these profiles in the program under "Timing & Scheduler".
? Select the project. The last project will be displayed as the default. If running the scheduler, the project name will be chosen automatically. ? Select the “Start” button.

Autoslope Manual
June 2009 , Rev.2.50 35
? If the profile is manual then select the prism group you want to measure from the Prism Group Name box and click on the "Measure" button. This will begin the measuring sequence. ? If the profile is either of the schedulers, then simply click the “Measure” button. Groups will not be enabled for selection in the list box. ? If the profile is continuous then you need to select a prism group from the Prism Group Name box and hit the “Measure” button also. ? If the profile is delayed then you need to select a group from the Prism Group Name and then the “Measure” button to activate it. ? As the data is sent and received, the left Com light will flash green and red. The right light is for the instrument status and this

Autoslope Manual
June 2009 , Rev.2.50 36
should be predominantly green. Flashes of red are OK. Full red with no green means that the instrument is not responding at all. ? Now go to the Graphics setup screen using the pull down menu. AutoSlope is usually left in the graphics screen to show observers what prism is being measured.

Autoslope Manual
June 2009 , Rev.2.50 37
2.3.1 Autoslope Main Window
The main Autoslope window contains all the information and data that is taking place whilst the system is conducting its monitoring. The main section to the screen are: 2.3.1.1 Data Window In this section of the screen will be displayed all the commands that are being sent and all the data that is being received from the instrument, and weather station (if one is fitted). You can use the scroll bar on the right hand side to scroll up through the data if required.

Autoslope Manual
June 2009 , Rev.2.50 38
2.3.1.2 Critical Errors & Notes If any errors are detected when the system is in operations then they will be listed here. These error can be of help when trying to diagnose any operational problems that may occur. You might also see from time to time notes which are to alert you to situations which may cause the sytem not to operate at its full potential. Eg. “Ref prism distance shorter than prism”, this note alerts you to the fact that your reference prism is closer to the instrument than the prism that you are monitoring. This is a bad practice and can result in a degradation of the results. 2.3.1.3 Prism group name Here is listed the groups that you have created in AutoXYZ. If you are going to be measuring in either Manual or Continuous modes then you need to select a group from this list before pressing the Measure button. 2.3.1.4 Instrument (or Radio) number This is where you select the instruments that you will be using to monitor. See section 2.5.0 for details. 2.3.1.5 Additional Buttons and Information There are a number of useful and informative additions to the Data screen which are described here. 2.3.1.5.1 Instrument Status
The two lights show you the status of your comms. The light on the left shows the connection between the computer and the base radio and should be green when the measuring cycle is taking place. The light on the right is the connection to the instrument and will change from red to green, but it should be predominantly green.
The large number in the middle of the two lights tell you which instrument is being used at the time, and the serial number underneath is the serial number of the instrument as read from the instrument.

Autoslope Manual
June 2009 , Rev.2.50 39
2.3.1.5.2 Test and information buttons
The first two boxes on the left tell you which instrument station and reference are being used at the time. Instrument OFF and Instrument ON buttons allow you to manually test if you have a connection to the instrument. The instrument light will turn green after a few seconds if you press the Instrument ON button. The same light will turn red after a few seconds once you press the Instrument OFF button. The Weather button allows you to take a one off manual reading of your weather station if you have one fitted. The results are displayed below. If you have a rain guage fitted you can zero the readings by pressing the Reset rain button.
2.3.1.5.3 Add New Prisms New prisms can be added using AutoXYZ (see 2.17.3) or by measuring with an Autoslope instrument.
Click on the “Add New Prisms” button from the main Autoslope data window. This button is not available when Autoslope is measuring a group. The “New Prisms Window” consists of the following tools:
? Prism listing. This is for information only to show what prisms are in the dbase.
Autoslope Manual
June 2009 , Rev.2.50 40
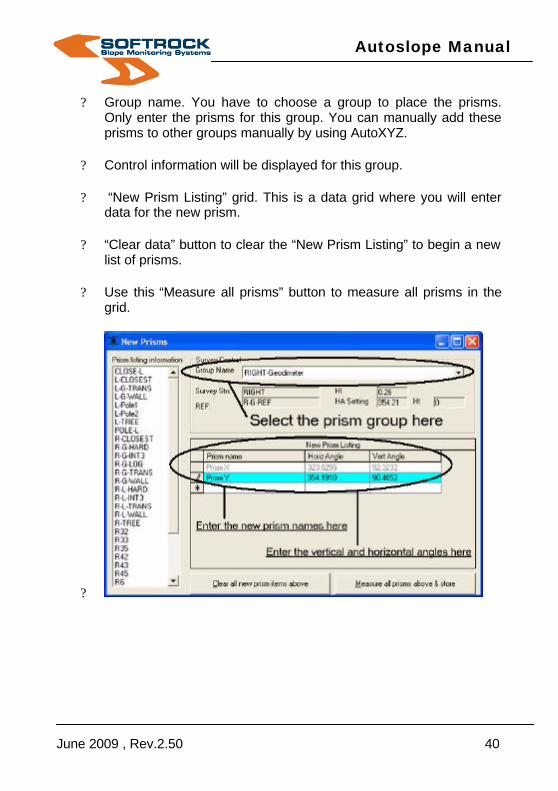
? Group name. You have to choose a group to place the prisms. Only enter the prisms for this group. You can manually add these prisms to other groups manually by using AutoXYZ.
? Control information will be displayed for this group.
? “New Prism Listing” grid. This is a data grid where you will enter data for the new prism.
? “Clear data” button to clear the “New Prism Listing” to begin a new list of prisms.
? Use this “Measure all prisms” button to measure all prisms in the grid.
?

Autoslope Manual
June 2009 , Rev.2.50 41
Operation
? In the field, take sightings to each new prism. We only need horizontal angle and vertical angle. We do not need distance. We do not need azimuth, just the standard horizontal angle used when the instrument is measuring.
? Choose the group to accept these prisms in the window above
? Enter the data in the “New Prism Listing”. Use the clear data button if you wish to clear existing data. To delete a line, simply highlight the line by clicking on the left and use the delete key on your keyboard.
? As the prisms are measured, they will be added to the prism database and the current group list. You can add these prisms to another group manually in AutoXYZ. The list above shows an addition of 5 new prism readings.

Autoslope Manual
June 2009 , Rev.2.50 42
? All data is scanned for errors at the start of measuring. If there is an error in the prism data, you will be prompted to fix before retrying to measure. Errors scanned are:
o Null fields for Prism, HA, and VA
o Blank fields for Prism, HA, and VA
2.3.1.5.4 Pocketview Window
Autoslope can now be presented on the screen in a more compact way – the pocket window. The main Autoslope window is still available for making changes. You can start Autoslope directly into the pocket window from the start window. You can access the pocket window from the Autoslope data window, pull-down “Data Window”, “Pocket View”. Note the main items ? Connection lights as per main
window ? Instrument number ? Group progress & countdown
progress bar. Same as main window. ? Group success progress bar expressed as %. This will show the
success rate at any time. So if a group has 10 prisms, and there has been 2 prisms read, and both are successful, a 100% success should be shown.
? A box showing prisms read in last 24 hours. This is refreshed after every prism read.

Autoslope Manual
June 2009 , Rev.2.50 43
? Button (marked Refresh) to manually update the prisms read box above.
? Weather details are shown. ? Button (marked Detail) for access to main Autoslope window. This
can be used while readings are underway. ? Button (marked Start) to start measuring. Note that the measure
method (schedule) will be shown as a tool-tip when you hover over the button with the mouse before clicking.
? Button (marked Stop) to stop measuring. ? Button (marked Exit) to exit Autoslope. ? Status window – bottom left hand. ? Centre window contains Group details with prisms and status ? Right hand window contains current prism graph. You can expand
the graph size by resizing the window.

Autoslope Manual
June 2009 , Rev.2.50 44
2.3.2 AutoSlope Menu
Once in AutoSlope Program the Menus are as displayed. The functions you can control from here are- Graphics setup ? Data Window ? Timing and Schedule ? Alarms ? History ? Reports ? Settings ? Graphing ? Utility ? Help ? Exit

Autoslope Manual
June 2009 , Rev.2.50 45
2.4.0 Graphics Setup The green and red status lights in the top left hand corner will flash the same as in the data window. Left hand light will flash green and red as radio comms progress. The right hand light displays instrument status. Predominantly green is a good status. Solid red means the instrument is not responding correctly.
As the measurements of the group progress, the current line being measured will be shown. The instrument station and number and current prism will be displayed. All the group prisms are displayed as white dots. If an alarm is sounded, a large red circle with yellow infill will be displayed. To get information on an alarmed prism, simply left click and hold down on the point. It will turn green and show a yellow window with alarm data shown. The yellow status line will display the last prism results. The bottom status

Autoslope Manual
June 2009 , Rev.2.50 46
bar shows the current status. Back in the Data Window, you can see the progress of the group with the blue progress bar above the "Measuring" button. As each prism is being measured a graph is displayed, in a separate window which can be moved and sized to suite. You can also display aerial photographs in this option. See diagram below.

Autoslope Manual
June 2009 , Rev.2.50 47
2.4.1 Setting up Graphics
The first time you use this option you will need to load a graphic of your pit, so that you can see which prisms are being read. A screen dump of the graphic display can also be sent with any email alarm alerts that are sent. Preparation may be needed to create an image from an aerial photo or computer generated DTM or string file. Be careful to size the image so that it nearly fills your screen size, and zoom in on the area of interest. Care should be taken in not over taxing AutoSlope by loading a huge file. Rule of thumb is to keep it around 1 meg in size, but this will depend on your computer hardware and graphics system. To set up your graphics you must first unlock the graphic. ? Click onto Graphics setup then “Unlock graphics setup”. You will be
asked for a password which will have been set in the password manager of Autotools. Click ok and the option will be unlocked.
? Next select Graphics Setup “Load a graphic map”, and browse to select
a file. This can be in Bmp, Gif or Jpeg format.

Autoslope Manual
June 2009 , Rev.2.50 48
2.4.2 Setup for XYZ Coordinate System In order to plot useful information we have to apply your local coordinate system to the image. You will need to know points on either side of the image that can be identified. No need to be over accurate here. Usually if we are within a couple of metres is good enough.
? Click on “Show Graphic Display” ? Then select “Graphics Setup“ “Setup for XYZ coord system”, and
click on the " Digitize point 1" option. Enter the Northing in the first box "OK".
? Enter the Easting in the second box "OK". ? A box with "Digitize Point 1" will appear click "OK",. The cursor will
change to a cross. Identify point 1 on the image and left click on it. ? Go through the same procedure for point 2. ? After digitizing the two points apply the coordinate system by using
the " Reset xyz coord system". ? Check the coordinates by moving the cursor around the image and
checking the coordinates in the window title caption at the top of the main window.
? Lastly save these settings to your current project name, by using “Graphics Setup” “Graphics Setup” “Save (pic and settings) to current Project”.
Once you have your graphics setup you can now decide what you want to be displayed. Using the same drop down menu, “Graphics Setup”, you can choose from the following.
? Draw current group – draws the location of each prism as a white(or black) dot, in the current group. You may have to return to the Data Window and select the group.
? Draw control – draws the location of all the control in the database.
? Prism name display colour – Choose the colour of prism name. ? Turn ON prism names – Allows you to turn prism names on or off.

Autoslope Manual
June 2009 , Rev.2.50 49
2.5.0 Data Window The data window has three options-
? Show Data Window ? Unlock instruments select ? Cycle repeat transmit
Show Data Window Will display the current group of prisms being monitored. This will also show you any errors associated with the monitoring process in the box Critical Errors and Notes. All the weather details are displayed if you are using a weather station. All your registered instruments are shown and the prism groups you have created. This is where you can stop your instrument from monitoring or commence again. It will also let you know if you have communication happening with the whole system. Unlock instrument select This option will show you what the licence file is set for, e.g. the number of registered instruments for your site. The instruments can be activated and de-activated by simply ticking or un-ticking the appropriate instrument box in the listing. This means that when operating with multiple instruments, and you need to take one off-line for some reason, you can de-activate it by un-ticking the box. The advantage here is that your current schedules do not have to be re-written.
? When the schedule is running, only groups from activated instruments will be measured.
? When initializing this software, ensure that your active instruments are ticked.

Autoslope Manual
June 2009 , Rev.2.50 50
? To activate and de-activate, simply use the pull-down menu “Data window” and “Unlock instrument select”. This will allow you only one selection process. You will need to use the pull-down menu for every selection.

Autoslope Manual
June 2009 , Rev.2.50 51
Show Group Listing This option will display the current group list being measured and its status. As the group is being read the prisms that have been observed will display a tick in the check box. The time it was measured and whether the observation was successful will be displayed. To activate this option simply select it from the data window menu. To deselect it choose the close button on the window below.
Cycle repeat transmit This option is for troubleshooting. It sends out a continuous transmit signal every 10-15 seconds for when you want to do work on the radio network. It is used by the installation crew. Do not use unless authorized by the Softrock Technicians.

Autoslope Manual
June 2009 , Rev.2.50 52
2.6.0 Timing & Schedule There are currently five options to control the timing of AutoSlope readings-
Manual 24 Hour Scheduler Continuous Delayed Schedule List
Manual This is where you select a group of prisms and manually click the measure button. Once this group is finished the instrument will switch itself off. 24 Hour Scheduler This is one way to measure different groups and use multiple instruments. Schedule List The schedule list use time and date to start the measuring sequence. It uses a list with the project name and group name. It will start measuring at the pointer and gradually work its way down the list until it is completed. It will then restart at the top of the list. Continuous Here you can continuously measure the same group, the ATS will shutdown for a period (you set this time period) and then restart the measuring process for the same group. Delayed Select the group of prisms to be measured. Timer control set to start date/time. Don’t forget to click on the main ATS button to begin measuring.
Date Format It is very important to understand how the software looks at dates. You must have it in the short date format. The short date format is Day Month Year shown at 1 Jan 2000 (dd-mmm-yy). This is to avoid confusion between the many formats that can be used. Refer to Section 2.0 Getting Started.

Autoslope Manual
June 2009 , Rev.2.50 53
2.6.1 Manual Mode
The Data Window will show you the profile of the measuring set up and process. Note the text on the Measure Manually button will change depending on what profile you logged into AutoSlope. The button will be greyed out once activated. All errors and notes will also be displayed in the Critical Errors and Notes window. All prism groups will be displayed under the Prism Group Name window. You must have the Instrument light (right circle) flashing predominantly green. Here you can turn the instrument on or off, start or stop the measuring process, connect to your radios and check weather details. To start the measuring process- ? Select the Prism group name

Autoslope Manual
June 2009 , Rev.2.50 54
? Select the Measure manually button ? The program will stop measuring when it has observed all the prisms in
a group ? To stop the measuring process simply select the STOP or ESC button 2.6.2 24 Hour Scheduler
? This is one of the options available for measuring differing groups and using multiple instruments at select times in a 24 hour period.
? To use this option, you are first required to enter the Project name,
by placing your cursor in the Project data grid box, use the drop down arrow and select your project. Next do the same in the Group Name box, and choose the group of prisms you wish to monitor. Fill in the Start time box, the format can be either 14:00 or 2pm.

Autoslope Manual
June 2009 , Rev.2.50 55
For basic editing techniques for this window see Data Grid Editing 2.21.0 Module 2
? To help in creating a schedule you can use the Scheduler calc
helper. Fill in the Times for individual Groups, this is in decimals e.g. 0.5 means 30 minutes. By inserting the time it takes to measure a specific round you are certain that it will be finished before commencing to the next group in your schedule list. Please allow sufficient time to complete each round, it approximately requires 2 minutes per prism reading.
? You can also add the Start Time for the first name in the schedule list, and then resort the remainder to the new times by using the Start time button (this can be in either 14:00 or 2pm format). Take note if a round isn’t finished before the next group is due to commence, the program will skip the next immediate group to the following one in the list. For example Office Wall group observations finish at 1.31 pm, falls into WindowNo2 group due to commence at 1:30 pm, the program will skip WindowNo2 and commence WindowNo1 at 3 pm. Do not forgot to select the Recalc Timing button once this window is filled in. This will resort

Autoslope Manual
June 2009 , Rev.2.50 56
the new monitoring times and display them in the 24 hour Daily Schedule List. See diagram below.
? Once the 24 hour Daily Schedule list is filled in, go to the Data Window and select the “Measure with Scheduler” button, this will commence the monitoring sequence. To end the monitoring simply select the “stop or Esc” button.
? Note it is optional to use the Scheduler calc helper, it will still
operate if this window is not filled in.
? Remember with this option it uses time within the 24 hour period to monitor the groups. Therefore you must have the lengths of monitoring periods correct otherwise groups may be skipped. If you cannot fit all the monitoring times within 24 hours you are best to use the Schedule List option.

Autoslope Manual
June 2009 , Rev.2.50 57
2.6.3 Continuous
? This mode is handy if you are required to measure a group of prisms in
a problem area. It will continuously measure the same group. ? The shutdown time is entered in minutes. This means the instrument
will stop measuring for this time period and then recommence when this time has lapsed.
? Once the shutdown period has been inserted, go to your Data Window
and select the Group of prisms you wish to monitor. Click the “Measure Continuous” button.
? To halt this measuring process, select the “STOP or ESC” button in the
Data Window.

Autoslope Manual
June 2009 , Rev.2.50 58
2.6.4 Delayed
? Delayed start will start measuring the selected group of prisms at the
date and time specified by the user. ? It will measure the group only once. This option is rarely used. ? To activate this mode, go to the Data Window and Select the “Measure
Delayed Start” button.
Autoslope Manual
June 2009 , Rev.2.50 59
2.6.5 Schedule List
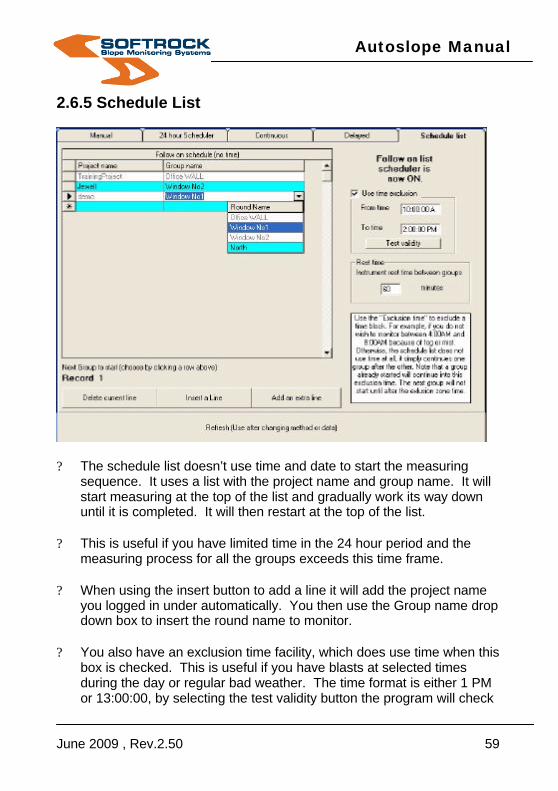
? The schedule list doesn’t use time and date to start the measuring
sequence. It uses a list with the project name and group name. It will start measuring at the top of the list and gradually work its way down until it is completed. It will then restart at the top of the list.
? This is useful if you have limited time in the 24 hour period and the
measuring process for all the groups exceeds this time frame. ? When using the insert button to add a line it will add the project name
you logged in under automatically. You then use the Group name drop down box to insert the round name to monitor.
? You also have an exclusion time facility, which does use time when this
box is checked. This is useful if you have blasts at selected times during the day or regular bad weather. The time format is either 1 PM or 13:00:00, by selecting the test validity button the program will check

Autoslope Manual
June 2009 , Rev.2.50 60
the times inserted. Note if the measuring of a group falls into the exclusion time, then AutoSlope will continue observing until the whole group is completed. It will then shut down for this period.
? You also have the option of inserting a rest time between
measurements of groups. This means the instrument will not monitor for this period, once this time has elapsed, the instrument will commence observing the next group.

Autoslope Manual
June 2009 , Rev.2.50 61
2.7.0 Alarms There are two options under this menu-. Alarm Control-this allows you to set various forms of alarms. Alarm thresholds-this allows you to enter a threshold so alarms can be triggered when the prism movement is greater than what is set.
2.7.1 Alarm Controls
This section controls which alarm sounds and when. It also informs who is to be notified and a report sent. It is protected by a password for illegal

Autoslope Manual
June 2009 , Rev.2.50 62
entry. This password is set in AutoTools using the password manager. These alarms, when activated, will be triggered when the total 3D movement value, or the velocity value exceeds the threshold value. Master alarm switch will deactivate all alarms if not ticked. If activated (ticked), then each individual alarm has to be activated or deactivated to suit your site requirements. You may have any number of alarms activated. Some alarms require additional correct hardware and software.
Note the difference between activated (tick) and edit (highlighted). If an Alarm Profile is ticked that means this function is operational. If it is highlighted then that means you can edit this profile.
The first 4 alarm profiles are unchangeable; Email alerts, SMS alerts, Third party alerts and Asor. Email alerts is the default alarm profile the user receives with the purchase of AutoSlope. SMS alerts, Third party alerts and Asor are all extras that require to be purchased. The remainder are changeable by creating Alarm Profiles. These are created in Autotools under the Communication Settings button, see Module 2 Alarm Configuration 2.15.2.3 Email Alerts Activate email Alerts. This will allow for Alerts and reports to be sent to the active recipient list (it is necessary to have Outlook or AutoSlope Mail

Autoslope Manual
June 2009 , Rev.2.50 63
working on the control computer). AutoSlope Mail is an internal email system which operates in one direction, it sends out emails only. This replaces Outlook. Emails and reports will only be sent to recipients that are ticked in the "alerts" column. Once this alerts column is checked, you then have the options of having a completion report (report box) or text message to your Mobile (Brief SMS box) being sent. This is to show that the system is indeed up and running. The completion report will detail number of prisms read, percentage read, etc. Ticking the "Report box" is mainly for survey reports of prism values and such. It is also for the recipients of automatic control adjustment reports.
To add or edit the email recipient list, highlight Email alerts, then position your cursor in the Email recipient list window. Make your changes and check the boxes required for that name. If the alert box is not checked then that person will not be alerted when an alarm threshold is exceeded. For detailed editing techniques see Module 2 Data Grid Editing 2.21.0.

Autoslope Manual
June 2009 , Rev.2.50 64
In the middle of the screen there are two boxes. The first one is very important as it allows emails with log files attached to be sent to Softrock Solutions. If you have a problem with your system, this allows us to view the raw data as it comes in, and helps us determine where any problems are.
The other box is to Allow graphic attachments with all alerts, which will create a screen dump named Alarm.Gif, showing the location where the alarm occurred and attach it to the emails of all email recipients. This file has been decreased in size, allowing for easier handling by the email system.
Autoslope Manual
June 2009 , Rev.2.50 65
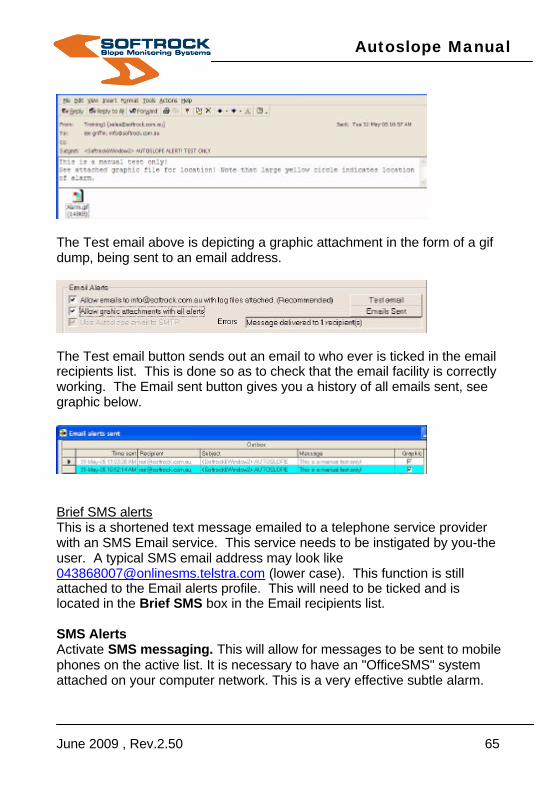
The Test email above is depicting a graphic attachment in the form of a gif dump, being sent to an email address.
The Test email button sends out an email to who ever is ticked in the email recipients list. This is done so as to check that the email facility is correctly working. The Email sent button gives you a history of all emails sent, see graphic below.
Brief SMS alerts This is a shortened text message emailed to a telephone service provider with an SMS Email service. This service needs to be instigated by you-the user. A typical SMS email address may look like [email protected] (lower case). This function is still attached to the Email alerts profile. This will need to be ticked and is located in the Brief SMS box in the Email recipients list. SMS Alerts Activate SMS messaging. This will allow for messages to be sent to mobile phones on the active list. It is necessary to have an "OfficeSMS" system attached on your computer network. This is a very effective subtle alarm.

Autoslope Manual
June 2009 , Rev.2.50 66
To activate the SMS alerts window highlight the Alarm profile then move the cursor to the SMS alert recipient list.
Remember to check the Alert active box when you have finished your editing. To delete a line simply highlight the line and select delete on your keyboard. Note: also see Brief SMS under Emailing Options in this section.
Autoslope Manual
June 2009 , Rev.2.50 67
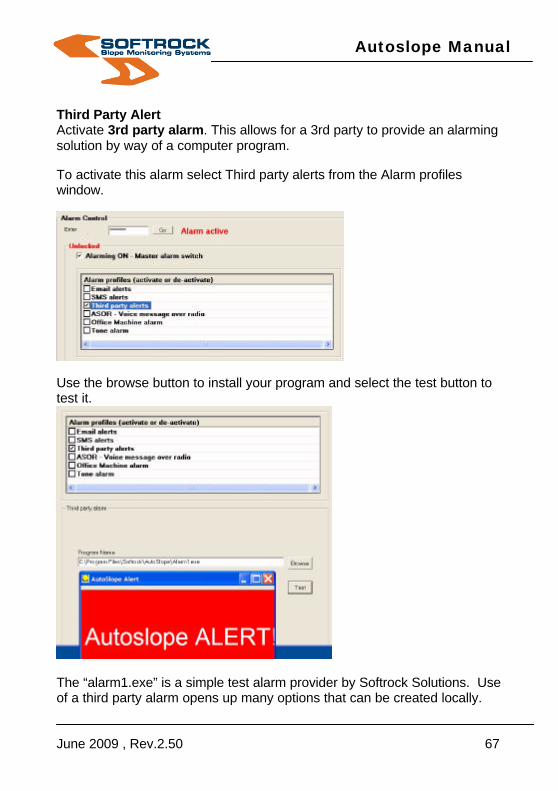
Third Party Alert Activate 3rd party alarm. This allows for a 3rd party to provide an alarming solution by way of a computer program. To activate this alarm select Third party alerts from the Alarm profiles window.
Use the browse button to install your program and select the test button to test it.
The “alarm1.exe” is a simple test alarm provider by Softrock Solutions. Use of a third party alarm opens up many options that can be created locally.

Autoslope Manual
June 2009 , Rev.2.50 68
Asor Voice message over radio. The program requires a computer with a sound card to operate.
ASOR is a program for sending computer generated speech over radio. ASOR checks the hard drive for a message file. When ASOR finds such a file it monitors the radio interface waiting until the frequency to which the radio is set is not busy. The text file is then "read" out over the radio. Finally, the message file is copied to a log, and then deleted. Physical Alarms There are a number of physical alarm types available with this system, green strobe, red strobe, office alarm green, office alarm red, siren and tone alarm. These extra Alarm profiles can be created using Autotools, the naming of them is left up to the user. Activate Softrock Light Alarm, Office or Pit (red or green). This again will send a signal to a Softrock strobe light alarm system, which will be activated when the alarm is sounded. There is also a facility to activate the alarm for a short period at the beginning of each group. This helps mine personnel know that the system is still working. This visual alarm can be located anywhere on the mine and any naming convention

Autoslope Manual
June 2009 , Rev.2.50 69
used. Activate Inside Office Alarm, Despatch hut or office (red or green) This system can be connected directly to a com port on the control computer. It will activate a small red flashing light and audible alarm. The audible alarm can be de-activated manually.
Tone Alarm Activate Softrock Tone Alarm. This will allow for a signal to be sent to your site voice communications. A tone will be activated over the comms. It will be very quiet while voice communications is under way, but will ramp up in volume when there is little traffic. It can be deactivated manually and by software. The tone alarm can be triggered from any one or all of the registered instruments.

Autoslope Manual
June 2009 , Rev.2.50 70
Siren This uses the same relays as the light alarms and sounds an audible alarm which can be de-activated manually.

Autoslope Manual
June 2009 , Rev.2.50 71
2.7.2 Alarm Thresholds The Alarm threshold is the minimum value of the parameter used to activate our monitoring system. Threshold values can be set globally, or individual values used. We have used 3 trigger types – accumulated 3D movement, SD velocity (based on slope distance) and 2D velocity (based on join distance between calculated XY position). At least one of these options must be ticked for AutoSlope to run. To edit these features you must first enter the password that was setup in the Password Manager of AutoTools. To set them individually simply highlight the necessary box and change the value as required. Note all the values can be markedly different, depending on the length of time each prism has been monitored.
? 3D movement calculation is based on the overall movement of the prism from its original or benchmark value. It calculates a 3D vector

Autoslope Manual
June 2009 , Rev.2.50 72
taking prism elevation into consideration. When using this method, you must be aware to update the threshold value as the prism moves.
Remember a moving prism (even slow moving) will sound the alarm alarm eventually.
? SD Velocity calculation is based on the adjusted measured distance difference from the previous reading extrapolated out to a 24 hour day. In other words, mm per day. If at 10:00 AM the distance was 678.908 and at 11:00 AM the distance was 678.910, then the velocity is calculated at (2mm per 2 hours OR expressed as a velocity of 24mm/day. This value could be misleading. To minimise extrapolations from readings of only a few hours apart, AutoSlope will hunt for the last reading taken at least 24 hours ago. Otherwise velocities can be exaggerated when taken over short time spans. This must be understood for fast moving prisms. SD velocity makes sense when the distance measured from the instrument station is in the expected direction of the prism movement. In other words, be sure that if you depend on this method that your prism is measured from the opposite side of the pit. If not, then the 2D velocity may be a better option.
This is the most accurate but only accounts for one direction of movement. Velocity is calculated using the adjusted distance value, compared with the previous value, and using the time between readings to extract the value in mm/day.
? 2D Velocity calculation is based on the calculated XY position
difference from the previous XY position extrapolated out to a 24 hour day. In other words, mm per day. If at 10:00AM and 12 NOON the XY join distance was 3mm then the velocity is calculated at (3mm x 24hours / 2hours) = 36mm/day. Again, this value can be misleading, so AutoSlope will hunt for the last reading taken at least 24 hours ago. Otherwise velocities can be exaggerated when taken over short time spans. Note that this velocity may not be as accurate as the SD velocity because it depends on a calculated

Autoslope Manual
June 2009 , Rev.2.50 73
distance between calculated XY positions in time. The SD velocity is based on distance which is the most accurate field measurement. The 2D velocity is a calculation on a calculation. Use 2D velocity when the direction of measurement is not directly across the pit but from an obtuse angle.
A good rule of thumb is to put in a low SD velocity (e.g. 5) and a higher 2D velocity (e.g. 35). This should then pick up the accurate changes of distance but also get the other movement directions from the rougher 2D velocity. Unless there is a need, it is recommended that you do not use 3D movement.
2.7.2.1 Threshold Settings There are 3 ways of setting trigger (or threshold) values. We can use all the methods, or any number of the three, with a minimum of one chosen. . You must tick the appropriate thresholds to use. It may depend on the direction the measurements are taken. If you use the 3D accumulative movement, then (for a regularly moving prism) there will always be a time when the threshold value will be breached. You can choose to use one or all of these methods of reaching an alarm situation.
? 3D accumulative movement. This method of alarming is based on sounding an alarm when the prism has exceeded its total movement based on the 3D accumulative trigger value. The 3D accumulative movement is the 3D join distance from the benchmark XYZ value in the QuikSlope database. Care should be used when using this method to trigger alarms. The 3D movement value will be a little more coarse then the other methods. 3D movement is calculated from horizontal angle, vertical angle, and slope distance. The XYZ position accuracy will depend on instrument accuracy, and the condition of the instrument, and the correct use of atmospheric data. Remember that this method will always require maintenance. The trigger value will always need updating. Alarms WILL go off more regularly.
Reset 3D. This button is used to set a global value (whatever is entered into the text box in millimetres) to each prism 3D trigger value. This is probably not very

Autoslope Manual
June 2009 , Rev.2.50 74
practical. Obviously, this method has to be ticked before this calculation can take place. Reset 3D+. Now this button is more practical. It will check the current 3D value in the QuikSlope database, and add the value in the text box. Obviously, this method has to be ticked before this calculation can take place.
? SD Velocity. This method of alarming is based on sounding an
alarm when the prism has exceeded its relative movement based on different adjusted slope distances taken over 24 hours. This is the most accurate of the alarm triggers, BUT, it must be understood that measurements should be taken across the pit, perpendicular to the pit wall. SD Velocity calculations can at first be based on measurements within 24 hours, and so can be a little inaccurate. Keep the SD velocity triggers high (10mm per day?) for the first few days of measurements. Then you can bring them down.
Reset SD velocity button to globally reset all values to the value in your text box.
? 2D Velocity. This method is based on comparing the calculated
join distances between XY coordinate values. Elevations changes are not considered here. This trigger is particularly handy when monitoring prisms at an oblique angle (or from the same wall as the instrument).
Reset 2D velocity button to globally reset all values to the value in your text box.
? Note that all trigger threshold values can be individually edited as well
as globally.
Autoslope Manual
June 2009 , Rev.2.50 75
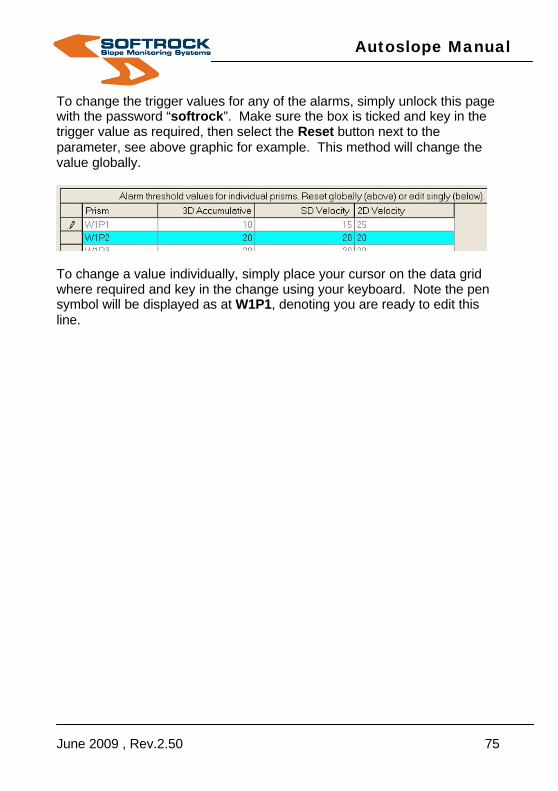
To change the trigger values for any of the alarms, simply unlock this page with the password “softrock”. Make sure the box is ticked and key in the trigger value as required, then select the Reset button next to the parameter, see above graphic for example. This method will change the value globally.
To change a value individually, simply place your cursor on the data grid where required and key in the change using your keyboard. Note the pen symbol will be displayed as at W1P1, denoting you are ready to edit this line.

Autoslope Manual
June 2009 , Rev.2.50 76
2.8.0 History
By scrolling around this data, you can check on the history of each completed group. Information like date, start and end times, % of prisms read and "prisms not read" all here. %Prisms – This column lists the percentage of prisms in that group that have been read #Prisms – The number of prisms in this group that have been read Total# –In this column is displayed the total number of prisms in that group Prisms not read – The program will list all the prism names in that group that have not been read

Autoslope Manual
June 2009 , Rev.2.50 77
2.9.0 Reports
Reports are created in a html file and shown in your browser. They can be sent out to email report recipients by clicking the box. Filtering by date can also be done. This is particularly important when creating “Quality of Measurement” reports. These can be extremely large if not filtered. The Message delivered box alerts you to who ever has received the reports created. The number of recipient/s is dependant on the number of people you have ticked on the Alarms Recipients list, which is activated under the Alarms option. If you want to create many reports for your own purposes, then it would be wise to un-tick the email box.
Autoslope Manual
June 2009 , Rev.2.50 78
2.9.1 Delinquent Prisms Management Report
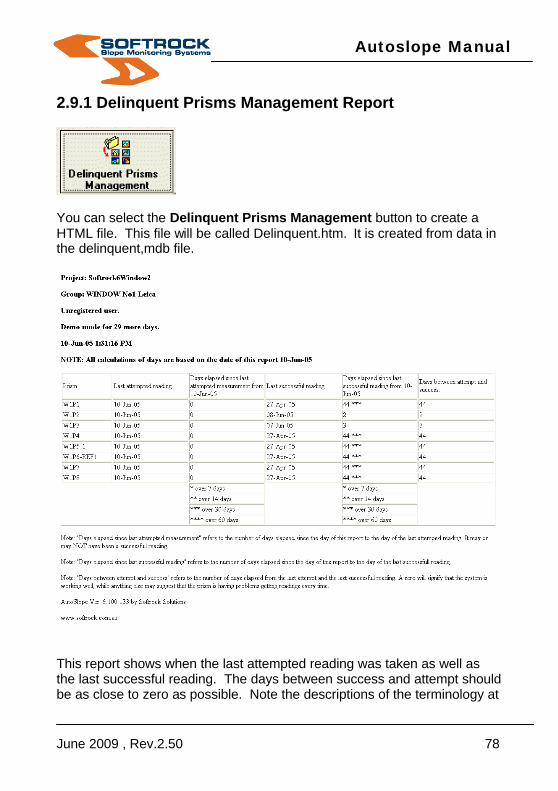
You can select the Delinquent Prisms Management button to create a HTML file. This file will be called Delinquent.htm. It is created from data in the delinquent,mdb file.
This report shows when the last attempted reading was taken as well as the last successful reading. The days between success and attempt should be as close to zero as possible. Note the descriptions of the terminology at

Autoslope Manual
June 2009 , Rev.2.50 79
the bottom of the report. All the prisms within this group will have this information listed in this file. These reports are emailed (as an HTML attachment file) to all on the active report list. The attempt date and success date are very important. This is a simple management tool to bring to the users attention prisms which have not had successful readings taken. If the days between attempt and success date continue to increase then you are made aware of a problem with the monitoring for that prism. Note: the notation at the bottom of the header “ Note:all calculations of days are based on the date of this report 10 Jun 05”. This is very important, the date here will change depending on the date that the user generates this report. All the calculations are based on the date shown in this header.
For example for Prism W1P1

Autoslope Manual
June 2009 , Rev.2.50 80
The calculation for the above would be- Date the report is generated as shown on header minus Last attempted reading 10 jun 05
10 Jun 05 – 10 Jun 05=0(0 days)
The calculation for the above would be- Last successful reading minus date the report is generated
27 Apr 05 – 10 Jun 05=44
The calculation for the above would be- Last attempted reading minus Last successful reading 10 Jun 05 – 27 Apr 05=44
As a further example if the date of the Last attempted reading was 9 Jun 05 then the calculation would be- 9 Jun 05 – 27 Apr 05=43 (43 days)

Autoslope Manual
June 2009 , Rev.2.50 81
2.9.2 Homeless Prism Report
The Homeless Prism Report button is a management tool to isolate any floating prisms that do not belong in any groups created within AutoSlope. Basically the Homeless Prism has been created in the AutoXYZ program but has not been placed within any groups.
Homeless Prisms = do not belong in any AutoSlope groups

Autoslope Manual
June 2009 , Rev.2.50 82
2.9.3 Group Prism Coordinate Report
By selecting the Group Prism Co-ordinate button you will create a report, showing the group information you selected in the data window. It will display the control data as well as all the prisms that you are monitoring within that group. The file is automatically displayed on your screen and is called group.htm.
This report contains Control information that may be useful like Instrument height, Ref Prism height, Ref Prism constant. Also all the prisms for monitoring in this group are displayed. This report lists the current coordinates of each prism. This is from the AutoSlope database Groupsxyz.mdb and may differ slightly to the coordinates in the QuikSlope database. These coordinates are updated on each measurement, thus any prisms that are moving rapidly, should be easily found.

Autoslope Manual
June 2009 , Rev.2.50 83
2.9.4 Survey Control Co-ordinate Report
This report lists the current coordinates of each Control station and Reference Prism in the AutoSlope database Groupsxyz.mdb and may differ slightly to the co-ordinates in the QuikSlope database.
These are the control co-ordinates used to calculate the XYZ movements for the reference line. AutoSlope then uses this XYZ movement to calculate the reference line adjustment.
Autoslope Manual
June 2009 , Rev.2.50 84
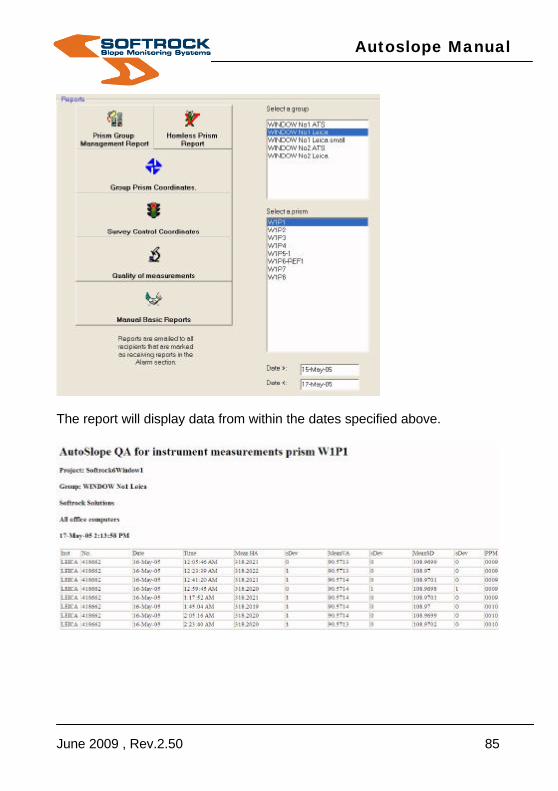
2.9.5 Quality Of Measurements
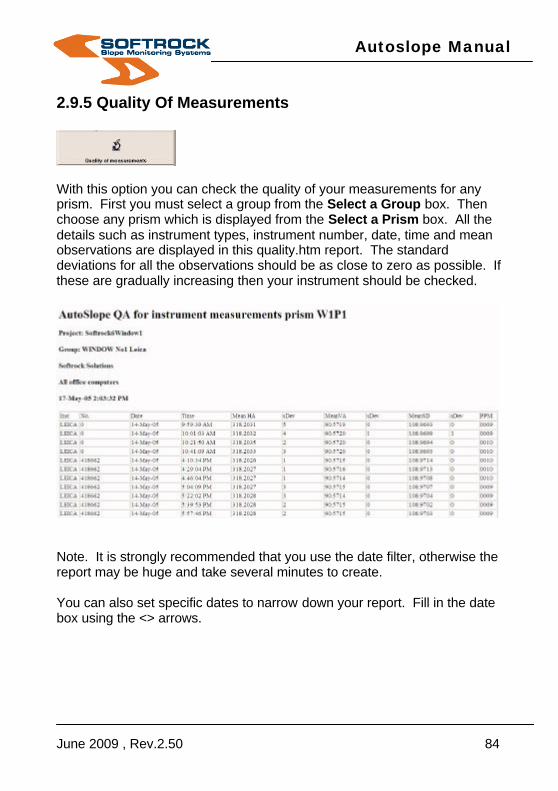
With this option you can check the quality of your measurements for any prism. First you must select a group from the Select a Group box. Then choose any prism which is displayed from the Select a Prism box. All the details such as instrument types, instrument number, date, time and mean observations are displayed in this quality.htm report. The standard deviations for all the observations should be as close to zero as possible. If these are gradually increasing then your instrument should be checked.
Note. It is strongly recommended that you use the date filter, otherwise the report may be huge and take several minutes to create. You can also set specific dates to narrow down your report. Fill in the date box using the <> arrows.
Autoslope Manual
June 2009 , Rev.2.50 85
The report will display data from within the dates specified above.

Autoslope Manual
June 2009 , Rev.2.50 86
2.9.6 Manual Basic Reports
The Manual Basic report button allows you to manually print control reports, prism reports and group reports. These reports are created in a data grid and can be printed. They are an addition to the email reports. Control Report.
Prism Reports.
Group Report.

Autoslope Manual
June 2009 , Rev.2.50 87
2.9.7 Automatic Reports
There are many other email reports that are created- ? Completion Report. ? Alert Report. ? Control Adjustment Alert.

Autoslope Manual
June 2009 , Rev.2.50 88
Completion Report.
This report is automatically sent to the active report list at the completion of each measured group. It keeps people informed about statistics and prisms not read. Alert Report.
This report is automatically sent to the active report list when an alert is sounded, and the email alerts have been enabled. See Alarm Controls 2.7.1, Email Alerts. Note that this alert can also have a graphic attachment showing the location of the Prism Alarm (if this option is activated). Control Adjustment Alert.

Autoslope Manual
June 2009 , Rev.2.50 89
This report is automatically transmitted when both the control adjustment option is enabled, and the movement parameters have been exceeded. There are four (4) methods of control adjustment. Please see AutoTools, Switches 2.16.2.2, Automatic Control Adjustment.

Autoslope Manual
June 2009 , Rev.2.50 90
2.10.0 Settings All program settings are shown here. Important ones are the pathways for data storage, including proxy databases. Also the last Temperature and pressure readings are shown if you are using a weather station.
NOTE!! You cannot change any of the settings from here. You must use the AutoTools program to change any settings.
This is where you can check where all your data is going.

Autoslope Manual
June 2009 , Rev.2.50 91
Locate the correct QuikSlope database. Locate where all your Log files are, they are in the :Data file directory". You may be asked to send the Groupsxyz.mdb database to Softrock for analysis. It will be found in "Pathways and Files" “QuikSlope Database”.

Autoslope Manual
June 2009 , Rev.2.50 92
2.11.0 Graphing This comes up automatically unless you have disabled it in the startup window. It shows all data from the start date. It is intended as an indication only. If you wish to look at graphs in detail then use QuikSlope. Note!! Graphing is automatic when using the Pocket View Window. See section 2.3.1.5.4 Note!! The graphing window can be moved and sized to suite your viewing requirements, so that it complements the graphic image and doesn't get in the way. The graphing window can be disabled from the pull down menu. The graph has three different displays.
? 3D Movement

Autoslope Manual
June 2009 , Rev.2.50 93
Distance Graph
? xyz Graph

Autoslope Manual
June 2009 , Rev.2.50 94
2.12.0 Utility In the main menu under Utility you have the Establish new Instrument and Reference position, WHICH ARE UNAVAILABLE AT THIS TIME. 2.12.1 Update Proxy to Dbase NOTE!! Do not use this option whilst Autoslope is running. This option will copy your proxy database (the one on your local computer) over your main database (the one on your network computer). This will ensure that both databases are the same. Note!! It is always good practice to backup your databases before you use this option. NOTE!! Make sure that you have selected a group before manually operating the Proxy update. The proxy will update by instrument number. So select a group that uses inst #1, do the proxy. Then select Inst #2, do the proxy. Etc.

Autoslope Manual
June 2009 , Rev.2.50 95
2.13.0 Help and Exit
2.13.1 View pdf Help Before you choose this option make sure you have the Adobe Reader program on your computer.
If the above error message is displayed then you do not have the program to view the help file. You will need to install Adobe Reader. The AutoSlope help file is simply a electronic version of the hard copy which you will have purchased with the software.
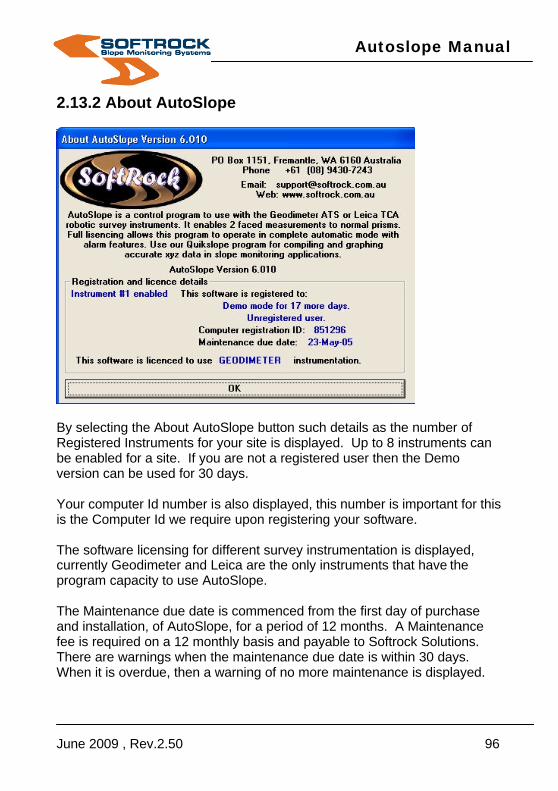
Autoslope Manual
June 2009 , Rev.2.50 96
2.13.2 About AutoSlope
By selecting the About AutoSlope button such details as the number of Registered Instruments for your site is displayed. Up to 8 instruments can be enabled for a site. If you are not a registered user then the Demo version can be used for 30 days. Your computer Id number is also displayed, this number is important for this is the Computer Id we require upon registering your software. The software licensing for different survey instrumentation is displayed, currently Geodimeter and Leica are the only instruments that have the program capacity to use AutoSlope. The Maintenance due date is commenced from the first day of purchase and installation, of AutoSlope, for a period of 12 months. A Maintenance fee is required on a 12 monthly basis and payable to Softrock Solutions. There are warnings when the maintenance due date is within 30 days. When it is overdue, then a warning of no more maintenance is displayed.

Autoslope Manual
June 2009 , Rev.2.50 97
This warning (bottom line) is will be displayed under the Settings in the main menu. License type can be Demo or Full. 2.13.3 Exit
Under the Exit menu you can minimize and maximize the AutoSlope window. This means you can have AutoSlope running in the background while you work on another program. Note that if you have the graphing enabled, the current prism graph will still flash on your screen even if you have the AutoSlope window minimized. Remember to disable it, if you wish to work on another program. If you have chosen the Maximize AutoSlope window button, you can use the Normalize AutoSlope window button to revert back to a three quarter viewing screen. If you select the Exit button, you will be prompted with “ do you wish to to exit AutoSlope and stop monitoring?”. You have a choice of choosing yes or no.

Autoslope Manual
June 2009 , Rev.2.50 98
2.14.0 Data Communication: Explanation of Data Currently we have Geodimeter and Leica instruments to collect the information required by AutoSlope for slope monitoring. Both these instruments use different formats to collect this data. See the following sections on the data formats for these instruments. 2.14.1 Data Window Geodimeter The software will send commands to the Geodimeter and will receive information back. Most data sent by the Geodimeter is a numbered code eg. 7=HA Face 1, where HA Face 1 is the measured value eg. 39.21141. The ">" character is an important return character from the Geodimeter. This character should appear at the end of each transmission. If it is not appearing, or appearing only spasmodically, then there could be a problem with lost data in the radio system. It could point to an upgrade of the antennas or at least an antenna check. As long as you have a predominantly GREEN instrument light (right hand side) then things are OK.

Autoslope Manual
June 2009 , Rev.2.50 99
2.14.2 Data Window Leica The software will send commands to the Leica and will receive information back. Most data sent by the Leica is either a "?" character, or survey data like "31..00+00126542" or like "0170/0000". As long as you have a predominantly GREEN instrument light (right hand side) then things are OK. 2.14.3 Reading Sequence When first starting the measurement of a group, AutoSlope will attempt to talk with the instrument. If it is asleep, it will re-start the instrument, and this process may take a few goes. The software will interrogate the instrument to check that the settings (like angle units and distance units) are Deg.mmss and metres. You can change the atmospheric settings on the instrument itself. This is generally not required. But it is a good idea to check the ppm setting from time to time as it passes through the data window at the beginning of the group measurement. This is to ensure that the instrument has not been tampered with somebody entering incorrect temperatures and pressures. The Ref Prism measurement will take care of that anyway.

Autoslope Manual
June 2009 , Rev.2.50 100
If you are using a weather station, then the ppm will be written into the instrument. Beware of errors that indicate the weather station is not working properly. Check the latest reading in the settings window. Check the date and time of the last reading. AutoSlope will take 2 sets of measurements (Face 1 and Face 2) to the reference prism. If the REF prism is not able to be read (bad weather or no prism) then the group is unable to begin measuring and will retry for six times before shutting down. Each prism in the current group will be read. The sequence of commands is:
1. Write the vertical angle and horizontal angle to the instrument. 2. Point to the prism. 3. Do a double-faced measurement to the prism. This may take 90-
120 seconds or so. 4. The xyz coordinates and movement will be calculated and
displayed in the data window. 5. Databases will be updated before moving to the next prism. It takes
about 2 minutes to cycle around. If there is movement that exceeds the thresholds for that prism, then a preliminary alarm is shown in the data window only. The REF Prism is re-measured then the current prism is re-measured. If the movement still exceeds the thresholds, then the alarm is sounded. All alarms enabled in the alarm window will be activated. The reason for re-measuring the REF Prism is sometimes evident when an event (like a pit blast) interferes with the instrument orientation and measures movement that is false. A REF re-measure will re-orientate the instrument and correct the problem.
Autoslope Manual
June 2009 , Rev.2.50 101
2.15.0 SMS Alarm Setup If you have purchased an SMS alarm with your system and it was not installed and configured as part of the initial installation, then see the Module 5, Softrock Monitoring System – Site Setup.
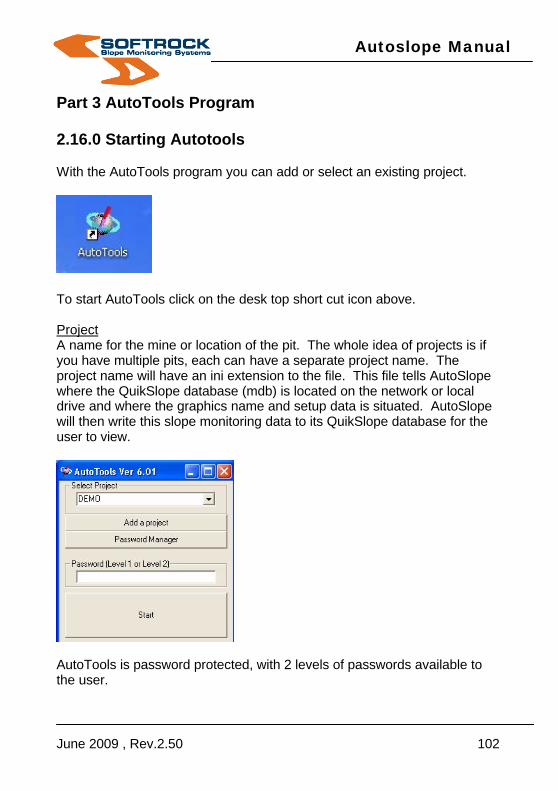
Autoslope Manual
June 2009 , Rev.2.50 102
Part 3 AutoTools Program 2.16.0 Starting Autotools With the AutoTools program you can add or select an existing project.
To start AutoTools click on the desk top short cut icon above. Project A name for the mine or location of the pit. The whole idea of projects is if you have multiple pits, each can have a separate project name. The project name will have an ini extension to the file. This file tells AutoSlope where the QuikSlope database (mdb) is located on the network or local drive and where the graphics name and setup data is situated. AutoSlope will then write this slope monitoring data to its QuikSlope database for the user to view.
AutoTools is password protected, with 2 levels of passwords available to the user.

Autoslope Manual
June 2009 , Rev.2.50 103
Level 1 password is for limited use of AutoTools. This is so valuable settings information is not altered which might alter the running of the software. Level 2 password is for the administrator, with full access to AutoTools. The administrator can change any of the settings for AutoSlope, though before making any of these important changes, it is advisable to confirm these with Softrock Solutions.
Select the Password Manager button to make any changes to the passwords. If you have forgotten the password for Level one or the Administration password, then select the Current hint button in the appropriate column, and it will prod you with a hint which has been set by the user, see below.
You can change these passwords at any time, simply by keying in the old password and confirming it and then filling in the Hint for the new password box. Though to make these changes, you must have the Administration password for both levels.
Note these passwords are case sensitive!
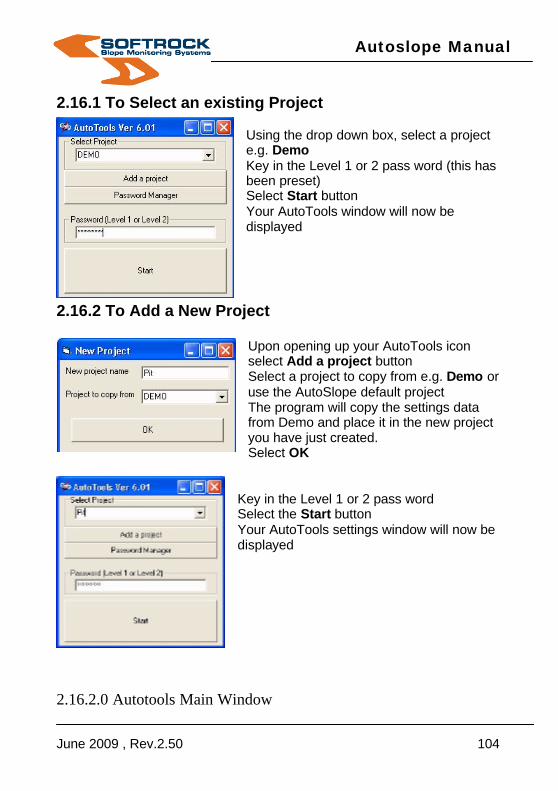
Autoslope Manual
June 2009 , Rev.2.50 104
2.16.1 To Select an existing Project Using the drop down box, select a project e.g. Demo Key in the Level 1 or 2 pass word (this has been preset) Select Start button Your AutoTools window will now be displayed
2.16.2 To Add a New Project Upon opening up your AutoTools icon select Add a project button Select a project to copy from e.g. Demo or use the AutoSlope default project The program will copy the settings data from Demo and place it in the new project you have just created. Select OK
Key in the Level 1 or 2 pass word Select the Start button Your AutoTools settings window will now be displayed
2.16.2.0 Autotools Main Window
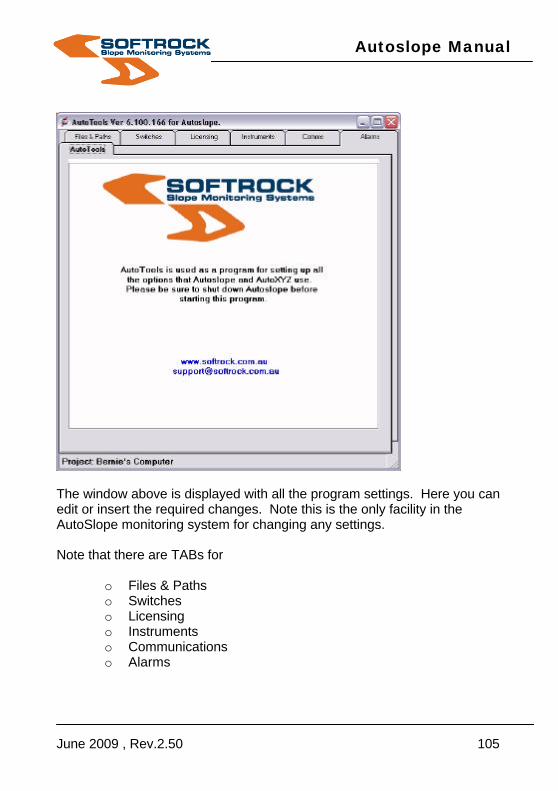
Autoslope Manual
June 2009 , Rev.2.50 105
The window above is displayed with all the program settings. Here you can edit or insert the required changes. Note this is the only facility in the AutoSlope monitoring system for changing any settings. Note that there are TABs for
o Files & Paths o Switches o Licensing o Instruments o Communications o Alarms

Autoslope Manual
June 2009 , Rev.2.50 106
2.16.2.1 Files & Paths Tab
QuikSlope project file for direct access- Prior to starting the AutoSlope program, you need an existing QuikSlope database. For sites with the manual or semi automated slope monitoring systems, all their raw data is processed in QuikSlope. All this processed information is written to a QuikSlope database (mdb access database). For sites that have never used the Softrock systems, then at the installation process, one will be created for you. This QuikSlope database is what AutoSlope needs to save the monitoring information to. You need to give AutoSlope the pathway to where this database resides on your network. This can be located anywhere on the local network. It must be a unique name and all the AutoSlope updating of this database is done automatically at the pathway displayed here. Note remember to regularly backup this database! Use a proxy database-

Autoslope Manual
June 2009 , Rev.2.50 107
We recommend you use a proxy database as this is a precaution against network failures which could terminate the AutoSlope Program. The proxy database simply stores the data to a local database and then transfers this data to the main QuikSlope database that is elsewhere on the network. The data transfer between the databases is done in the background. If there is a network problem then the data transfer is done at a later date without AutoSlope crashing. Once the Use Access Proxy only box is checked, the proxy database will automatically go to the local database directory. Once the Use Access & SQL Proxy box is checked, the proxy database will automatically go to the local database directory, and an sql log file will be picked up. This is only used when the Analyzer and Autosync are installed.. NOTE: There are 3 options.
o No proxy used o Use Access Proxy only o Use Access & SQL Proxy
NOTE: When using proxy on, please ensure that the box Restrict proxy to inst number is ticked. Working dbase (Benchmarks) It is important that you know what database will be used as the main dbase. This is the dbase that will be used to check graphs and edit data. If a benchmark is changed in an edit, that will affect the 3D movement values of that prism, and so it could affect alarming thresholds. Alarm thresholds are taken from the proxy dbase (if used). If there is an edit of the benchmark data, then that data will be transferred from the main dbase back to the proxy dbase. This happens after an alarm, so there is the possibility of a delayed transmition of benchmark data. Normally Main Access Quikslope would be ticked here. There are 3 options:
o Main Access Quikslope o Proxy Access dbase o SQL dbase

Autoslope Manual
June 2009 , Rev.2.50 108
Normally the benchmark data is taken from the QuikSlope database. The benchmark data is where the delta movements for the prisms are calculated. This benchmark must be manually updated in the proxy if you have changed it in the QuikSlope database and are using the proxy for monitoring! Note that there is a cycle delay with using the proxy, eventually the databases will be the same, as the proxy keeps trying to write to the QuikSlope database as soon as the network allows it to. This option of getting the benchmark data from the proxy is for specific use only.
You cannot edit or change the pathway and name of the proxy database.
The pathway to the name of the QuikSlope project will automatically be created with the extension proxy added to it e.g. databasename-proxy.mdb. Therefore be sure to set the QuikSlope name first, fill in the pathway for the local databases and then lastly check the proxy tick box. You must then copy the QuikSlope mdb project file and rename it with an –proxy.mdb extension. NOTE: There will always be a difference between the proxy database and the main QuikSlope database. Any data edits carried out on the main database will not be reflected in the proxy database, except for benchmark data. Benchmark data will be transferred back to the proxy database. Apart from benchmark data, all data travels in one direction - toward the main QuikSlope database. There can also be additions to the main QuikSlope database that will not appear in the proxy database. These can be new data that has been collected manually and added via the import facility. There is also additions to event, rainfall, cracks and pit plan data that is not required in the local proxy database. In other words, the proxy database can be quite different to the main QuikSlope database. For example, setup numbers may vary from one database to the other for exactly the same data. The AutoSlope graphing function will graph from the local proxy data. This data may gather spikes over time, so the proxy database may need maintenance from time to time for this facility to continue working effectively. Before using a proxy database, ensure that there is at least one record reading in the QuikSlope Database. See steps below -
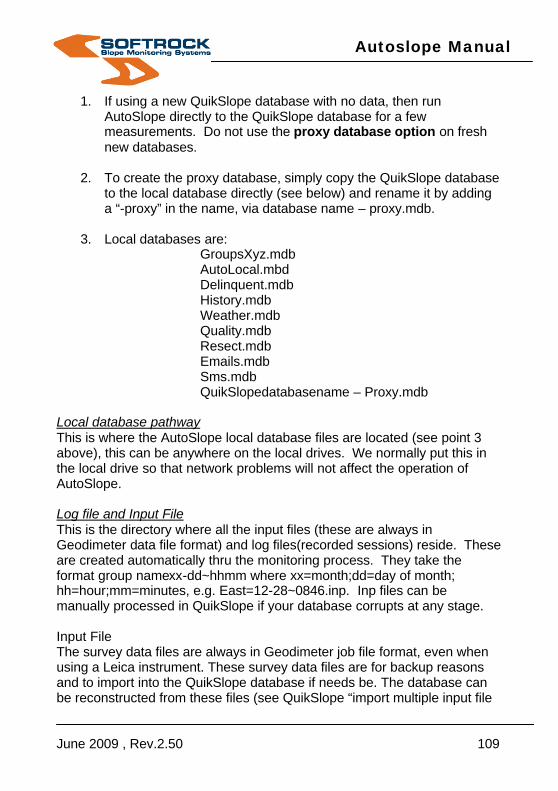
Autoslope Manual
June 2009 , Rev.2.50 109
1. If using a new QuikSlope database with no data, then run AutoSlope directly to the QuikSlope database for a few measurements. Do not use the proxy database option on fresh new databases.
2. To create the proxy database, simply copy the QuikSlope database
to the local database directly (see below) and rename it by adding a “-proxy” in the name, via database name – proxy.mdb.
3. Local databases are:
GroupsXyz.mdb AutoLocal.mbd Delinquent.mdb History.mdb Weather.mdb Quality.mdb Resect.mdb Emails.mdb Sms.mdb QuikSlopedatabasename – Proxy.mdb
Local database pathway This is where the AutoSlope local database files are located (see point 3 above), this can be anywhere on the local drives. We normally put this in the local drive so that network problems will not affect the operation of AutoSlope. Log file and Input File This is the directory where all the input files (these are always in Geodimeter data file format) and log files(recorded sessions) reside. These are created automatically thru the monitoring process. They take the format group namexx-dd~hhmm where xx=month;dd=day of month; hh=hour;mm=minutes, e.g. East=12-28~0846.inp. Inp files can be manually processed in QuikSlope if your database corrupts at any stage. Input File The survey data files are always in Geodimeter job file format, even when using a Leica instrument. These survey data files are for backup reasons and to import into the QuikSlope database if needs be. The database can be reconstructed from these files (see QuikSlope “import multiple input file
Autoslope Manual
June 2009 , Rev.2.50 110
option”). Again these will live somewhere on your local drive normally in (AutoTools) the path - C:\AutoSlopeData\LogFiles Log File The Log files are a record of events of a measuring sequence for a particular prism group. The name of the file reflects the group name, date and time. Softrock often require these log files to be able to investigate any problems that may arise. See the section 2.7.1 Alarm Controls, Email Alerts for automatically emailing log files to Softrock. Extensions are .Log for a log of each session. To Complete the Pathways and files box Using your browser button select the QuikSlope Demo database located under the correct directory.
Note if you have the use a proxy database box checked, when changing to another QuikSlope database you will need to refresh that box to get the new database name. If you don’t do this then the old database-proxy name will still appear.
Normally the local database and Log file and Input file pathway have already been set at the installation process.
Date Format It is very important to understand how the software looks at dates. You must have it in the short date format. The short date format is Day Month Year shown at 1 Jan 2000 (dd-mmm-yy). This is to avoid confusion between the many formats that can be used. Please change your format if it isn’t in this mode. Refer to Section 2.0 Getting Started.
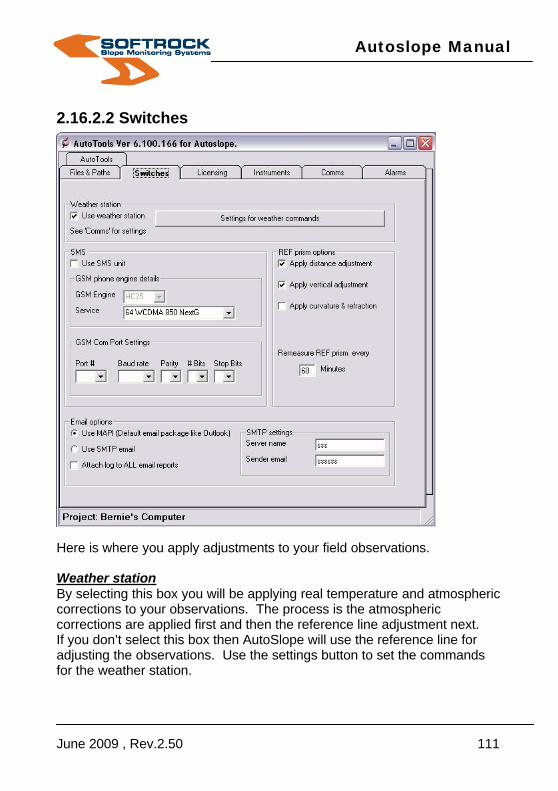
Autoslope Manual
June 2009 , Rev.2.50 111
2.16.2.2 Switches
Here is where you apply adjustments to your field observations. Weather station By selecting this box you will be applying real temperature and atmospheric corrections to your observations. The process is the atmospheric corrections are applied first and then the reference line adjustment next. If you don’t select this box then AutoSlope will use the reference line for adjusting the observations. Use the settings button to set the commands for the weather station.

Autoslope Manual
June 2009 , Rev.2.50 112
Weather station type
o Monitor Sensors o DTM o E-Data
Monitor Sensors usually uses these commands: Temperature = 1 (sometimes 2) Pressure =3 Rain = 4 DTM commands are set internally by using the DTM button E-Data commands are set internally by using the E-Data button Default values can be set for temperature and pressure to help eliminate problems when readings are not returned.

Autoslope Manual
June 2009 , Rev.2.50 113
REF prism options AutoSlope uses a fixed line to calculate the positions of the prisms in a group. This line is derived from a control station (the station the instrument is setup on) and a Ref Prism. There will be differences between the design co-ordinates of the Control Station and Ref Prism versus the measured co-ordinates in the field. These differences are called the adjustment factors. The adjustment factors can be either the slope distance or vertical angle adjustment, see QuikSlope Manual, QS_Manual_2.00, section 1.4.1 Calculate Co-ordinates. There also is a Curvature and Refraction adjustment. We recommend you apply the adjustments to the distance and vertical angle to the Ref Prism to keep the co-ordinates correct. This adjustment is then pro-rated to the remaining observations in that group. For example if the known distance to your REF prism is 853.237 metres from the instrument station, and when it is measured at the beginning and end of a group the average distance is 853.206 then this difference (0.031 over 853.206) is extrapolated out to 1000 metres (0.036) and this factor applied to all distances for that group. The adjustment to the vertical angle works in the same manner. As above it is extrapolated out to 1000 metres. NOTE!! You can only disable these adjustments when a weather station is used.
Curvature and Refraction The option for curvature and refraction is available, but to be used with care as this will change the results. Only to be used consistently and for specific applications. This adjustment is useful for when shooting over long distances, will make a difference to the vertical angle. Though bear in mind if you use it initially, continue using this for further calculations. This adjustment is only applied to the reference prism and hence to the remaining prisms in that group.
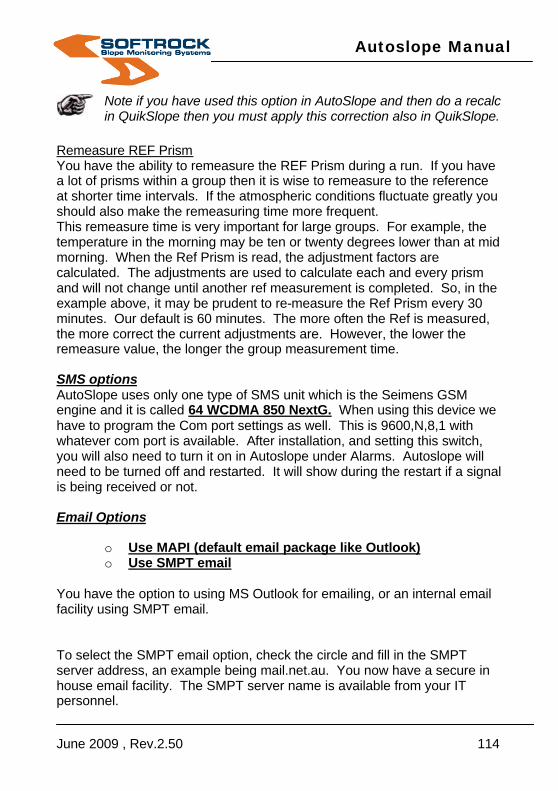
Autoslope Manual
June 2009 , Rev.2.50 114
Note if you have used this option in AutoSlope and then do a recalc in QuikSlope then you must apply this correction also in QuikSlope.
Remeasure REF Prism You have the ability to remeasure the REF Prism during a run. If you have a lot of prisms within a group then it is wise to remeasure to the reference at shorter time intervals. If the atmospheric conditions fluctuate greatly you should also make the remeasuring time more frequent. This remeasure time is very important for large groups. For example, the temperature in the morning may be ten or twenty degrees lower than at mid morning. When the Ref Prism is read, the adjustment factors are calculated. The adjustments are used to calculate each and every prism and will not change until another ref measurement is completed. So, in the example above, it may be prudent to re-measure the Ref Prism every 30 minutes. Our default is 60 minutes. The more often the Ref is measured, the more correct the current adjustments are. However, the lower the remeasure value, the longer the group measurement time. SMS options AutoSlope uses only one type of SMS unit which is the Seimens GSM engine and it is called 64 WCDMA 850 NextG. When using this device we have to program the Com port settings as well. This is 9600,N,8,1 with whatever com port is available. After installation, and setting this switch, you will also need to turn it on in Autoslope under Alarms. Autoslope will need to be turned off and restarted. It will show during the restart if a signal is being received or not. Email Options
o Use MAPI (default email package like Outlook) o Use SMPT email
You have the option to using MS Outlook for emailing, or an internal email facility using SMPT email. To select the SMPT email option, check the circle and fill in the SMPT server address, an example being mail.net.au. You now have a secure in house email facility. The SMPT server name is available from your IT personnel.

Autoslope Manual
June 2009 , Rev.2.50 115
2.16.2.3 Alarm Configuration
Alarm Profiles Alarm profiles are the method that allows some flexibility in the Softrock alarming. The physical alarms that Softrock supplies utilise a bank of four relays that can be hooked up to strobes, sirens, tone alarms etc. There is flexibility in the command structure so that other alarms can be used. Communications can be by direct RS232 port, radio system address or IP address using Window sockets.

Autoslope Manual
June 2009 , Rev.2.50 116
2.16.3.3 Alarm Communication Configuration. Alarm triggers (as opposed to thresholds) are for triggering different events. An event can be an Alert (sound the alarm), or a Clear (sound an all clear – green strobe), or Off (turn off alarm). The Alert is self explanatory. The Clear is used when there is a need to let personnel know that the system is still working. The Clear alarm is sounded at the start of each Ref prism measurement.
By selecting your alarm profile using the drop down arrow, you will display the alarm types. If you require to change an alarm type select the drop down box in the Alarm type and choose from the list- nil, green strobe, office alarm green, office alarm red, red strobe, siren and tone alarm. The Trigger can be set to Nil, Alert, Clear or Off. Your editing capabilities here are limited and any deleting or creating of alarm profiles can only be done via the communication settings button.

Autoslope Manual
June 2009 , Rev.2.50 117
Note: You have the ability to add a carriage return to the alarm commands. Alarm commands now accept CR as a +CR like “10030#+cr”. This command is dependant on the device. Not all devices require this command. It basically tells the device whether it requires a response for AutoSlope to proceed. This option is basically for the installation process only, with the installation crew using this program code.
This is where the Alarm profiles are created or deleted. The alarm configuration box is filled in at the installation process. The Alarm Profile is simply a name of the location where the alarm types will be activated. To create a new alarm profile using either Cable, Radio or Sockets communication method-
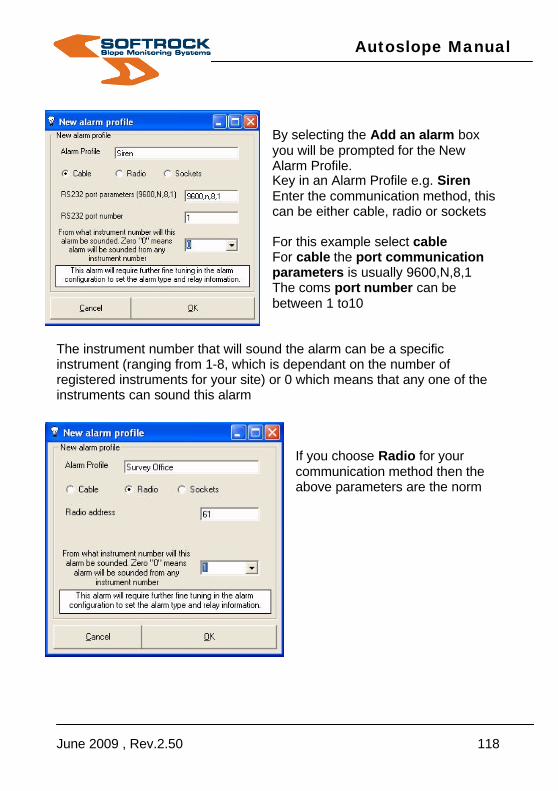
Autoslope Manual
June 2009 , Rev.2.50 118
By selecting the Add an alarm box you will be prompted for the New Alarm Profile. Key in an Alarm Profile e.g. Siren Enter the communication method, this can be either cable, radio or sockets For this example select cable For cable the port communication parameters is usually 9600,N,8,1 The coms port number can be between 1 to10
The instrument number that will sound the alarm can be a specific instrument (ranging from 1-8, which is dependant on the number of registered instruments for your site) or 0 which means that any one of the instruments can sound this alarm
If you choose Radio for your communication method then the above parameters are the norm
Autoslope Manual
June 2009 , Rev.2.50 119
If you choose Socket for your communication method then the above parameters are the norm. The IP address will be supplied by your IT department as well as the IP port number.
The new profiles you have just created will be displayed in the Alarm configuration window. To delete an alarm profile, highlight the profile name. Select the delete alarm button.

Autoslope Manual
June 2009 , Rev.2.50 120
Select yes to delete Dispatch Office. This Alarm profile will now be removed.

Autoslope Manual
June 2009 , Rev.2.50 121
2.16.3 Communication Settings 2.16.3.1 Instrumentation Settings In this window you can select the instrument settings. We need to know
o Where each instrument is (Inst # to Control Name) o Control Adjustment methods o Instrument Type o Allowable instrument errors
Instrumentation Settings
Control ID. By using the drop down arrows in the Control ID column you can select the Control name from the project database for each instrument number. Each instrument number refers to the radio address or IP

Autoslope Manual
June 2009 , Rev.2.50 122
address. So a group is associated with a Control Station, and an instrument number is also associated with a Control Station. Control Adjustment Method. There are these choices
o 0 No adjustment o 1 Move Inst Station o 2 Move REF prism o 3 Move Inst & REF o 4 Move Inst by Resection
NOTE: See 2.16.3.3 Control Adjustment Methods Instrument Type. There are these choices
o Geodimeter Geodimeter ATS o Leica1800 Leica 1800 or Leica 2003 o Leica1103 Leica 1100 or Leica 1103 o Leica1200 Leica 1200 range o Leica-TM30 Leica TM30 o Topcon Topcon 9000 o Trimble-GKA Trimble 4D & S8
NOTE: All selections must be chosen from drop downs. Do not type a new selection. The allowable Standard Deviation tolerances are changeable, though care should be taken when altering them. Note that a low standard deviation may affect how Autoslope operates. Autoslope will not accept readings over these tolerances. It is a good idea to regularly look at the quality report. These will give you all the standard deviations for the instruments registered for your site. If the spread of the standard deviations start to increase in value, you might need to service the instrument/s in question. The smaller the standard deviations then we can say then the better the observations.
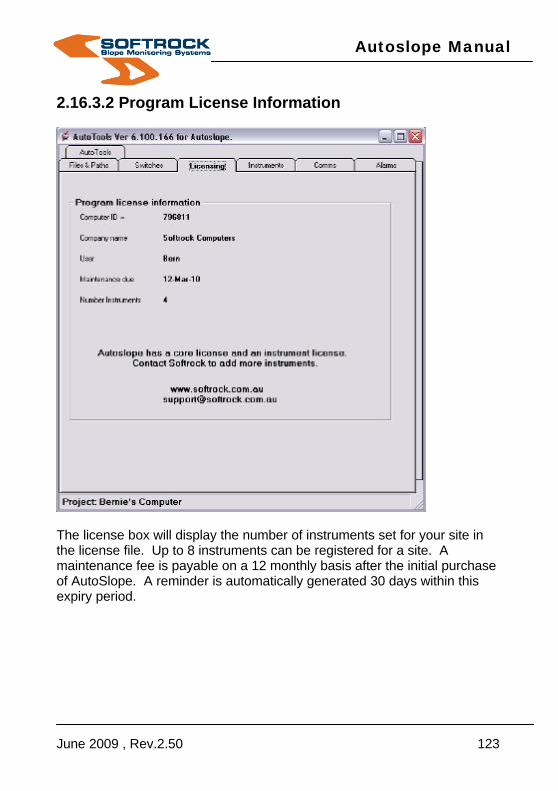
Autoslope Manual
June 2009 , Rev.2.50 123
2.16.3.2 Program License Information
The license box will display the number of instruments set for your site in the license file. Up to 8 instruments can be registered for a site. A maintenance fee is payable on a 12 monthly basis after the initial purchase of AutoSlope. A reminder is automatically generated 30 days within this expiry period.

Autoslope Manual
June 2009 , Rev.2.50 124
This reminder is located in the Settings option on the AutoSlope main menu.
Autoslope Manual
June 2009 , Rev.2.50 125
2.16.3.3 Control Adjustments Automatic Control Adjustment This option has been created to smooth out any control changes by making regular adjustments to the control coordinates. By checking this box, your control adjustments will be made by selecting an option. Control Adjustment Method. There are these choices
o 0 No adjustment o 1 Move Inst Station o 2 Move REF prism o 3 Move Inst & REF o 4 Move Inst by Resection
The first 4 methods are a rudimentary adjustment and doesn’t eliminate the need for regular checks on your control network. It will compare the observed length of the line from the control station to the reference prism with the calculated distance using the control database co-ordinates (design distance). If there is a difference greater than the default amount e.g. 0.01 then you have a choice of adjusting the control with the options above. You must be careful that the instrument co-ordinates are not adjusted backwards or forwards. This can cause all the prism co-ordinates to also move backwards and forwards. Option 0 This is no control adjustment and no action. Option 1 Move the station only. This will recalculate a position along the line between instrument and Ref Prism, it can be in either direction. The REF prism should be stable. If there is any distance changes along this line, we will presume it is the instrument station moving. So, in the example above, if the baseline (instrument to REF) distance changes by 0.010 or more, then the instrument station coordinates will be recalculated and the control database edited. The down side of using this option is if the distance change is under 0.010, there will be no recalculation of the control. NOTE: Changes to the instrument control can affect all prism coordinates
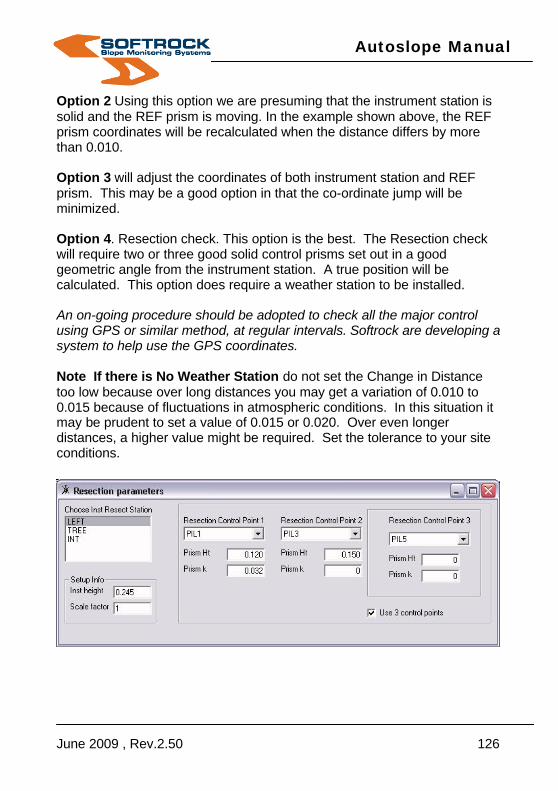
Autoslope Manual
June 2009 , Rev.2.50 126
Option 2 Using this option we are presuming that the instrument station is solid and the REF prism is moving. In the example shown above, the REF prism coordinates will be recalculated when the distance differs by more than 0.010. Option 3 will adjust the coordinates of both instrument station and REF prism. This may be a good option in that the co-ordinate jump will be minimized. Option 4. Resection check. This option is the best. The Resection check will require two or three good solid control prisms set out in a good geometric angle from the instrument station. A true position will be calculated. This option does require a weather station to be installed. An on-going procedure should be adopted to check all the major control using GPS or similar method, at regular intervals. Softrock are developing a system to help use the GPS coordinates. Note If there is No Weather Station do not set the Change in Distance too low because over long distances you may get a variation of 0.010 to 0.015 because of fluctuations in atmospheric conditions. In this situation it may be prudent to set a value of 0.015 or 0.020. Over even longer distances, a higher value might be required. Set the tolerance to your site conditions.

Autoslope Manual
June 2009 , Rev.2.50 127
2.16.3.4 Instrument Communication Settings You have 3 options for this selection.
? RS232 Cable – direct cable to single instrument ? RS232 Radio – cable into serial base radio which transmits to all
instruments, alarms and weather stations ? Windows sockets – typically uses Ethernet radio system of IP
addresses for each device RS232 Cable
This connects the computer directly to the instrument. Not commonly used, specific situations only. The Baud Rate is usually 9600 or 19200 for Geodimeter ATS and Leica. But this is flexible. The radio address does not matter.
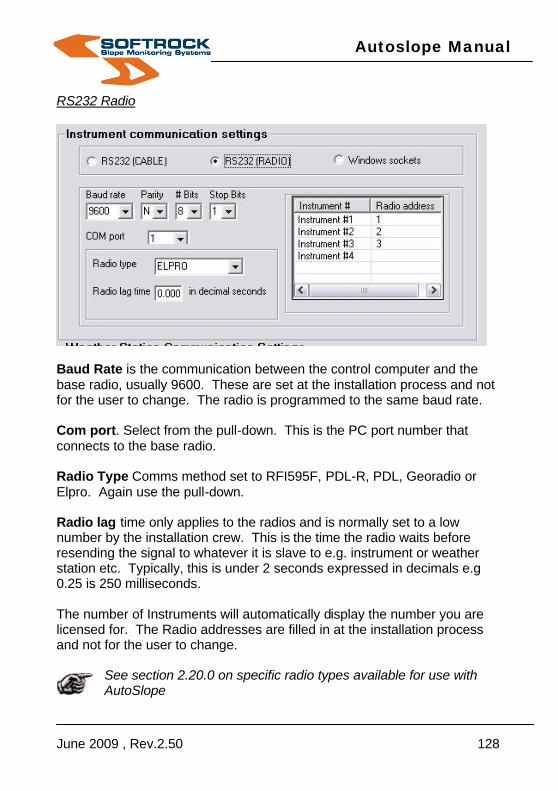
Autoslope Manual
June 2009 , Rev.2.50 128
RS232 Radio
Baud Rate is the communication between the control computer and the base radio, usually 9600. These are set at the installation process and not for the user to change. The radio is programmed to the same baud rate. Com port. Select from the pull-down. This is the PC port number that connects to the base radio. Radio Type Comms method set to RFI595F, PDL-R, PDL, Georadio or Elpro. Again use the pull-down. Radio lag time only applies to the radios and is normally set to a low number by the installation crew. This is the time the radio waits before resending the signal to whatever it is slave to e.g. instrument or weather station etc. Typically, this is under 2 seconds expressed in decimals e.g 0.25 is 250 milliseconds. The number of Instruments will automatically display the number you are licensed for. The Radio addresses are filled in at the installation process and not for the user to change. See section 2.20.0 on specific radio types available for use with AutoSlope

Autoslope Manual
June 2009 , Rev.2.50 129
Windows sockets The instrument number will display the amount of registered instruments for your site. You fill in the IP address being a number something like 192.168.1.1 The port number is equipment specific which is dependant on the network communication devices. The port number may be required by IT personnel to allow the software to operate through the firewall.
IP Address The IP address for each piece of equipment will depend on how the site IT people assign them. These assignments are then applied to each com server that is physically plugged into the equipment, whether it be an instrument, or a weather station, or an alarm, etc. The typical port number used would be dependant on the equipment used and is usually 4000 to 4010.

Autoslope Manual
June 2009 , Rev.2.50 130
2.16.3.5 Weather Station Communication Settings Four options available-
? RS232(cable) ? RS232(radio) ? Windows sockets ? Read from dBase
Depending on what selection you make you have 4 choices of screens to fill in. RS232(cable)
By choosing the Cable method which is directly hooked up to the weather station you must fill in the Port, Baud rate, Parity, Bits and Stop bits. The baud rate is usually 1200 due to the manufacturing process. The default is 1200,N, 8,1. Choose the correct com port number for the PC. Select the Weather station command structure button to display the communication commands to the weather station.

Autoslope Manual
June 2009 , Rev.2.50 131
RS232(radio)
When using the radio method, all communication is carried out via the base radio. This usually means that the instruments need to be shut down when getting weather information. By selecting the radio method the address default is 51. Select the Weather station command structure button to display the communication commands to the weather station. Windows sockets
By selecting Windows sockets option, you must fill in the Network IP address for the Windows sockets and port. See IP Addressing, 2.16.1.3 Section Instrument Communication Settings Module 2.

Autoslope Manual
June 2009 , Rev.2.50 132
Read from dBase
By selecting the read from dBase option you are using the AutoWeather program. This program works independently from AutoSlope, it will continuously read weather information and write it to the weather.mdb database. This data is then transferred to AutoSlope. If you are also using a rain gauge and precipitation occurs this information is automatically collected by AutoWeather. The advantage of using this program is it will continuously update weather information even when AutoSlope isn’t operating. Note: We can now centralise the weather.mdb database. This means that just one Autoweather needs to run even though multiple Autoslopes are running. Note: See 2.16.2.2 – the Switches tab for Weather Station type and commands. See, Communication Settings 2.16.3.6 Section AutoWeather Module 2, for more information on this program.

Autoslope Manual
June 2009 , Rev.2.50 133
2.16.3.6 AutoWeather Program AutoWeather is intended to be run on the Autoslope control computer where
1. A rain guage is on the weather station. 2. Communications to the weather station is by direct cable or
Windows sockets (TCP/IP) only. AutoWeather can also be run on any computer, this way you can see the weather instantly. Note: White background
Normally, Autoslope will read the weather data directly as the measurements progress. The weather readings are taken every xx prisms (see AutoTools). But when Autoslope is not running for some reason, or when prisms are not being measured, then the weather readings will also not be read. To get around that we can use AutoWeather. AutoWeather has some unique features but cannot be used where communications to the weather

Autoslope Manual
June 2009 , Rev.2.50 134
station are via radio addressing. If Autoslope is using the base radio then AutoWeather cannot use the base radio to contact the weather station. It is best to use AutoWeather when a rain guage is in use. AutoWeather reads the temperature, pressure (maybe rain gauge) and store the data into the database weather.mdb. Take special note of the background of the AutoWeather window, this means that the weather record is up to date (within 1 hour readings). This background can change to three other colours.
? Red-data is 2 hours old ? Orange-data is 1 hour old ? Yellow-data is 30 minutes old
AutoSlope will send out an email report when the weather data exceeds 3 hours old, this is an AutoWeather report, see picture below.
AutoSlope will continue measuring and make up to 30 attempts (generally 3 to 4 hours) to update the weather information. If unsuccessful then another email will be sent. This email report is sent every day at 9am automatically.

Autoslope Manual
June 2009 , Rev.2.50 135
Pressure readings are given as xx reading hPa + 40 hPa (this is for people who wish for the isobars information) Settings
Under the settings menu are the Settings and Email Recipient List options. If you select Settings then you will get the weather settings window with the option of selecting either RS232 Cable or Window Sockets.

Autoslope Manual
June 2009 , Rev.2.50 136
Windows sockets 1. Select Windows sockets for communications to the weather station. 2. If Windows sockets (TCP/IP) then select the IP address and port
number. 3. Enter communication command characters. “1” or “2” for the
temperature. “2” or “3” for the air pressure. “3” or “4” for the rain guage. These command characters can be different per sensor.
4. Check if rain guage installed. 5. Check reset rain guage if you require the guage to reset to zero at
the reset time (usually 09:00 hours). 6. Set time in minutes to get the weather. “10” is usually a good
setting. 7. Site level above sea level. The air pressure readings are true
readings and are not adjusted for height. When we email the daily

Autoslope Manual
June 2009 , Rev.2.50 137
report, this value is shown as an addition to the air pressure readings if they are required for weather synopsis purposes.
RS232 Cable
1. If RS232 then select the communication parameters for the port. 2. Enter communication command characters. “1” or “2” for the
temperature. “2” or “3” for the air pressure. “3” or “4” for the rain guage. These command characters can be different per sensor.
3. Check if rain guage installed. 4. Check reset rain guage if you require the guage to reset to zero at
the reset time (usually 09:00 hours). 5. Set time in minutes to get the weather. “10” is usually a good
setting. 6. Site level above sea level. The air pressure readings are true
readings and are not adjusted for height. When we email the daily
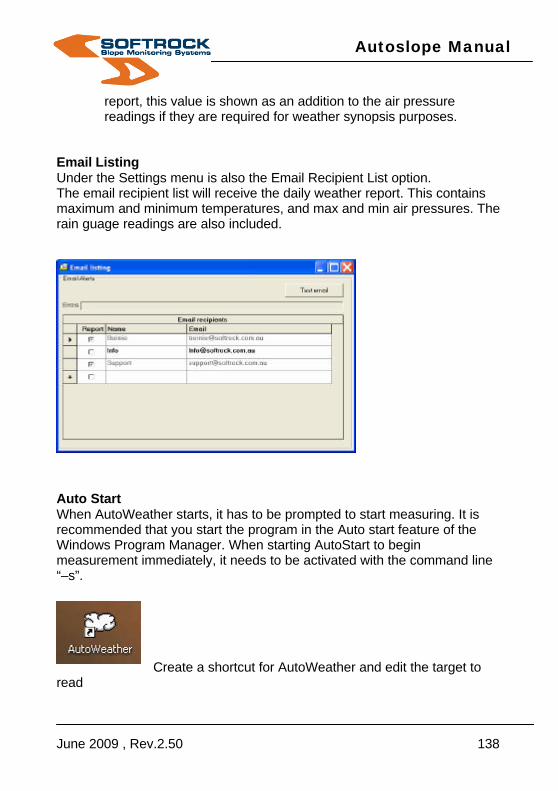
Autoslope Manual
June 2009 , Rev.2.50 138
report, this value is shown as an addition to the air pressure readings if they are required for weather synopsis purposes.
Email Listing Under the Settings menu is also the Email Recipient List option. The email recipient list will receive the daily weather report. This contains maximum and minimum temperatures, and max and min air pressures. The rain guage readings are also included.
Auto Start When AutoWeather starts, it has to be prompted to start measuring. It is recommended that you start the program in the Auto start feature of the Windows Program Manager. When starting AutoStart to begin measurement immediately, it needs to be activated with the command line “–s”.
Create a shortcut for AutoWeather and edit the target to
read

Autoslope Manual
June 2009 , Rev.2.50 139
"C:\Program Files\Softrock\AutoSlope\AutoWeather.exe" "-s"
Have AutoWeather running 24/7 even if AutoSlope is not activated. This way you can still get rain gauge information.
Have AutoWeather running 24/7 even if AutoSlope is not activated. This way you can still get rain gauge information. Note: that AutoSlope will continue to measure even when weather data is out of date. Heed the email warnings and see why AutoWeather is not working.

Autoslope Manual
June 2009 , Rev.2.50 140
Part 4 AutoXYZ Program 2.17.0 AutoXYZ AutoXYZ program is where you can insert, edit or delete control data, prisms, or create prism groups. Control Database – The control database is where you insert your control stations and Reference Prisms. This information is placed in the AutoSlope database, which can be different to the co-ordinates in the QuikSlope database. Prism Database – The Prism Database is where all your monitoring prism co-ordinates are stored. These are the co-ordinates that the instrument uses to locate the prisms. Again these co-ordinates can be different to the ones in the QuikSlope database. Prism Group Management – Once the Control co-ordinates and the Prism Co-ordinates are in their AutoSlope databases, you are then able to create groups to monitor the relevant prisms. In a newly created group, you fill in the window with all the setup information and the prisms you wish to monitor from this setup. Note you can have the same prism placed in more than 1 group to monitor it at different times and from different control stations. These groups are placed in an access database called GroupsXYZ.mdb New Prism The main window now gives different ways of presenting a new prism to Quikslope. You can either select an area name or have Autoslope use the current group name as an area name. This will only happen once for a new prism. The area name can be changed as usual in Quikslope. Delinquent Prism Management – If you wish to use this tool, it will allow Autoslope to automatically remove a prism from a group, if it has not had a reading for XX days. It will place it in a delinquent group which will be created if not already available. This delinquent group can be read manually in Autoslope every couple of weeks to check for recovered prisms.

Autoslope Manual
June 2009 , Rev.2.50 141
Change Password – To use AutoXYZ you are required to enter a password. This can be either the Level 1 or 2 passwords set in AutoTools Password Manager. This password can only be changed in AutoTools.

Autoslope Manual
June 2009 , Rev.2.50 142
2.17.1 Control Database
By selecting the Control Database icon you will open the window below.
New Control-this is where you insert new control stations and reference prisms. Export Windows CE- allows you to create a file of control co-ordinates that can be uploaded into a Recon palm computer, this is for semi-automated sites. Import File- You can also import control data, note this is a csv file that must be in the correct format, comma delimited Id, Northing, Easting, Level. Delete Control-by selecting the Control Point you can delete this data from the AutoSlope Database. This doesn’t delete the point from the QuikSlope database. Exercise
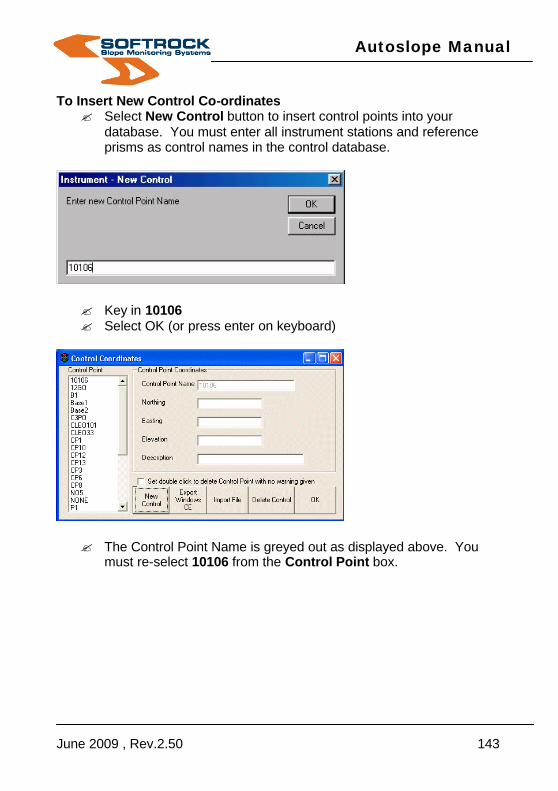
Autoslope Manual
June 2009 , Rev.2.50 143
To Insert New Control Co-ordinates ? Select New Control button to insert control points into your
database. You must enter all instrument stations and reference prisms as control names in the control database.
? Key in 10106 ? Select OK (or press enter on keyboard)
? The Control Point Name is greyed out as displayed above. You
must re-select 10106 from the Control Point box.

Autoslope Manual
June 2009 , Rev.2.50 144
? Once you have re-selected 10106, place the cursor in the Northing box, and key the northing 44368.981. Place the cursor in the Easting box and key in the easting 10636.033. Continue to the Elevation box and key in 480.098. Finally, fill in the Description field Ref Target.
? Select OK to exit this window. ? If this was a control station you would put this in the description
field instead.
? To view what you have just keyed in, select control point 10106 to display all the new data. If you wanted to edit any of this, simply place the cursor in the required box and perform your edits. Select OK to accept new edits. This will also take you back to the main AutoXYZ menu.

Autoslope Manual
June 2009 , Rev.2.50 145
It is a good idea to enter into the Description field whether it is a control station or Reference Prism. Not all the naming conventions make it easy to distinguish if it is either. In the example above 10106 is a Reference Prism, and you are made aware of this by the Description field entry. You can also import this data, note this is a csv file that must be in the correct format, comma delimited Id, Northing, Easting, Level. See below.
If you import Control data, the Description field entry will automatically be Import File. The user can then change this if required. See below.
Exercise

Autoslope Manual
June 2009 , Rev.2.50 146
To Delete Control Co-ordinates
? Select 10106 in the Control Point Box ? Select the Delete Control button
? You will be prompted with the above box, select yes button, the control point 10106 has now been deleted from the AutoSlope database. Note this point still remains in the QuikSlope database.
Exercise To Create Control File for Upload to Recon Palm Computer
? Select the Export Windows CE button
? Browse or key in a file name e.g. control, it will automatically add the extension .con to it. Note you can call it whatever you wish. Select Open button.
? File written window will appear to let you know it has been created.
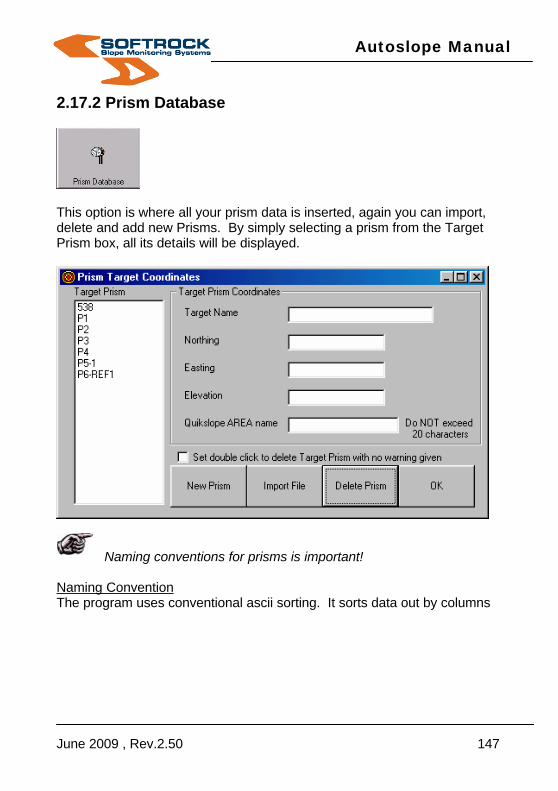
Autoslope Manual
June 2009 , Rev.2.50 147
2.17.2 Prism Database
This option is where all your prism data is inserted, again you can import, delete and add new Prisms. By simply selecting a prism from the Target Prism box, all its details will be displayed.
Naming conventions for prisms is important! Naming Convention The program uses conventional ascii sorting. It sorts data out by columns

Autoslope Manual
June 2009 , Rev.2.50 148
In the graphic above, the target prism P1 is located after P099 and before P100. It is a good idea if you are going to have many hundreds of prisms to start the naming at a letter followed by a few decimal places e.g. P0001. This will then allow your prisms to be sorted easily for the user. If you are only giving the prisms a number, then this number will be sorted before the alpha description of a target, see below target prism 1.
Exercise

Autoslope Manual
June 2009 , Rev.2.50 149
To Insert New Prism Co-ordinates
? Select the New Prism button ? Key in the Target Prism name ‘538’
? As displayed the Target Name 538 is greyed out, you must first select from the Target Prism box 538, before you can fill in any of the boxes.

Autoslope Manual
June 2009 , Rev.2.50 150
? Place your cursor in the Northing box and key in 44550.393. Place your cursor in the Easting box and key in 10689.813. Then do the same in the Elevation box and key in 392.565.
? The Area Name NEW will be the default here. ? Select OK. You will be taken back to AutoXYZ main menu. If you
wanted to view what you have just keyed in, select the Prism Database icon. Next select any prism e.g. 538 from the Target Prism box. All the co-ordinates will be displayed. You can also edit any of this from this mode simply by placing your cursor in any box and performing the necessary edits. Select OK button to save any edits.
The QuikSlope AREA name will default to New unless you specify an existing AREA name already in use in QuikSlope. This prism data will be deposited in whatever Area name you specify here. When entering new prisms, it is a good idea to call the Area Name New, so that the Geotech people will recognise that prism as a new one and will assign it to an Area of their choice.

Autoslope Manual
June 2009 , Rev.2.50 151
The co-ordinates for the Target will now be displayed. To delete a Prism simply follow the same steps as the delete a control point from the previous exercise.
Prisms can be entered manually or imported in a csv file in the format of ID, N, E, RL. Area names will default to New.
Exercise To Import a Prism file We will import a csv file called west1.csv with prism data for 558 and 570.
Note the format it is in above.

Autoslope Manual
June 2009 , Rev.2.50 152
? Select the Import File button
? You will be prompted for the file format
? Choose your file from your directory, in this case west1.csv.

Autoslope Manual
June 2009 , Rev.2.50 153
? These prisms will automatically be placed in your prism database.
Note if you have a prism already there with the same name then you will be prompted to override the existing prism.
Note the Imported prisms will be placed in the QuikSlope Area name New
? Your Prisms are now in the AutoSlope Database. The geotech
people can change the Area name to whatever suits them. Once the prism data is entered, then they can be measured by creating a group. Note all stored Prism and Control data in AutoSlope is unique and only one set of co-ordinates can be stored.

Autoslope Manual
June 2009 , Rev.2.50 154
2.17.3 Prism Group Management
By selecting the Prism Group Management button you can create, edit, delete and export group information.
This is where you insert all your setup data for monitoring a group of prisms in the pit. Edit Group You can change any control information setup or prisms in a group. New Group New groups are created for monitoring here. The group name must be unique. Delete Group You have the option of deleting group of prisms. Remember though, the prisms in this group will not be deleted from the prism database.

Autoslope Manual
June 2009 , Rev.2.50 155
Copy Group Copy group function will copy control setup data only. You will need to select the prisms in the group to be monitored. Export Windows CE This button allows you to create an export file of an existing group for upload to the Recon computer. Note that a prism can be in numerous groups at the one time. Therefore you can monitor a prism from more than one group. This is not to be confused with QuikSlope’s Area names. A prism can only be placed in one area name.
There is a difference between Group name and Area name as discussed above.
2.17.3.1 Edit Group One of the features of AutoSlope is it's ability to monitor different areas of the pit. To do this prisms that are to be monitored in any session are brought together in a "group". Any prism and any number of prisms can be included in a group. Groups are created with the following information:
? All the prisms for that group. This can be built by selecting prisms from the master list. Instrument station control point. Please use the select arrow to select from the list. It has to be listed.
? Instrument height in metres. ? Reference prism control name. Please use the select arrow to
select from the list. It has to be listed. ? HA setting towards the REF. ? REF prism type ? Permanent non-moveable prism (random)
Prism on Survey Control ? Prism height
Prism Constant There is no prism constant applied to the normal monitoring prisms

Autoslope Manual
June 2009 , Rev.2.50 156
(unless it is set in the instrument) but a prism constant is required here for the shot to the reference so that it can apply a proper adjustment. If the prism is permanent (randomly placed), then the coordinate is achieved by shooting the prism with proper atmospherics entered. In this case height is zero and prism constant is ignored (zero).
Note!! Any one prism can be in multiple groups. For example, a small group of critical prisms can be measured 10 times a day. The same prism can be included in a large group that is only measured once a day. No limit to the number of groups. Example
? To edit a group click on the "Edit Group" Button or double click on a group.

Autoslope Manual
June 2009 , Rev.2.50 157
? Here you can change details of an existing group. ? You can change the control station and reference station you are
using by selecting the new station from the drop down box. ? Change the prisms in the group by moving prisms in or out of the
"Prisms in this group" box. Remember to check the box at the bottom of the screen otherwise you will not be able to edit anything.
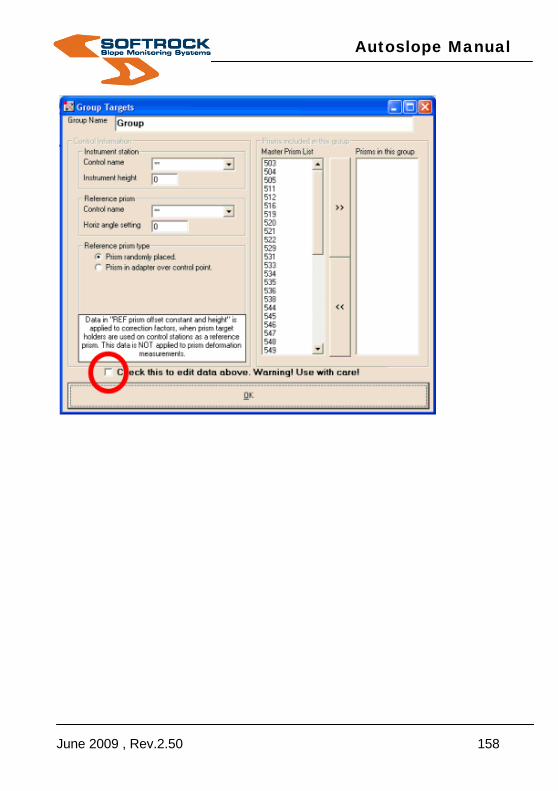
Autoslope Manual
June 2009 , Rev.2.50 158

Autoslope Manual
June 2009 , Rev.2.50 159
Multiple REF Prisms To set up multiple REF prisms we have to do this in edit groups. Firstly go to edit the group you wish to use multiple REFs. Then tick the box for this feature. Now click on the “Details”button.
Enter the number of REFs required. Note that the first line is NOT editable because these details should be already entered from the main edit group window. Also, the HA setting is not editable on any line because this is calculated from the original HA setting in the prior window. When Autoslope runs it will always start at the #1 REF and go through
in order until one REF is read OK. It will then read the prisms. It will not read all REFs if the first REF is read. Also note that the adjustments should be turned off when using this feature. Otherwise, if differing REFs are used on the same prism, it will produce differing adjustments for vertical and distance. This will have a negative impact on accuracy instead of the positive intended impact.

Autoslope Manual
June 2009 , Rev.2.50 160
2.17.3.2 New Group As with the Edit Group function New Groups require the same data e.g Instrument station, heights, reference prisms, heights etc. Check the box to insert all this setup data first. When you create a new group the name must be unique. From the master list use the arrows to select the prism/s required to be placed in this new group for monitoring. When you have finished simply select OK. You will now see the new group you have created in the list. Exercise To create a New Group
? Select the New Group Button. ? Key in North Group ? Select OK button
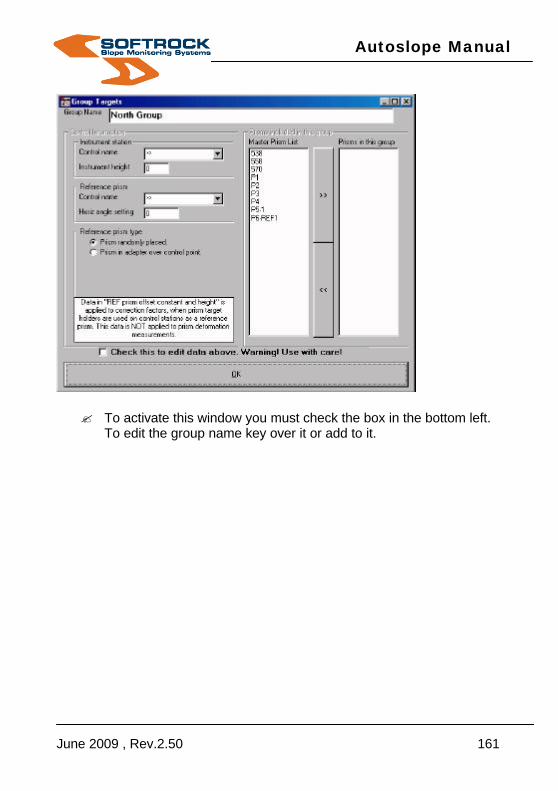
Autoslope Manual
June 2009 , Rev.2.50 161
? To activate this window you must check the box in the bottom left.
To edit the group name key over it or add to it.

Autoslope Manual
June 2009 , Rev.2.50 162
Under the Control Information panel fill in- ? Using the drop down arrow select Control name Base1 ? Instrument height(0.26 Geodimeter) ? Using the drop down arrow select Reference prism Ref1 ? Horizontal angle setting 0 or true bearing ? In Reference Prism type, by choosing the second option(which is
the recommended option as this allows you to re check your reference line when required), you will need to fill in the Prism height(target height) and prism constant(typically 0 if using same equipment, e.g. geodimeter instrument to geodimeter prisms and holders).
? Next under the Master Prism List, select P1, using the arrows,
move the prism/s to ‘Prisms in this group’ box. To move them back into the master list, do the same using the back arrows. Select OK. You have now created a group of prisms to be monitored called North Group.

Autoslope Manual
June 2009 , Rev.2.50 163
You can also double click with the mouse to select and remove prisms.
A Brief Word on Reference Prism Type. There are two types of REF prisms. A randomly placed prism refers to a permanently placed prism that may be attached to a pole star (iron picket) and concreted in the ground. The co-ordinates of this type of prism can only be calculated from the initial readings taken by the monitoring instrument. There is no need to know the prism constant and height. The second type of REF prism is one that is placed over a known survey point. This could be a survey traverse prism in a tribrach, placed on a survey pillar. In this situation we need to know the prism offset and prism height, so that the REF distance will truly represent the join distance between the instrument station and the REF. Normally it is the second option. It is recommended that you use a pillar as this more stable than a tripod. It is also recommended that you use survey gear to match your total station e.g. Geodimeter Prisms, tribrachs etc to match Geodimeter Total station. If you select this option it will prompt you for the reference prism height and reference prism constant. 2.17.3.3 Delete Group This option allows you to delete a complete group of prisms. Note!! if you use this option you will no longer be able to use this group for monitoring. The prisms in the group will not be deleted from the prism database. 2.17.3.4 Copy Group Copy group function will copy control setup data only. You will need to select the prisms in the group to be monitored. Exercise To Copy an existing Group

Autoslope Manual
June 2009 , Rev.2.50 164
? Select the Group ? Select the Copy Group button ? It will prompt ‘Do you wish to copy group training’, select Yes
? Enter the new group name e.g. New1, select OK
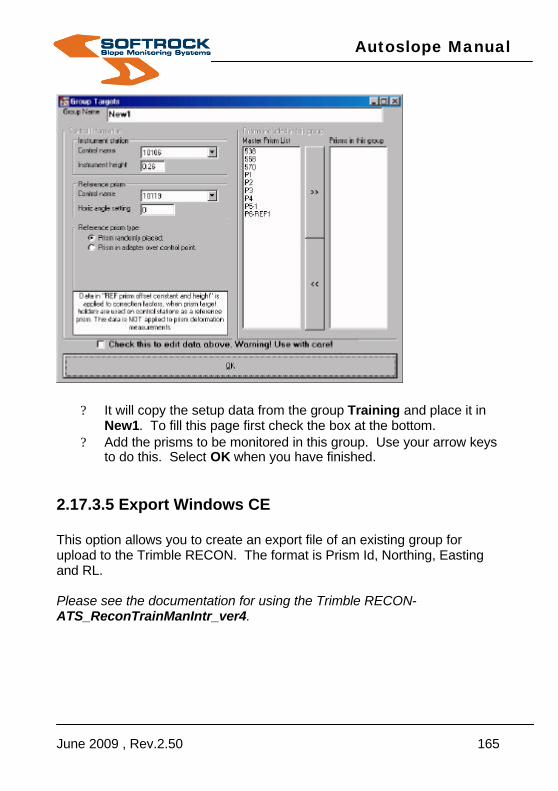
Autoslope Manual
June 2009 , Rev.2.50 165
? It will copy the setup data from the group Training and place it in New1. To fill this page first check the box at the bottom.
? Add the prisms to be monitored in this group. Use your arrow keys to do this. Select OK when you have finished.
2.17.3.5 Export Windows CE This option allows you to create an export file of an existing group for upload to the Trimble RECON. The format is Prism Id, Northing, Easting and RL. Please see the documentation for using the Trimble RECON- ATS_ReconTrainManIntr_ver4.

Autoslope Manual
June 2009 , Rev.2.50 166
Exercise To Export a CE file
? Select your group e.g. North Group ? Select the Export Windows CE button ? The file created is your group name.XYZ ?
? You can save it to whatever directory you like.
? Note the format of the file being Id, Northing, Easting and Elevation.

Autoslope Manual
June 2009 , Rev.2.50 167
Part 5 Additional Information 2.18.0 QuikSlope Please read the QuikSlope manual (or on line help) because this is a full-featured program containing many items that cannot be explained in a quick overview. See "The First User Guide" in the help file.
Normally data is imported manually in QuikSlope and the coordinates are calculated. All calculations in AutoSlope are done "on the fly" and put directly into the QuikSlope database. You should not never have to calculate manually but it can still be done if required. One of the powerful aspects of QuikSlope is being able to re-calculate data. If you update the survey control co-ordinates with a true historic date and co-ordinate, a smoothing of data jump can be achieved by recalculation.
Note: there are two survey databases. There is one in the QuikSlope database and another in AutoSlope. Ensure that the data in AutoSlope is correctly copied in QuikSlope.

Autoslope Manual
June 2009 , Rev.2.50 168
2.19.0 Backing Up Files Make sure that the QuikSlope project database is regularly backed up. Also the AutoLocal.mdb, AutoXYZ.mdb and Delinquent.mdb should be backed up from the programs directory (or wherever it is pointed to) and a copy kept elsewhere. AutoLocal.mdb is the local database used by the ATS. It is where the prism coordinates and groups are stored. In AutoSlope V6, the Database previously called Round2.mdb is now called AutoLocal.mdb. It is exactly the same structure and the old Round2.mdb can be re-named to AutoLocal.mdb.

Autoslope Manual
June 2009 , Rev.2.50 169
2.20.0 Radio Selection The idea here is to give a brief description of each radio. More information can be found in the Telemetry manual.
? Note that the different radio modems quoted below, have to be
used with multiple instruments. ? Note that remote instruments are selected by contacting its
associated slave radio modem. So when requesting that the base radio modem is to talk to a remote radio modem, AutoSlope will activate the command mode of the radio modem. This is usually done by sending “+++”. After the appropriate radio has been connected, the control mode is closed so that normal radio transmit ion can be re-established.
2.20.1.1 Cable This setting is used where a direct RS232 cable is used from a COM port to the instrument. Length of cable could become an issue, as well as the obvious disadvantages to installing cable.

Autoslope Manual
June 2009 , Rev.2.50 170
Some installations can take advantage of the many radio types that work transparently. In other words, some radios can be configured to be used like they are a direct cable. In this instance use the CABLE setting.

Autoslope Manual
June 2009 , Rev.2.50 171
2.20.1.2 RFI595F These radio modems are manufactured by RF Industries. They are in the 465-475mhz range and can be configured for various frequencies, channels, address labels, etc. The output wattage can be configured from 1 to 2 watts. The RFI is configured to use the one channel with the same frequency. So it is good to select a frequency that does
not interfere with other site equipment. Each RFI595F radio in the system has a unique address label. The remote instrument radios (or slave radios) all have a local Rx address of 1 or 2 or 3 or 4 etc. AutoSlope has to configure the base radio to talk to the correct remote radio. It does this by changing the transmit address (Tx address) on the base radio. AutoSlope will send the following commands:
1. “+++” This will stop the base radio from its normal Tx/Rx functions. The radio will be suspended into control mode. The lights on the radio will all flash together at about 1 second intervals. An “OK” should be received from the radio.
2. “VER” will return the version of firmware installed on the radio. 3. “RSSI” will return the level of signal strength. 4. "STORE E79 02” will set the remote address to transmit to. In this
case address 2. This means let us talk to instrument #2. An “OK” should be returned from the radio to confirm a positive re-configuration of the radio.
5. “RES” is sent to reset the radio configuration and end the control mode sequence. Normal transmit ion can now resume.
? Note that the RFI has no means of confirming a connection to the
remote radio. As long as we are transmitting to a remote address of say 3, and the communications to the instrument are showing the expected results, then it can only be the instrument at remote radio #3 that is answering. Some radios (like the Elpro) make a distinct connection to a remote radio. The RFI uses a general

Autoslope Manual
June 2009 , Rev.2.50 172
broadcast, but is only answered by a unique remote address. The result is the same but the technique is a little different.
? Note that in some of our RFI installations, the base radio is actually a RFI9256. This is a broad spectrum 900 mhz radio that works like a direct cable link to the repeater radio. At the repeater, there is a RFI9256 and a RFI595F. These are hard wired together. This RFI595F at the repeater acts the same as the RFI595F as a base as quoted above. So the address selection is actually done at the repeater and not the base.

Autoslope Manual
June 2009 , Rev.2.50 173
2.20.1.3 ELPRO 905U-D These radio modems are manufactured by Elpro. We generally use the Elpro 905U-D radio modem. They are a broad spectrum 900 MHz radio. They have a power output of 1 watt. These are a serial radio.
The Elpro is configured in Controlled Single Connect mode and a common system address for all radios in the system. Each Elpro radio in the system is configured to have a unique unit address. The remote instrument radios (or slave radios) all have a unit address of 1 or 2 or 3 or 4 etc. AutoSlope has to configure the base radio to talk to the correct remote radio. It does this very elegantly by dialling to a particular radio. It uses the “AT” command set that is common for modems. So to connect to slave radio #3, the command is “ATD3”. If we have a repeater radio in the system, we can set a route by sending a command like “ATD 100,3” where 100 is the unit address for a repeater radio along the route. In this way, we can utilize multiple repeaters in the system. AutoSlope will send the following commands:
1. “+++” This will stop the base radio from its normal Tx/Rx functions. The radio will be suspended into control mode. An “OK” should be received from the radio.
2. “ATI” will return the version of firmware installed on the radio. 3. “ATH” will hang up any current connections to any radio. 4. “ATD2” or "ATD100,2” will set the remote address to transmit to. In
this case address 2. This means let us talk to instrument #2 through repeater #100. A “CONNECT” should be returned from the radio to confirm a positive connection to that radio #2. The

Autoslope Manual
June 2009 , Rev.2.50 174
DCD light will alight on the radio to confirm connection. The DCD light will also be on at the connected radio #2. After the “CONNECT” is returned the radio will automatically return to normal transmit mode. If no connection can be made, then a “NO CARRIER” message will be returned by the radio modem.

Autoslope Manual
June 2009 , Rev.2.50 175
2.20.1.4 Elpro 905U-E The Elpro 905U-E is a versatile 900mHz spread spectrum Ethernet radio. This has to be configured with one AP (access point) radiating out to the other radios. The gaetway to the network can be anywhere.
Autoslope Manual
June 2009 , Rev.2.50 176
2.20.1.5 Georadio The Georadio can only be used with the Geodimeter ATS. The ATS originally came with an internal radio and this is the Georadio. Softrock has found that these radios are extremely fussy and do not seem to be able to keep up the steady demand of a 24/7 operation. For that reason we have decided to not support them at all in a serious multi-instrument environment, or any environment for that matter. Each instrument can be configured to have a unique channel number. AutoSlope will send the following commands:
1. “+++” This will stop the base Georadio radio from its normal Tx/Rx functions. The radio will be suspended into control mode.
2. “AT$$C2” will set the channel number to transmit to. In this case channel 2. This means let us talk to instrument #2.
3. “ATH” 4. "AT$$RATS30=4" 5. "ATH0" 6. "AT$$RATK2" 7. "AT$$RATK0" 8. "AT$$RATK1" 9. "AT$$RATK0" 10. "AT$$RATK2" 11. "ATD1". If base radio returns a “0” then there is NO
CONNECTION. If radio returns a “1” then there is a connection.
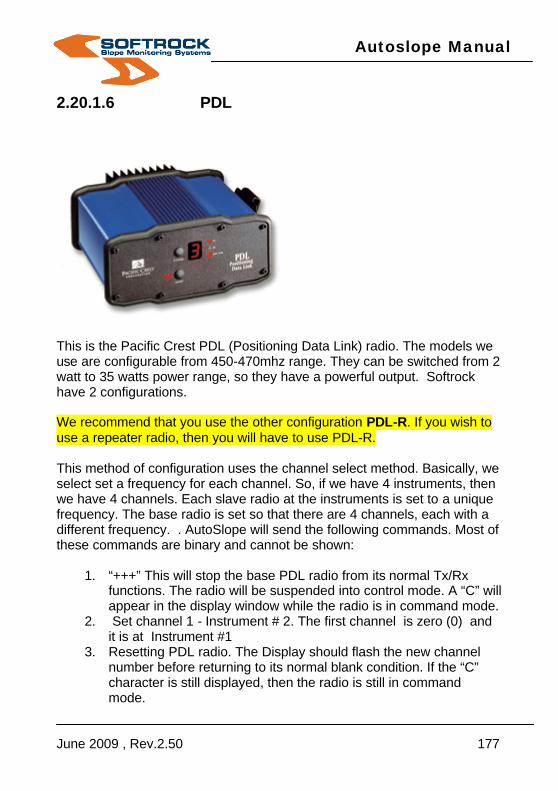
Autoslope Manual
June 2009 , Rev.2.50 177
2.20.1.6 PDL
This is the Pacific Crest PDL (Positioning Data Link) radio. The models we use are configurable from 450-470mhz range. They can be switched from 2 watt to 35 watts power range, so they have a powerful output. Softrock have 2 configurations. We recommend that you use the other configuration PDL-R. If you wish to use a repeater radio, then you will have to use PDL-R. This method of configuration uses the channel select method. Basically, we select set a frequency for each channel. So, if we have 4 instruments, then we have 4 channels. Each slave radio at the instruments is set to a unique frequency. The base radio is set so that there are 4 channels, each with a different frequency. . AutoSlope will send the following commands. Most of these commands are binary and cannot be shown:
1. “+++” This will stop the base PDL radio from its normal Tx/Rx functions. The radio will be suspended into control mode. A “C” will appear in the display window while the radio is in command mode.
2. Set channel 1 - Instrument # 2. The first channel is zero (0) and it is at Instrument #1
3. Resetting PDL radio. The Display should flash the new channel number before returning to its normal blank condition. If the “C” character is still displayed, then the radio is still in command mode.
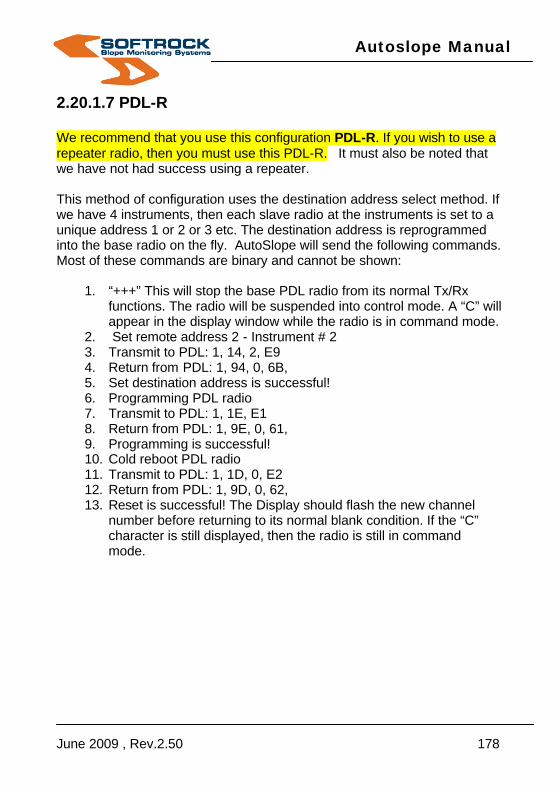
Autoslope Manual
June 2009 , Rev.2.50 178
2.20.1.7 PDL-R We recommend that you use this configuration PDL-R. If you wish to use a repeater radio, then you must use this PDL-R. It must also be noted that we have not had success using a repeater. This method of configuration uses the destination address select method. If we have 4 instruments, then each slave radio at the instruments is set to a unique address 1 or 2 or 3 etc. The destination address is reprogrammed into the base radio on the fly. AutoSlope will send the following commands. Most of these commands are binary and cannot be shown:
1. “+++” This will stop the base PDL radio from its normal Tx/Rx functions. The radio will be suspended into control mode. A “C” will appear in the display window while the radio is in command mode.
2. Set remote address 2 - Instrument # 2 3. Transmit to PDL: 1, 14, 2, E9 4. Return from PDL: 1, 94, 0, 6B, 5. Set destination address is successful! 6. Programming PDL radio 7. Transmit to PDL: 1, 1E, E1 8. Return from PDL: 1, 9E, 0, 61, 9. Programming is successful! 10. Cold reboot PDL radio 11. Transmit to PDL: 1, 1D, 0, E2 12. Return from PDL: 1, 9D, 0, 62, 13. Reset is successful! The Display should flash the new channel
number before returning to its normal blank condition. If the “C” character is still displayed, then the radio is still in command mode.

Autoslope Manual
June 2009 , Rev.2.50 179
2.21.0 Data Grid Editing AutoSlope uses Data Grids to insert data. Most of the AutoSlope options require the user to alter information during the monitoring process.
When you see the asterisk it denotes that you can edit this data grid.
The drop down arrow means you select from the column the data you require.

Autoslope Manual
June 2009 , Rev.2.50 180
The pen symbol denotes that you can insert a line of information.
When no drop down arrow appears, you can place the cursor in the blank grid and key in the information e.g. 1:00:00PM.
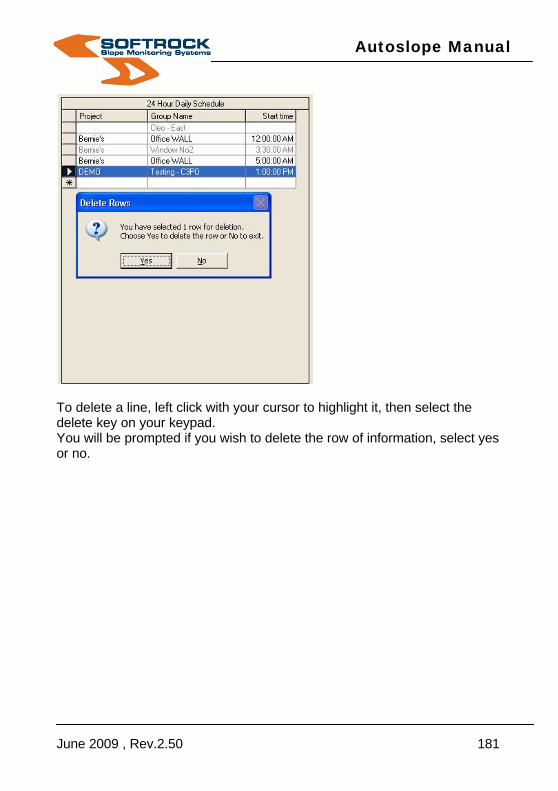
Autoslope Manual
June 2009 , Rev.2.50 181
To delete a line, left click with your cursor to highlight it, then select the delete key on your keypad. You will be prompted if you wish to delete the row of information, select yes or no.

Autoslope Manual
June 2009 , Rev.2.50 182
END