autoradiographic quantification of adrenergic receptors in rat kidney
TRANSCRIPT
Kidney International, Vol. 38 (1990), pp. 39-46
Autoradiographic quantification of adrenergic receptors in ratkidney
THEODORE CALIANOS II and KATHRYN H. MUNTZ
Department of Cell Biology and Neurosciences, University of Texas Southwestern Medical Center, 5323 Harry Hines, Dallas, Texas, USA
Autoradiographic quantification of adrenergic receptors in rat kidney.The adrenergic nervous system is active in kidney function, and thekidney has large numbers of adrenergic receptor subtypes. Because ofthe cellular complexity of the kidney, it is difficult to obtain directassessments of adrenergic receptor binding characteristics over specifictissue compartments. Qualitative autoradiography allows the localiza-tion of adrenergic receptors over tissue types in the kidney, butquantitative autoradiography allows direct comparison of adrenergicreceptor number over different cellular compartments. The purpose ofthis study was to obtain direct assessments of alpha1, alpha2, and betaadrenergic receptor numbers over different tissue compartments of thekidney using quantitative autoradiography. Sections of Sprague-Dawley rat kidney were incubated in several concentrations of 3H-dihydroalprenolol to label beta receptors, 3H-prazosin to label alpha1receptors and 3H-rauwolscine to label the alpha2 receptors. Sections ofrat heart incubated in 3H-dihydroalprenolol were included as standards.The sections were then prepared for receptor autoradiography. Afterprocessing, the grains were then quantified on an image analysissystem, and binding curves constructed from the specific binding. Insome animals, the proximal tubules were stained to localize theproximal convoluted tubules. Significant Scatchard analyses were ob-tained in the glomeruli with dihydroalprenolol (5.18 X l0 receptors!mm3) and with rauwolscine (2.48 x l0 receptors/mm3). SignificantScatchard analyses were obtained in the cortex with rauwolscine (9.47x l0 receptors/mm3) and with prazosin (3.9 x l0). In addition,specific binding was seen with rauwolscine and prazosin to the kidneyarterioles. Qualitative analysis of the alkaline phosphatase activity insections indicated that rauwoiscine and prazosin binding was associatedwith proximal tubules, while dihydroalprenolol binding was associatedwith distal convoluted tubules. Straight tubules approaching the me-dulla were labeled with dihydroalprenolol. These data indicate thatthere are approximately twice the number of beta receptors on theglomeruli as alpha2 receptors, and that the proximal convoluted tubuleshave approximately three times as many alpha2 receptors as alpha1receptors. Alpha1 and alpha2 receptors are localized on arterioles, andbeta receptors are associated with distal convoluted tubules and straighttubular elements in the kidney. These data demonstrate that adrenergicreceptor subtype and number varies considerably among the tissuecompartments of the kidney.
A large body of data suggests that adrenergic stimulationexerts important effects on renal function and extensive datasupports the localization of adrenergic receptors in severalregions of the kidney [reviewed in 1, 2]. Specifically, adrenergic
Received for publication June 6, 1989and in revised form February 5, 1990Accepted for publication February 14, 1990
© 1990 by the International Society of Nephrology
39
activity is known to affect glomerular filtration rate, reninrelease, and proximal tubule sodium reabsorption. Evidencehas implicated the role of adrenergic receptors in glomerularmesangial cell contraction and relaxation [3].
Our previous studies have provided evidence of alpha1 ad-renergic receptor localization [4] and alpha2 receptor localiza-tion [5] in rat kidney. Others have described the localization ofbeta adrenergic receptors in the rat kidney [6, 7]. The purposeof the current investigation was to expand earlier qualitativestudies and examine alpha1, alpha2 and beta adrenergic recep-tors using methods which allow actual quantification of receptornumbers in a given volume of tissue [8]. Quantitative autoradi-ography provides a means of attributing ligand binding tospecific tissue compartments, and thereby may provide a morelucid picture of the physiological importance of renal adrenergicreceptors. Another purpose of this investigation was to localizeadrenergic receptor subtypes in regions of the tubule usinghistochemical identification of proximal convoluted tubules.
Methods
Tissue preparation and autoradiographyTissue was prepared according to our previously described
methods. We had utilized the beta receptor ligand 3H-dihy-droalprenolol (DHA) for autoradiography in dog heart [9]. Wedid additional validation studies in rat kidney sections todetermine that 3H-DHA binding reached equilibrium in thistissue under the conditions utilized for ligand binding. We havepreviously characterized the alpha1 receptor ligand 3H-prazosin[4] and the alpha2 receptor ligand 3H-rauwolscine [5] in rat heartand kidney sections, and utilized those conditions in the presentstudy. All validation studies were performed on kidney sectionsthat had been fixed, frozen and sectioned exactly as describedfor the autoradiography. Tissue sections were incubated in theappropriate ligands, scraped off of the slide and assayed byscintillation spectrometry. To prepare the sections, rat kidneywas removed from Sprague-Dawley rats and lightly fixed with0.1% paraformaldehyde at 0 to 2°C for 20 minutes. The tissuewas then snap frozen in a liquid nitrogen-cooled, Freon 22slurry and stored under liquid nitrogen until use. The tissue wassectioned at a thickness of 10 microns, thaw mounted on gelatinsubbed slides and stored at —20°C until time of incubation.
The incubation conditions were as follows:1) To label the alpha1 receptors, tritiated prazosin, (Sp. Act.80.9 Cilmmol, New England Nuclear, Boston, Massachu-
setts, USA) in concentrations ranging from approximately 0.05
40 Calianos and Muntz: Autoradiography of adrenergic receptors
to 0.6 flM, was utilized. The incubation buffer used was 25 msiglycyiglycine (pH 7.4) and the wash buffer was 50 m Tris HC1(pH 7.4). Phentolamine (l0 M) was used to determine non-specific binding.
2) To label the alpha2 receptors, tritiated rauwoiscine(RAUW) (Sp. Act. = 78.8 Ci!mmol) was utilized in concentra-tions ranging from approximately 0.25 to 3.5 flM. The bufferused for incubation and wash was 50 m potassium phosphate!sodium phosphate at a pH of 7.4. Nonspecific binding wasdetermined using i0 M yohimbine.
3) To label the beta receptors, tritiated dihydroalprenolol(DHA) (Sp. Act. = 103.9 Ci/mmol) was used, in concentrationsranging from 0.5 to 6.0 n. The incubation and wash buffer was170 mM tris HC1, 10 mrn MgCl2 at a pH of 7.4. Nonspecificbinding was determined using l0_6 M propranolol.
Ten micron sections on subbed slides were incubated in theradioligands in the absence (total binding) or presence (nonspe-cific binding) of cold antagonist. The sections were incubatedfor 30 minutes at room temperature, then washed twice in icecold buffer, ten minutes each wash, and then quickly dipped inchilled distilled water and dried with pressurized air. They werethen stored in black plastic slide boxes with desiccant at 2 to4°C until processed for autoradiography.
Coverslips were dipped in Kodak NTB-2 emulsion (EastmanKodak, Rochester, New York, USA) and attached to the slideswith Superglue according to methods similar to those of Youngand Kuhar [101. The autoradiographs were allowed to exposefor a period of seven to eight weeks. Following this, thecoverslips were gently peeled back, and an alligator clip spacerwas inserted between the slide and the coverslip. The autora-diographs were developed, then stained with hematoxylin andeosin. In two of the animals, prior to staining with hematoxylinand eosin, the kidney sections were stained for alkaline phos-phatase, a histochemical marker for proximal convoluted tu-bules in the rat [11]. This was done to obtain a qualitativeassessment of labeling to the convoluted tubules, to comple-ment the quantitative assessment done on the cortical tubulesas subsequently described. The alkaline phosphatase methodutilized is the calcium-cobalt method of Gomori [12]. To stainfor alkaline phosphatase, the kidney autoradiographs wereincubated for 15 minutes in the following mixture: 30 mrvisodium /3-glycerolphosphate, 20 m sodium diethyl barbitu-rate, 78 mrvt CaCI2 and 9 mrvi MgSO4. The slides were rinsed indistilled water and treated with 0.1 M cobaltous acetate for fiveminutes. The slides were rinsed in distilled water and treatedwith 0.1% ammonium sulfide for 30 seconds. The sections werethen stained with hematoxylin and eosin.
Quantification of the autoradiographsThe quantitative analysis of the autoradiographs was com-
pleted on a Nikon Magiscan Image analysis system according toour previously described methods [4]. This system employs agray scale and various image operators that allow for reproduc-ible and systematic autoradiographic grain counting. Ten mi-croscopic fields (5,440 m2 each field) of cortical tubules andten microscopic fields of medullary tubules were randomlyselected and then analyzed. Ten glomeruli were analyzed fromeach section, as well as 10 arterioles (external diameter lessthan 75 tM) analyzed from each section. The image analyzerallows the operator to circle a structure that does not fill the
entire field. The image analyzer will then calculate the area ofthe feature of interest, the number of grains over the feature andthen normalize the grains to total field area. Grain counts in the10 different fields were then averaged and nonspecific bindingsubtracted from total binding in order to obtain specific receptorbinding for each structure and at each concentration of ligand.
Radioactive standardsWith each set of autoradiographs prepared, a set of standards
was included to provide a basis for converting grain counts toabsolute fmoles of ligand bound. This was accomplished ac-cording to our previously described methods in dog [8] asmodified for rat. The right ventricular wall was removed fromtransverse slices of rat heart and the block frozen as previouslydescribed. Sections of rat myocardium were incubated withtritiated DHA (0.5 to 10 nM) in the presence and absence ofpropranolol under the same conditions outlined previously forDHA incubations. The myocardium was utilized instead of thekidney, because DHA produces a random distribution of grainsthroughout the left ventricle and septum.
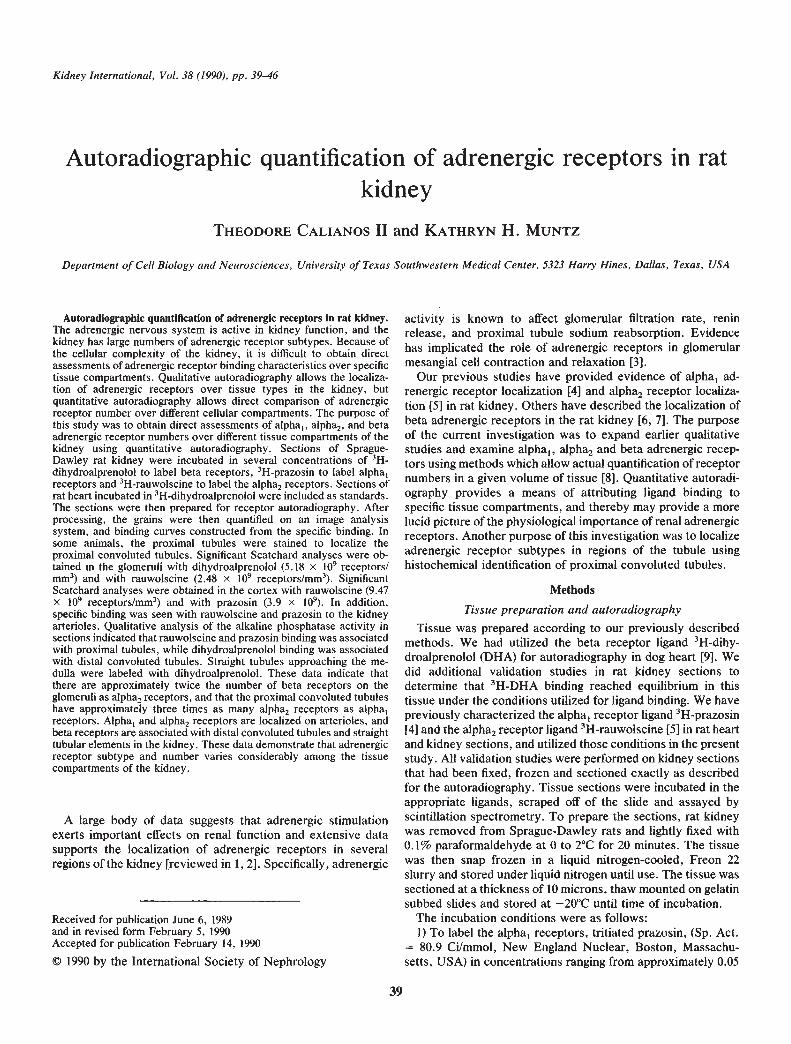
After incubation in the DHA, some of the slides wereprocessed for quantitative autoradiography, and some of theslides were scraped and assayed by scintillation spectrometryto determine radioactivity bound to each section. Grain countswere determined on ten randomly-selected fields on the section.Total section area was then determined utilizing the imageanalyzer. By knowing the number of grains counted, and thearea of tissue that the grains were counted in, and by knowingtotal section area, total grain number on the entire section couldbe estimated. Total grains on the section were then plottedagainst cpm in the section to obtain a standard curve for eachset of autoradiographs, as shown in Figure 1. Using the datafrom the standards, it was possible to take grain measurementsover specific tissue compartments and correlate them to countsper minute. Using the specific activity of the ligand and theefficiency of the scintillation counter (45%), the counts perminute were converted to fmole quantities. Subsequently,
12.0
11.0
10.0
9.0
8.0
7.0
6.0
5.0
4.0
3.0
2.0
1.0
a,
1)
II0E
U-
1000
800
a05 600a)
{0a)
4000
200
0
Fig. 1. This figure is an example of a standard curve utilized in thisstudy, with grains x 1O"Islice (X axis) plotted against counts perminute/slice (Y axis, left). Using the specific activity of the ligand andthe efficiency of the counter, cpm can be converted to fmole dihydroal-prenolol/slice (Y axis, right).
0 5 10 15 20
Grains x 106/tissue slice
/.
I'
Scatchard analysis was performed on the average specificbinding obtained from the four to five animals utilized for thestudy.
The Scatchard plots were then subjected to linear regressionanalysis and significance testing. A P value of less than 0.05 wasconsidered significant. All data are expressed as the mean the
standard error of the mean.
Results
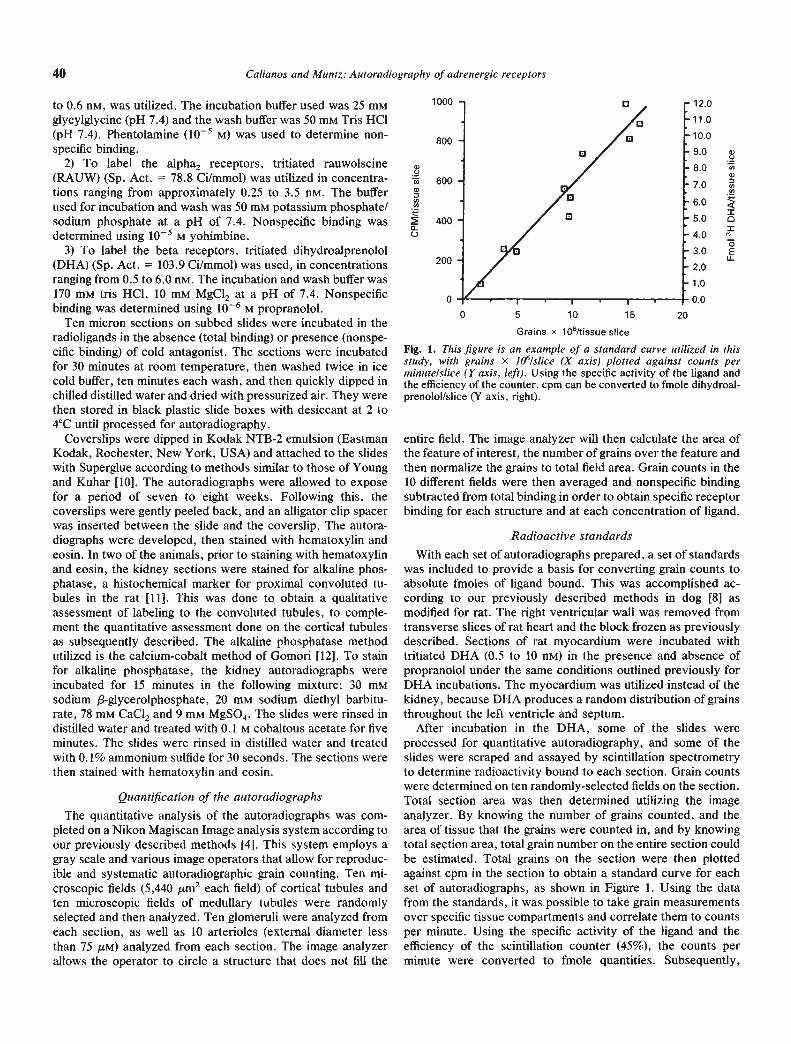
Several regions in the kidney had specific binding. The rawdata obtained from the image analysis system are shown inTable 1. Shown in the table are the cortical tubules labeled withrauwoiscine, prazosin and dihydroalprenolol, the glomerulilabeled with DHA and rauwolscine, and the tubules in themedulla labeled with rauwolscine. In addition, the renal arteri-oles were specifically labeled with rauwolscine and prazosin.When grain counts were converted to fmoles ligand and the datasubjected to Scatchard analyses, significant linear regressions
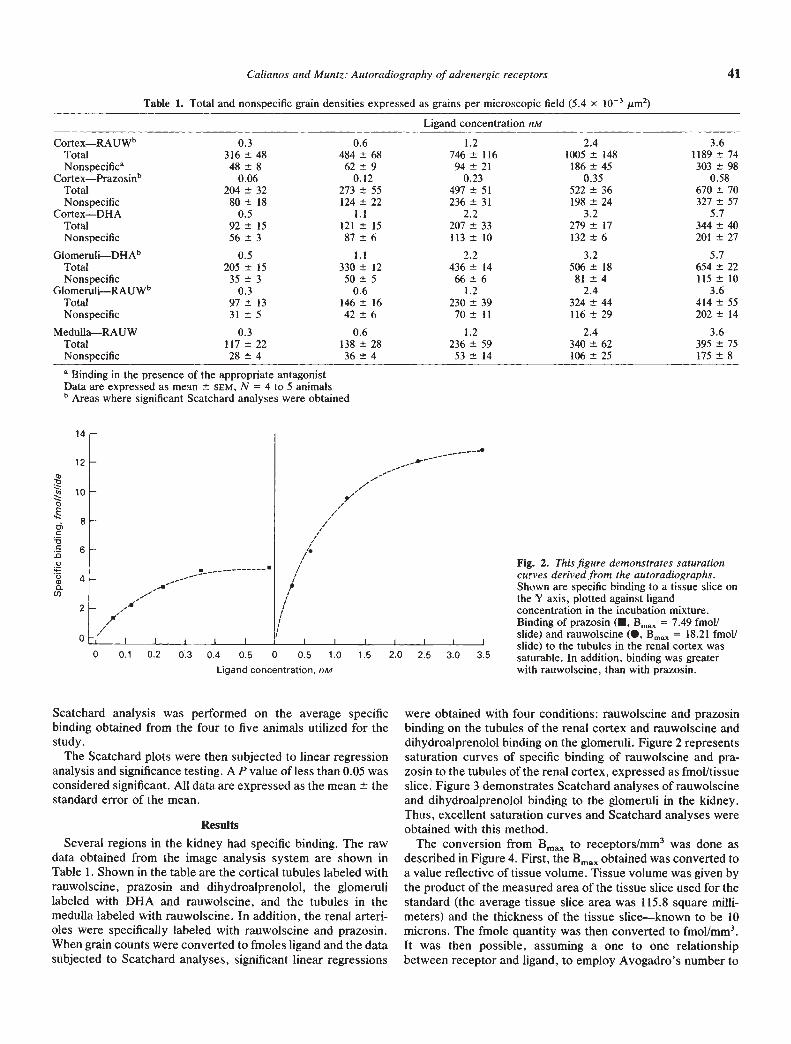
were obtained with four conditions: rauwoiscine and prazosinbinding on the tubules of the renal cortex and rauwolscine anddihydroalprenolol binding on the glomeruli. Figure 2 representssaturation curves of specific binding of rauwolscine and pra-zosin to the tubules of the renal cortex, expressed as fmolltissueslice. Figure 3 demonstrates Scatchard analyses of rauwolscineand dihydroalprenolol binding to the glomeruli in the kidney.Thus, excellent saturation curves and Scatchard analyses wereobtained with this method.
The conversion from Bmax to receptors/mm3 was done asdescribed in Figure 4. First, the Bmax obtained was converted toa value reflective of tissue volume. Tissue volume was given bythe product of the measured area of the tissue slice used for thestandard (the average tissue slice area was 115.8 square milli-meters) and the thickness of the tissue slice—known to be 10microns. The fmole quantity was then converted to fmol/mm3.It was then possible, assuming a one to one relationshipbetween receptor and ligand, to employ Avogadro's number to
Calianos and Munrz: Autoradiography of adrenergic receptors 41
Table 1. Total and nonspecific grain densities expressed as grains per microscopic field (5.4 X i0 sm2)
Ligand concentration n
Cortex—RAUW1' 0.3 0.6 1.2 2.4 3.6
Total 316 48 484 68 746 116 1005 148 1189 74Nonspecifica
Cortex_Prazosinb48 8
0.0662 9
0.1294 210.23
186 450.35
303 980.58
Total 204 32 273 55 497 51 522 36 670 70Nonspecific 80 18 124 22 236 31 198 24 327 57
Cortex—DHA 0.5 1.1 2.2 3.2 5.7
Total 92 15 121 15 207 33 279 17 344 40Nonspecific 56 3 87 6 113 10 132 6 201 27
Glomeruli—DHA1' 0.5 1.1 2.2 3.2 5.7
Total 205 15 330 12 436 14 506 18 654 22Nonspecific 35 3 50 5 66 6 81 4 115 10
Glomeruli—RAUW" 0.3 0.6 1.2 2.4 3.6Total 97 13 146 16 230 39 324 44 414 55Nonspecific 31 5 42 6 70 11 116 29 202 14
Medulla—RAUW 0.3 0.6 1.2 2.4 3.6
Total 117 22 138 28 236 59 340 62 395 75Nonspecific 28 4 36 4 53 14 106 25 175 8
a Binding in the presence of the appropriate antagonistData are expressed as mean SEM, N 4 to S animalsb Areas where significant Scatchard analyses were obtained
14 -
12 -
10 -
C)C
C
0C)4,C.U,
8
6
4
2
0
U
——U—
-
r
Fig. 2. This figure demonstrates saturationcurves derived from the autoradiographs.Shown are specific binding to a tissue slice on
the Y axis, plotted against ligandconcentration in the incubation mixture.Binding of prazosin (•, Bmax = 7.49 fIflOII
slide) and rauwolscine (S. Bmax = 18.21 fmollI I I
slide) to the tubules in the renal cortex was2.5 3.0 35 saturable. In addition, binding was greater
with rauwolscine, than with prazosin.0 0.1 0.2 0.3 0.4 0.5 0 0.5 1.0 1.5 2.0
Ligand concentration, nM
42 Calianos and Muntz: Autoradiography of adrenergic receptors
U-
5
4
3
2
0
Bound, fmo//s/ide
Fig. 3. These figures are Scatchard plots of specflc rauwolscine (0)and dihydroalprenolol (•) binding to the glomeruli. The Scatchardplots were linear, and demonstrate that binding was greater withdihydroalprenolol than with rauwoiscine.
Bma, (tmol)
Tissue volume(measured area x thickness)
= fmol/mm3
Assuming a one to one relationship between receptor and ligand, it is possibleto employ Avogadro's number to calculate receptor density
_______ mollmm3 — Receptors/mm36.023 x 1023 —
Table 2. Dissociation constants and receptor density incompartments of the kidney
ReceptorKDnM
densityreceptors/mm3
GlomeruliRauwolscine 2.13 2.48 x l0Dihydroalprenolol 1.96 5.18 x l0
CortexRauwolscine 1.23 9.47 x 1OPrazosin 0.23 3.90 X iO
generate a value for receptor density for volume of tissue. Theresults of these conversions are outlined in Table 2, along withthe dissociation constant for each ligand. These results demon-strated that the tubules in the renal cortex had 2.5 times asmany alpha2 as alpha1 receptors, and that the glomeruli hadapproximately twice as many beta receptors as alpha2 recep-tors.
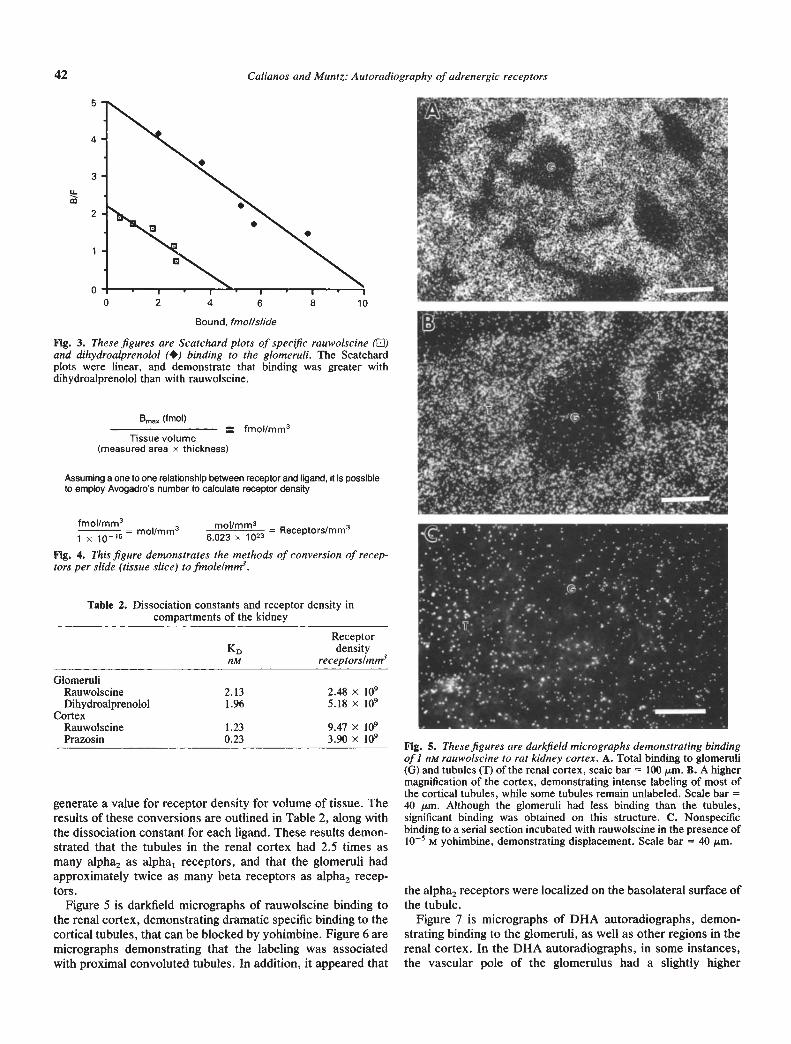
Figure 5 is darkfield micrographs of rauwoiscine binding tothe renal cortex, demonstrating dramatic specific binding to thecortical tubules, that can be blocked by yohimbine. Figure 6 aremicrographs demonstrating that the labeling was associatedwith proximal convoluted tubules. In addition, it appeared that
Fig. 5. These figures are darkfield micrographs demonstrating bindingof I nM rauwolscine to rat kidney cortex. A. Total binding to glomeruli(0) and tubules (T) of the renal cortex, scale bar = 100 jsm. B. A highermagnification of the cortex, demonstrating intense labeling of most ofthe cortical tubules, while some tubules remain unlabeled. Scale bar =40 m. Although the glomeruli had less binding than the tubules,significant binding was obtained on this structure. C. Nonspecificbinding to a serial section incubated with rauwolscine in the presence ofiO M yohimbine, demonstrating displacement. Scale bar = 40 m.
the alpha2 receptors were localized on the basolateral surface ofthe tubule.
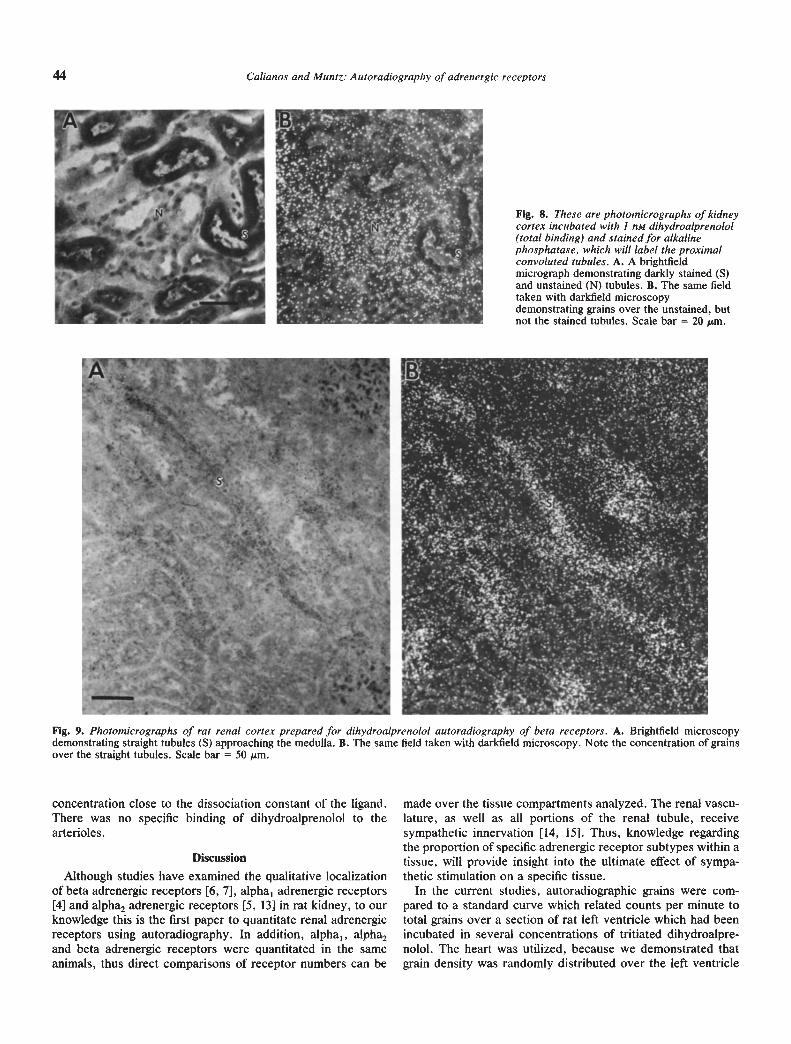
Figure 7 is micrographs of DHA autoradiographs, demon-strating binding to the glomeruli, as well as other regions in therenal cortex. In the DHA autoradiographs, in some instances,the vascular pole of the glomerulus had a slightly higher
.
4 6 8 10
fmol/mm3_______ — mol/mm31 x iO15
Fig. 4. This figure demonstrates the methods of conversion of recep-lors per slide (tissue slice) to fmole/mm3.
,..:'-I.; r' a
Calianos and Muntz: Autoradiography of adrenergic receptors 43
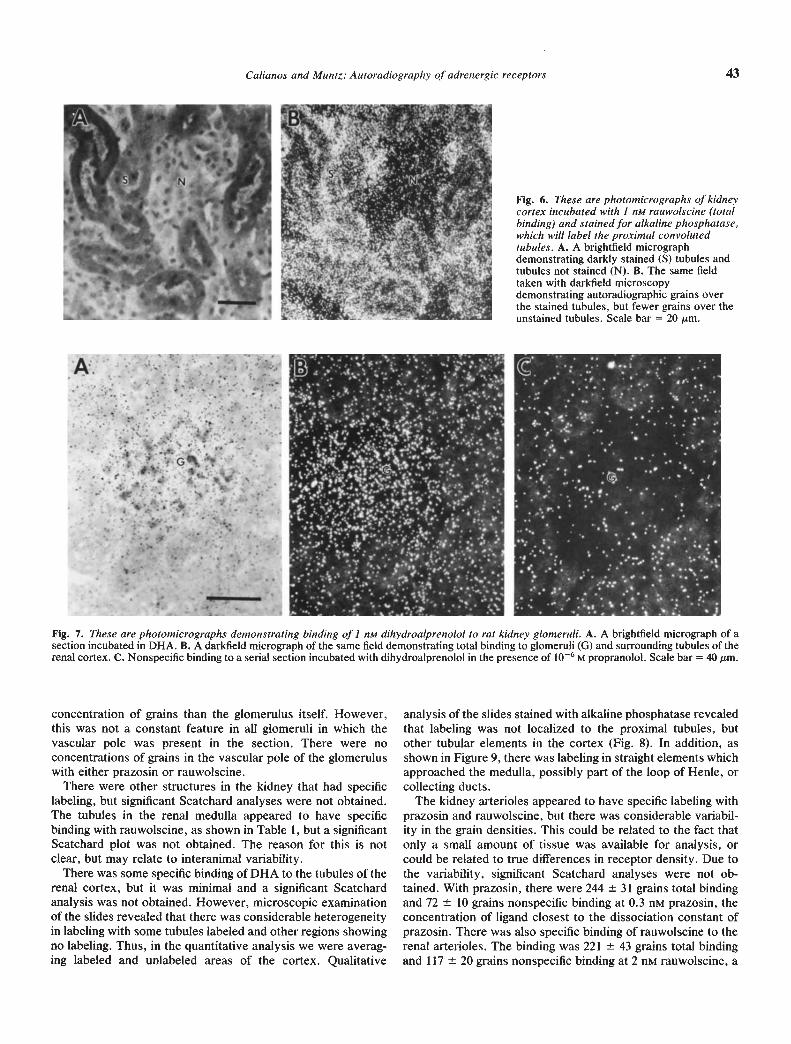
Fig. 6. These are photomicrographs of kidneycortex incubated with I mu rauwolscine (totalbinding) and stained for alkaline phosphatase,which will label the proximal convolutedtubules. A. A brightfield micrographdemonstrating darkly stained (S) tubules andtubules not stained (N). B. The same fieldtaken with darkfield microscopydemonstrating autoradiographic grains overthe stained tubules, but fewer grains over theunstained tubules. Scale bar = 20 m.
Fig. 7. These are photornicro graphs demonstrating binding of I mu dihydroalprenolol to rat kidney glomeruli. A. A brightfield micrograph of asection incubated in DHA. B. A darkfIeld micrograph of the same field demonstrating total binding to glomeruli (G) and surrounding tubules of therenal cortex. C. Nonspecific binding to a serial section incubated with dihydroalprenolol in the presence of 106 M propranolol. Scale bar 40 m.
concentration of grains than the glomerulus itself. However,this was not a constant feature in all glomeruli in which thevascular pole was present in the section. There were noconcentrations of grains in the vascular pole of the glomeruluswith either prazosin or rauwoiscine.
There were other structures in the kidney that had specificlabeling, but significant Scatchard analyses were not obtained.The tubules in the renal medulla appeared to have specificbinding with rauwolscine, as shown in Table 1, but a significantScatchard plot was not obtained. The reason for this is notclear, but may relate to interanimal variability.
There was some specific binding of DHA to the tubules of therenal cortex, but it was minimal and a significant Scatchardanalysis was not obtained. However, microscopic examinationof the slides revealed that there was considerable heterogeneityin labeling with some tubules labeled and other regions showingno labeling. Thus, in the quantitative analysis we were averag-ing labeled and unlabeled areas of the cortex. Qualitative
analysis of the slides stained with alkaline phosphatase revealedthat labeling was not localized to the proximal tubules, butother tubular elements in the cortex (Fig. 8). In addition, asshown in Figure 9, there was labeling in straight elements whichapproached the medulla, possibly part of the ioop of Henle, orcollecting ducts.
The kidney arterioles appeared to have specific labeling withprazosin and rauwoiscine, but there was considerable variabil-ity in the grain densities. This could be related to the fact thatonly a small amount of tissue was available for analysis, orcould be related to true differences in receptor density. Due tothe variability, significant Scatchard analyses were not ob-tained. With prazosin, there were 244 31 grains total bindingand 72 10 grains nonspecific binding at 0.3 nM prazosin, theconcentration of ligand closest to the dissociation constant ofprazosin. There was also specific binding of rauwoiscine to therenal arterioles. The binding was 221 43 grains total bindingand 117 20 grains nonspecific binding at 2 n rauwoiscine, a
—I
a'
1
';t"c't;
rr .....I . . S.
p..
•1••.
.
44 Calianos and Muntz: Au:oradiography of adrenergic receptors
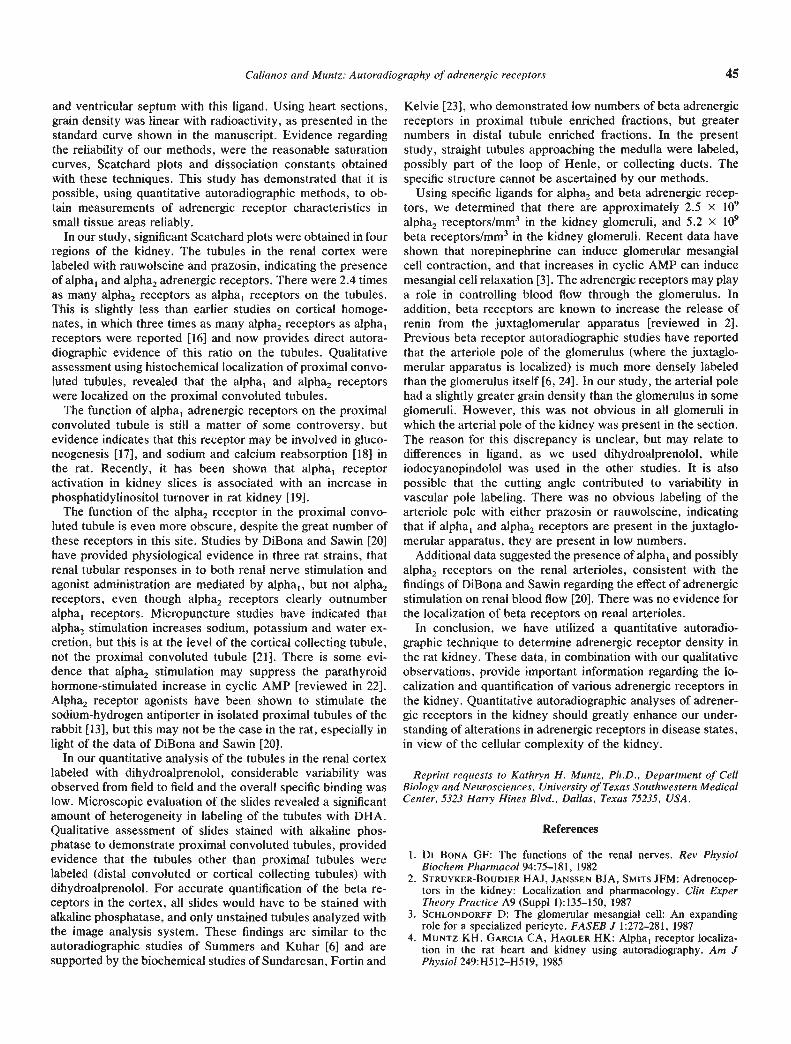
Fig. 8. These are photomicrographs of kidneycortex incubated with 1 nM dihydroalprenolol(total binding) and stained for alkalinephosphatase, which will label the proximalconvoluted tubules. A. A brightfieldmicrograph demonstrating darkly stained (S)and unstained (N) tubules. B. The same fieldtaken with darkfield microscopydemonstrating grains over the unstained, butnot the stained tubules. Scale bar = 20 m.
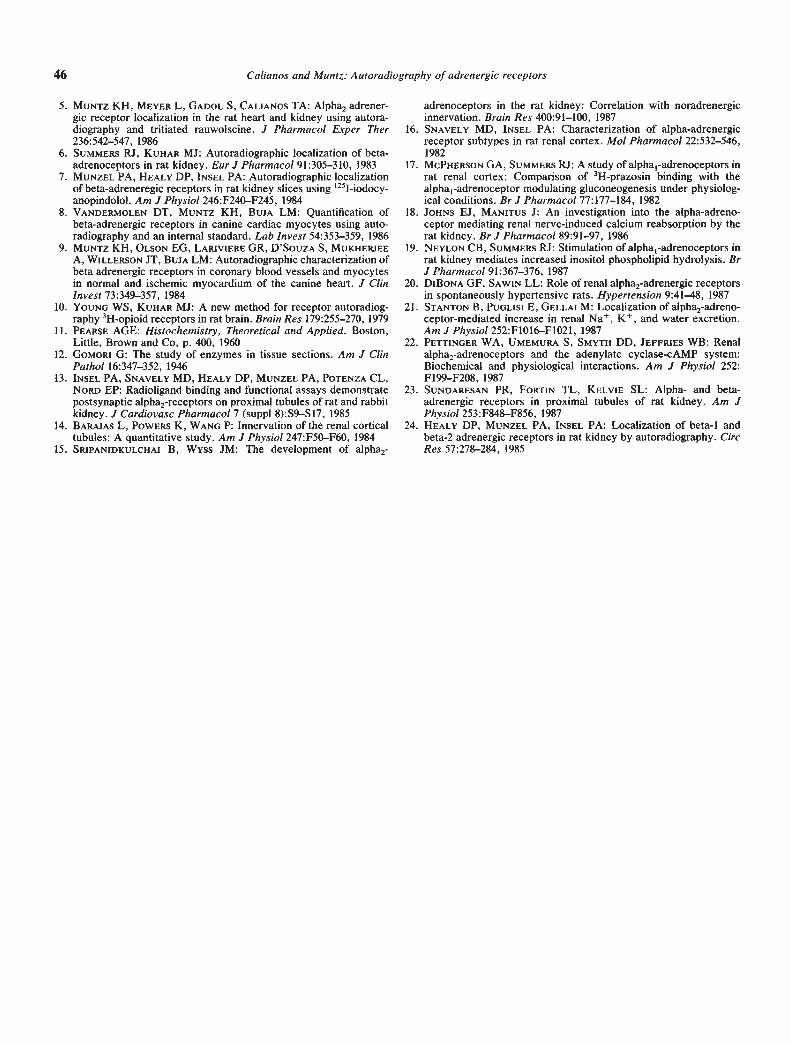
Fig. 9. Photomicrographs of rat renal cortex prepared for dihydroalprenolol autoradiography of beta receptors. A. Brightfield microscopydemonstrating straight tubules (S) approaching the medulla. B. The same field taken with darkfield microscopy. Note the concentration of grainsover the straight tubules. Scale bar = 50 m.
concentration close to the dissociation constant of the ligand.There was no specific binding of dihydroalprenolol to thearterioles.
Discussion
Although studies have examined the qualitative localizationof beta adrenergic receptors [6, 7], alpha1 adrenergic receptors[4] and alpha2 adrenergic receptors [5, 13] in rat kidney, to ourknowledge this is the first paper to quantitate renal adrenergicreceptors using autoradiography. In addition, alpha1, alpha2and beta adrenergic receptors were quantitated in the same
made over the tissue compartments analyzed. The renal vascu-lature, as well as all portions of the renal tubule, receivesympathetic innervation [14, 15]. Thus, knowledge regardingthe proportion of specific adrenergic receptor subtypes within atissue, will provide insight into the ultimate effect of sympa-thetic stimulation on a specific tissue.
In the current studies, autoradiographic grains were com-pared to a standard curve which related counts per minute tototal grains over a section of rat left ventricle which had beenincubated in several concentrations of tritiated dihydroalpre-nolol. The heart was utilized, because we demonstrated that
animals, thus direct comparisons of receptor numbers can be grain density was randomly distributed over the left ventricle
-r
.4
'I
Calianos and Muntz: Autoradiography of adrenergic receptors 45
and ventricular septum with this ligand. Using heart sections,grain density was linear with radioactivity, as presented in thestandard curve shown in the manuscript. Evidence regardingthe reliability of our methods, were the reasonable saturationcurves, Scatchard plots and dissociation constants obtainedwith these techniques. This study has demonstrated that it ispossible, using quantitative autoradiographic methods, to ob-tain measurements of adrenergic receptor characteristics insmall tissue areas reliably.
In our study, significant Scatchard plots were obtained in fourregions of the kidney. The tubules in the renal cortex werelabeled with rauwoiscine and prazosin, indicating the presenceof alpha1 and alpha2 adrenergic receptors. There were 2.4 timesas many alpha2 receptors as alpha1 receptors on the tubules.This is slightly less than earlier studies on cortical homoge-nates, in which three times as many alpha2 receptors as alpha,receptors were reported [16] and now provides direct autora-diographic evidence of this ratio on the tubules. Qualitativeassessment using histochemical localization of proximal convo-luted tubules, revealed that the alpha, and alpha2 receptorswere localized on the proximal convoluted tubules.
The function of alpha1 adrenergic receptors on the proximalconvoluted tubule is still a matter of some controversy, butevidence indicates that this receptor may be involved in gluco-neogenesis [17], and sodium and calcium reabsorption [181 inthe rat. Recently, it has been shown that alpha, receptoractivation in kidney slices is associated with an increase inphosphatidylinositol turnover in rat kidney [19].
The function of the alpha2 receptor in the proximal convo-luted tubule is even more obscure, despite the great number ofthese receptors in this site. Studies by DiBona and Sawin [20]have provided physiological evidence in three rat strains, thatrenal tubular responses in to both renal nerve stimulation andagonist administration are mediated by alpha,, but not alpha2receptors, even though alpha2 receptors clearly outnumberalpha1 receptors. Micropuncture studies have indicated thatalpha2 stimulation increases sodium, potassium and water ex-cretion, but this is at the level of the cortical collecting tubule,not the proximal convoluted tubule [21]. There is some evi-dence that alpha2 stimulation may suppress the parathyroidhormone-stimulated increase in cyclic AMP [reviewed in 22].Alpha2 receptor agonists have been shown to stimulate thesodium-hydrogen antiporter in isolated proximal tubules of therabbit [13], but this may not be the case in the rat, especially inlight of the data of DiBona and Sawin [20].
In our quantitative analysis of the tubules in the renal cortexlabeled with dihydroalprenolol, considerable variability wasobserved from field to field and the overall specific binding waslow. Microscopic evaluation of the slides revealed a significantamount of heterogeneity in labeling of the tubules with DHA.Qualitative assessment of slides stained with alkaline phos-phatase to demonstrate proximal convoluted tubules, providedevidence that the tubules other than proximal tubules werelabeled (distal convoluted or cortical collecting tubules) withdihydroalprenolol. For accurate quantification of the beta re-ceptors in the cortex, all slides would have to be stained withalkaline phosphatase, and only unstained tubules analyzed withthe image analysis system. These findings are similar to theautoradiographic studies of Summers and Kuhar [6] and aresupported by the biochemical studies of Sundaresan, Fortin and
Kelvie [23], who demonstrated low numbers of beta adrenergicreceptors in proximal tubule enriched fractions, but greaternumbers in distal tubule enriched fractions. In the presentstudy, straight tubules approaching the medulla were labeled,possibly part of the loop of Henle, or collecting ducts. Thespecific structure cannot be ascertained by our methods.
Using specific ligands for alpha2 and beta adrenergic recep-tors, we determined that there are approximately 2.5 x i09alpha2 receptors/mm3 in the kidney glomeruli, and 5.2 X l0beta receptors/mm3 in the kidney glomeruli. Recent data haveshown that norepinephrine can induce glomerular mesangialcell contraction, and that increases in cyclic AMP can inducemesangial cell relaxation [3]. The adrenergic receptors may playa role in controlling blood flow through the glomerulus. Inaddition, beta receptors are known to increase the release ofrenin from the juxtaglomerular apparatus [reviewed in 2].Previous beta receptor autoradiographic studies have reportedthat the arteriole pole of the glomerulus (where the juxtaglo-merular apparatus is localized) is much more densely labeledthan the glomerulus itself [6, 24]. In our study, the arterial polehad a slightly greater grain density than the glomerulus in someglomeruli. However, this was not obvious in all glomeruli inwhich the arterial pole of the kidney was present in the section.The reason for this discrepancy is unclear, but may relate todifferences in ligand, as we used dihydroalprenolol, whileiodocyanopindolol was used in the other studies. It is alsopossible that the cutting angle contributed to variability invascular pole labeling. There was no obvious labeling of thearteriole pole with either prazosin or rauwolscine, indicatingthat if alpha1 and alpha2 receptors are present in the juxtaglo-merular apparatus, they are present in low numbers.
Additional data suggested the presence of alpha1 and possiblyalpha2 receptors on the renal arterioles, consistent with thefindings of DiBona and Sawin regarding the effect of adrenergicstimulation on renal blood flow [20]. There was no evidence forthe localization of beta receptors on renal arterioles.
In conclusion, we have utilized a quantitative autoradio-graphic technique to determine adrenergic receptor density inthe rat kidney. These data, in combination with our qualitativeobservations, provide important information regarding the lo-calization and quantification of various adrenergic receptors inthe kidney. Quantitative autoradiographic analyses of adrener-gic receptors in the kidney should greatly enhance our under-standing of alterations in adrenergic receptors in disease states,in view of the cellular complexity of the kidney.
Reprint requests to Kathryn H. Muntz, Ph.D., Department of CellBiology and Neurosciences, University of Texas Southwestern MedicalCenter, 5323 Han-v Hines Blvd., Dallas, Texas 75235, USA.
References
1. Di BONA GF: The functions of the renal nerves. Rev PhysiolBioche,n Pharmacol 94:75—18 1, 1982
2. STRUYKER-BOUDIER HAJ, JAN5sEN BJA, SMITS JFM: Adrenocep-tors in the kidney: Localization and pharmacology. Clin ExperTheory Practice A9 (Suppl 1): 135—150, 1987
3. SCHLONDORFF D: The glomerular mesangial cell: An expandingrole for a specialized pericyte. FASEB J 1:272—281, 1987
4. MUNTz KH, GARCIA CA, HAGLER HK: Alpha1 receptor localiza-tion in the rat heart and kidney using autoradiography. Am JPhysiol 249:H5l2—H519, 1985
46 Calianos and Muntz: Autoradiography of adrenergic receptors
5. MUNTZ KH, MEYER L, GADOL S, CALIANOS TA: Alpha2 adrener-gic receptor localization in the rat heart and kidney using autora-diography and tritiated rauwoiscine. J Pharmacol Exper Ther236:542—547, 1986
6. SUMMERS RJ, KUHAR MJ: Autoradiographic localization of beta-adrenoceptors in rat kidney. Eur J Pharmacol 91:305—310, 1983
7. MUNZEL PA, HEALY DP, INSEL PA: Autoradiographic localizationof beta-adreneregic receptors in rat kidney slices using '251-iodocy-anopindolol. Am J Physiol 246:F240—F245, 1984
8. VANDERM0LEN DT, MUNTZ KH, BUJA LM: Quantification ofbeta-adrenergic receptors in canine cardiac myocytes using auto-radiography and an internal standard. Lab Invest 54:353—359, 1986
9. MUNTZ KH, OLSON EG, LARIVIERE OR, D'SOUZA S, MUKHERJEEA, WILLERSON iT, BUJA LM: Autoradiographic characterization ofbeta adrenergic receptors in coronary blood vessels and myocytesin normal and ischemic myocardium of the canine heart. J GunInvest 73:349—357, 1984
10. YOUNG WS, KUHAR MJ: A new method for receptor autoradiog-raphy 3H-opioid receptors in rat brain. Brain Res 179:255—270, 1979
11. PEARSE AGE: Histochemistry, Theoretical and Applied. Boston,Little, Brown and Co, p. 400, 1960
12. GoMolu G: The study of enzymes in tissue sections. Am J C/inPathol 16:347—352, 1946
13. INSEL PA, SNAVELY MD, HEALY DP, MUNZEL PA, POTENZA CL,NORD EP: Radioligand binding and functional assays demonstratepostsynaptic alpha2-receptors on proximal tubules of rat and rabbitkidney. J Cardiovasc Pharmacol 7 (suppl 8):S9—S17, 1985
14. BARAJAS L, POWERS K, WANG P: Innervation of the renal corticaltubules: A quantitative study. Am J Physiol 247:F50—F60, 1984
15. SRIPANIDKULCHAI B, WYss JM: The development of alpha2-
adrenoceptors in the rat kidney: Correlation with noradrenergicinnervation. Brain Res 400:91—100, 1987
16. SNAVELY MD, INsEL PA: Characterization of alpha-adrenergicreceptor subtypes in rat renal cortex. Mol Pharmacol 22:532—546,1982
17. MCPHERSON GA, SUMMERS RJ: A study of alpha1-adrenoceptors inrat renal cortex: Comparison of 3H-prazosin binding with thealpha,-adrenoceptor modulating gluconeogenesis under physiolog-ical conditions. Br J Pharmacol 77:177—184, 1982
18. JOHNS EJ, MANITUS J: An investigation into the alpha-adreno-ceptor mediating renal nerve-induced calcium reabsorption by therat kidney. Br J Pharmacol 89:91—97, 1986
19. NEYLON CB, SUMMERS RJ: Stimulation of alpha1-adrenoceptors inrat kidney mediates increased inositol phospholipid hydrolysis. BrJ Pharmacol 91:367—376, 1987
20. DIBONA GF, SAWIN LL: Role of renal alpha2-adrenergic receptorsin spontaneously hypertensive rats. Hypertension 9:41—48, 1987
21. STANTON B, PUGLISI E, GELLAI M: Localization of alpha2-adreno-ceptor-mediated increase in renal Na, K, and water excretion.Am J Physiol 252:F1016—F1021, 1987
22. PETTINGER WA, UMEMURA S, SMYTH DD, JEFFRIES WB: Renalalpha2-adrenoceptors and the adenylate cyclase-cAMP system:Biochemical and physiological interactions. Am J Physiol 252:F199—F208, 1987
23. SUNDARESAN PR, FORTIN TL, KELVIE SL: Alpha- and beta-adrenergic receptors in proximal tubules of rat kidney. Am JPhysiol 253:F848—F856, 1987
24. HEALY DP, MUNZEL PA, IN5EL PA: Localization of beta-I andbeta-2 adrenergic receptors in rat kidney by autoradiography. CircRes 57:278—284, 1985