autonomy incubator seminar series: unmanned aircraft design, development and applications at...
TRANSCRIPT

Unmanned aircraft design, development and applications at the Unmanned Systems Lab
1
Kevin Kochersberger Mechanical Engineering
[email protected] 540-231-5589

Outline
Lab overview
Morphing wing aircraft
Precision agriculture
Image-based 3D reconstruction
Theory
Applications
Robotic collection
IED-detect and path planning
Terrain feature mapping and classification
Organic VTOL disaster response
2

Brief overview of the lab
The Lab consists of a 3,000 sq. ft. of high bay area, graduate student office space, and mechanical and electrical shop resources
8 graduate students 30 undergraduates 1 lab technician
3

The Unmanned Systems Lab
The Lab’s focus is in autonomous aircraft Sensing payloads carried by fixed and rotary wing aircraft that weigh 1 – 90 kg Novel aircraft design Novel control strategies
4

Wing morphing is based on piezoelectric actuator technology
Macro Fiber Composite (MFC) actuators show large strains compared to competitive piezoelectric actuators
Maximum Strain-Stress Outputs from several active materials. [Williams]
Note that these operate at high voltages ~ 1500 V
5
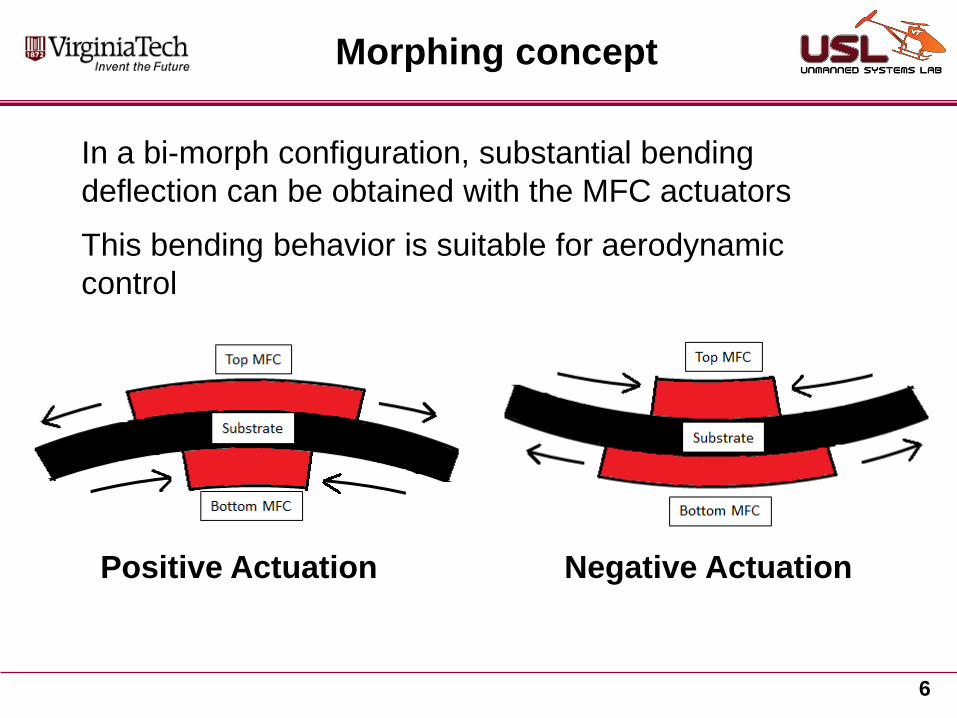
Morphing concept
In a bi-morph configuration, substantial bending deflection can be obtained with the MFC actuators
This bending behavior is suitable for aerodynamic control
Positive Actuation Negative Actuation
6

The original morphing aircraft design proved the concept
The 2007 aircraft design was originally created to explore both pitch and roll control using MFC technology
Goal was to achieve high efficiency and high bandwidth
It flew, but barely!
7

A study was conducted to determine better morphing configurations
2-D wind tunnel testing was conducted on a variety of morphing configurations to find an optimal design
One thick wing design is a thin morphing surface with a bottom wiper that maintains contact with the top surface
8

Top and bottom bimorphs (4 actuators) allow a CL range > 1.2
9

2-D wind tunnel results: higher delta CL and lower drag with morphing
10

Hysteresis Modeling
Inverse Hysteresis Operator (IHOp) used to provide feed-forward control for MFC operation
It basically curve fits the forward and backward linear functions to compensate for MFC behavior
Without IHOp the pilot has a difficult time controlling the aircraft
Command
11

High voltage conversion
Custom electronics used to power the MFC actuators were developed via a Phase II SBIR with AVID LLC
The high-voltage system is designed to power 2 bi-morphs
Command
IHOp compensation
2-bimorph HV converter
12

Full wing morphing
UAV applications in targeting can benefit from high bandwidth, agile handling
Servo driven ailerons lack reliability and can be difficult to integrate into a thin wing
What if we could simultaneously achieve camber change and a delta angle of attack to achieve higher roll rates?
13
Conventional controls Wing morphing achieved with piezoceramic actuators

Full wing morphing
Entire wing planform morphs instead of discrete control surfaces Simulations in FEA performed to determine best configurations Performance confirmed in flight test with roll doublets
14
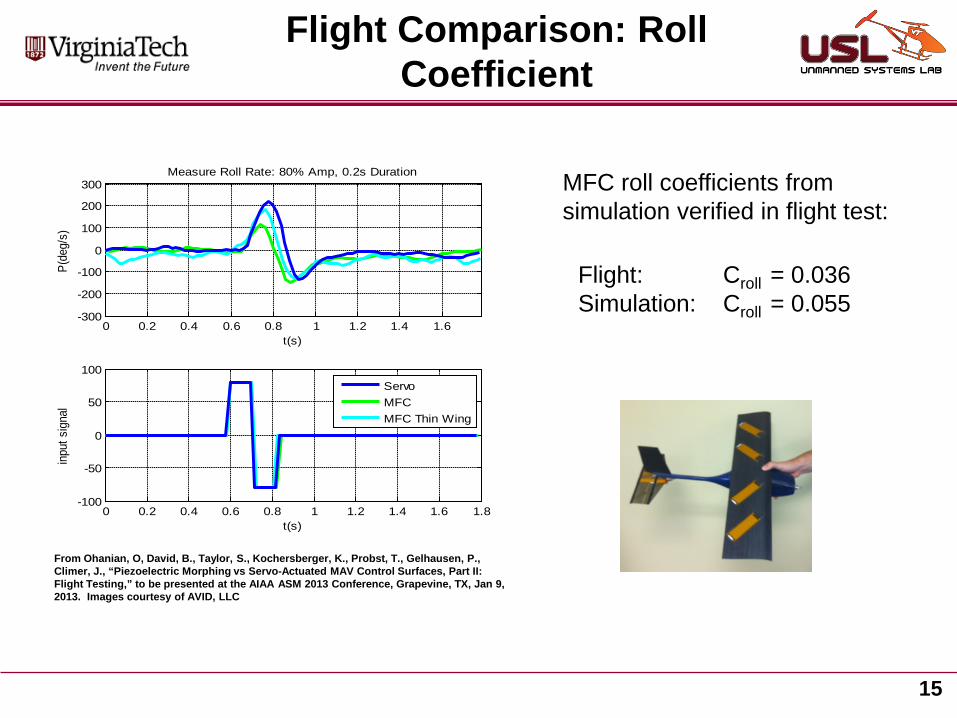
Flight Comparison: Roll Coefficient
Flight: Croll = 0.036 Simulation: Croll = 0.055
15
0 0.2 0.4 0.6 0.8 1 1.2 1.4 1.6-300
-200
-100
0
100
200
300Measure Roll Rate: 80% Amp, 0.2s Duration
t(s)
P(de
g/s)
0 0.2 0.4 0.6 0.8 1 1.2 1.4 1.6 1.8-100
-50
0
50
100
inpu
t sig
nal
t(s)
ServoMFCMFC Thin Wing
MFC roll coefficients from simulation verified in flight test:
From Ohanian, O, David, B., Taylor, S., Kochersberger, K., Probst, T., Gelhausen, P., Climer, J., “Piezoelectric Morphing vs Servo-Actuated MAV Control Surfaces, Part II: Flight Testing,” to be presented at the AIAA ASM 2013 Conference, Grapevine, TX, Jan 9, 2013. Images courtesy of AVID, LLC

Frequency Response: MFC vs. Servo
Dramatic increase in bandwidth with MFC MFC has small phase lag in comparison to servo-driven controls
16
From Ohanian, O, David, B., Taylor, S., Kochersberger, K., Probst, T., Gelhausen, P., Climer, J., “Piezoelectric Morphing vs Servo-Actuated MAV Control Surfaces, Part II: Flight Testing,” to be presented at the AIAA ASM 2013 Conference, Grapevine, TX, Jan 9, 2013. Images courtesy of AVID, LLC

Swashplate-less rotorcraft flight control
Use blade torsional harmonic excitation via MFC to phase-control asymmetric lift and produce roll and pitch moments The blade torsional frequency must be tuned to the 1 per rev frequency (Of course) It allows trimming in forward flight

Donnie Rogers Graduate Research Assistant
Virginia Tech – Mechanical Engineering Unmanned Systems Lab
UAS for the Monitoring of Crop Status and Stress
Copyright 2013, Donald Rogers 18

Overview of ag work
The literature review focused on three main topics as they relate to the crop monitoring project:
1. Spectral Reflectance of Vegetation Reflectance data is a primary tool for
agronomic remote sensing. Led to the formation of ratios of
reflectances, aka vegetation indexes. Most commonly NDVI.
NDVI suffers from soil background interference.
2. Advantages of UAS in Crop Monitoring Low altitude flights results in high resolution
data. Can collect data more frequently than
manned aircraft or satellite. Affordable and multi-purpose.
3. Remote Sensing of Corn and Tobacco Strong correlation between NIR
and Green reflectance for Corn nitrogen fertilizer status.
Strong correlation between NDVI and tobacco nutrient status.
RNIR = NIR reflectance, RRed = Red reflectance
Copyright 2013, Donald Rogers 19
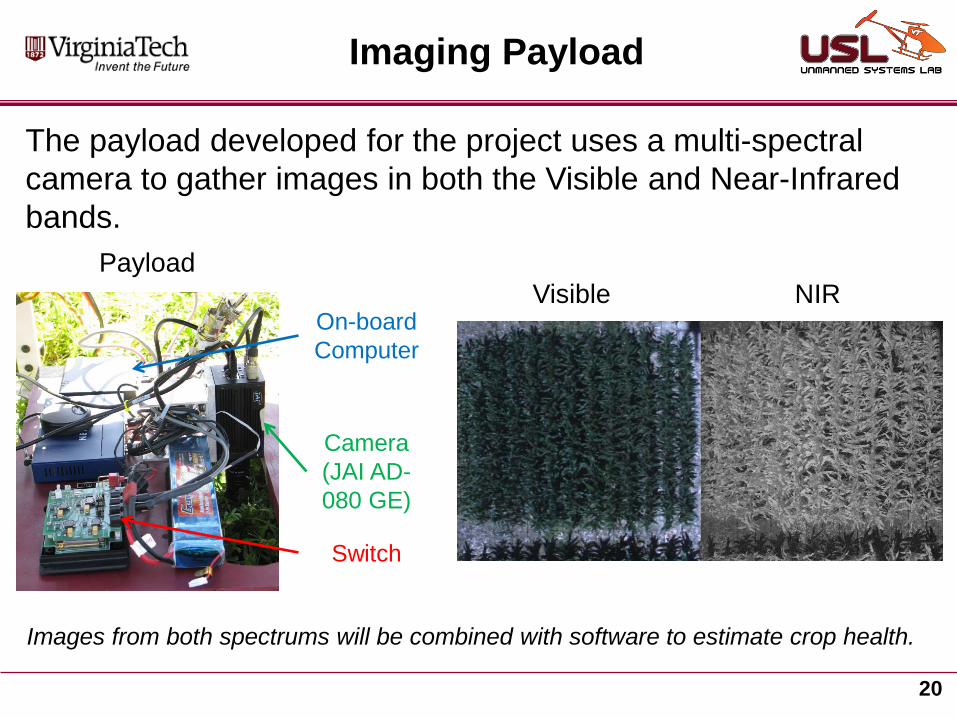
Imaging Payload
The payload developed for the project uses a multi-spectral camera to gather images in both the Visible and Near-Infrared bands.
Payload Visible NIR
Camera (JAI AD-080 GE)
On-board Computer
Switch
Images from both spectrums will be combined with software to estimate crop health.
20

Flight tests at Kentland Farms
Yamaha RMAX carries EO and NIR
cameras Corn was chosen as
the crop for initial testing
The purpose of the flight was to determine the applicability of unmanned aircraft for crop health monitoring
21

Ground Image Segmentation & Results
A two stage segmentation process was used to isolate the corn from background, and then NDVI was used to examine the N effect on yield
GNDVI Mask NDVI Final Image
Copyright 2013, Donald Rogers 22

Statistical Results
A Least Significant Difference (LSD) test has shown that three of the four Nitrogen treatments are detectable by the system.
Our testing has shown diminishing returns as Nitrogen Rate exceeds 150 kg/ha
50 100 150 200 25070
80
90
100
110
120
130
140
150
160
170
Nitrogen Rate (kg/ha)
Mea
n P
ixel
Inte
nsity
(MP
I)
N Treatment MeansBest Fit Curve, R2=0.97
Each treatment was sampled 90 times from the flight images. The LSD test was conducted with a 5% margin of error.
23

Grain Yield Correlations
Grain yield totals were measured for each N rate treatment after harvest and compared to the calculated average NDVI.
The system has the potential for estimating grain yield
A correlation is observed with NDVI suggesting yield estimation is possible for HR hybrid Weaker correlation with AM hybrid due to on outlier
Copyright 2013, Donald Rogers 24

Tobacco Imaging Study
This series of flights performed in September on late season tobacco were intended to explore the use of several sensors:
Ultraviolet (300 – 400 nm) Visible (400 – 700 nm) Near Infrared (700 – 1000 nm) Long wave IR (8000 – 12,000 nm)
Copyright 2013, Donald Rogers
Flight tests were in partnership with American Aerospace Advisors, Inc.
RMAX flown near South Hill, VA under COA authorization
25

Tobacco Survey Results
Two neighboring 8-row blocks appeared to have different levels of growth (most likely, different hybrids)
NDVI for the 1st 8 rows = 0.209
NDVI for the 2nd 8 rows = 0.195
Although the NDVI levels are overall low (as expected due to a large number of bleached leaves), the results still show a significant difference.
Visible NDVI
26

Bleached Leaf Segmentation
A segmentation method was developed to isolate both the green tobacco leaves and the bleached leaves from background noise.
Group RGB Value Distinguishing Feature
Green Tobacco
94, 95, 67 Green pixel value significantly greater
than blue value Bleached Tobacco
148, 156, 166 Brightest pixel values in image
Bare Soil 58, 55, 56 Low overall pixel intensity
Shadowed Soil
14, 16, 15 Low overall pixel intensity
The distinguishing features of each group make simultaneous segmentation possible.
Set a Green Level Threshold
Segmentation is possible using the four primary content groups in the visible image
“Noise Floor” established
Set Bright Level Threshold
The segmentation should output two images: 1st – Green Leaves Only 2nd – Bleached Leaves Only
Copyright 2013, Donald Rogers 27

Leaf Segmentation Results
The leaf segmentation method was successful in isolating both groups of tobacco leaves from each other and background noise.
Trial segmentation results provided us with a estimate of bleached leaf concentration –
useful to determine time of harvest
Original Image Green Leaves Only Bleached Leaves Only
49362 pixels 200628 pixels
Copyright 2013, Donald Rogers 28

UV and LWIR Imaging Results
Data Processing: – UV and IR JPEGS appear to have been distorted by motion blur caused
by helicopter vibration – Individual visible wavelength JPEGS were clear, but adjacent sequential
frames showed differences in magnification and orientation which affects stitching
Ultraviolet Visible Long Wave IR
2013 American Aerospace Advisors Inc. All Rights Reserved 29
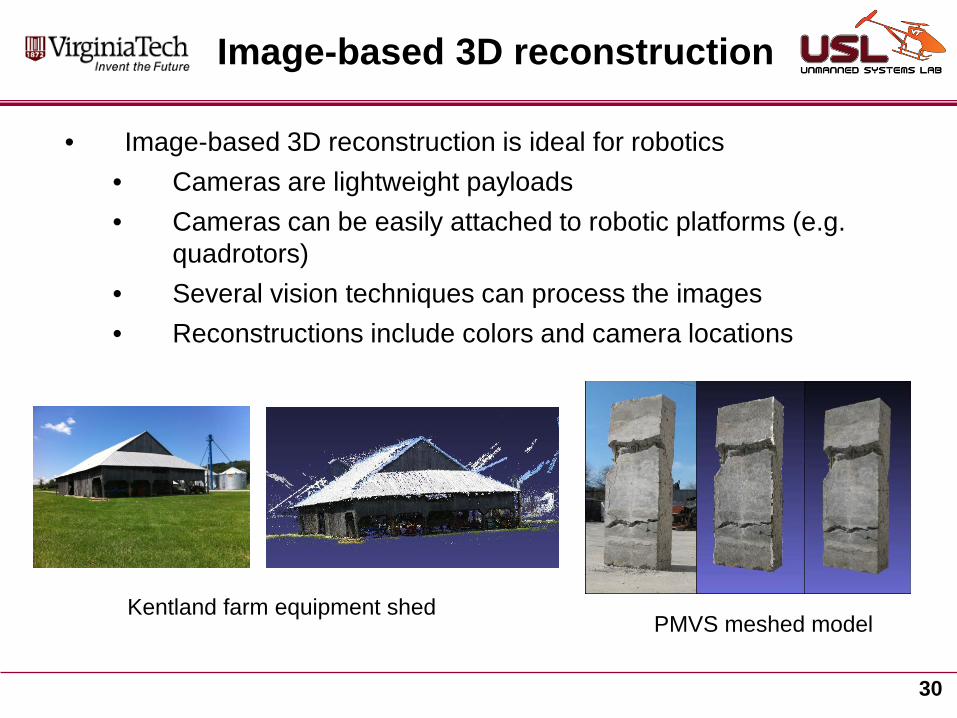
Image-based 3D reconstruction
• Image-based 3D reconstruction is ideal for robotics • Cameras are lightweight payloads • Cameras can be easily attached to robotic platforms (e.g.
quadrotors) • Several vision techniques can process the images • Reconstructions include colors and camera locations
PMVS meshed model Kentland farm equipment shed
30

Stereovision Basics
Stereovision is 3D mapping technique that utilizes two or more cameras, which are separated by some distance, to determine point correspondences in 3D.
Image from Bradski and Kaehler
31
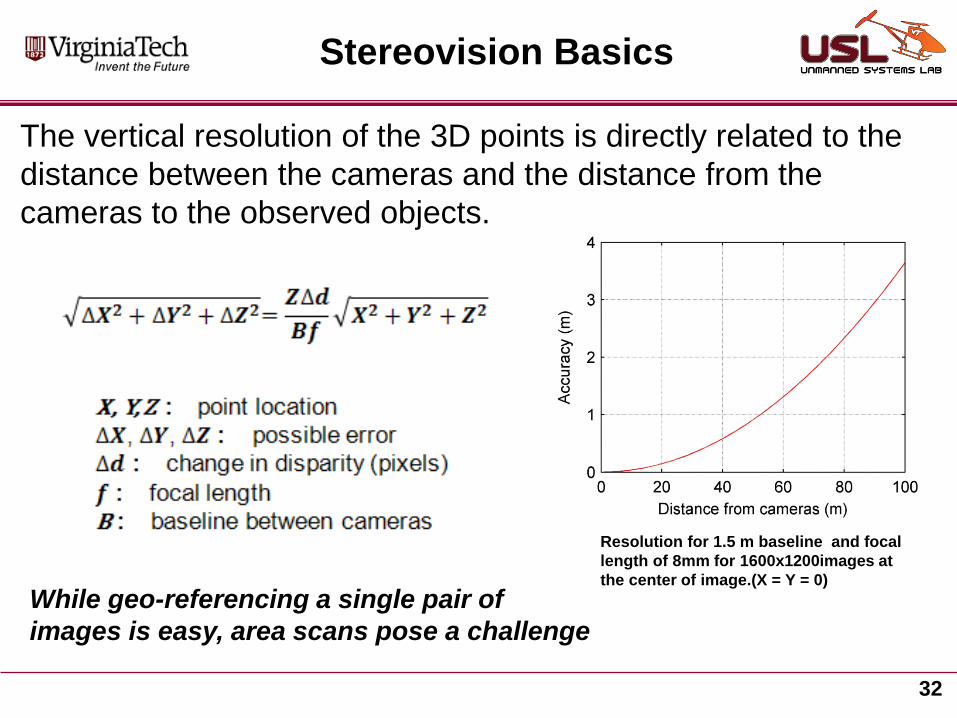
Stereovision Basics
The vertical resolution of the 3D points is directly related to the distance between the cameras and the distance from the cameras to the observed objects.
Resolution for 1.5 m baseline and focal length of 8mm for 1600x1200images at the center of image.(X = Y = 0)
32
While geo-referencing a single pair of images is easy, area scans pose a challenge

Application
• A 5’ baseline system is currently used for aerial imagery on the RMAX
• Methods developed to correct for vibration-induced errors
• Images are acquired with 80% overlap to generate 3-D terrain mosaics
33

Stereo examples
34

Structure-from-Motion (SfM) methods
Bundler SfM output PMVS output Bundler and PMVS output
35
Improved accuracy over stereovision

Some examples
Stockpile mapping
Structural defect detection Volume estimation
36

Anomaly detection in roadway via aerial imagery and 3D reconstruction
Three disturbed areas were successfully identified and mapped using the Unmanned Systems Lab Yamaha RMAX helicopter equipped with the USL dual camera imaging boom. The gravel piles ranged in height from 3” to 10”. Two sets of 3D reconstructions were used for anomaly detection.
Gravel piles detected as anomalies
9’
37

UAV path planning for ground vehicles
Area traversal of ground vehicles could be greatly improved if coupled with a
UAV imaging system
Mosaic map
K-means segmentation
Pre-erosion K-means
membership
Final connected paths
Roadway detection algorithms used with learning methods to find obstructions for
optimal routing
Weighted A* or RRT* methods are applied to 3D maps from aerial imagery to find optimal paths in
unstructured environments
38

3-D Scene Understanding
Challenge: classify 3D environments efficiently for damage assessment, threat assessment, ecosystem monitoring, etc
Original research is focusing on urban environment classification, however any environment of interest can be used to train for classification:
Hurricane damage Tornado blowdown Vehicle disruption
39

3-D Scene Understanding
The lab is using a hexacopter to carry a 48” wide baseline imaging system to collect nadir and side view imagery
Performance metric Value Endurance
Weight (with camera boom)
Max speed
Autopilot Arduino
Stereo broom description Info Cameras Canon A810
Weight
Max frame rate
Max resolution
Control Arduino
40

Training and classification
Use of k-means clustering breaks the scene into 3D “super voxels” based on location only
Further classification occurs on the super voxels for point-ness, linear-ness and surface-ness
Height is added as a feature
A conditional random field (CRF) is used as the framework for training
Supervoxels are then grouped from training into the following classes:
Poles
Ground
Buildings
Vehicles
41
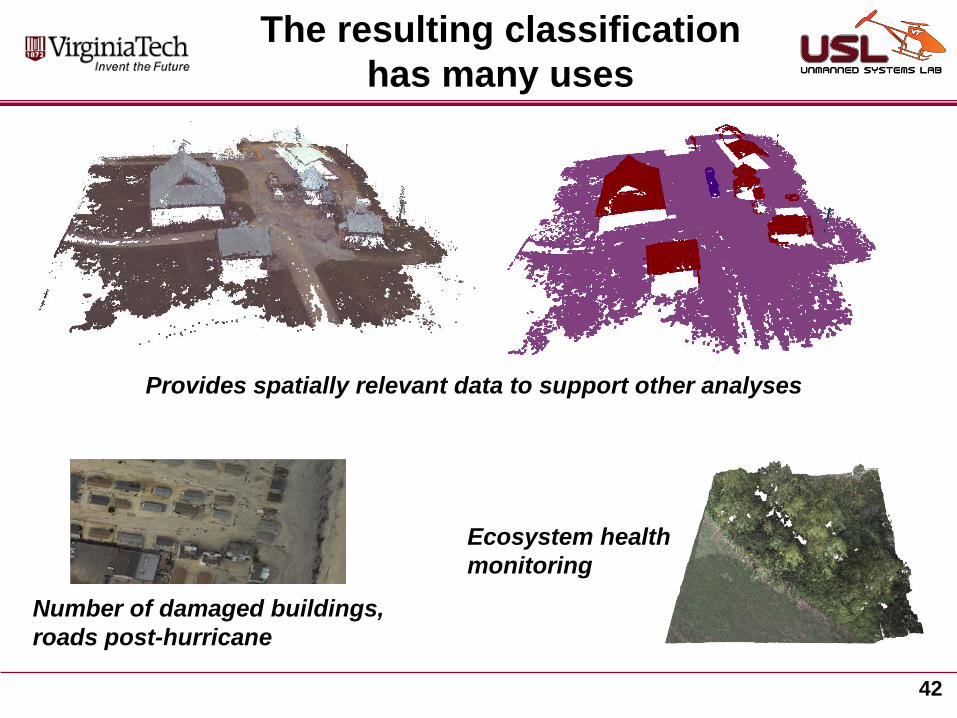
The resulting classification has many uses
Number of damaged buildings, roads post-hurricane
Provides spatially relevant data to support other analyses
Ecosystem health monitoring
42

Organic Disaster Response
Mid-level damage assessment can be facilitated with a 90 kg – class autonomous helicopter
1
1
2
2
3
3 4
4
5
5
Blocked ingress and egress routes
Uncertain terrain or topology
Unstable structures
Health concerns (particulates)
Radiation
3 43
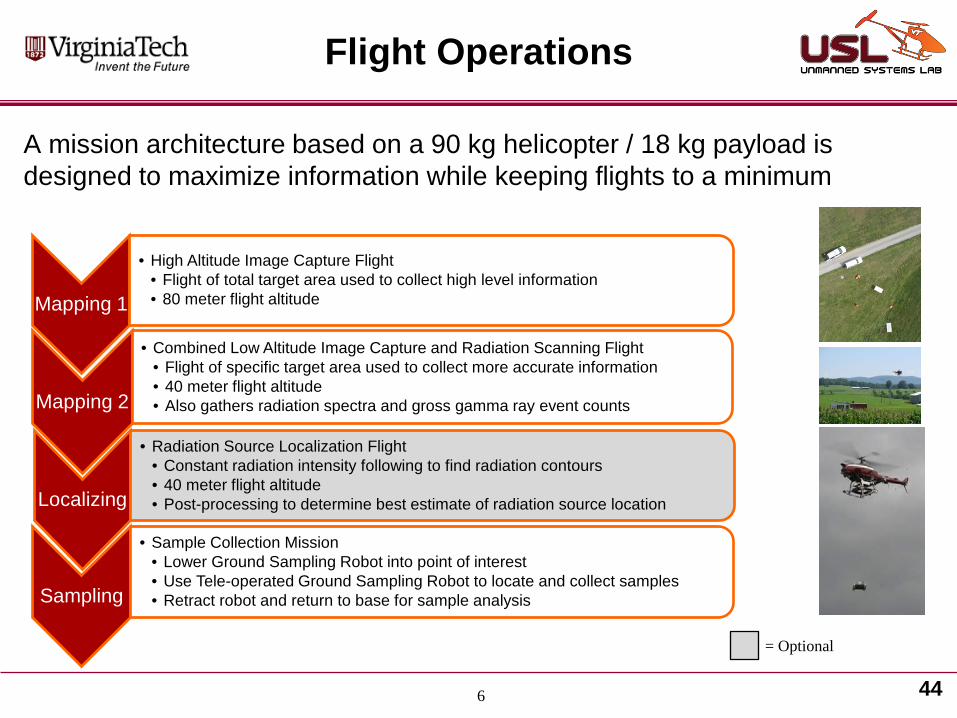
A mission architecture based on a 90 kg helicopter / 18 kg payload is designed to maximize information while keeping flights to a minimum
Flight Operations
Mapping 1
• High Altitude Image Capture Flight • Flight of total target area used to collect high level information • 80 meter flight altitude
6
= Optional
Mapping 2
• Combined Low Altitude Image Capture and Radiation Scanning Flight • Flight of specific target area used to collect more accurate information • 40 meter flight altitude • Also gathers radiation spectra and gross gamma ray event counts
Localizing
• Radiation Source Localization Flight • Constant radiation intensity following to find radiation contours • 40 meter flight altitude • Post-processing to determine best estimate of radiation source location
Sampling
• Sample Collection Mission • Lower Ground Sampling Robot into point of interest • Use Tele-operated Ground Sampling Robot to locate and collect samples • Retract robot and return to base for sample analysis
44

Radiation detection capabilities
• Oct, 2009 test demonstrated detector function with a single, collimated source
• June, 2010 test with uncollimated sources • GPS coordinates, rad counts and spectral data
transmitted real-time to the ground control station
-80.582 -80.5815 -80.581 -80.5805 -80.58
37.1958
37.196
37.1962
37.1964
37.1966
37.1968
37.197
37.1972
37.1974
Scan Path
Longitude (deg)
Latit
ude
(deg
)0 100 200 300 400 500 600 700 800 900 1000
0
100
200
300
400
500
600
Channel No.
Cha
nnel
Cou
nts
Background-Subtracted Gamma Spectrum
45

Radiation detection mission
June, 2010 test: Successfully mapped single and multiple omni-sources at Savannah River National Labs at 40 m and 60 m AGL
The RMAX flew 6 hours in three days of mapping in 98º F heat – only a single software update had to be made during the radiation mapping missions which resulted in a 20 minute delay Single and dual radiation source maps (Sandia NL)
46

Use of spatially variant deconvolution for source localization
Radiation intensity measurements are correlated with height above ground using a laser rangefinder
Maximum likelihood estimation (MLE) used in deconvolution
The ability to resolve close proximity strong and weak sources was demonstrated in flight tests
0.85 Ci Ir source and a 0.03 Ci Co source intensity plots. The sources are spaced 20 m apart
47

An optional radiation localization flight can be performed to more accurately locate a source of radiation
Radiation detection mission
12 48
PID-implemented contour following to localize sources Particle filter method used to
localize a single source

Ground sample collection robot
A helicopter-deployed ground sampling robot was developed to retrieve radioactive samples
Both chunk and particulate samples have been considered for collection
The system (robot and winch) weigh 10 kg
+ =
Tether deployment from the helicopter allows pinpoint delivery of sampling assets
49

Remote ground robotic operations using a virtual display
Robot tracking occurs by referencing the robot to features which are mapped to 3D terrain
Map 3D terrain with vision system
Plan traversability path using A*
Track robot
Teleoperator sees an accurate virtual 3D environment during operation
50

Intelligent radio repeating using mapped terrain and A*
51
Note: The blue lines denote the strongest radio link. Notice how the best link is the radio repeating link between the ground robot, helicopter, and ground robot.

Note: The blue lines denote the strongest radio link. Notice how the best link is the radio repeating link between the ground robot, helicopter, and ground robot.
52
Intelligent radio repeating using mapped terrain and A*

Test data – Intelligent radio repeating
53

Conclusions
The positive uses of UA will be adopted by a suspicious public (as all promising technologies have been adopted in the past) UA toys will outrun any other attempt at promotion of the technology UA have become the future of aviation and can co-exist and support manned flight operations

Questions?