automotive user interfaces and interactive vehicular applications
TRANSCRIPT
Adjunct Proceedings of the 5th International Conference on
Automotive User Interfaces andInteractive Vehicular Applications
Eindhoven, 2013
Jaques TerkenAndreas RienerRoland SchroeterSebastian Osswald
Eindhoven, The Netherlands, Oct. 27th – Oct. 30th 2013

1
Welcome Note from the Work in Progress and Interactive Demos Co-Chairs
It is with great pleasure that we have the opportunity to present the adjunct proceedings of the 2013 edi-tion of the International Conference on Automotive User Interfaces and Interactive Vehicular Applications (AutomotiveUI 2013). Now in its fifth year, and build-ing on the success of the previous conferences, this conference series is becoming the renowned inter-national forum for the dissemination and exchange of theoretical and practical approaches in the field of automotive user interfaces, including novel in-ve-hicle services, new forms of feedback, issues related to workload and driver distraction, and approaches to improving driving performance.
For the WiP-poster and demo category we have re-ceived submissions from 10 countries (only first au-thor’s country used for reporting) including contri-butions from China and Korea. Many people have devoted considerable time in reviewing and selecting those pieces of work presented in this session. 23 re-viewers completed nearly 40 reviews (2 reviews for most of the poster/demo abstracts, due to a very strict timeline, for some papers we received only 1 review; meta-reviews provided by the chairs). We could final-ly accept 17 work-in-progress posters and 2 contri-butions submitted to the interactive demo category. Contributions accepted for this category addressing topics such as gestural interaction, touch-screen UI’s, intelligent vehicles, situation-adaptive UI’s, UI’s for E-vehicles, affective state detection, workload and danger correlation, cooperative guidance, driving simulator sickness, distraction management, tactile and speech feedback, and visual interface complexity.
This year, the poster and interactive demo session is being held on the second day of the main conference (October 29th, afternoon 2-4PM) at the main confer-ence venue, Technische Universiteit Eindhoven. We expect that the poster and interactive demo session
Preface
will be more alive than ever with these various new attempts and encourage you to come to the work-in-progress poster and interactive demo session and have fruitful discussions with researchers and practitioners from all over the world. Don’t miss the ever-popular “one minute madness”, where all poster/demo au-thors will be lined up for a rapid fire, 60-second op-portunity to urge attendees to visit them and learn about their work during the reception. For the OMM, the poster session chair, Alexander Meschtscherjakov, will strictly enforce the one minute time limit for each presentation. We have heard that he has been hard at work devising an effective way to signal the end of a one minute time slot – we’ll have to wait until the session to find out what he will choose in the end… Last but not least we would like to thank each and every one of you for your valuable and continous sup-port towards the success of this conference, especially for the work-in-progress poster and interactive demo session, and wish you a professionally rewarding and socially enjoyable stay in Eindhoven. Enjoy the confer-ence!
PS: While in the Netherlands, don’t miss to try out Boerenkoolstamppot met Rookworst ;-)
Andreas RienerWork-in-progress & Interactive Demos Co-Chair
2
Conference ChairJacques Terken, Eindhoven University of Technology, Eindhoven, The Netherlands
Papers Co-ChairsMarieke Martens, TNO / Universiteit Twente, Twente, The NetherlandsChristian Müller, DFKI, Saarbrücken, GermanyJennifer Healey, INTEL Labs, Santa Clara, USA
Work-in-progress & Interactive Demos Co-ChairAndreas Riener, Johannes Kepler University, Linz, Austria
Workshops and Tutorials Co-ChairRonald Schroeter, Queensland University of Technology, Brisbane, Australia
Industrial Showcase ChairAlex Uyttendaele, DAF Trucks, Eindhoven, Eindhoven, The Netherlands Christian Müller, DFKI, Saarbrücken, Germany
Doctoral Colloquium ChairsAndreas Riener, Johannes Kepler University, Linz, Austria
Publication Co-ChairsSebastian Osswald, TUM CREATE, Singapore
WebmasterDino Sepac, Technische Universiteit Eindhoven, Eindhoven, The Netherlands
Local ArrangementsKarine van den Wildenberg, Technische Universiteit Eindhoven, Eindhoven, The Netherlands
Ignacio Alvarez, Clemson UniversitySusanne Boll, Universität OldenburgLinda Boyle, University of WashingtonDuncan Brumby, University College London Susan Chrysler, University of IowaBirsen Donmez, University of TorontoBerry Eggen, Technische Universiteit EindhovenAlois Ferscha, University of LinzPeter Froehlich, FTWPaul Green, University of MichiganJeff Greenberg, Ford Motor CoRiender Happee, TU DelftHelen Harris, Google USJennifer Healey, IntelWilliam Horrey, Liberty MutualShamsi Iqbal, Microsoft ResearchChristian Janssen, SKERIMyounghoon Jeon, Michigan Technological UniversityMatt Jones, FIT LAB, SwanseaJessica Jung, Fraunhofer IESENicholas Kelling, University of South Florida PolytechnicDagmar Kern, Bertrandt Ingenieurbuero GmbHSeungjun Kim, Carnegie Mellon UniversityMatthias Kranz, University of PassauAndrew Kun, University of New HampshireTomas Macek, IBMAngela Mahr, DFKIRod Mccall, University of LuxembourgDaniel Mcgehee, University of Iowa
Zeljko Medenica, University of New HampshireBruce Mehler, MITAlexander Meschtscherjakov, University of SalzburgChristian Müller, DFKIMichael Nees, Lafayette CollegeCristina Olaverri, Technische Universität MünchenSebastian Osswald, TUM CREATEOskar Palinko, University of New HampshireBastian Pfleging, University of StuttgartBenjamin Reaves, Oracle CorpBryan Reimer, MITAndreas Riener, Johannes Kepler University LinzShannon Roberts, University of Wisconsin-MadisonAlbrecht Schmidt, University of StuttgartKazunori Shidoji, Kyushu UniversityMikael Skov, Aalborg UniversityJoonwoo Son, DGISTDalila Szostak, IntelIvan Tashev, Microsoft ResearchJacques Terken, Technische Universiteit EindhovenManfred Tscheligi, University of SalzburgOmer Tsimhoni, General Motors IsraelJessica Villing, University of GothenburgBruce Walker, Georgia TechDavid Wilfinger, University of SalzburgRaphael Wimmer, University of RegensburgUte Winter, General MotorsHuimin Xiong, University of Washington
Program Committee
Conference Organization
3
Table of Contents
Preface .......................................................................................................................................................................... 1Conference Organization ............................................................................................................................................ 2Table of Contents ........................................................................................................................................................ 3Workshops ................................................................................................................................................................... 5Work in Progress ....................................................................................................................................................... 89Interactive Demos.....................................................................................................................................................119
Workshops
WS1: EVIS 2013 - 2nd Workshop on Electric Vehicle Information Systems ............................................................ 7Sebastian Loehmann, Sebastian Osswald, Daniel Gleyzes, Klaus Bengler, Manfred Tscheligi, Andreas Butz
Designing & Understanding the Impacts of Electric Vehicle Apps .................................................................... 10Identifying EV Drivers‘ Needs for Information Communication Technology to Ease the EV Charging Process ................................................................................................................................................... 13Towards a Multisensory Representation of Electromobility Characteristics ....................................................17
WS2: Cognitive Load and In-Vehicle Human-Machine Interaction ....................................................................... 21Andrew L. Kun, Peter A. Heeman, W. Thomas Miller, Paul A. Green, Ivan Tashev, Peter Froehlich, Bryan Reimer, Shamsi Iqbal, Dagmar Kern
CLW 2013 Keynote Address: Cooperative Driving as a New Paradigm for Highly Automated Vehicles ....... 24Implications of NHTSA Visual Manual Guidelines to the Design and User Experience of In-vehicle Interfaces ............................................................................................................................................... 25Warwick-JLR Driver Monitoring Dataset (DMD): A public Dataset for Driver Monitoring Research ............. 27PHYSIOPRINT: A Workload Assessment Tool Based on Physiological Signals ................................................. 31Cognitive Workload, Pupillary Response, and Driving: Custom Applications to Gather Pupillary Data ....... 37The Car That Cares: Introducing an in-vehicle ambient light display to reduce cognitive load ......................41Cognitive Load Impairs Experienced Drivers’ Judgments on Self-Reported Driving Superiority .................. 45Towards a Cognitive Load Ready Multimodal Dialogue System for In-Vehicle Human-Machine Interaction ................................................................................................................................. 49Model-based engineering of user interfaces to support cognitive load estimation in automotive applications ........................................................................................................................................ 53
WS3: 3rd Workshop on Automotive Natural User Interfaces ............................................................................... 57Bastian Pfleging, Ignacio Alvarez, Jennifer Healey, Nora Broy
Could You Please…? Investigating Cooperation In The Car ................................................................................61Toward Natural User Interfaces in the Car: Combining Speech, Sound, Vision, and Touch ............................ 65
WS4: Exploring the User Experience of Autonomous Driving Workshop .......................................................... 71 Manfred Tscheligi , David Wilfinger, Alexander Meschtscherjakov, Carlos Montesinos, Roderick McCall, Dalila Szostak, Alexander Muir, Rabindra Ratan
WS5: 2nd workshop on „The Social Car - Socially-inspired Mechanisms for Future Mobility Services“ ......... 75Andreas Riener, Myounghoon Jeon, Ignacio Alvarez
Message from the Workshop Organizers ..............................................................................................................74Necessity of Vehicle to Rail Infrastructure Communication for Grade Crossing Warning & Safety .............. 79Cards as design tools for the “Social Car” domain ............................................................................................. 81Socially-inspired Driving Mechanisms ................................................................................................................. 85
Work in Progress
On the influence of a vehicle‘s apparent intelligence on driving behaviour and consequences for car UI design ......................................................................................................................................................................... 91Serge Thill, Maria Nilsson, Paul Hemeren
Emergent properties of interaction and its implications for the design of electric vehicles ............................. 93Maria Nilsson
A Model For Predicting the Visual Complexity of In-Vehicle Interfaces .............................................................. 95Luuk Beursgens, Sandro Castronovo, Christian Müller, Jacques Terken
Detection of Drivers’ Incidental and Integral Affect Using Physiological Measures .......................................... 97Samantha Jansen, Abbey Westphal, Myounghoon Jeon, Andreas Riener
Influences of Socio-Demographic Factors, Personality Traits and Car Usage on Cooperative Guidance and Control ........................................................................................................................................................................ 99Sonja Meier, Eugen Altendorf, Marcel Baltzer, Frank Flemisch
Driving Simulator Sickness Screening: Efficient and Effective New Protocol ................................................... 101Thomas Gable, Bruce Walker
Taking Reality for a Drive in the Lab: The Makeup of a Mockup for Automotive HMI Research .................... 103Martin Murer, David Wilfinger, Manfred Tscheligi
Personalized situation-adaptive User Interaction in the Car .............................................................................. 105Nadine Siegmund, Tobias Altmüller, Klaus Bengler
AmbiCar: Towards an in-vehicle ambient light display ....................................................................................... 107Andreas Löcken, Heiko Müller, Wilko Heuten, Susanne Boll
Multi-modal tactile displays for enhanced driver awareness and safety .......................................................... 109Maria Karam
Exploring aesthetics factors of gesture interaction in vehicles- An empirical study of in-car music player ...111Yongmeng Wu, Hao Tan, Jianghong Zhao
Instruction or distraction in the driving school? ...................................................................................................113Agnese Caglio, Mike Kirk Andersen
Interactive Demos
Development of a Conversational Speech Interface Using Linguistic Grammars ..............................................117Hansjörg Hofmann, Ute Ehrlich, Sven Reichel, André Berton
Comparison of Different Touchless Gesture Interactions in the Car Cockpit .....................................................119Diana Reich, Marcus Weber

Workshops

6
Adjunct Proceedings of the 5th International Conference on Automotive User Interfaces and Interactive Vehicular Applications (AutomotiveUI ‚13), October 28–30, 2013, Eindhoven, The Netherlands.
7
Adjunct Proceedings of the 5th International Conference on Automotive User Interfaces and Interactive Vehicular Applications (AutomotiveUI ‚13), October 28–30, 2013, Eindhoven, The Netherlands.
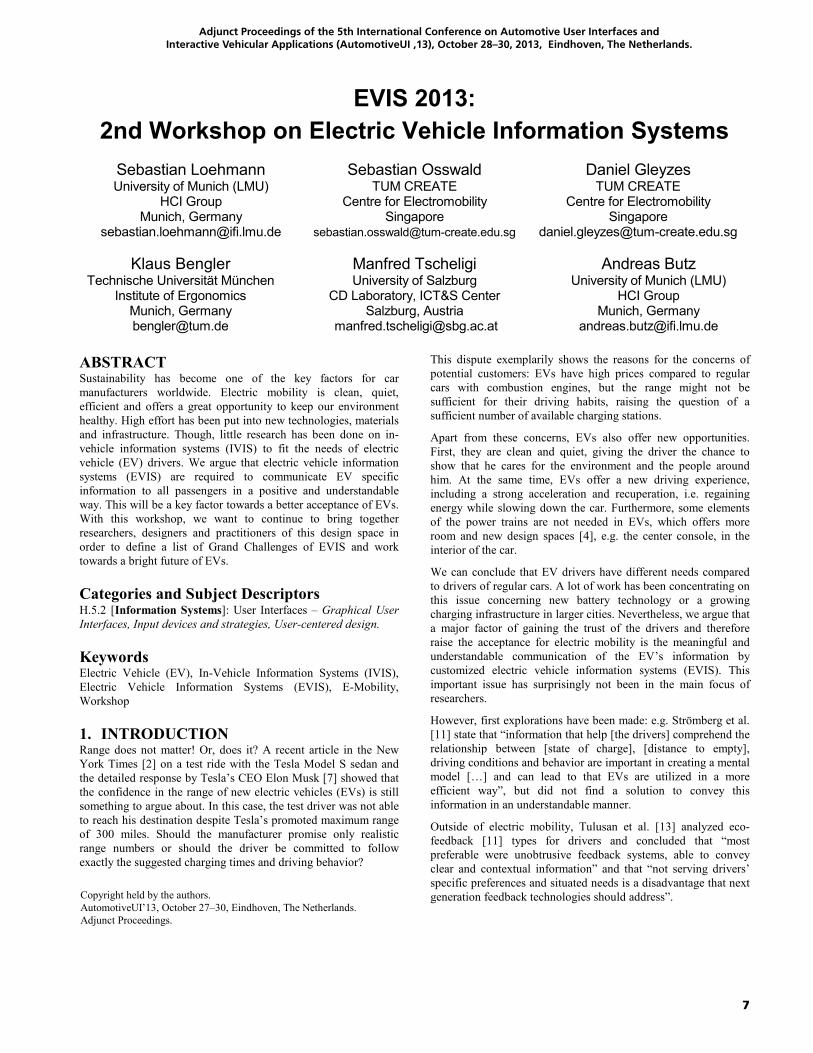
EVIS 2013:2nd Workshop on Electric Vehicle Information Systems
Sebastian LoehmannUniversity of Munich (LMU)
HCI GroupMunich, Germany
Sebastian OsswaldTUM CREATE
Centre for ElectromobilitySingapore
Daniel GleyzesTUM CREATE
Centre for ElectromobilitySingapore
Klaus BenglerTechnische Universität München
Institute of ErgonomicsMunich, [email protected]
Manfred TscheligiUniversity of Salzburg
CD Laboratory, ICT&S Center Salzburg, Austria
Andreas ButzUniversity of Munich (LMU)
HCI GroupMunich, Germany
ABSTRACTSustainability has become one of the key factors for car manufacturers worldwide. Electric mobility is clean, quiet, efficient and offers a great opportunity to keep our environment healthy. High effort has been put into new technologies, materials and infrastructure. Though, little research has been done on in-vehicle information systems (IVIS) to fit the needs of electric vehicle (EV) drivers. We argue that electric vehicle information systems (EVIS) are required to communicate EV specific information to all passengers in a positive and understandable way. This will be a key factor towards a better acceptance of EVs. With this workshop, we want to continue to bring together researchers, designers and practitioners of this design space in order to define a list of Grand Challenges of EVIS and work towards a bright future of EVs.
Categories and Subject DescriptorsH.5.2 [Information Systems]: User Interfaces – Graphical User Interfaces, Input devices and strategies, User-centered design.
KeywordsElectric Vehicle (EV), In-Vehicle Information Systems (IVIS), Electric Vehicle Information Systems (EVIS), E-Mobility, Workshop
1. INTRODUCTIONRange does not matter! Or, does it? A recent article in the New York Times [2] on a test ride with the Tesla Model S sedan and the detailed response by Tesla’s CEO Elon Musk [7] showed that the confidence in the range of new electric vehicles (EVs) is still something to argue about. In this case, the test driver was not able to reach his destination despite Tesla’s promoted maximum range of 300 miles. Should the manufacturer promise only realistic range numbers or should the driver be committed to follow exactly the suggested charging times and driving behavior?
This dispute exemplarily shows the reasons for the concerns of potential customers: EVs have high prices compared to regular cars with combustion engines, but the range might not be sufficient for their driving habits, raising the question of a sufficient number of available charging stations.
Apart from these concerns, EVs also offer new opportunities. First, they are clean and quiet, giving the driver the chance to show that he cares for the environment and the people around him. At the same time, EVs offer a new driving experience, including a strong acceleration and recuperation, i.e. regaining energy while slowing down the car. Furthermore, some elements of the power trains are not needed in EVs, which offers more room and new design spaces [4], e.g. the center console, in the interior of the car.
We can conclude that EV drivers have different needs compared to drivers of regular cars. A lot of work has been concentrating on this issue concerning new battery technology or a growing charging infrastructure in larger cities. Nevertheless, we argue that a major factor of gaining the trust of the drivers and therefore raise the acceptance for electric mobility is the meaningful and understandable communication of the EV’s information by customized electric vehicle information systems (EVIS). This important issue has surprisingly not been in the main focus of researchers.
However, first explorations have been made: e.g. Strömberg et al. [11] state that “information that help [the drivers] comprehend the relationship between [state of charge], [distance to empty], driving conditions and behavior are important in creating a mental model […] and can lead to that EVs are utilized in a more efficient way”, but did not find a solution to convey this information in an understandable manner.
Outside of electric mobility, Tulusan et al. [13] analyzed eco-feedback [11] types for drivers and concluded that “most preferable were unobtrusive feedback systems, able to convey clear and contextual information” and that “not serving drivers’ specific preferences and situated needs is a disadvantage that next generation feedback technologies should address”. Copyright held by the authors.
AutomotiveUI’13, October 27–30, Eindhoven, The Netherlands. Adjunct Proceedings.
8
Adjunct Proceedings of the 5th International Conference on Automotive User Interfaces and Interactive Vehicular Applications (AutomotiveUI ‚13), October 28–30, 2013, Eindhoven, The Netherlands.
Meschtscherjakov et al. [6] proposed five alternative pervasive feedback systems for regular cars. Included is the EcoPedal, a gas pedal trying to reduce fuel consumption by “pushing back against the driver’s foot when it detects wasteful acceleration”. However, “participants felt especially disturbed by systems with tactile and/or auditory feedback” [6].
The time is ripe to concentrate research on the special properties of EVs and the needs of the drivers. EVIS serve as the main communication channel between car and passengers and should therefore receive a suitable amount of attention by researchers and manufacturers. With this workshop, we want to continue to gather experts on the field and shift their attention towards the creation of meaningful and understandable EVIS.
2. AREAS OF INTERESTThe characteristics of electric vehicles are manifold and affect a wide range of different topics. To understand the requirements and needs of EV drivers, the following topics require special attention in the design and development process:
Driving Behavior. Driving EVs is different compared to regular cars with combustion engines. A strong acceleration without switching gears and regenerative breaking influence the driving experience. BMW proposes the “single-pedal control” related to their electric i3 Concept car. It allows driving with only the accelerator, regenerating energy when releasing the pedal, and lets the vehicle “coast without consuming power, driven by its own kinetic energy” [1].
Sound. When starting an EV, the familiar sound and movement of the engine are missing. Consequently, drivers have trouble knowing “whether the vehicle is ready to drive or not” which was confirmed in an experiment conducted by Strömberg and colleagues [11]. While driving, EVs are hardly hearable for outside traffic participants, which can be blessing in a quiet neighborhood but a curse for bicyclists or the visually impaired. Therefore, the U.S. Department of Transportation recently proposed minimum sound requirements for electric vehicles [8].
Range prediction. To communicate the available range to the driver, it might not be sufficient to know the State of Charge of the battery. Other factors such as current destination, weather conditions, the traffic situation, available charging stations or the current consumption of the infotainment system have a strong influence on range prediction. Lundström [5] identifies even more, such as the relevance of an energy source being private or public, which might affect the trust in the infrastructure.
Energy management. As energy is the limiting factor for electric vehicles, on board energy management becomes important to save resources in the case of a “last mile situation”. In this case, e.g. the air condition might take away resources for heating or cooling that would have been enough to allow a driver to reach its destination. Thus, intelligent controlling mechanisms are required and the driver needs to be informed why the AC stopped working.
E-Mobility Concepts. Not all EVs might be used in stereotypic usage scenarios like a three-person household with a garage.
Novel mobility concepts such as car sharing or connecting vehicles to create a larger vehicle might affect how we see and use electric vehicles. EVIS are required to address the challenges of varying drivers that maybe never used an EV before [10].
3. OBJECTIVES & EXPECTED OUTCOMEIn the first EVIS workshop [9], we identified characteristic properties of EVs, which have an influence on future interfaces and interactions (e.g. range and battery properties, safety of and trust in the new technology, user experience while interacting withEVIS, driving behavior of EVs, etc.) With this second workshop, we further extend the network of researchers, designers or practitioners of the design space. We invite participants to share their approaches to overcome the barriers that still keep the adoption of electric vehicles on a low level. We will work towards a meaningful research agenda, showing the Grand Challenges of EVIS.
With the help of this agenda, we hope to encourage the community to discuss the need to move away from simply adopting state of the art vehicles with combustion engines towards new EVIS concepts with their forms of interactions considering the special needs of EV drivers. The workshop will deal with but is not limited the following questions:
What are properties of EVs that lead to the need of new interfaces and novel forms of interactions?
Who are future EV drivers and what are their needs?
How can we design EVIS to meet these needs?
Which transportation concepts influence the design of EVIS?
Do we need entirely new concepts for the interior of EVs or can we adopt regular combustion engine cars to meet the needs of EV drivers?
How can we involve the other passengers in EV critical activities like trip planning and in-car interactions?
4. ORGANIZATION4.1 Before the WorkshopThe organizers will commit to publicize their workshop. The call for participation for this workshop will be distributed via related mailing lists as well as specialized ones (e.g. CHI announcement list, AUI list, TUM CREATE List) and will be distributed at several HCI- and E-Mobility related research groups and companies such as car manufacturers. We will use social media such as Facebook and Twitter as well to publicize the workshop.The website of the workshop will provide information about the workshop preparations, the CfP, and links to related material, so that people interested can become familiar with the scope of the subject and the goals of the workshop. Each submitted paper will be reviewed by at least two organizers. Authors will then get the chance to submit a revised version. Accepted position papers and other materials will be made available on the website in time before the workshop.
4.2 During the WorkshopDue to the experience of the first EVIS workshop at AutomotiveUI 2012, we expect about 15 participants. Therefore, we suggest a full day workshop that starts with an introduction to
9
Adjunct Proceedings of the 5th International Conference on Automotive User Interfaces and Interactive Vehicular Applications (AutomotiveUI ‚13), October 28–30, 2013, Eindhoven, The Netherlands.
the topic followed by Pecha Kucha presentations1 of the submitted papers. We chose this presentation method due to earlier experience in AUI workshops and think that presenting 20 images, each for 20 seconds, will give a valuable insight into the key ideas of the work presented. Hereby we avoid long and detailed presentations, foster compact presentations and leave enough room for discussions and group exercises. The presentations will be accompanied by discussions with the audience to clear details after presenting and interrupted by a coffee break. After a joined lunch, we will spend the afternoon with a first summary of what we so far know about the challenges of e-mobility and with the breakout sessions. These will focus on challenges discovered during the workshop and discuss different aspects of interacting with information systems of electric vehicles. Workshop participants will work together in smallgroups and finally present their ideas of how to encounter particular challenges. At the end we will discuss topics that remained open and encourage a get together for dinner after the workshop. Table 1 contains a detailed schedule for the workshop.
Time Topic09:00-09:15 Introduction09:15-10:30 Pecha Kucha presentations (I)10:30-11:00 Coffee Break11:00-11:45 Pecha Kucha presentations (II)11:45-12:30 Highlights, session grouping, preparation
for break out session12:30-13:30 Lunch13:30-15:00 Break-out session 15:00-15:30 Coffee Break15:30-16:30 Group discussions to define the Grand
Challenges for EVIS 16:30-17:00 Wrap-up
Table 1. Proposed schedule for the one-day EVIS workshop
4.3 After the WorkshopA short report presenting impressions, pictures and first results will be published on the website shortly after the workshop. To retain the outcome of the workshop in a meaningful way, an overall whitepaper presenting the Grand Challenges of EVIS isenvisaged to be published on the website as well. To frame the field of research towards EVIS, we envisage a publication of the submitted papers as a technical report.
5. THE PRESENTERThe organizers of this workshop form an interdisciplinary team with experts from Human Computer Interaction, Human Factors and automotive practice and research. Due to organizational reasons, the workshop itself will be presented by Sebastian Loehmann, who already ran the first EVIS workshop at AutomotiveUI 2012.
Sebastian Loehmann is a member of the HCI Group at the University of Munich as a PhD student and research assistant. He is involved in the interdisciplinary “CAR@TUM User Experience” project, which is a cooperation of BMW AG, Technische Universität Muenchen (TUM) and the University of
1 http://www.pechakucha.org
Munich (LMU). The project focuses on the emotional aspects of e-mobility. Sebastian concentrates on the interaction with EVIS and explores the introduction of gestural interfaces into the automotive context.
6. REFERENCES[1] BMW i3 Concept. The Megacity Vehicle. Last accessed 17.07.2013 http://www.bmw-i-usa.com/en_us/bmw-i3/[2] Broder, J. The New York Times: Stalled Out on Tesla’s Electric Highway. Last accessed 17.07.2013 http://www.nytimes.com/2013/02/10/automobiles/stalled-on-the-ev-highway.html[3] Gyimesi, K. and Viswanathan, R. The shift to electric vehicles. Putting consumers in the driver’s seat, IBM Cooperation (2011).[4] Kern, D., and Schmidt, A. Design space for driver-based automotive user interfaces. In Proc. of AutomotiveUI 2009 (Essen, Germany), ACM, pp. 3-10.[5] Lundström, A., Bogdan, C., Kis, F., Olsson, I., and Fahlén, L. Enough Power to Move: Dimensions for Representing Energy Availability. In Prof. of MobileHCI 2012 (San Francisco, CA, USA), ACM, pp. 201-210.[6] Meschtscherjakov, A., Wilfinger, D., Scherndl, T., and Tscheligi, M. Acceptance of future persuasive in-car interfaces towards a more economic driving behaviour. In Proc. of AutomotiveUI 2009 (Essen, Germany), ACM, pp. 81–88.[7] Musk, E. A Most Peculiar Test Drive. Last accessed 17.07.2013 http://www.teslamotors.com/blog/most-peculiar-test-drive[8] National Highway Traffic Safety Administration: U.S. Department of Transportation Proposes New Minimum Sound Requirements for Hybrid and Electric Vehicles. Last accessed 17.07.2013 http://www.nhtsa.gov/About+NHTSA/Press+Releases/DOT+Proposes+New+Minimum+Sound+Requirements+for+Hybrid+and+Electric+Vehicles[9] Osswald, S., Loehmann, S., Gleyzes, D., Butz, A., and Tscheligi, M. Electric vehicle information systems: The challenges of e-mobility. In Adj. Proc. of AutomotiveUI 2012 (Portsmouth, NH, USA), pp. 103-105.[10] Osswald, S., Pratik S., and Tscheligi, M. “Hardware-in-the-Loop-Based Evaluation Platform for Automotive Instrument Cluster Development (EPIC).” In Proc. of EICS 2013 (London, UK), ACM, pp 323–332.[11] Spagnolli, A., Corradi, N., Gamberini, L., Hoggan, E., Jacucci, G., Katzeff, C., Broms, L., and Jönsson, L. Eco-feedback on the go: Motivating energy awareness. Computer, 44(5), 38-45(2011).[12] Strömberg, H., Andersson, P., Almgreen, S., Ericsson, J., Karlsson, M., and Nabo, A. Driver interfaces for electric vehicles. In Proc. of AutomotiveUI 2011 (Salzburg, Austria), ACM, pp. 177-184.[13] Tulusan, J., Soi, L., Paefgen, J., Brogle, M., and Staake, T. Eco-efficient feedback technologies: Which eco-feedback types prefer drivers most? In Proc. of WoWMoM 2011 (Lucca, Italy), IEEE.
10
Adjunct Proceedings of the 5th International Conference on Automotive User Interfaces and Interactive Vehicular Applications (AutomotiveUI ‚13), October 28–30, 2013, Eindhoven, The Netherlands.
Designing & Understanding the Impacts of Electric Vehicle Apps
Anders Lundström KTH – Royal Institute of Technology & SICS/ICE-Lab
Lindstedtsvägen 5 SE-10044 Stockholm, Sweden
Cristian Bogdan KTH – Royal Institute of Technology
Lindstedtsvägen 5 SE-10044 Stockholm, Sweden
ABSTRACT We are in the process of designing a series of apps for plugin electric vehicles (PEVs) with the goals of raising technology understanding and mitigating range anxiety. We targeted our apps at different moments in the user-car relationship: before, during and after driving. We are designing a study involving a number of PEV drivers to both assess their driving behavior over time, and to test our PEV apps. This paper presents our process and current status, for workshop discussion.
Categories and Subject Descriptors H.5.m. Information interfaces and presentation (e.g., HCI): Miscellaneous. See: http://www.acm.org/about/class/1998/
Keywords Electric vehicles; range anxiety; Designing; App; Ambiguity; Study.
1. INTRODUCTION In the plug-in electric vehicle (PEV) use context, range awareness, or lack thereof, may manifest itself through a phenomenon referred to as range anxiety [2, 7]. Range anxiety is the anxiety or fear of not reaching a location before the battery is empty, occurring while driving – or even prior to driving – as driver may worry about later planned trips. The main cause for this problem is that PEVs have a more limited driving range, e.g. Nissan Leaf has a claimed range of about 160 km (100 miles), in combination with charging times of approximately up to 8 hours in normal power plugs and up to 2 hours in fast charging stations for a fully charged battery. This is due to available battery technology and limitations of the electrical grid. This means that it might take hours to correct planning mistakes, or even make the driver stuck if discovered too late. While there is hope for improved battery technology in the future, e.g. using supercapacitors like graphene [3], current understanding does not offer viable solutions for improving battery performance. Range anxiety is considered to be one of the biggest psychological barrier for the PEV, and studies show a need for more energy information and better user interfaces to provide better means of handling and avoiding these unnecessary situations [4]. It is not unusual that these problems occure because the drivers expect the PEVs to work in the same way a conventinal car works [8]. Indicating that the information system is forced into the conventions and designs of conventional cars, rather than having its own design.
However, the majority of the commercially available PEVs have
their driving range above 80 km, which is twice, and in most case three to four times, the daily driving habits of the general public in Europe, USA and Australia [1], showing that the PEV is well adjusted to the needs of people if rare occasions (long trips) are excluded. On the other hand, this assumes that the PEV is fully charged every morning, something that is likely to fail from time to time, as things tend to happen. I.e., fuses break, people forget to plug in over night or over lunch, unexpected trips occur in the last moment, unexpected traffic jams requires more power to run air-conditioning or heating, charging stations are occupied or broken, there is a blackout in the area, the driving style or topography requires more power than expected and so on. The objective of our position paper is to show the current status of our interaction design work in the PEV area, focused especially on addressing such contingencies. We will describe our design concepts, and the design sensitivities we developed during the process (especially the need for ambiguity as a counter-balance for contingency). We will also describe a study that we are preparing with drivers on the field and hope to discuss our study plan at the workshop.
2. A series of apps Our work is in large part driven from explorative stance, investigating possible futures using design methods.
In earlier work we have been trying to address range anxiety by exploring how distance-left-to-empty information could be visualized in more accurate and intuitive ways, using maps and parameters of the world [5].
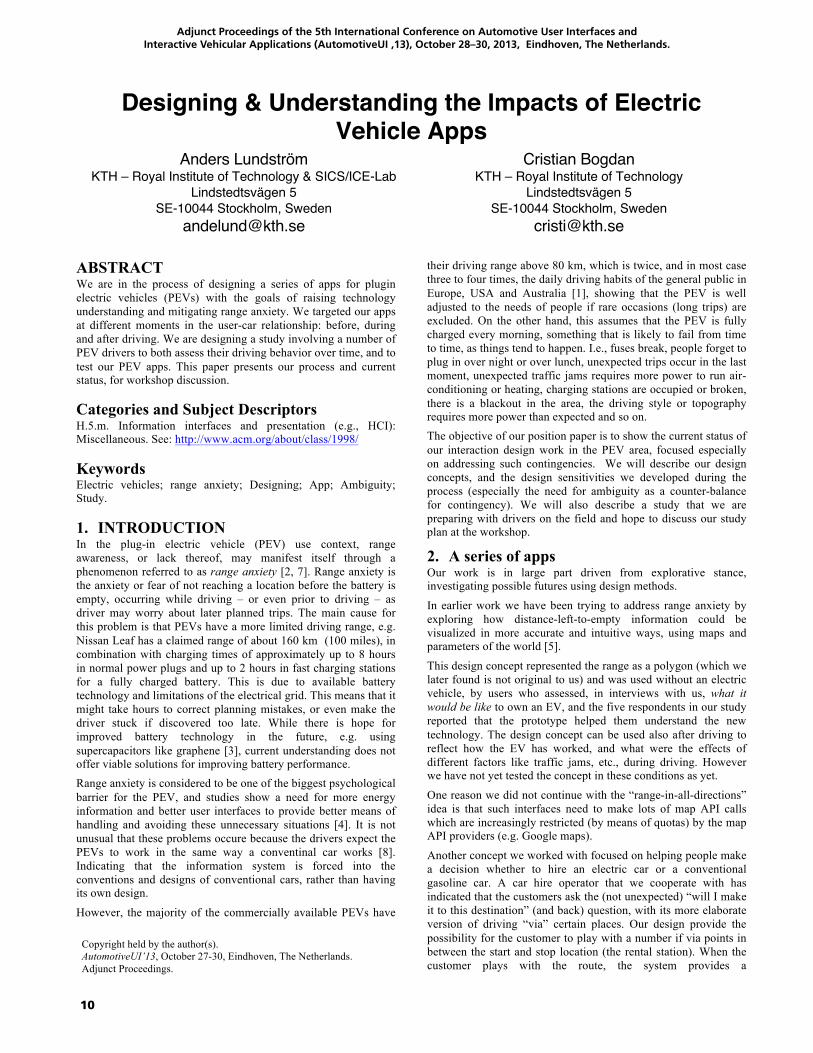
This design concept represented the range as a polygon (which we later found is not original to us) and was used without an electric vehicle, by users who assessed, in interviews with us, what it would be like to own an EV, and the five respondents in our study reported that the prototype helped them understand the new technology. The design concept can be used also after driving to reflect how the EV has worked, and what were the effects of different factors like traffic jams, etc., during driving. However we have not yet tested the concept in these conditions as yet.
One reason we did not continue with the “range-in-all-directions” idea is that such interfaces need to make lots of map API calls which are increasingly restricted (by means of quotas) by the map API providers (e.g. Google maps).
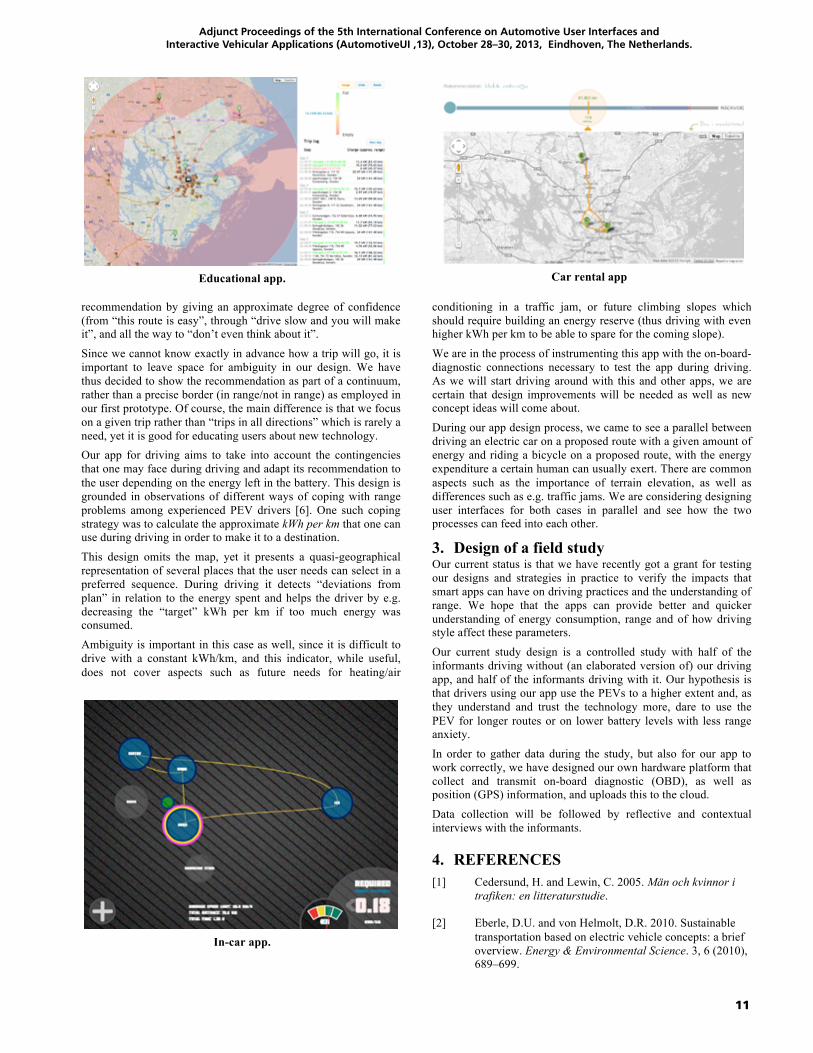
Another concept we worked with focused on helping people make a decision whether to hire an electric car or a conventional gasoline car. A car hire operator that we cooperate with has indicated that the customers ask the (not unexpected) “will I make it to this destination” (and back) question, with its more elaborate version of driving “via” certain places. Our design provide the possibility for the customer to play with a number if via points in between the start and stop location (the rental station). When the customer plays with the route, the system provides a
Copyright held by the author(s). AutomotiveUI’13, October 27-30, Eindhoven, The Netherlands. Adjunct Proceedings.
11
Adjunct Proceedings of the 5th International Conference on Automotive User Interfaces and Interactive Vehicular Applications (AutomotiveUI ‚13), October 28–30, 2013, Eindhoven, The Netherlands.
recommendation by giving an approximate degree of confidence (from “this route is easy”, through “drive slow and you will make it”, and all the way to “don’t even think about it”.
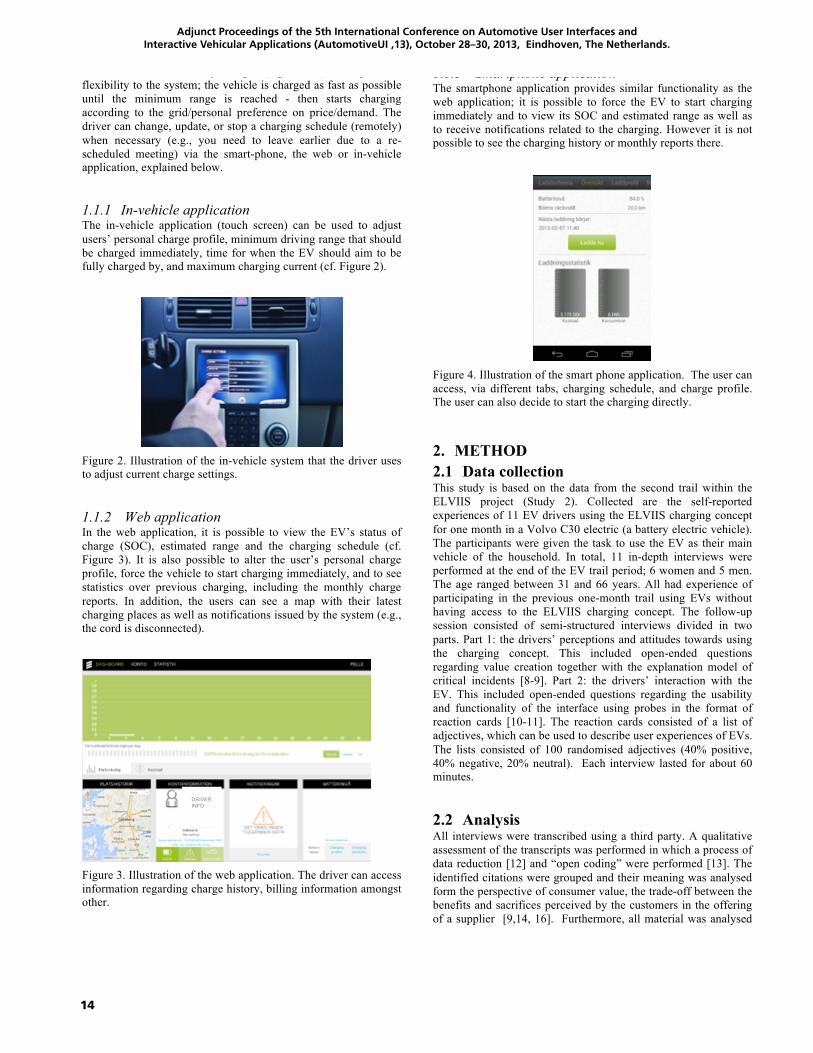
Since we cannot know exactly in advance how a trip will go, it is important to leave space for ambiguity in our design. We have thus decided to show the recommendation as part of a continuum, rather than a precise border (in range/not in range) as employed in our first prototype. Of course, the main difference is that we focus on a given trip rather than “trips in all directions” which is rarely a need, yet it is good for educating users about new technology. Our app for driving aims to take into account the contingencies that one may face during driving and adapt its recommendation to the user depending on the energy left in the battery. This design is grounded in observations of different ways of coping with range problems among experienced PEV drivers [6]. One such coping strategy was to calculate the approximate kWh per km that one can use during driving in order to make it to a destination.
This design omits the map, yet it presents a quasi-geographical representation of several places that the user needs can select in a preferred sequence. During driving it detects “deviations from plan” in relation to the energy spent and helps the driver by e.g. decreasing the “target” kWh per km if too much energy was consumed.
Ambiguity is important in this case as well, since it is difficult to drive with a constant kWh/km, and this indicator, while useful, does not cover aspects such as future needs for heating/air
conditioning in a traffic jam, or future climbing slopes which should require building an energy reserve (thus driving with even higher kWh per km to be able to spare for the coming slope).
We are in the process of instrumenting this app with the on-board-diagnostic connections necessary to test the app during driving. As we will start driving around with this and other apps, we are certain that design improvements will be needed as well as new concept ideas will come about.
During our app design process, we came to see a parallel between driving an electric car on a proposed route with a given amount of energy and riding a bicycle on a proposed route, with the energy expenditure a certain human can usually exert. There are common aspects such as the importance of terrain elevation, as well as differences such as e.g. traffic jams. We are considering designing user interfaces for both cases in parallel and see how the two processes can feed into each other.
3. Design of a field study Our current status is that we have recently got a grant for testing our designs and strategies in practice to verify the impacts that smart apps can have on driving practices and the understanding of range. We hope that the apps can provide better and quicker understanding of energy consumption, range and of how driving style affect these parameters.
Our current study design is a controlled study with half of the informants driving without (an elaborated version of) our driving app, and half of the informants driving with it. Our hypothesis is that drivers using our app use the PEVs to a higher extent and, as they understand and trust the technology more, dare to use the PEV for longer routes or on lower battery levels with less range anxiety.
In order to gather data during the study, but also for our app to work correctly, we have designed our own hardware platform that collect and transmit on-board diagnostic (OBD), as well as position (GPS) information, and uploads this to the cloud.
Data collection will be followed by reflective and contextual interviews with the informants.
4. REFERENCES [1] Cedersund, H. and Lewin, C. 2005. Män och kvinnor i
trafiken: en litteraturstudie.
[2] Eberle, D.U. and von Helmolt, D.R. 2010. Sustainable transportation based on electric vehicle concepts: a brief overview. Energy & Environmental Science. 3, 6 (2010), 689–699.
Car rental app
Educational app.
In-car app.

12
Adjunct Proceedings of the 5th International Conference on Automotive User Interfaces and Interactive Vehicular Applications (AutomotiveUI ‚13), October 28–30, 2013, Eindhoven, The Netherlands.
[3] El-Kady, M.F. and Kaner, R.B. 2013. Scalable fabrication of high-power graphene micro-supercapacitors for flexible and on-chip energy storage. Nature communications. 4, (Feb. 2013), 1475.
[4] Franke, T. et al. 2011. Experiencing Range in an Electric Vehicle: Understanding Psychological Barriers. Applied Psychology: An International Review. (2011), 1–25.
[5] Lundström, A. et al. 2012. Enough power to move: dimensions for representing energy availability. Proc. MobileHCI ’12 (2012), 201–210.
[6] Lundström, A. and Bogdan, C. 2012. COPE1 - Taking Control over EV Range. In adjunct proc. Automitive-UI 2012 (2012), 17–18.
[7] Nilsson, M. 2011. ELECTRIC VEHICLES: An interview study investigating the phenomenon of range anxiety.
[8] Strömberg, H. 2011. Drivers, Electric Cars, and HMI: A Human Factors Approach. In Proceedings from the European Electric Vehicle Congress (2011), 1–9.

13
Adjunct Proceedings of the 5th International Conference on Automotive User Interfaces and Interactive Vehicular Applications (AutomotiveUI ‚13), October 28–30, 2013, Eindhoven, The Netherlands.
Copyright held by the author(s). AutomotiveUI’13, October 27-30, Eindhoven, The Netherlands. Adjunct Proceedings.
Identifying EV driversʼ needs for information communication technology to ease the EV charging
process
Maria Nilsson Viktoria Swedish ICT Lindholmspiren 3A 417 56 Göteborg
+ 46 (0) 70 280 26 16 [email protected]
Azra Habibovic Viktoria Swedish ICT Lindholmspiren 3A 417 56 Göteborg
+ 46 (0) 70 485 55 69 [email protected]
ABSTRACT Known barriers of Electric Vehicles (EVs) include their limited range and, to some extent, the underdeveloped charging infrastructure. This position paper presents initial results from a field study investigating the experience of EV drivers who are supported by a newly developed charging concept (ELVIIS) consisting of a web, smartphone and in-vehicle application. By connecting power grid owner with the telecom and vehicle industry such a solution can be achieved. Presented are the self-reported experiences of 11 EV drivers using Volvo C30 electric, captured via open-ended interviews after the completion of the trail. Highlighted are the user needs for information communication technology (ICT), in particular remote access. It should be noted that the ELVIIS charging concept is used in this position paper as an example to illustrate the need of ICT (e.g., remote access) rather than an evaluation of the overall ELVIIS concept. Further analysis will be performed to evaluate the concept in detail.
Categories and Subject Descriptors H.5 [Information interface and presentation]
General Terms Design, Human Factors,
Keywords User experience, Human machine interaction, electric vehicle, information processing, automotive interface, decision making
1. INTRODUCTION The ELectrical Vehicle Intelligent InfraStructure project (ELVIIS) is a cross-industry project with the goal to ease the charging process of electric vehicles (EVs) by means of Information Communication Technology (ICT), see [1-3, 19]. Two field-studies, in which drivers experienced EVs for one month each, investigated the value of driving EVs (Study 1) and the potential added value of information technology in EVs (Study 2). Reported are initial findings from the second field study (Study 2) performed in 2013, in which the proposed ELVIIS charging concept was tested. The field study focused on 3 aspects of the charging experience, (a) the consumer value of ELVIIS charging concept (i.e., benefits/sacrifices), (b) the experience of range anxiety, and (c) the Human-machine-interaction. In this position
paper, initial findings related to the need for ICT are explored, rather than the overall evaluation of the ELVIIS concept.
1.1 The ELVIIS charging concept The ELVIIS charging concept provides ICT support that enables EV drivers to use any outlet and automatically get the cost added to their own bill (Figure 1), see [1-3,17, 18]. It is hypothesised that the barrier for using private (e.g., a friend’s) and public outlets can thus be decreased by providing the driver an easy way to pay for the electricity used (cf. [4-5]). It is also hypothesised that the uncertainty regarding the EV as a limited resource vehicle decreases by allowing drivers to access and control information related to the charging of the EV, via a web, smartphone and in-vehicle application (cf. [6-7]). More specifically, the mobile telecom network is used to coordinate the charging of vehicles, which increases the efficiency of the grid [18]. The driver decides when the car should be fully charged, the minimum range required to charge immediately, and the current to be used for the charge. The information is sent over the mobile network to a system that determines the best time for charging, based on the lowest cost and current demand on the grid. After that, the cost is added to the driver’s bill, no matter which power outlet is used.
Figure 1. Overview of the ELVIIS concept, illustration inspired by illustration by Ericsson [18]. Step 3 illustrates the role of the driver. The EV driver interacts with the system in three ways: (1) via the in-vehicle application, (2) the web application, or (3) the smart-phone application.
As an EV driver you are typically aware of the range you need for a day. Imagine that you drive about 50 km á day, and you typically leave home roughly about the same time. The ELVIIS system then enables the EV driver to set up a charging schedule accordingly, that determines the minimum range (e.g., 50 km) and
14
Adjunct Proceedings of the 5th International Conference on Automotive User Interfaces and Interactive Vehicular Applications (AutomotiveUI ‚13), October 28–30, 2013, Eindhoven, The Netherlands.
Copyright held by the author(s). AutomotiveUI’13, October 27-30, Eindhoven, The Netherlands. Adjunct Proceedings.
the time it should be fully charged (e.g., 08:00). This provides flexibility to the system; the vehicle is charged as fast as possible until the minimum range is reached - then starts charging according to the grid/personal preference on price/demand. The driver can change, update, or stop a charging schedule (remotely) when necessary (e.g., you need to leave earlier due to a re-scheduled meeting) via the smart-phone, the web or in-vehicle application, explained below.
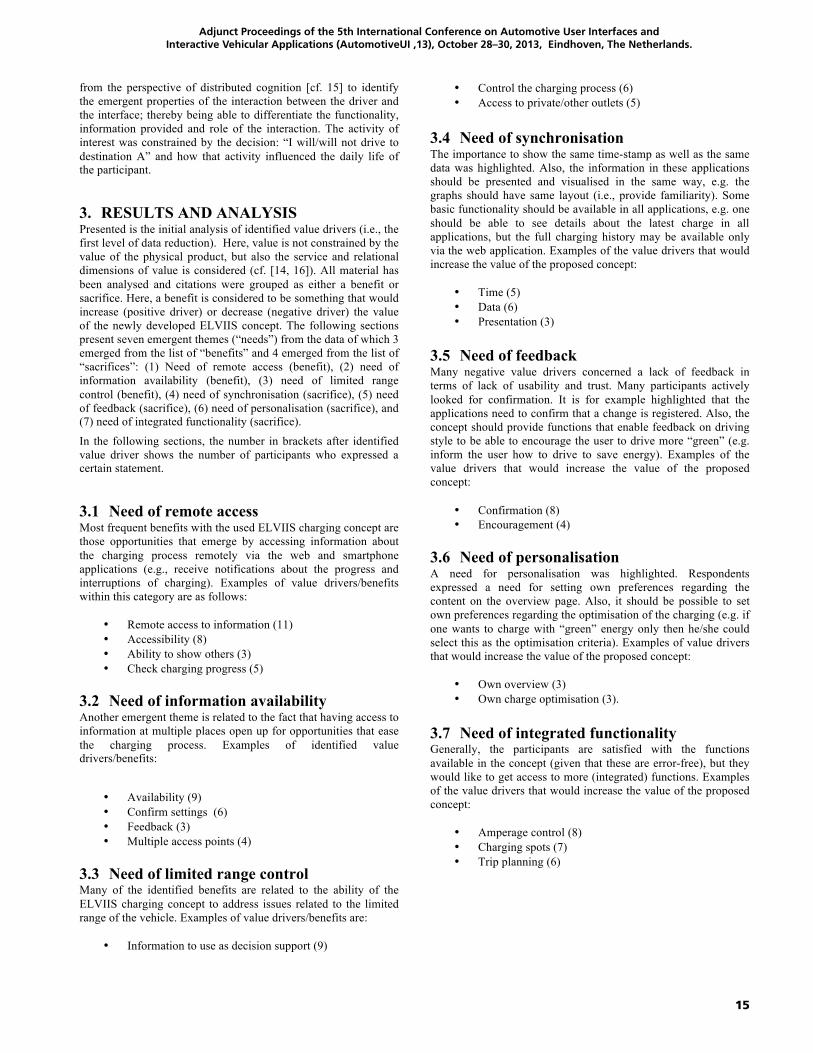
1.1.1 In-vehicle application The in-vehicle application (touch screen) can be used to adjust users’ personal charge profile, minimum driving range that should be charged immediately, time for when the EV should aim to be fully charged by, and maximum charging current (cf. Figure 2).
Figure 2. Illustration of the in-vehicle system that the driver uses to adjust current charge settings.
1.1.2 Web application In the web application, it is possible to view the EV’s status of charge (SOC), estimated range and the charging schedule (cf. Figure 3). It is also possible to alter the user’s personal charge profile, force the vehicle to start charging immediately, and to see statistics over previous charging, including the monthly charge reports. In addition, the users can see a map with their latest charging places as well as notifications issued by the system (e.g., the cord is disconnected).
Figure 3. Illustration of the web application. The driver can access information regarding charge history, billing information amongst other.
1.1.3 Smartphone application The smartphone application provides similar functionality as the web application; it is possible to force the EV to start charging immediately and to view its SOC and estimated range as well as to receive notifications related to the charging. However it is not possible to see the charging history or monthly reports there.
! ! !! !
3.4 Sustainability
This is just a mock-up page that is there to show a concept of benchmarking your Electricity Company towards other Electricity Companies just to make you aware how well you Electricity Company are from a green perspective
On the right side there are a concept to donate X amount of cents / KWh to a good cause.
4 ELVIIS Smartphone App The ELVIIS smartphone app are built for assisting you in managing you charge. It will give you capabilities such as Charge Now, Statistics, Battery Level, Range of the car, Notifications and charge schedule.
4.1 Dashboard
Figure 1. Smartphone dashboard
On the Dashboard you will have a quick overview of a pre-defined set of functions, such as:
Battery Level
Figure 4. Illustration of the smart phone application. The user can access, via different tabs, charging schedule, and charge profile. The user can also decide to start the charging directly.
2. METHOD 2.1 Data collection This study is based on the data from the second trail within the ELVIIS project (Study 2). Collected are the self-reported experiences of 11 EV drivers using the ELVIIS charging concept for one month in a Volvo C30 electric (a battery electric vehicle). The participants were given the task to use the EV as their main vehicle of the household. In total, 11 in-depth interviews were performed at the end of the EV trail period; 6 women and 5 men. The age ranged between 31 and 66 years. All had experience of participating in the previous one-month trail using EVs without having access to the ELVIIS charging concept. The follow-up session consisted of semi-structured interviews divided in two parts. Part 1: the drivers’ perceptions and attitudes towards using the charging concept. This included open-ended questions regarding value creation together with the explanation model of critical incidents [8-9]. Part 2: the drivers’ interaction with the EV. This included open-ended questions regarding the usability and functionality of the interface using probes in the format of reaction cards [10-11]. The reaction cards consisted of a list of adjectives, which can be used to describe user experiences of EVs. The lists consisted of 100 randomised adjectives (40% positive, 40% negative, 20% neutral). Each interview lasted for about 60 minutes.
2.2 Analysis All interviews were transcribed using a third party. A qualitative assessment of the transcripts was performed in which a process of data reduction [12] and “open coding” were performed [13]. The identified citations were grouped and their meaning was analysed form the perspective of consumer value, the trade-off between the benefits and sacrifices perceived by the customers in the offering of a supplier [9,14, 16]. Furthermore, all material was analysed
DRIVER INFO
15
Adjunct Proceedings of the 5th International Conference on Automotive User Interfaces and Interactive Vehicular Applications (AutomotiveUI ‚13), October 28–30, 2013, Eindhoven, The Netherlands.
Copyright held by the author(s). AutomotiveUI’13, October 27-30, Eindhoven, The Netherlands. Adjunct Proceedings.
from the perspective of distributed cognition [cf. 15] to identify the emergent properties of the interaction between the driver and the interface; thereby being able to differentiate the functionality, information provided and role of the interaction. The activity of interest was constrained by the decision: “I will/will not drive to destination A” and how that activity influenced the daily life of the participant.
3. RESULTS AND ANALYSIS Presented is the initial analysis of identified value drivers (i.e., the first level of data reduction). Here, value is not constrained by the value of the physical product, but also the service and relational dimensions of value is considered (cf. [14, 16]). All material has been analysed and citations were grouped as either a benefit or sacrifice. Here, a benefit is considered to be something that would increase (positive driver) or decrease (negative driver) the value of the newly developed ELVIIS concept. The following sections present seven emergent themes (“needs”) from the data of which 3 emerged from the list of “benefits” and 4 emerged from the list of “sacrifices”: (1) Need of remote access (benefit), (2) need of information availability (benefit), (3) need of limited range control (benefit), (4) need of synchronisation (sacrifice), (5) need of feedback (sacrifice), (6) need of personalisation (sacrifice), and (7) need of integrated functionality (sacrifice).
In the following sections, the number in brackets after identified value driver shows the number of participants who expressed a certain statement.
3.1 Need of remote access Most frequent benefits with the used ELVIIS charging concept are those opportunities that emerge by accessing information about the charging process remotely via the web and smartphone applications (e.g., receive notifications about the progress and interruptions of charging). Examples of value drivers/benefits within this category are as follows:
¥ Remote access to information (11) ¥ Accessibility (8) ¥ Ability to show others (3) ¥ Check charging progress (5)
3.2 Need of information availability Another emergent theme is related to the fact that having access to information at multiple places open up for opportunities that ease the charging process. Examples of identified value drivers/benefits:
¥ Availability (9) ¥ Confirm settings (6) ¥ Feedback (3) ¥ Multiple access points (4)
3.3 Need of limited range control Many of the identified benefits are related to the ability of the ELVIIS charging concept to address issues related to the limited range of the vehicle. Examples of value drivers/benefits are:
¥ Information to use as decision support (9)
¥ Control the charging process (6) ¥ Access to private/other outlets (5)
3.4 Need of synchronisation The importance to show the same time-stamp as well as the same data was highlighted. Also, the information in these applications should be presented and visualised in the same way, e.g. the graphs should have same layout (i.e., provide familiarity). Some basic functionality should be available in all applications, e.g. one should be able to see details about the latest charge in all applications, but the full charging history may be available only via the web application. Examples of the value drivers that would increase the value of the proposed concept:
¥ Time (5) ¥ Data (6) ¥ Presentation (3)
3.5 Need of feedback Many negative value drivers concerned a lack of feedback in terms of lack of usability and trust. Many participants actively looked for confirmation. It is for example highlighted that the applications need to confirm that a change is registered. Also, the concept should provide functions that enable feedback on driving style to be able to encourage the user to drive more “green” (e.g. inform the user how to drive to save energy). Examples of the value drivers that would increase the value of the proposed concept:
¥ Confirmation (8) ¥ Encouragement (4)
3.6 Need of personalisation A need for personalisation was highlighted. Respondents expressed a need for setting own preferences regarding the content on the overview page. Also, it should be possible to set own preferences regarding the optimisation of the charging (e.g. if one wants to charge with “green” energy only then he/she could select this as the optimisation criteria). Examples of value drivers that would increase the value of the proposed concept:
¥ Own overview (3) ¥ Own charge optimisation (3).
3.7 Need of integrated functionality Generally, the participants are satisfied with the functions available in the concept (given that these are error-free), but they would like to get access to more (integrated) functions. Examples of the value drivers that would increase the value of the proposed concept:
¥ Amperage control (8) ¥ Charging spots (7) ¥ Trip planning (6)
16
Adjunct Proceedings of the 5th International Conference on Automotive User Interfaces and Interactive Vehicular Applications (AutomotiveUI ‚13), October 28–30, 2013, Eindhoven, The Netherlands.
Copyright held by the author(s). AutomotiveUI’13, October 27-30, Eindhoven, The Netherlands. Adjunct Proceedings.
4. DISCUSSION AND CONCLUSION The presented results highlight the need for extra support regarding the charging process of EV. By evaluating the benefits and sacrifices associated to the ELVIIS concept the initial analysis highlights 7 emergent themes that ease the experience of charging EVs. When participants compared their experiences when charging without support (Study 1) and charging with the support of ELVIIS, several participants (7) stated that charging with the developed ELVIIS charging concept was easier. Indeed, the results show that a great majority of the participants (9 of 11) stated that they would recommend the ELVIIS concept to a friend using an EV, or use it self in an EV. Interestingly, it is noted that the attributes of the information technology used (smartphone, web, in-vehicle application) for presenting the ELVIIS charging concept influence the experience of the concept (e.g., remote access). It is also noted that the charging experience extends time and space and the physical boundary of the vehicle itself. Further studies will evaluate the overall experience of the proposed concept and its possibilities for minimising known barriers of full-scale adoption of EVs.
5. ACKNOWLEDGMENTS This work has been performed within the ELVIIS project, collaboration between Viktoria Swedish ICT, Ericsson, Volvo Cars, and Göteborg Energi, supported by the Region Västra Götaland (VGR), Gothenburg Energy Foundation and Swedish ICT.
REFERENCES [1] Press release. 2012. Ericsson. Available at:
http://www.ericsson.com/res/thecompany/docs/press/media_kits/elviis_content_summary_v6.pdf Last accessed: 2013/08/30
[2] Engadget. 2012. ELVIIS Volvo C30 EV charges from any strandard outlet, bills the driver (hands-on). Available at: http://www.engadget.com/2012/02/28/elviis-volvo-c30-ev-charges-from-any-standard-outlet-bills-the/ Last accessed: 2013/08/30
[3] Autoguide. 2012. Volvo launches ELVIIS to streamline public EV recharging process. Available at: http://www.autoguide.com/auto-news/2012/02/volvo-launches-elviis-to-streamline-public-ev-recharging-process.html Last accessed: 2013/08/30
[4] Boulanger, A., G. Andrew, C. C. Maxx, S., Waltz, D. L. 2011. Electrification: Status and Issues. Proceedings of IEEE, vol 99 No 6.
[5] Egbue, O., Long, S. 2012. Barriers to widespread adoption of electric vehicles: An analysis of consumer attitudes and perceptions. Energy policy 48. 717-729.
[6] Nilsson, M., 2011. Electric Vehicle: The phenomenon of range anxiety. Public deliverable: Task 5000 Available at: http://www.elvire.eu/IMG/pdf/The_phenomenon_of_range_anxiety_ELVIRE.pdf Last accessed: 2013/08/30
[7] Nilsson, M. 2011. Electric vehicles: an interview study investigating the phenomenon of range anxiety. Public deliverable: task 1300. Available at: http://www.elvire.eu/IMG/pdf/An_interview_studyinvestigating_the_phenomenon_of_range_anxiety_ELVIRE-2.pdf Last accessed: 2013/08/30
[8] Gustafsson, A. and Johnson, M. 2003. Competing in a Service Economy: How to Create a Competitive Advantage Through Service Development and Innovation, Jossey-Bass, San Francisco, CA.
[9] Woodruff, R.B. and Gardial, S. (1996). Know Your Customer: New Approaches to Understanding Customer Value and Satisfaction. Cambridge, MA: Blackwell Publishers, 338 pages.
[10] Benedek, J., and Miner, T. 2002. Measuring desirability: New methods for measuring desirability in the usability lab setting. Proceedings of usability professional conference meeting. Available at: http://www.microsoft.com/usability/UEPostings/Desirab ilityToolkit.doc
[11] Barnum and Palmer. 2010. Tapping into Desirability in User Experience. In. Usability of Complex Information Systems: Evaluation of User Interaction. CRC Press. P. 251-267
[12] Miles and Huberman, 1994. Qualitative Data Analysis, 2nd Edition, Sage, Thousand Oaks, California.
[13] Strauss, A. L. and Cobin, J. 1998. Basics of Qualitative Research: Grounded Theory Procedures and Techniques". 2nd edition. Sage publications.
[14] Lapierre, J. 2000. Customer-perceived Value in Industrial Contexts, Journal of Business & Industrial Marketing, Vol. 15 No. 2/3, pp. 122–140.
[15] Nilsson, 2010. Capturing Semi-Automated Decision Making: The methodology of CASADEMA. Dissertation. Örebro University. Available at: http://oru.diva-portal.org/smash/get/diva2:372093/FULLTEXT02 Last accessed: 2013/08/30
[16] Dwyer, F.R., Tanner, J. F. 2002, Business Marketing, 2nd ed., McGraw-Hill, Upper Saddle River, NJ.
[17] Engdahl, H., Fransson, T., Weiefors, H., Pettersson, S. 2011. Evaluation of infrastructure data collection system for electrical vehicle billing and load control.1st International Electric Vehicle Technology Conference, Yokohama, Japan.
[18] Isaksson, O., Fagerholt, A. 2012. Smart charging for electric vehicles. Ericsson Business review. pp 32-36, issue no. 3. Available at:http://www.ericsson.com/res/thecompany/docs/publications/business-review/2012/issue3/smart-charging-for-electric-vehicles.pdf Last accessed: 2013/08/30

17
Adjunct Proceedings of the 5th International Conference on Automotive User Interfaces and Interactive Vehicular Applications (AutomotiveUI ‚13), October 28–30, 2013, Eindhoven, The Netherlands.
Towards a Multisensory Representation of Electromobility Characteristics
Marc Landau Chair of Industrial Design
Technische Universität München [email protected]
Moritz Koerber Institute of Ergonomics
Technische Universität München [email protected]
Sebastian Loehmann HCI Group
University of Munich (LMU) [email protected]
ABSTRACT In this paper, we want to follow up the question, how characteristics of electromobility could be represented in the interior of electric vehicles (EV). For that purpose we followed a user-centered approach to collect intuitive and implicit relationships between some descriptive characters of electromobility and real materials. In a study with 13 participants multisensory 3-dimensional mood-boards representing the users’ point of view were created. Participants were able to sense the materials and their structures and surfaces by vision, touch and smell. Results demonstrate an alternative approach to visualize the users’ preferences for materials and show first impressions of users’ associations with EVs. This can be used as an impulse for engineers and designers to fit the needs of future EV drivers when designing EV interiors.
Categories and Subject Descriptors H.5.m [Information Interfaces and Presentation]: Miscellaneous
General Terms Design, Experimentation
Keywords Multisensory, Haptic, Materials, Aesthetic, Automotive, Electric Vehicle, User-Centered-Design
1. INTRODUCTION Currently, the automotive industry finds itself in a sustainable structural period of transition [2]. The change of mobility has started. With it the future of mobility brings alternative fuels, lightweight constructions, driver automation and a smart vehicle, which is “always on” [10]. In the case of electric technology, this also leads to a different setup and design of the car itself [12]. Besides these novelties, the purpose of a car is perceived as more than getting from one location to another: It is a product with an emotional attraction expressing a certain kind of lifestyle [9], which is especially important for electromobility. But how do current car designs translate these modified requirements? On the one hand, customers should not be frightened with a too futuristic design. On the other hand – as the former BMW designer Chris Bangle said in a slightly provoking manner - most design teams tend not to disengage themselves from a well-known conventional design vocabulary [5]. Subsequently, in this paper we report on a new approach to augment the design of electric vehicle (EV) interiors by choosing materials which
support the customers’ view on electromobility (see Figure 1). We followed a user-centered design approach and tried to answer the question if there are associations in users’ minds connected to electromobility and what they look like. Results show that most participants associate the term “sustainable” with a green artificial turf. Participants argued that turf is organic and a renewable resource. In contrast, the term “innovative” is mostly combined with soft polyvinyl chloride (PVC), because this material is fascinating and not common in every-day life.
Figure 1: The collection of selectable materials
2. RELATED WORK First of all, we will provide insights into user-centered design approaches, the usage of mood-boards and multisensory design. To develop products with a high usability level, Gould and Lewis [4] introduced three fundamental principles. Next to an iterative procedure and an empirical concept verification by the user, they stressed the focus on users and tasks in early stages. To match needs and interests of users even better, Norman advocated a user-centered design philosophy in 1988 [15]. Participative design is an approach to support the active involvement of users in the research and design process. Participative design is part of a user centered design approach including methods such as design workshops, collages and creative toolkits. The findings can lead to inspirations for the design team or even design guidelines [13], [7]. Kansei Engineering focuses on the user as well. It translates the user’s feeling into design specifications [14]. Thereby participants describe their desired product by adjectives. The so collected characteristics are translated into design parameters. This methodology should increase the chance to meet the user needs when launching a product. One important factor is that Kansei includes all senses [3]. The Kansei Engineering method can be used to capture ambiguous demands of users to design car interiors based on their associations [8].
Copyright held by the authors. AutomotiveUI’13, October 27–30, Eindhoven, The Netherlands. Adjunct Proceedings.
18
Adjunct Proceedings of the 5th International Conference on Automotive User Interfaces and Interactive Vehicular Applications (AutomotiveUI ‚13), October 28–30, 2013, Eindhoven, The Netherlands.
To find out more about user requirements (e.g. opinions about a concept car´s interior quality), the user-clinic-method or car-clinic-method is applied in the automotive-industry [1]. With this method, car companies receive useful suggestions and user-associations to improve the product before launching. Mood-boards or image-boards are well-known design tools to visualize mental connections. They help to capture the mood of the user group, provide a source for inspiration and are very important for developing a product-language, which users can understand [6]. Woelfel et al [21] used mood-boards as a visualization tool showing the mental connections of workshop-participants to a certain topic. Participants received 200 pictures and had to decide for only five of them to finally arrange a mood-board. Visualizing information with this approach was perceived as very helpful. Schmitt and Mangold [18] used a multisensory 3D-Model to understand the experiences of customers even better. Important for them was to use realistic stimuli addressing multiple senses. Schifferstein and Cleiren [19] analyzed pros and cons of product experiences by comparing unimodal and multimodal information. One result was that multimodal stimulation seems to make the identification and evaluation of objects easier. In this paper we report on our approach trying to combine parts of the above mentioned methods. It is our goal to visualize mental connections to a certain aspect – in this case electromobility – including not only the sense of vision but also of the touch and smell.
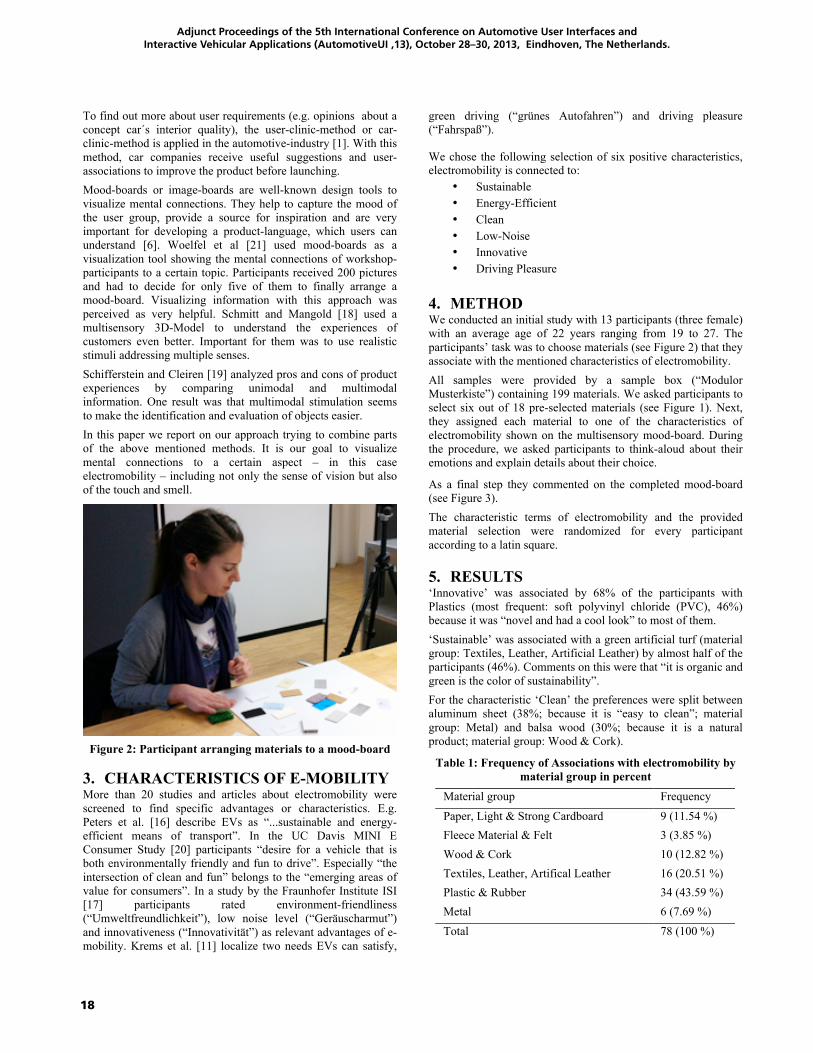
Figure 2: Participant arranging materials to a mood-board
3. CHARACTERISTICS OF E-MOBILITY More than 20 studies and articles about electromobility were screened to find specific advantages or characteristics. E.g. Peters et al. [16] describe EVs as “...sustainable and energy-efficient means of transport”. In the UC Davis MINI E Consumer Study [20] participants “desire for a vehicle that is both environmentally friendly and fun to drive”. Especially “the intersection of clean and fun” belongs to the “emerging areas of value for consumers”. In a study by the Fraunhofer Institute ISI [17] participants rated environment-friendliness (“Umweltfreundlichkeit”), low noise level (“Geräuscharmut”) and innovativeness (“Innovativität”) as relevant advantages of e-mobility. Krems et al. [11] localize two needs EVs can satisfy,
green driving (“grünes Autofahren”) and driving pleasure (“Fahrspaß”).
We chose the following selection of six positive characteristics, electromobility is connected to:
¥ Sustainable ¥ Energy-Efficient ¥ Clean ¥ Low-Noise ¥ Innovative ¥ Driving Pleasure
4. METHOD We conducted an initial study with 13 participants (three female) with an average age of 22 years ranging from 19 to 27. The participants’ task was to choose materials (see Figure 2) that they associate with the mentioned characteristics of electromobility. All samples were provided by a sample box (“Modulor Musterkiste”) containing 199 materials. We asked participants to select six out of 18 pre-selected materials (see Figure 1). Next, they assigned each material to one of the characteristics of electromobility shown on the multisensory mood-board. During the procedure, we asked participants to think-aloud about their emotions and explain details about their choice.
As a final step they commented on the completed mood-board (see Figure 3). The characteristic terms of electromobility and the provided material selection were randomized for every participant according to a latin square.
5. RESULTS ‘Innovative’ was associated by 68% of the participants with Plastics (most frequent: soft polyvinyl chloride (PVC), 46%) because it was “novel and had a cool look” to most of them. ‘Sustainable’ was associated with a green artificial turf (material group: Textiles, Leather, Artificial Leather) by almost half of the participants (46%). Comments on this were that “it is organic and green is the color of sustainability”. For the characteristic ‘Clean’ the preferences were split between aluminum sheet (38%; because it is “easy to clean”; material group: Metal) and balsa wood (30%; because it is a natural product; material group: Wood & Cork).
Table 1: Frequency of Associations with electromobility by material group in percent
Material group Frequency
Paper, Light & Strong Cardboard 9 (11.54 %) Fleece Material & Felt 3 (3.85 %) Wood & Cork 10 (12.82 %) Textiles, Leather, Artifical Leather 16 (20.51 %) Plastic & Rubber 34 (43.59 %) Metal 6 (7.69 %) Total 78 (100 %)

19
Adjunct Proceedings of the 5th International Conference on Automotive User Interfaces and Interactive Vehicular Applications (AutomotiveUI ‚13), October 28–30, 2013, Eindhoven, The Netherlands.
‘Energy-Efficient’ was associated by most of the participants (54%) with Plastics (most frequent: polystrol rigid foam, 23%). The reason for this was mainly “because of its heat insulation and low weight”. Another 31% associated Paper, Light & Strong Cardboard (most frequent: comb-board, 23%), because of their production process using low energy and recyclable materials. ‘Driving-Pleasure’ was associated either with Metal (38%; most frequent: aluminum sheet, 23%) or with Artificial Leather (23%). The given reasons for the former are that the majority of sports cars are made of lightweight material like aluminum. The given reason for the latter is that the interior of cars associated with driving pleasures most of the times contains leather. ‘Low-Noise’ was associated with Plastics (45 %; most frequent: polyerthan light-foam, 23%) or with synthetic needle-felt (23 %; material group: Textiles, Leather, Artificial Leather) or with natural cork (15 %; material group: Wood & Cork). For all of these, participants assumed a high noise restraining quality.
Figure 3: One exemplary multisensory mood-board. The
participant chose the material polystrol rigid foam for the characteristic ‘Energy-Efficient’, the aluminum sheet for ‘Clean’, the artificial turf for ‘Sustainable’, the synthetic
needle-felt for ‘Low-Noise’, the 3D soft-PVC for ‘Innovative’ and artificial leather for the characteristic ‘Driving-Pleasure’
6. CONCLUSION AND FUTURE WORK The aim of this study was to develop a new method to visualize users’ associations and preferences of material regarding electromobility. The results show that there is a great variation in the degree of agreement about associated materials. Participants seem to have a clear view about what materials represent concerning the characteristics ‘Innovative’ or ‘Sustainable’. ‘Innovative’ was clearly associated with Plastics, especially 3D soft PVC. This material seems to be seen as cool and novel. For example, one participant noted: “the material is not common, looks innovative because of that, I have never seen it before”. Another one stated: “looks cool, is novel and modern”. ‘Sustainable’ was associated by most of the participants with artificial turf because of its green color and organic character. Most statements for ‘Sustainable’ were in the manner of the following: “looks like grass, like sustainability and future”.
The associations for the other characteristics were mixed. For ‘Clean’ and ‘Energy-Efficient’, participants either thought about the appliance in the car or about the production process. For example in case of ‘Clean’, Metals are seen as clean because they are easy to clean, but balsa wood was also associated, because it is a natural product. In the same manner, ‘Energy-Efficient’ is either represented by Plastics, because of the assumed high heat insulation in the car, or by Light & Strong Cardboard, because of its energy saving production process. For example, one participant said about the comb-board ”looks as if it is recyclable or was already recycled once”. The associations with ‘Driving-Pleasure’ are strongly influenced by the materials used in sports cars, e.g. aluminum for the chassis and leather for the interior. For instance: “Cars that are a pleasure to drive have always somewhere leather in them”. For the last characteristic, ‘Low-Noise’, materials that are assumed to be noise dampening were chosen, e.g. plastics or synthetics. The given reasons for the choices reveal a first impression of how associations are formed and can be categorized into roughly three categories: the first category are associations based on the look (Innovative, Sustainable), the second category are associations based on the production process (Energy-Efficient, Clean) and the third category are associations based on the appliance in the car (Driving-Pleasure, Low-Noise, Energy-Efficient, Clean). Although, boundaries are not clear, as Energy-Efficient and Clean fit into two categories. However, the interpretation of the results has to be done with care as the sample size of the initial study was small and the range of participants’ age was low. More studies with larger sample sizes and more representative samples should be conducted to confirm or revise the results and to clarify how and why associations between material and characteristics of electromobility are made. The multisensory mood-boards (see Figure 3) can be seen as a tool to communicate associations users have with electromobility. The aim of this paper was not to identify special lightweight materials that could be introduced in electromobility. Instead, the multisensory mood-boards underline the importance of visualizing the users’ preferences as a thought-provoking tool for knowledge generation in industrial design. By the decision to choose real materials, we want to emphasize the importance of tangible expressions. This approach could include, besides the visual perception, also the senses of touch and smell. For representative results of the visualized characters of electromobility it would be reasonable to repeat this study in a larger context in the future. The tool could be applied and verified to other topics as well. Furthermore, it would be interesting to conduct a second study using only paper-based pictures instead of real materials to see if there are any differences in the participants’ associations. This would be a follow-up on an interesting approach from Schifferstein and Cleiren [19] that analyzed the experiences with products using only one modality. This could be especially interesting for the materials that are associated with a characteristic because of their look.

20
Adjunct Proceedings of the 5th International Conference on Automotive User Interfaces and Interactive Vehicular Applications (AutomotiveUI ‚13), October 28–30, 2013, Eindhoven, The Netherlands.
7. REFERENCES [1] Arnold, H., Erner, M., Möckel, P. and Schläffer, C. Applied Technology and Innovation Management. Insights and Experiences from an Industry-Leading Innovation Centre. Springer, Berlin Heidelberg (2010). [2] Becker, H. Darwins Gesetz in der Automobilindustrie: Warum deutsche Hersteller zu den Gewinnern zählen. Springer, Berlin Heidelberg (2010). [3] Beutel, B. Kansei Research and Design. Tennodai, Tsukuba-shi, Kansei Information Laboratory (2010). [4] Gould, J. D. and Lewis, C. Designing for Usability: Key Principles and What Designers Think. Communications of the ACM 28(3): 300–311 (1985). [5] Hengstenberg, M. and Pander, J. „Wir müssen das Auto-Design völlig neu denken“. Ex-BMW-Gestalter Chris Bangle. Spiegel Online. http://www.spiegel.de/auto/fahrkultur/chris-bangle-im-interview-autodesign-muss-emotional-sein-a-892108.html. Last Access 2013-05-03. [6] Heufler, G. Design Basics. Von der Idee zum Produkt. Sulgen / Zürich, Niggli (2004). [7] IDEO. Human Centered Design Toolkit: An Open-Source Toolkit to Inspire New Solutions in the Developing World (2011). [8] Jindo, T. and Hirasago, K. Application studies to car interior of Kansei engineering. International Journal of Industrial Ergonomics 19: 105-114 (1997). [9] Kaiser, O.S., Eickenbusch, H., Grimm, V. and Zweck, A. The future of the car, Zukünftige Technologien Consulting (2008). [10] Kingsley, D. and Urry, J. After the car. John Wiley & Sons (2009). [11] Krems, J.F., Bartholdt, L., Cocron, P., Dielmann, B., Franke, T., Henning, M.J., Ischebeck, M., Schleinitz, K. and Zilyte-Lennertz, M. MINI E powered by Vattenfall V2.0. Schlussbericht zum Forschungsvorhaben Verbundprojekt: MINI
E powered by Vattenfall V2.0. (Abschlussbericht, Förderkennzeichen 16EM0070). Chemnitz: Technische Universität Chemnitz (2011). [12] Kupetz, A. Design E-Mobility. Trend-Dossier zu Design und Elektromobilität. Frankfurt, German Design Council / Zukunftsinstitut GmbH (2012). [13] Martin, B. and Hanington, B. Designmethoden - 100 Recherchemethoden und Analysetechniken für erfolgreiche Gestaltung. München, Stiebner (2013). [14] Nagamachi, M. Kansei/Affective Engineering. Boca Raton, CRC Press/Taylor&Francis Group (2011). [15] Norman, D. The Design of Everyday Things. New York, Basic Books (1988). [16] Peters, A., Agosti, R., Popp, M. and Ryf, B. Electric mobility – a survey of different consumer groups in Germany with regard to adoption. Proceedings to ECEEE Summer Study. Belambra Presqu'île de Giens, France (2011). [17] Peters, A. and Hoffmann, J. Nutzerakzeptanz von Elektromobilität: Eine empirische Studie zu attraktiven Nutzungsvarianten, Fahrzeugkonzepten und Geschäftsmodellen aus Sicht potenzieller Nutzer. Karlsruhe: Fraunhofer ISI (2011). [18] Schmitt, B. H. and Mangold, M. Kundenerlebnis als Wettbewerbsvorteil. Mit Customer Experience Management Marken und Märkte Gewinn bringend gestalten. Wiesbaden, Gabler (2004). [19] Schifferstein, H. N. J. and Cleiren, M. Capturing product experiences: a split-modality approach. Acta Psychologica 118(3): 293-318 (2005). [20] Turrentine, T. S., Garas, D., Lentz, A. and Woodjack, J. The UC Davis MINI E Consumer Study. Institute of Transportation Studies, University of California, Davis, Research Report UCD-ITS-RR-11-05 (2011). [21] Woelfel, C., Krzywinski, J. and Drechsel, F. Knowing, Reasoning and Visualizing in Industrial Design. The Knowledge Engineering Review 0(0): 11-27 (2010).
21
Adjunct Proceedings of the 5th International Conference on Automotive User Interfaces and Interactive Vehicular Applications (AutomotiveUI ‚13), October 28–30, 2013, Eindhoven, The Netherlands.
CLW 2013: The Third Workshop on Cognitive Load and In-Vehicle Human-Machine Interaction
Andrew L. Kun1), Bryan Reimer2), Peter Froehlich3), Peter A. Heeman4),W. Thomas Miller, III1), Paul A. Green5), Ivan Tashev6), Shamsi Iqbal6), Dagmar Kern7)
1) University of New Hampshire [email protected]
2) AgeLab, MIT [email protected]
3) Telecommunications Research Center (FTW)
4) Oregon Health & Science University
[email protected] 5) University of Michigan
Transportation Research Institute [email protected]
6) Microsoft Research [email protected] [email protected]
7) Bertrandt Ingenieurbüro GmbH [email protected]
ABSTRACTInteractions with in-vehicle electronic devices can interfere with the primary task of driving. The concept of cognitive load can help us understand the extent to which these interactions interfere with the driving task and how this interference can be mitigated. The workshop will address cognitive load estimation and management for both driving and interactions with in-vehicle systems, as well as the need for standardizing cognitive load-related concepts and experimental practices.
Categories and Subject DescriptorsH.5.2 Information interfaces and presentation: User Interfaces. H.5.1 Multimedia information systems.
General TermsDesign, Experimentation, Human Factors, Measurement.
KeywordsCognitive load, estimation, management, driving.
1. INTRODUCTIONIn-vehicle human-machine interaction (HMI) can interfere with the primary task of driving. The concept of cognitive load can help us understand the extent to which these interactions interfere with the driving task and how this interference can be mitigated [1]. While multiple definitions of cognitive load (also called cognitive or mental workload) appear in the literature (see [2] for a brief review), it is commonly defined as the relationship between the cognitive demands of a task and the cognitive resources of the user [3]. While research results on in-vehicle cognitive load are frequently presented at automotive research conferences and in related journals, CLW 2013, the third in the series [4], will provide a unique forum for focused discussions on this topic.
2. WORKSHOP GOALS The workshop has four goals:
1. Explore the concept of cognitive load: While the concept of cognitive load has been used by a number of researchers working on in-vehicle HMI (as well as those working in other fields), the definition of cognitive load is still debated. What are the definitions of cognitive load used in industry and academia? How is cognitive load related to different aspects of driving and various in-vehicle secondary tasks? Workshop participants will discuss these questions and will propose their own definitions of cognitive load.
2. Explore issues in cognitive load estimation: In estimating cognitive load (on-road [5, 6] and laboratory-based [7, 8]), researchers and practitioners use three types of measures: performance, physiological and subjective. The workshop will explore the practical use of these measures. Specifically, participants will discuss estimation methods, including details such as measurement equipment, reference tasks, and experimental design.
3. Explore issues in cognitive load management: How can we design in-vehicle HMI such that the driver has the cognitive resources to safely operate the vehicle, even while interacting with in-vehicle devices? Researchers and practitioners have explored a number of approaches for workload management [9], from simply turning off HMI in certain situations, to introducing novel interaction methods which hopefully do not introduce undue cognitive interference with the driving task (voice interfaces [10, 11], augmented reality [12, 13], mediation [14], tactile interfaces [15], subliminal notifications [16], etc.). The workshop will explore various aspects of managing the driver’scognitive load.
4. Explore the need for standardization: In light of current approaches to cognitive load estimation and management, what are the areas of standardization that would be of the greatest benefit to researchers and practitioners? Workshop participants will discuss approaches of interest, including the introduction of standard definitions, toolsets, and corpora, which could
Copyright held by authors AutomotiveUI'13, October 27-30, 2013, Eindhoven, The Netherlands Adjunct Proceedings
22
Adjunct Proceedings of the 5th International Conference on Automotive User Interfaces and Interactive Vehicular Applications (AutomotiveUI ‚13), October 28–30, 2013, Eindhoven, The Netherlands.
be used to make new results replicable and easily compared to the results of others.
The workshop organizers will bring together a number of experts from government, industry, and/or academia to address topics on exploring the concept of cognitive load (goal 1). Furthermore, we will solicit research papers exploring issues in cognitive load estimation and management for interactions with in-vehicle devices (goals 2 and 3). Authors will be encouraged to also include at least one paragraph addressing standardization (goal 4). Additionally, position papers on goal 4 will also be solicited. Topics of interest will include:
Cognitive load estimation in the laboratory,
Cognitive load estimation on the road,
Sensing technologies for cognitive load estimation,
Algorithms for cognitive load estimation,
Performance measures of cognitive load,
Physiological measures of cognitive load,
Visual measures of cognitive load,
Subjective measures of cognitive load,
Methods for benchmarking cognitive load,
Cognitive load of driving,
Cognitive overload and cognitive underload,
Approaches to cognitive load management inspired by human-human interactions.
3. WORKSHOP ORGANIZATION 3.1 Before the Workshop 3.1.1 Program Committee Recruitment The program committee will be recruited from the extensive list of academic and industry contacts of the organizers, in the HCI, speech, ubiquitous computing, and human factors and ergonomics communities. We will primarily target our colleagues who were part of the PC in 2011 and 2012.
3.1.2 Publicity and Soliciting Papers The workshop will be publicized using a dedicated website hosted by the University of New Hampshire. The Call for Papers will be distributed via the following channels:
ACM CHI mailing list,
Ubicomp mailing list,
SIGdial mailing list,
WikiCFP,
HFES Surface Transportation Technical Group Newsletter,
Driving Assessment conference email list;
Contacts of program committee members in their respective fields.
3.1.3 Paper Submission, Review and Selection Papers will be submitted and reviewed using the EasyChair conference management system [17]. This will allow for online
paper submission and simple management of reviewer assignments and feedback. The organizers will make the final paper selection based on reviewer recommendations. Note that EasyChair is a free service hosted by the University of Manchester CS Department; therefore no funding will have to be secured for its operation.
3.1.4 Final Pre-Workshop Activities The list of accepted papers will be posted on the workshop website in early October. The organizers will create a mailing list to distribute accepted papers to workshop participants prior to the workshop. Participants will also be encouraged to use the mailing list to initiate interactions before the workshop.
3.2 During the Workshop 3.2.1 Sessions This all day workshop will start with a keynote address and continue with three sessions.
Keynote by Klaus Bengler. Dr. Bengler is professor at the Technische Universitat Munchen. One of his primary focus areas is in-vehicle human-computer interaction. In his keynote Dr. Bengler will discuss issues of driver availability (underload vs. overload situations). Session 1: Expert presentations on cognitive load and in-vehicle HMI. The first session will feature 2-4 experts who will discuss their views on the concept of cognitive load: what it is, how to estimate it, and what its role is in exploring in-vehicle HMI. The session will include a presentation by Toyota’s James Foley, who will discuss NHTSA guidelines for the design of in-vehicle HMI and their relationship to cognitive load. Session 2: Contributed presentations on cognitive load and in-vehicle HMI. Session 2 will feature oral presentations by workshop participants introducing papers accepted for publication by CLW 2013. The presentations will focus on cognitive load estimation and management, specifically the topics listed at the end of section 2. Session 3: Sharpening our arguments. In the final session we will invite all participants to discuss the contributed presentations (Session 2), especially in light of the keynote and the expert presentations (Session 1). We will offer the following seed questions for this discussion:
1) Are the problems, goals and hypotheses of the contributed presentations well-defined and grounded in existing knowledge? How could they be improved based on the keynote and expert presentations? 2) Did the authors of the contributed presentations consider all interesting questions that are raised by their work? Are there aspects of their discussion and conclusions that could be improved? 3) Are the presented results repeatable? What are the aspects of cognitive load-related research that should be standardized?
3.2.2 Collecting Feedback As in 2011 and 2012, at the end of the workshop organizers will solicit feedback from participants in anonymous written form. Participants will be asked to evaluate the relevance and ultimate value of the workshop using responses on a Likert scale. Suggestions for improvements will also be solicited.
23
Adjunct Proceedings of the 5th International Conference on Automotive User Interfaces and Interactive Vehicular Applications (AutomotiveUI ‚13), October 28–30, 2013, Eindhoven, The Netherlands.
3.3 After the Workshop 3.3.1 Online Report Based on the notes taken during the workshop, the organizers will create a report about the workshop’s outcomes and post it on the workshop website. The organizers will also report on participant evaluations.
3.3.2 White Paper(s) on Future Work The organizers will initiate an effort to prepare a white paper to provide guidance on future work in the field of cognitive load as it relates to in-vehicle HMI. The intended consumers of this guidance are fellow researchers and developers, industry, and funding agencies.
3.3.3 Workshop at AutomotiveUI 2014? Assuming that participant feedback indicates that the workshop was successful, the organizers will contact participants for suggestions for a workshop to be held at AutomotiveUI 2014.
4. ACKNOWLEDGMENTS Work at the University of New Hampshire was supported by the US Department of Justice (grants 2009-D1-BX-K021 and 2010-DD-BX-K226).
5. REFERENCES [1] Paul A. Green. Driver Interface/HMI Standards to Minimize
Driver Distraction/Overload (SAE paper 2008-21-2002). Convergence 2008.
[2] Bruce Mehler, Bryan Reimer and Marin Zec. Defining Workload in the Context of Driver State Detection and HMI Evaluation. AutomotiveUI 2012.
[3] Christopher D. Wickens. Multiple resources and performance prediction. Theoretical Issues in Ergonomics Science, 3(2):159–177, 2002.
[4] CLW website: http://www.auto-ui-cogload.unh.edu/(accessed July 9, 2013)
[5] Bryan Reimer, and Bruce Mehler. The Impact of Cognitive Workload on Physiological Arousal in Young Adult Drivers: A Field Study and Simulation Validation. Ergonomics, 54(10), pp. 932-942, 2011.
[6] Bryan Reimer, Bruce Mehler, Ying Wang, and Joseph F. Coughlin. A Field Study on The Impact of Variations in Short Term Memory Demands on Drivers’ Visual Attention
and Driving Performance Across Three Age Groups. Human Factors, 54(3), pp. 454-468, 2012.
[7] Oskar Palinko, Andrew L. Kun, Alexander Shyrokov, and Peter Heeman. Estimating Cognitive Load Using Remote Eye Tracking in a Driving Simulator. ETRA 2010.
[8] Yun-Cheng Ju and Tim Paek. Using speech to reply to SMS messages while driving: An in-car simulator user study. ACL, 2010.
[9] Paul Green. Driver Distraction, Telematics Design, and Workload Managers: Safety Issues and Solutions. SAE Paper Number 2004-21-0022. Convergence 2004.
[10] Ivan Tashev, Michael Seltzer, Yun-Cheng Ju, Ye-Yi Wang, and Alex Acero. Commute UX: Voice Enabled In-car Infotainment System. MobileHCI '09: Workshop on Speech in Mobile and Pervasive Environments (SiMPE).
[11] Andrew L. Kun, W. Thomas Miller, and William H. Lenharth. Computers in Police Cruisers. IEEE Pervasive Computing, 3(4): 34 – 41, 2004.
[12] Zeljko Medenica, Andrew L. Kun, Tim Paek, and Oskar Palinko. Augmented Reality vs. Street Views: A Driving Simulator Study Comparing Two Emerging Navigation Aids. MobileHCI 2011.
[13] Peter Froehlich, Raimund Schatz, Peter Leitner, Stephan Mantler, and Matthias Baldauf. Evaluating realistic visualizations for safety-related in-car information systems. CHI 2010 Extended Abstracts.
[14] Shamsi T Iqbal, Eric Horvitz, Y.C. Ju, and Ella Mathews. Hang on a Sec! Effects of Proactive Mediation of Phone Conversations while Driving. CHI 2011.
[15] Dagmar Kern, Paul Marshall, Eva Hornecker, Yvonne Rogers and Albrecht Schmidt. Enhancing Navigation Information with Tactile Output Embedded into the Steering Wheel. Pervasive 2009.
[16] Andreas Riener Alois Ferscha, Peter Frech, Michael Hackl and Marius Kaltenberger. Subliminal notification of CO2 emission while driving. AutomotiveUI 2010.
[17] EasyChair Conference Management System, http://www.easychair.org/.
24
Adjunct Proceedings of the 5th International Conference on Automotive User Interfaces and Interactive Vehicular Applications (AutomotiveUI ‚13), October 28–30, 2013, Eindhoven, The Netherlands.
CLW 2013 Keynote Address: Cooperative Driving as a New Paradigm for Highly
Automated Vehicles
Klaus Bengler
Institute of Ergonomics Technische Universität München
Boltzmannstraße 15, 85747 Garching, Germany
ABSTRACTMore than 125 years of automobility remind us that we should be aware of the fact that individual mobility is based on the fact that the driver contributes exceptionally high activity and human performance in the human-vehicle system. Besides improved vehicle technology this human factor is crucial to avoiding accidents in critical situations. However, critical incidents and accidents can often be caused by human error or limited capacity. Since the 90s these effects have been successfully countered with a variety of driver assistance functions. Sensory deficits of the driver and misperceptions are compensated by technical sensors. Drivers use these assistance systems temporarily and shall be assisted in the execution of sub-tasks of the driving task where they remain – following the Vienna Convention – in the supervisory role.
Much of the automotive period is thus characterized by the fact that the driver must manage the driving task for the most part alone and may delegate sub-tasks only for a short time. The great advantage of the car was a significant gain in mobility, based on various assistants, in addition to the additional active safety, leading to sometimes monotonous driving. The potential automation or partial automation of driving is not only more of the same but a radical qualitative and quantitative change in individual mobility, provoking many questions in the area of human factors and human-vehicle interaction.
Copyright held by the author AutomotiveUI'13, October 27-30, 2013, Eindhoven, The Netherlands Adjunct Proceedings
25
Adjunct Proceedings of the 5th International Conference on Automotive User Interfaces and Interactive Vehicular Applications (AutomotiveUI ‚13), October 28–30, 2013, Eindhoven, The Netherlands.
Implications of NHTSA Visual Manual Guidelines to the Design and User Experience of In-vehicle
Interfaces
Tuhin Diptiman Human Factors Group
Toyota Technical Center Ann Arbor, USA
ABSTRACT
NHTSA released visual manual guidelines in 2013 to limit the potential of distracted driving caused by in-vehicle telematics byloosely tying together guidelines published by the Alliance and JAMA, and adding additional parameters such as “per se lockouts”. While the implications to each automotive OEM may vary greatly, these guidelines have the potential to severely limit vehicle cockpit design and user interfaces which are at the core of the driving experience. NHTSA plans to reign in the automakers by increasing the scope and depth of vehicle systems by limiting non-driving tasks such as telematics, navigation, and entertainment to lower than the levels used by the Alliance and by including driving related tasks such as cruise and climate controls.
A caveat – most experts agree that a severely restricted in-vehicle interface will further push the driving population to use the handheld devices which have been documented to be inappropriate for use while driving but which allow for an unrestricted user experience. While the unintended safety implications of a heavily restricted in-vehicle interface and an unrestricted handheld interface is as yet unknown, this area of driver distraction will continue to be the forefront of research and debate for quite a while to come.
Copyright held by the author AutomotiveUI'13, October 27-30, 2013, Eindhoven, The Netherlands Adjunct Proceedings

26
Adjunct Proceedings of the 5th International Conference on Automotive User Interfaces and Interactive Vehicular Applications (AutomotiveUI ‚13), October 28–30, 2013, Eindhoven, The Netherlands.
27
Adjunct Proceedings of the 5th International Conference on Automotive User Interfaces and Interactive Vehicular Applications (AutomotiveUI ‚13), October 28–30, 2013, Eindhoven, The Netherlands.
Warwick-JLR Driver Monitoring Dataset (DMD): A publicDataset for Driver Monitoring Research
Phillip Taylor∗
Dept. Computer ScienceUniversity of WarwickCoventry, CV4 7AL
United [email protected]
Nathan GriffithsDept. Computer Science
University of WarwickCoventry, CV4 7AL
United Kingdom
Abhir BhaleraoDept. Computer Science
University of WarwickCoventry, CV4 7AL
United Kingdom
Derrick WatsonDept. Psychology
University of WarwickCoventry, CV4 7AL
United Kingdom
Xu ZhouJaguar Land Rover
West MidlandsUnited Kingdom
Thomas PophamJaguar Land Rover
West MidlandsUnited Kingdom
ABSTRACTDriving is a safety critical task that requires the full atten-tion of the driver. Despite this, there are many distractionsthroughout a vehicle that can impose extra workload on thedriver, diverting attention from the primary task of drivingsafely. If a vehicle is aware that the driver is currently un-der high workload, the vehicle functionality can be changedin order to minimize any further demand. Traditionally,workload measurements have been performed using intrusivemeans such as physiological sensors. We propose to monitorworkload online using readily available and robust sensorsaccessible via the vehicle’s Controller Area Network (CAN).The purpose of this paper is to outline a protocol to col-lect driver monitoring data and to announce the publicationof a database for driver monitoring research. We proposefive ground truths, namely, timings, Heart Rate (HR), HeartRate Variability (HRV), Skin Conductance Level (SCL), andfrequency of Electrodermal Responses (EDR). The datasetwill be released for public use in both driver monitoring anddata mining research.
KeywordsDriver monitoring, Data collection, EDA, ECG, CAN-bus
1. INTRODUCTIONDriving is a safety critical task that requires the full atten-tion of the driver. Despite this, modern vehicles have manydevices with functions that are not directly related to driv-
∗Contact author for this paper.
Copyright held by the authors.AutomotiveUI’13 October 27-30, Eindhoven, The Netherlands.Adjunct Proceedings.
ing. These devices, such as radio, mobile phones and eveninternet devices, divert cognitive and physical attention fromthe primary task of driving safely. In addition to these dis-tractions, the driver may also be under high workload forother reasons, such as dealing with an incident on the roador holding a conversation in the vehicle. One possible solu-tion to this distraction problem is to limit the functionalityof in-car devices if the driver appears to be overloaded. Thiscan take the form, for example, of withholding an incomingphone call or holding back a non-urgent piece of informationabout traffic or the vehicle status.
It is possible to infer the level of driver workload from obser-vations of the vehicle and the driver. Based on these infer-ences, the vehicle can determine whether or not to presentthe driver with new information that might unnecessarilyadd to their workload. Traditionally, such systems havemonitored physiological signals such as heart rate or skinconductance [3, 13, 7]. However, such approaches are notpractical for everyday use, as drivers cannot be expected toattach electrodes to themselves before driving. Other sys-tems have used image processing for computing the driver’shead position or eye parameters from driver facing cameras,but these are expensive, and unreliable in poor light condi-tions [9].
We therefore use non-intrusive, inexpensive and robust sig-nals, which are already present in vehicles and are accessibleby the Controller Area Network (CAN) [4]. The CAN is acentral bus to which all devices in the vehicle connect andcommunicate by a broadcast protocol. This allows sensorsand actuators to be easily added to the vehicle, enabling thereception and processing of telemetric data from all modulesof the car. This bus and protocol also enables the recordingof these signals, allowing us to perform offline data analysisand mining. In mining this data, we aim to build a systemthat can recognise when a driver is overloaded and then actaccordingly. Our initial work has shown that features ex-tracted from the CAN are able to support machine learningmodels for predicting the cognitive load of a driver [11] or
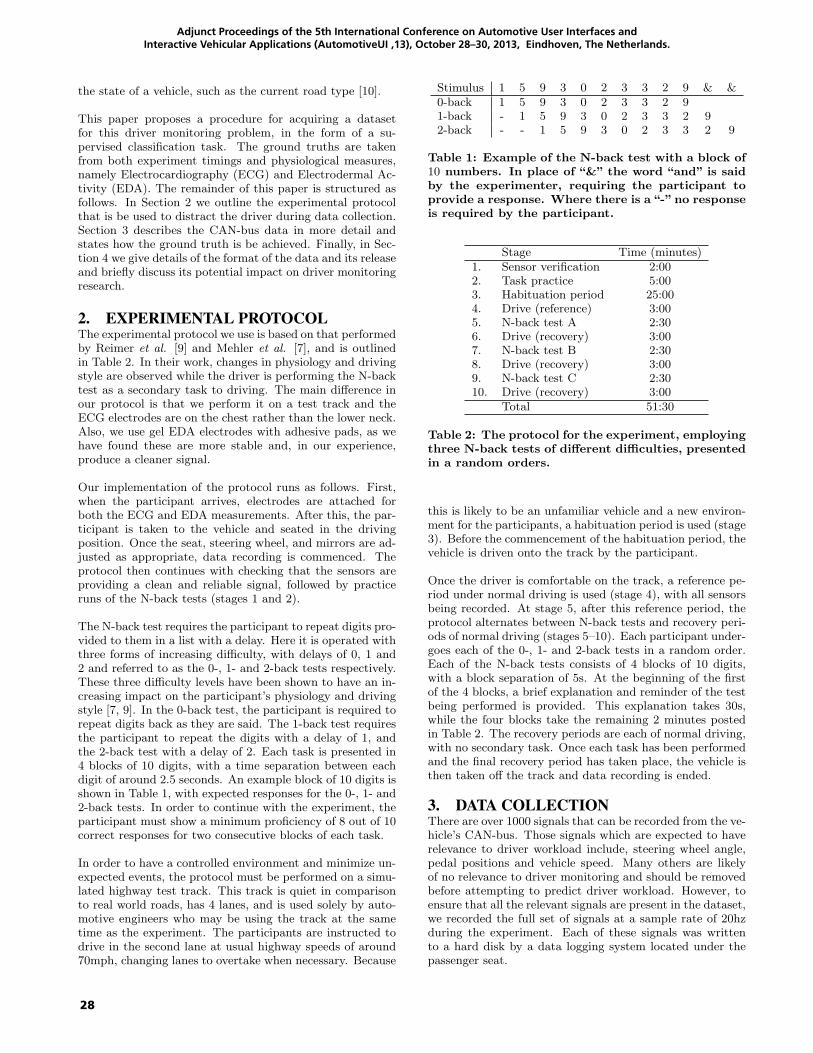
28
Adjunct Proceedings of the 5th International Conference on Automotive User Interfaces and Interactive Vehicular Applications (AutomotiveUI ‚13), October 28–30, 2013, Eindhoven, The Netherlands.
the state of a vehicle, such as the current road type [10].
This paper proposes a procedure for acquiring a datasetfor this driver monitoring problem, in the form of a su-pervised classification task. The ground truths are takenfrom both experiment timings and physiological measures,namely Electrocardiography (ECG) and Electrodermal Ac-tivity (EDA). The remainder of this paper is structured asfollows. In Section 2 we outline the experimental protocolthat is be used to distract the driver during data collection.Section 3 describes the CAN-bus data in more detail andstates how the ground truth is be achieved. Finally, in Sec-tion 4 we give details of the format of the data and its releaseand briefly discuss its potential impact on driver monitoringresearch.
2. EXPERIMENTAL PROTOCOLThe experimental protocol we use is based on that performedby Reimer et al. [9] and Mehler et al. [7], and is outlinedin Table 2. In their work, changes in physiology and drivingstyle are observed while the driver is performing the N-backtest as a secondary task to driving. The main difference inour protocol is that we perform it on a test track and theECG electrodes are on the chest rather than the lower neck.Also, we use gel EDA electrodes with adhesive pads, as wehave found these are more stable and, in our experience,produce a cleaner signal.
Our implementation of the protocol runs as follows. First,when the participant arrives, electrodes are attached forboth the ECG and EDA measurements. After this, the par-ticipant is taken to the vehicle and seated in the drivingposition. Once the seat, steering wheel, and mirrors are ad-justed as appropriate, data recording is commenced. Theprotocol then continues with checking that the sensors areproviding a clean and reliable signal, followed by practiceruns of the N-back tests (stages 1 and 2).
The N-back test requires the participant to repeat digits pro-vided to them in a list with a delay. Here it is operated withthree forms of increasing difficulty, with delays of 0, 1 and2 and referred to as the 0-, 1- and 2-back tests respectively.These three difficulty levels have been shown to have an in-creasing impact on the participant’s physiology and drivingstyle [7, 9]. In the 0-back test, the participant is required torepeat digits back as they are said. The 1-back test requiresthe participant to repeat the digits with a delay of 1, andthe 2-back test with a delay of 2. Each task is presented in4 blocks of 10 digits, with a time separation between eachdigit of around 2.5 seconds. An example block of 10 digits isshown in Table 1, with expected responses for the 0-, 1- and2-back tests. In order to continue with the experiment, theparticipant must show a minimum proficiency of 8 out of 10correct responses for two consecutive blocks of each task.
In order to have a controlled environment and minimize un-expected events, the protocol must be performed on a simu-lated highway test track. This track is quiet in comparisonto real world roads, has 4 lanes, and is used solely by auto-motive engineers who may be using the track at the sametime as the experiment. The participants are instructed todrive in the second lane at usual highway speeds of around70mph, changing lanes to overtake when necessary. Because
Stimulus 1 5 9 3 0 2 3 3 2 9 & &0-back 1 5 9 3 0 2 3 3 2 91-back - 1 5 9 3 0 2 3 3 2 92-back - - 1 5 9 3 0 2 3 3 2 9
Table 1: Example of the N-back test with a block of10 numbers. In place of “&” the word “and” is saidby the experimenter, requiring the participant toprovide a response. Where there is a “-”no responseis required by the participant.
Stage Time (minutes)1. Sensor verification 2:002. Task practice 5:003. Habituation period 25:004. Drive (reference) 3:005. N-back test A 2:306. Drive (recovery) 3:007. N-back test B 2:308. Drive (recovery) 3:009. N-back test C 2:3010. Drive (recovery) 3:00
Total 51:30
Table 2: The protocol for the experiment, employingthree N-back tests of different difficulties, presentedin a random orders.
this is likely to be an unfamiliar vehicle and a new environ-ment for the participants, a habituation period is used (stage3). Before the commencement of the habituation period, thevehicle is driven onto the track by the participant.
Once the driver is comfortable on the track, a reference pe-riod under normal driving is used (stage 4), with all sensorsbeing recorded. At stage 5, after this reference period, theprotocol alternates between N-back tests and recovery peri-ods of normal driving (stages 5–10). Each participant under-goes each of the 0-, 1- and 2-back tests in a random order.Each of the N-back tests consists of 4 blocks of 10 digits,with a block separation of 5s. At the beginning of the firstof the 4 blocks, a brief explanation and reminder of the testbeing performed is provided. This explanation takes 30s,while the four blocks take the remaining 2 minutes postedin Table 2. The recovery periods are each of normal driving,with no secondary task. Once each task has been performedand the final recovery period has taken place, the vehicle isthen taken off the track and data recording is ended.
3. DATA COLLECTIONThere are over 1000 signals that can be recorded from the ve-hicle’s CAN-bus. Those signals which are expected to haverelevance to driver workload include, steering wheel angle,pedal positions and vehicle speed. Many others are likelyof no relevance to driver monitoring and should be removedbefore attempting to predict driver workload. However, toensure that all the relevant signals are present in the dataset,we recorded the full set of signals at a sample rate of 20hzduring the experiment. Each of these signals was writtento a hard disk by a data logging system located under thepassenger seat.
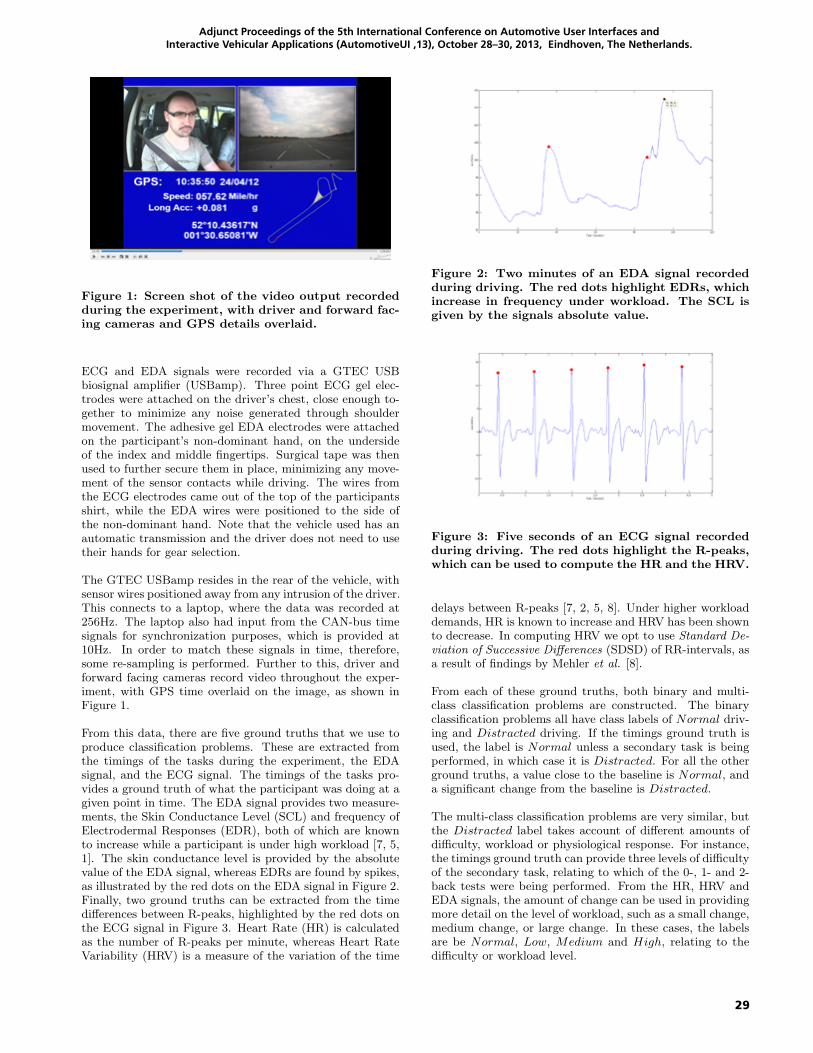
29
Adjunct Proceedings of the 5th International Conference on Automotive User Interfaces and Interactive Vehicular Applications (AutomotiveUI ‚13), October 28–30, 2013, Eindhoven, The Netherlands.
Figure 1: Screen shot of the video output recordedduring the experiment, with driver and forward fac-ing cameras and GPS details overlaid.
ECG and EDA signals were recorded via a GTEC USBbiosignal amplifier (USBamp). Three point ECG gel elec-trodes were attached on the driver’s chest, close enough to-gether to minimize any noise generated through shouldermovement. The adhesive gel EDA electrodes were attachedon the participant’s non-dominant hand, on the undersideof the index and middle fingertips. Surgical tape was thenused to further secure them in place, minimizing any move-ment of the sensor contacts while driving. The wires fromthe ECG electrodes came out of the top of the participantsshirt, while the EDA wires were positioned to the side ofthe non-dominant hand. Note that the vehicle used has anautomatic transmission and the driver does not need to usetheir hands for gear selection.
The GTEC USBamp resides in the rear of the vehicle, withsensor wires positioned away from any intrusion of the driver.This connects to a laptop, where the data was recorded at256Hz. The laptop also had input from the CAN-bus timesignals for synchronization purposes, which is provided at10Hz. In order to match these signals in time, therefore,some re-sampling is performed. Further to this, driver andforward facing cameras record video throughout the exper-iment, with GPS time overlaid on the image, as shown inFigure 1.
From this data, there are five ground truths that we use toproduce classification problems. These are extracted fromthe timings of the tasks during the experiment, the EDAsignal, and the ECG signal. The timings of the tasks pro-vides a ground truth of what the participant was doing at agiven point in time. The EDA signal provides two measure-ments, the Skin Conductance Level (SCL) and frequency ofElectrodermal Responses (EDR), both of which are knownto increase while a participant is under high workload [7, 5,1]. The skin conductance level is provided by the absolutevalue of the EDA signal, whereas EDRs are found by spikes,as illustrated by the red dots on the EDA signal in Figure 2.Finally, two ground truths can be extracted from the timedifferences between R-peaks, highlighted by the red dots onthe ECG signal in Figure 3. Heart Rate (HR) is calculatedas the number of R-peaks per minute, whereas Heart RateVariability (HRV) is a measure of the variation of the time
Figure 2: Two minutes of an EDA signal recordedduring driving. The red dots highlight EDRs, whichincrease in frequency under workload. The SCL isgiven by the signals absolute value.
Figure 3: Five seconds of an ECG signal recordedduring driving. The red dots highlight the R-peaks,which can be used to compute the HR and the HRV.
delays between R-peaks [7, 2, 5, 8]. Under higher workloaddemands, HR is known to increase and HRV has been shownto decrease. In computing HRV we opt to use Standard De-viation of Successive Differences (SDSD) of RR-intervals, asa result of findings by Mehler et al. [8].
From each of these ground truths, both binary and multi-class classification problems are constructed. The binaryclassification problems all have class labels of Normal driv-ing and Distracted driving. If the timings ground truth isused, the label is Normal unless a secondary task is beingperformed, in which case it is Distracted. For all the otherground truths, a value close to the baseline is Normal, anda significant change from the baseline is Distracted.
The multi-class classification problems are very similar, butthe Distracted label takes account of different amounts ofdifficulty, workload or physiological response. For instance,the timings ground truth can provide three levels of difficultyof the secondary task, relating to which of the 0-, 1- and 2-back tests were being performed. From the HR, HRV andEDA signals, the amount of change can be used in providingmore detail on the level of workload, such as a small change,medium change, or large change. In these cases, the labelsare be Normal, Low, Medium and High, relating to thedifficulty or workload level.
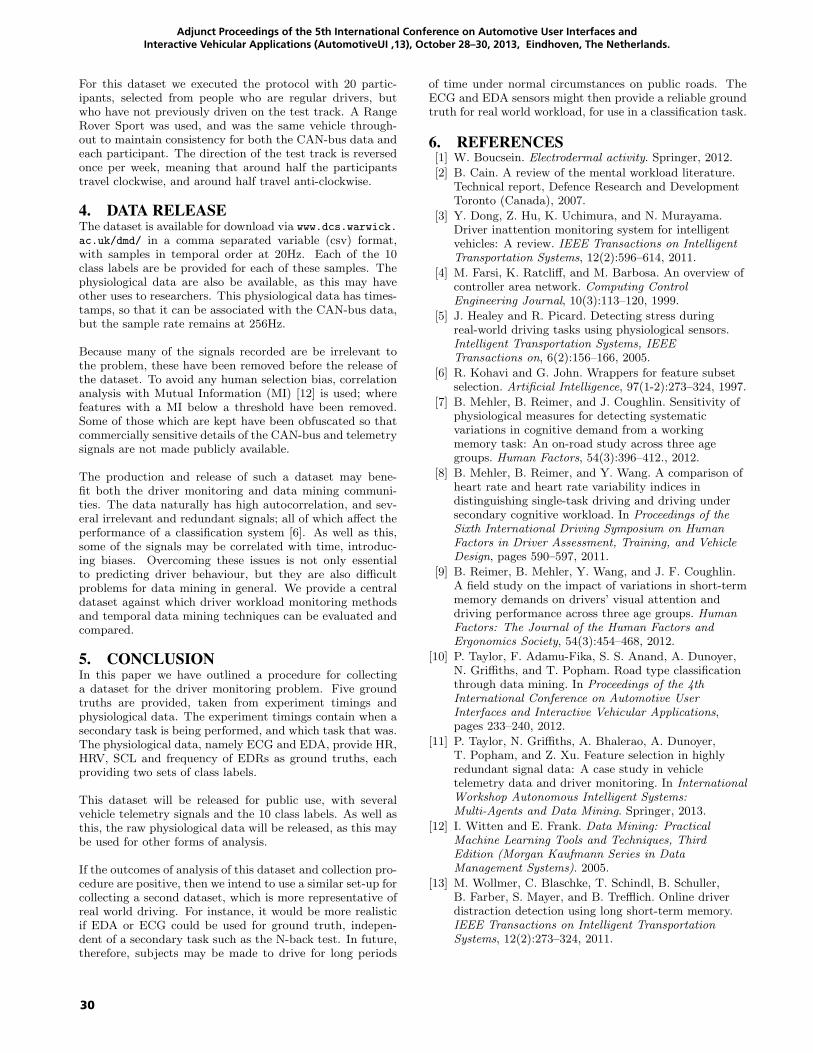
30
Adjunct Proceedings of the 5th International Conference on Automotive User Interfaces and Interactive Vehicular Applications (AutomotiveUI ‚13), October 28–30, 2013, Eindhoven, The Netherlands.
For this dataset we executed the protocol with 20 partic-ipants, selected from people who are regular drivers, butwho have not previously driven on the test track. A RangeRover Sport was used, and was the same vehicle through-out to maintain consistency for both the CAN-bus data andeach participant. The direction of the test track is reversedonce per week, meaning that around half the participantstravel clockwise, and around half travel anti-clockwise.
4. DATA RELEASEThe dataset is available for download via www.dcs.warwick.
ac.uk/dmd/ in a comma separated variable (csv) format,with samples in temporal order at 20Hz. Each of the 10class labels are be provided for each of these samples. Thephysiological data are also be available, as this may haveother uses to researchers. This physiological data has times-tamps, so that it can be associated with the CAN-bus data,but the sample rate remains at 256Hz.
Because many of the signals recorded are be irrelevant tothe problem, these have been removed before the release ofthe dataset. To avoid any human selection bias, correlationanalysis with Mutual Information (MI) [12] is used; wherefeatures with a MI below a threshold have been removed.Some of those which are kept have been obfuscated so thatcommercially sensitive details of the CAN-bus and telemetrysignals are not made publicly available.
The production and release of such a dataset may bene-fit both the driver monitoring and data mining communi-ties. The data naturally has high autocorrelation, and sev-eral irrelevant and redundant signals; all of which affect theperformance of a classification system [6]. As well as this,some of the signals may be correlated with time, introduc-ing biases. Overcoming these issues is not only essentialto predicting driver behaviour, but they are also difficultproblems for data mining in general. We provide a centraldataset against which driver workload monitoring methodsand temporal data mining techniques can be evaluated andcompared.
5. CONCLUSIONIn this paper we have outlined a procedure for collectinga dataset for the driver monitoring problem. Five groundtruths are provided, taken from experiment timings andphysiological data. The experiment timings contain when asecondary task is being performed, and which task that was.The physiological data, namely ECG and EDA, provide HR,HRV, SCL and frequency of EDRs as ground truths, eachproviding two sets of class labels.
This dataset will be released for public use, with severalvehicle telemetry signals and the 10 class labels. As well asthis, the raw physiological data will be released, as this maybe used for other forms of analysis.
If the outcomes of analysis of this dataset and collection pro-cedure are positive, then we intend to use a similar set-up forcollecting a second dataset, which is more representative ofreal world driving. For instance, it would be more realisticif EDA or ECG could be used for ground truth, indepen-dent of a secondary task such as the N-back test. In future,therefore, subjects may be made to drive for long periods
of time under normal circumstances on public roads. TheECG and EDA sensors might then provide a reliable groundtruth for real world workload, for use in a classification task.
6. REFERENCES[1] W. Boucsein. Electrodermal activity. Springer, 2012.
[2] B. Cain. A review of the mental workload literature.Technical report, Defence Research and DevelopmentToronto (Canada), 2007.
[3] Y. Dong, Z. Hu, K. Uchimura, and N. Murayama.Driver inattention monitoring system for intelligentvehicles: A review. IEEE Transactions on IntelligentTransportation Systems, 12(2):596–614, 2011.
[4] M. Farsi, K. Ratcliff, and M. Barbosa. An overview ofcontroller area network. Computing ControlEngineering Journal, 10(3):113–120, 1999.
[5] J. Healey and R. Picard. Detecting stress duringreal-world driving tasks using physiological sensors.Intelligent Transportation Systems, IEEETransactions on, 6(2):156–166, 2005.
[6] R. Kohavi and G. John. Wrappers for feature subsetselection. Artificial Intelligence, 97(1-2):273–324, 1997.
[7] B. Mehler, B. Reimer, and J. Coughlin. Sensitivity ofphysiological measures for detecting systematicvariations in cognitive demand from a workingmemory task: An on-road study across three agegroups. Human Factors, 54(3):396–412., 2012.
[8] B. Mehler, B. Reimer, and Y. Wang. A comparison ofheart rate and heart rate variability indices indistinguishing single-task driving and driving undersecondary cognitive workload. In Proceedings of theSixth International Driving Symposium on HumanFactors in Driver Assessment, Training, and VehicleDesign, pages 590–597, 2011.
[9] B. Reimer, B. Mehler, Y. Wang, and J. F. Coughlin.A field study on the impact of variations in short-termmemory demands on drivers’ visual attention anddriving performance across three age groups. HumanFactors: The Journal of the Human Factors andErgonomics Society, 54(3):454–468, 2012.
[10] P. Taylor, F. Adamu-Fika, S. S. Anand, A. Dunoyer,N. Griffiths, and T. Popham. Road type classificationthrough data mining. In Proceedings of the 4thInternational Conference on Automotive UserInterfaces and Interactive Vehicular Applications,pages 233–240, 2012.
[11] P. Taylor, N. Griffiths, A. Bhalerao, A. Dunoyer,T. Popham, and Z. Xu. Feature selection in highlyredundant signal data: A case study in vehicletelemetry data and driver monitoring. In InternationalWorkshop Autonomous Intelligent Systems:Multi-Agents and Data Mining. Springer, 2013.
[12] I. Witten and E. Frank. Data Mining: PracticalMachine Learning Tools and Techniques, ThirdEdition (Morgan Kaufmann Series in DataManagement Systems). 2005.
[13] M. Wollmer, C. Blaschke, T. Schindl, B. Schuller,B. Farber, S. Mayer, and B. Trefflich. Online driverdistraction detection using long short-term memory.IEEE Transactions on Intelligent TransportationSystems, 12(2):273–324, 2011.
31
Adjunct Proceedings of the 5th International Conference on Automotive User Interfaces and Interactive Vehicular Applications (AutomotiveUI ‚13), October 28–30, 2013, Eindhoven, The Netherlands.
PHYSIOPRINT: A Workload Assessment Tool Based on Physiological Signals
Djordje Popovic, Maja Stikic, Chris Berka Advanced Brain Monitoring Inc. 2237 Faraday Ave, Suite 100
Carlsbad, CA, 92008
{dpopovic,maja,chris}@b-alert.com
David Klyde, Theodore Rosenthal Systems Technologies Inc.
13766 Hawtorne Blvd. Hawtorne, CA
{dklyde, trosenthal}@systemstech.com
ABSTRACT
In this paper we introduce a novel workload assessment tool
(called PHYSIOPRINT) that is based on the combination of two
types of physiological signals: electroencephalography (EEG) and
electrocardiography (ECG). The tool is inspired by a theoretical
workload model developed by the US Army that covers a large
number of different workload types relevant for driving scenarios,
including auditory, visual, cognitive, and motor workload. The
PHYSIOPRINT classifier was trained on the EEG and ECG data
acquired during well-defined atomic tasks chosen to represent the
corresponding types of workload. The trained model was
validated on realistic driving simulator data from an independent
study. The highest performance on the atomic tasks was achieved
for visual workload, with precision of 91.8% and recall of 94.1%.
The corresponding classification results in the validation study
were: precision 78.3% and recall 80.6%. The utilized
classification approach is not computationally expensive, so it can
be easily integrated into automotive applications.
Categories and Subject Descriptors
H.1.2 [Information Systems]: User/Machine Systems – human
factors, human information processing, software psychology.
General Terms
Algorithms, Measurement, Performance, Experimentation.
Keywords
Workload, electroencephalography, electrocardiography, driving
simulator, physiology.
1. INTRODUCTION Due to the rapid advances in technology and related changes in
consumers' lifestyles and expectations, the motor vehicle industry
will likely continue to integrate more sophisticated entertainment
and information systems in new vehicles. The increasing
complexity of interactions with in-vehicle equipment and the
unprecedented amount of information streaming from these
devices, however, create a palpable threat that drivers might find
themselves overloaded with information that distracts them from
the primary task of driving. This persistent and, in many cases,
self-inflicted mental strain may cause driving performance
decrements and lead to a substantial increase in the number of
accidents with potentially grave consequences. One way to
mitigate this issue is to study the driver's interactions with new in-
vehicle technologies and use that knowledge to optimize system
design and operating procedures. In order to accomplish this goal,
we need an unobtrusive and objective measure of the driver's
workload that not only quantifies average workload levels over
long periods of time, but is also able to continuously capture
workload variations throughout the task.
Workload is typically defined as the amount of mental or physical
resources required to perform a particular task [19]. Its
quantification is, unfortunately, difficult in practice because each
individual's capacity of available resources varies greatly, as do
the strategies for using them. The standard techniques used for
workload assessment include self-report scales, performance-
based metrics, and physiological arousal measures. Self-report
measures are popular due to their low cost and consistency,
though the latter quality assumes that the individual is cooperative
and capable of introspection and accurate reporting of their
perceived workload. Some of these scales are one-dimensional
such as the Rating Scale of Mental Effort (RMSE) [24] and the
Modified Cooper-Harper scale (MHC) [6], whereas some scales
comprise subscales that measure specific mental resources, e.g.,
NASA Task Load Index (TLX) [9], Subjective Workload
Assessment Technique (SWAT) [17], and Visual Auditory
Cognitive Psychomotor method (VACP) [23]. The major
drawback of these measures is that they cannot be unobtrusively
administered during the task itself, but are assessed
retrospectively at the conclusion of the task, which decreases
accuracy of this technique. Furthermore, the inherent subjectivity
of self-ratings makes across-subjects comparisons difficult. Self-
report scales are, therefore, often complemented with an objective
assessment of performance; this operates on the assumption that
an increased workload diminishes performance. Performance
measures include reaction time to different events, accuracy of
responses, and overall driving performance such as steering wheel
angle or lane position. The performance assessment is relatively
unobtrusive and can be accomplished in real time at low cost as an
indicator of actual workload level. Performance, however, is not
sensitive enough to workload changes due to the complex
relationship between the two variables. Performance is typically
stable across a range of workload levels and deteriorates only near
the extremes [18]. Moreover, performance measures cannot tap
into all cognitive resources with comparable accuracy. Lately,
there has been renewed interest in physiological measures as
useful metrics for assessing workload. Their use was limited in
the past by the obtrusive nature of earlier instrumentation, but this
has changed with the advent of miniaturized sensors and
embedded platforms capable of supporting complex signal
processing techniques. Typically used physiological signals to
derive measures of workload include: electrooculography (EOG)
[7], electromyography (EMG) [22], pupil diameter [11],
electrocardiography [20], respiration [5], electroencephalography
[3], and skin conductance [19]. In some studies, physiological
measures have been reported as being more sensitive to the initial
changes in workload than performance-based measures, as they
Copyright held by the authors.
AutomotiveUI’13, October 27–30, Eindhoven, The Netherlands.
Adjunct Proceedings.
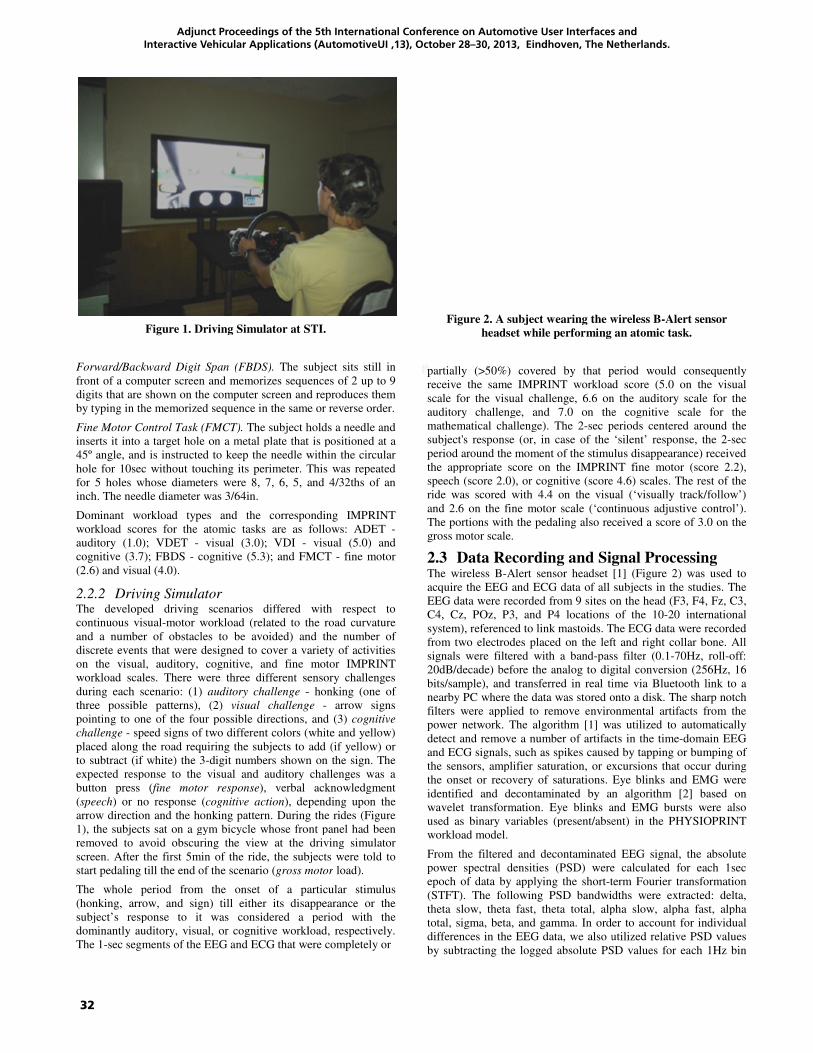
32
Adjunct Proceedings of the 5th International Conference on Automotive User Interfaces and Interactive Vehicular Applications (AutomotiveUI ‚13), October 28–30, 2013, Eindhoven, The Netherlands.
Figure 1. Driving Simulator at STI.
Forward/Backward Digit Span (FBDS). The subject sits still in
front of a computer screen and memorizes sequences of 2 up to 9
digits that are shown on the computer screen and reproduces them
by typing in the memorized sequence in the same or reverse order.
Fine Motor Control Task (FMCT). The subject holds a needle and
inserts it into a target hole on a metal plate that is positioned at a
45º angle, and is instructed to keep the needle within
hole for 10sec without touching its perimeter. Th
for 5 holes whose diameters were 8, 7, 6, 5, and 4/32ths of an
inch. The needle diameter was 3/64in.
Dominant workload types and the corresponding IMPRINT
workload scores for the atomic tasks are as follows: ADET
auditory (1.0); VDET - visual (3.0); VDI -
cognitive (3.7); FBDS - cognitive (5.3); and FMCT
(2.6) and visual (4.0).
2.2.2 Driving Simulator The developed driving scenarios differed with respect to
continuous visual-motor workload (related to the road curvature
and a number of obstacles to be avoided) and the number of
discrete events that were designed to cover a variety of
on the visual, auditory, cognitive, and fine motor IMPRINT
workload scales. There were three different sensory challenges
during each scenario: (1) auditory challenge -
three possible patterns), (2) visual challenge
pointing to one of the four possible directions, and
challenge - speed signs of two different colors (white and yellow)
placed along the road requiring the subjects to add (if
to subtract (if white) the 3-digit numbers shown on the sign.
expected response to the visual and auditory
button press (fine motor response), verbal acknowledgment
(speech) or no response (cognitive action), depending
arrow direction and the honking pattern. During the rides
1), the subjects sat on a gym bicycle whose front panel had been
removed to avoid obscuring the view at the driving simulator
screen. After the first 5min of the ride, the subjects were told to
start pedaling till the end of the scenario (gross motor
The whole period from the onset of a particular stimulus
(honking, arrow, and sign) till either its disappearance or the
subject’s response to it was considered a period with the
dominantly auditory, visual, or cognitive workload, respectively.
The 1-sec segments of the EEG and ECG that were completely or
Driving Simulator at STI.
The subject sits still in
front of a computer screen and memorizes sequences of 2 up to 9
that are shown on the computer screen and reproduces them
typing in the memorized sequence in the same or reverse order.
The subject holds a needle and
plate that is positioned at a
within the circular
This was repeated
8, 7, 6, 5, and 4/32ths of an
Dominant workload types and the corresponding IMPRINT
tomic tasks are as follows: ADET -
visual (5.0) and
and FMCT - fine motor
The developed driving scenarios differed with respect to
load (related to the road curvature
and a number of obstacles to be avoided) and the number of
designed to cover a variety of activities
isual, auditory, cognitive, and fine motor IMPRINT
There were three different sensory challenges
- honking (one of
visual challenge - arrow signs
the four possible directions, and (3) cognitive
speed signs of two different colors (white and yellow)
e subjects to add (if yellow) or
numbers shown on the sign. The
d response to the visual and auditory challenges was a
), verbal acknowledgment
), depending upon the
arrow direction and the honking pattern. During the rides (Figure
ts sat on a gym bicycle whose front panel had been
the view at the driving simulator
the subjects were told to
gross motor load).
eriod from the onset of a particular stimulus
sign) till either its disappearance or the
subject’s response to it was considered a period with the
ognitive workload, respectively.
were completely or
Figure 2. A subject wearing the wireless B
headset while performing an atomic task.
partially (>50%) covered by that period would consequently
receive the same IMPRINT workload
scale for the visual challenge, 6.6 on the auditory scale for the
auditory challenge, and 7.0 on the cognitive scale for the
mathematical challenge). The 2-sec periods centered around the
subject's response (or, in case of the
period around the moment of the stimulus disappearance) received
the appropriate score on the IMPRINT fine motor (score 2.2),
speech (score 2.0), or cognitive (score 4.6) s
ride was scored with 4.4 on the visual (‘visua
and 2.6 on the fine motor scale (‘continuous adjustive control’).
The portions with the pedaling also received a score of 3.0 on the
gross motor scale.
2.3 Data Recording and Signal ProcessingThe wireless B-Alert sensor headset [
acquire the EEG and ECG data of all subjects in the studies.
EEG data were recorded from 9 sites on the head (F3, F4, Fz, C3,
C4, Cz, POz, P3, and P4 locations of
system), referenced to link mastoids. The ECG data were recorded
from two electrodes placed on the left and right collar bone.
signals were filtered with a band-pass filter
20dB/decade) before the analog to digital conversion
bits/sample), and transferred in real time via Bl
nearby PC where the data was stored onto a disk. T
filters were applied to remove environmental artifacts from the
power network. The algorithm [1] was utilized to automatically
detect and remove a number of artifacts in the time
and ECG signals, such as spikes caused by tapping or bumpi
the sensors, amplifier saturation, or excursions that occur during
the onset or recovery of saturations. Eye blinks and EMG were
identified and decontaminated by an algorithm [2
wavelet transformation. Eye blinks and EMG bursts were also
used as binary variables (present/absent) in the PHYSIOPRINT
workload model.
From the filtered and decontaminated EEG signal, the
power spectral densities (PSD) were calculated for each 1sec
epoch of data by applying the short-term Fourier transformation
(STFT). The following PSD bandwidths were ex
theta slow, theta fast, theta total, alpha slow, alpha fast, alpha
total, sigma, beta, and gamma. In order to account for individual
differences in the EEG data, we also utilized relative PSD values
by subtracting the logged absolute PSD values
A subject wearing the wireless B-Alert sensor
headset while performing an atomic task.
period would consequently
workload score (5.0 on the visual
scale for the visual challenge, 6.6 on the auditory scale for the
auditory challenge, and 7.0 on the cognitive scale for the
periods centered around the
‘silent’ response, the 2-sec
period around the moment of the stimulus disappearance) received
the appropriate score on the IMPRINT fine motor (score 2.2),
or cognitive (score 4.6) scales. The rest of the
cored with 4.4 on the visual (‘visually track/follow’)
and 2.6 on the fine motor scale (‘continuous adjustive control’).
received a score of 3.0 on the
Data Recording and Signal Processing Alert sensor headset [1] (Figure 2) was used to
acquire the EEG and ECG data of all subjects in the studies. The
EEG data were recorded from 9 sites on the head (F3, F4, Fz, C3,
C4, Cz, POz, P3, and P4 locations of the 10-20 international
The ECG data were recorded
from two electrodes placed on the left and right collar bone. All
pass filter (0.1-70Hz, roll-off:
20dB/decade) before the analog to digital conversion (256Hz, 16
real time via Bluetooth link to a
where the data was stored onto a disk. The sharp notch
filters were applied to remove environmental artifacts from the
] was utilized to automatically
artifacts in the time-domain EEG
ikes caused by tapping or bumping of
the sensors, amplifier saturation, or excursions that occur during
the onset or recovery of saturations. Eye blinks and EMG were
by an algorithm [2] based on
Eye blinks and EMG bursts were also
used as binary variables (present/absent) in the PHYSIOPRINT
From the filtered and decontaminated EEG signal, the absolute
were calculated for each 1sec
term Fourier transformation
ollowing PSD bandwidths were extracted: delta,
theta slow, theta fast, theta total, alpha slow, alpha fast, alpha
In order to account for individual
differences in the EEG data, we also utilized relative PSD values
by subtracting the logged absolute PSD values for each 1Hz bin
show increased activation before the appearance of significant
performance decrements [13]. This makes them more suitable for
driving scenarios as they allow for an appropriate and timely
intervention or mitigation. However, physiological workload
measures have multiple drawbacks. First, the physiological
workload scales are often derived empirically on a set of tasks
assumed to represent different workload levels and selected ad
hoc, without detailed consideration of their ecological validity and
ability to tap into different mental resources (e.g., cognitive,
visual, auditory, or motor workload). As a result, the models
trained on such atomic tasks may not perform well when applied
to the physiological signals acquired during other non-atomic
tasks even though they seemingly require the same mental
resources. Second, in spite of the well known fact of considerable
between- and within-subject variability of nearly all physiological
signals and metrics, the majority of physiological workload
models have been developed and validated on a relatively small
sample of subjects. Third, the classifiers used in the models
introduced hitherto have typically lacked mechanisms for an
adjustment of the model’s parameters in relation to individual
traits, which leads to models that do not generalize well. Finally,
the models have mostly ignored the considerable amount of noise
inherent in the acquired physiological signals. Thus, poor
performance of some models could be attributed to their reliance
on rather simple mathematical apparatus.
This paper introduces PHYSIOPRINT - a workload model based
on the physiological measures of EEG and ECG that is built
around a well defined and established theoretical workload model
called Improved Performance Research Integration Tool
(IMPRINT) [14]. The proposed model is able to distinguish
between different workload types relevant for driving by
incorporating complementary sensor modalities. The model is
trained on a relatively large sample size, and it takes into
consideration individual differences in physiological signals. The
trained model is validated on an independent dataset recorded in a
realistic driving simulator. Moreover, the utilized classification
approach is not computationally expensive, so it is applicable in
real time on a fine timescale.
The rest of the paper is organized as follows. In Section 2 we
outline the experimental setting while Section 3 reports on the
experimental results. Finally, in Section 4, we summarize our
results and give an outlook on future work.
2. METHODS In this section, we introduce the IMPRINT theoretical workload
model that is used as a basis for the workload classes our
PHYSIOPRINT workload model aims to classify. We also outline
our study protocol, including both atomic and non-atomic tasks
utilized for training and testing of the model, respectively. Lastly,
we detail acquisition system together with the signal processing,
data analysis, and evaluation procedures.
2.1 IMPRINT Workload Model The IMPRINT Workload Model was developed by the Army
Research Laboratory (ARL) [14] and it discriminates between
seven types of workload: visual, auditory, cognitive, fine motor,
gross motor, speech, and tactile. Each workload type is further
quantified on a pertinent ordinal/interval scale, similar to the
VACP scales [12]. Each of the seven scales is defined by a set of
behaviors of increasing complexity that are associated with a
numeric value between 0 and 7. Tasks and activities that mobilize
more than one type of the mental resources receive separate
independent scores on each of the relevant scales. Furthermore,
for each point in time, IMPRINT produces a composite measure
of the overall workload, which is defined as a weighted sum of the
type-specific workload values calculated across all tasks that are
being simultaneously performed. The weights in the formula
describe the strength of all possible interactions (referred to as
conflicts) between different workload types and/or different tasks.
The IMPRINT model has been successfully applied to estimate
mental workload in a number of settings of military relevance,
including a strike fighter jet [4], a mounted combat system [16],
and the Abrams tank [15]. As the model covers a large number of
workload types, it is well-suited for the driving environment,
which also employs distinct workload types. In this initial
classifier development phase, we explored only a subset of the
IMPRINT workload types: visual, auditory, cognitive, and fine
motor.
2.2 Study Protocol The PHYSIOPRINT workload classifier was developed and
validated on the physiological data (EEG and ECG) acquired in
two separate studies.
In the first study, physiological signals of 40 young healthy
volunteers (17 females; age 26 ± 3 years) were recorded during
four or five atomic tasks used for PHYSIOPRINT training to
discriminate between the four IMPRINT workload types of
interest: auditory, visual, cognitive, and fine motor. All subjects
performed the auditory, visual, and cognitive tasks, while only a
subset of 22 subjects also completed the fine motor control task.
Each 1-sec segment of each task was assigned a score on each of
the four scales. There was a dominant workload type in each
atomic task, and the majority of 1-sec segments received a single
non-zero workload score.
In the second study, six 10min scenarios were designed for the
driving simulator by Systems Technologies Inc (STI). The
physiological data recorded during these tasks were used for
validation of the PHYSIOPRINT workload model. A total of 10
subjects took part in the experiment. The six test rides were taken
in a random order, following a training ride at the beginning of the
experiment. The rest period between the trials was 5min. The
subjects also completed each atomic task once prior to the test
rides. Again, all performed tasks were scored on each of the
analyzed workload scales. Furthermore, the subjects provided
self-reports of each driving scenario's difficulty after completion
of the experiment.
2.2.1 Atomic Tasks The atomic tasks were designed with the IMPRINT workload
scales in mind. The goal for each task was to represent the
corresponding workload type as closely as possible by engaging
only the necessary mental resources to increase purity of the
training data. The following atomic tasks were utilized:
Auditory Detection Task (ADET). The subject sits still for 5min in
front of a blank computer screen and presses a button after
hearing a beep.
Visual Detection Task (VDET). The subject sits still for 5min in
front of a computer screen and presses a button whenever a
geometrical shape appears on the screen.
Visual Discrimination Task (VDI). The subject sits still for 20min
in front of a computer screen and presses a button if one target
shape out of three possible geometrical shapes is shown on the
computer screen. The shapes are randomly interspersed over time
(the target shape is presented 70% of the time), and inter-stimulus
interval ranges between 1.5sec and 10sec.
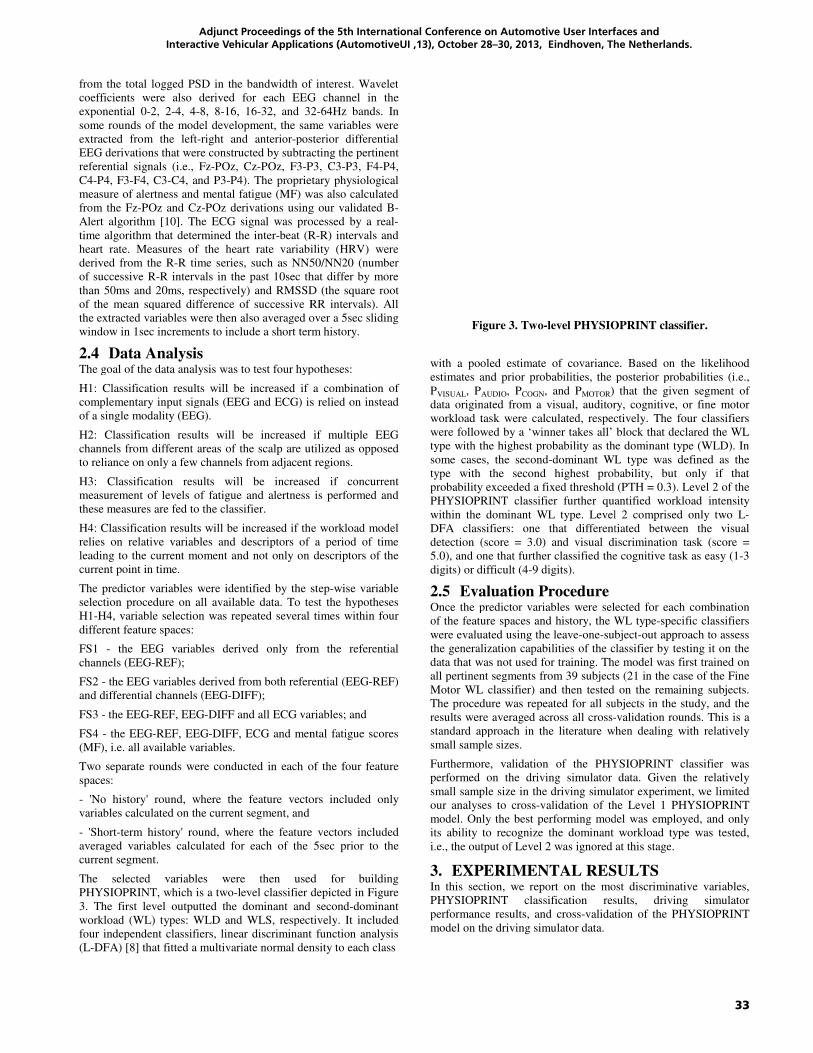
33
Adjunct Proceedings of the 5th International Conference on Automotive User Interfaces and Interactive Vehicular Applications (AutomotiveUI ‚13), October 28–30, 2013, Eindhoven, The Netherlands.
from the total logged PSD in the bandwidth of interest
coefficients were also derived for each EEG channel
exponential 0-2, 2-4, 4-8, 8-16, 16-32, and 32
some rounds of the model development, the same variables were
extracted from the left-right and anterior-posterior differential
EEG derivations that were constructed by subtracting the pertinent
referential signals (i.e., Fz-POz, Cz-POz, F3-P3, C3
C4-P4, F3-F4, C3-C4, and P3-P4). The proprietary
measure of alertness and mental fatigue (MF) was also calculated
from the Fz-POz and Cz-POz derivations using o
Alert algorithm [10]. The ECG signal was processed by a real
time algorithm that determined the inter-beat (R
heart rate. Measures of the heart rate variability (HRV) were
derived from the R-R time series, such as NN50/NN20 (number
of successive R-R intervals in the past 10sec that differ by more
than 50ms and 20ms, respectively) and RMSSD (the square root
of the mean squared difference of successive RR intervals).
the extracted variables were then also averaged over a 5
window in 1sec increments to include a short term history
2.4 Data Analysis The goal of the data analysis was to test four hypotheses:
H1: Classification results will be increased if a combination of
complementary input signals (EEG and ECG) is relied on instead
of a single modality (EEG).
H2: Classification results will be increased if multiple EEG
channels from different areas of the scalp are utilized as opposed
to reliance on only a few channels from adjacent region
H3: Classification results will be increased if concurrent
measurement of levels of fatigue and alertness is performed and
these measures are fed to the classifier.
H4: Classification results will be increased if the workload model
relies on relative variables and descriptors of a period of time
leading to the current moment and not only on descriptors of the
current point in time.
The predictor variables were identified by the step
selection procedure on all available data. To test the hypotheses
H1-H4, variable selection was repeated several times within
different feature spaces:
FS1 - the EEG variables derived only from the referential
channels (EEG-REF);
FS2 - the EEG variables derived from both referential (EEG
and differential channels (EEG-DIFF);
FS3 - the EEG-REF, EEG-DIFF and all ECG variables; and
FS4 - the EEG-REF, EEG-DIFF, ECG and mental fatigue scores
(MF), i.e. all available variables.
Two separate rounds were conducted in each of the four feature
spaces:
- 'No history' round, where the feature vectors included only
variables calculated on the current segment, and
- 'Short-term history' round, where the feature vectors included
averaged variables calculated for each of the 5sec
current segment.
The selected variables were then used for building
PHYSIOPRINT, which is a two-level classifier depicted in Figure
3. The first level outputted the dominant and
workload (WL) types: WLD and WLS, respectively
four independent classifiers, linear discriminant function analysis
(L-DFA) [8] that fitted a multivariate normal density to each
of interest. Wavelet
were also derived for each EEG channel in the
, and 32-64Hz bands. In
the same variables were
posterior differential
were constructed by subtracting the pertinent
P3, C3-P3, F4-P4,
The proprietary physiological
mental fatigue (MF) was also calculated
POz derivations using our validated B-
The ECG signal was processed by a real-
beat (R-R) intervals and
Measures of the heart rate variability (HRV) were
such as NN50/NN20 (number
that differ by more
than 50ms and 20ms, respectively) and RMSSD (the square root
of the mean squared difference of successive RR intervals). All
averaged over a 5sec sliding
to include a short term history.
The goal of the data analysis was to test four hypotheses:
will be increased if a combination of
signals (EEG and ECG) is relied on instead
will be increased if multiple EEG
channels from different areas of the scalp are utilized as opposed
to reliance on only a few channels from adjacent regions.
will be increased if concurrent
measurement of levels of fatigue and alertness is performed and
will be increased if the workload model
relies on relative variables and descriptors of a period of time
leading to the current moment and not only on descriptors of the
step-wise variable
To test the hypotheses
was repeated several times within four
the EEG variables derived only from the referential
variables derived from both referential (EEG-REF)
DIFF and all ECG variables; and
, ECG and mental fatigue scores
ounds were conducted in each of the four feature
' round, where the feature vectors included only
' round, where the feature vectors included
calculated for each of the 5sec prior to the
The selected variables were then used for building
level classifier depicted in Figure
second-dominant
, respectively. It included
four independent classifiers, linear discriminant function analysis
a multivariate normal density to each class
Figure 3. Two-level PHYSIOPRINT classifier.
with a pooled estimate of covariance.
estimates and prior probabilities, the posterior probabilities (
PVISUAL, PAUDIO, PCOGN, and PMOTOR)
data originated from a visual, auditory, cognitive, o
workload task were calculated, respectively
were followed by a ‘winner takes all’ block that declared the
type with the highest probability as the dominant type (WLD). In
some cases, the second-dominant WL
type with the second highest probability
probability exceeded a fixed threshold (PTH = 0.3).
PHYSIOPRINT classifier further quantified workload intensity
within the dominant WL type. Level 2
DFA classifiers: one that differentiated between the visual
detection (score = 3.0) and visual discrimination task (score
5.0), and one that further classified the cognitive task as easy (1
digits) or difficult (4-9 digits).
2.5 Evaluation Procedure Once the predictor variables were selected for each combination
of the feature spaces and history, the WL type
were evaluated using the leave-one-subject
the generalization capabilities of the classifier by testi
data that was not used for training. The model w
all pertinent segments from 39 subjects (21 in the case of the Fine
Motor WL classifier) and then tested
The procedure was repeated for all subjects
results were averaged across all cross-
standard approach in the literature when dealing with relatively
small sample sizes.
Furthermore, validation of the PHYSIOPRINT classifier was
performed on the driving simulator data.
small sample size in the driving simulator
our analyses to cross-validation of the
model. Only the best performing model was employed, and only
its ability to recognize the dominant workload type was teste
i.e., the output of Level 2 was ignored at this stage
3. EXPERIMENTAL RESULTSIn this section, we report on the most discriminative variables,
PHYSIOPRINT classification results, driving simulator
performance results, and cross-validation of the PHYSIOPRINT
model on the driving simulator data.
level PHYSIOPRINT classifier.
variance. Based on the likelihood
es, the posterior probabilities (i.e.,
) that the given segment of
data originated from a visual, auditory, cognitive, or fine motor
, respectively. The four classifiers
were followed by a ‘winner takes all’ block that declared the WL
type with the highest probability as the dominant type (WLD). In
WL type was defined as the
type with the second highest probability, but only if that
a fixed threshold (PTH = 0.3). Level 2 of the
PHYSIOPRINT classifier further quantified workload intensity
type. Level 2 comprised only two L-
classifiers: one that differentiated between the visual
detection (score = 3.0) and visual discrimination task (score =
that further classified the cognitive task as easy (1-3
Once the predictor variables were selected for each combination
of the feature spaces and history, the WL type-specific classifiers
subject-out approach to assess
capabilities of the classifier by testing it on the
he model was first trained on
all pertinent segments from 39 subjects (21 in the case of the Fine
on the remaining subjects.
subjects in the study, and the
-validation rounds. This is a
standard approach in the literature when dealing with relatively
Furthermore, validation of the PHYSIOPRINT classifier was
ing simulator data. Given the relatively
driving simulator experiment, we limited
validation of the Level 1 PHYSIOPRINT
model was employed, and only
dominant workload type was tested,
at this stage.
RESULTS we report on the most discriminative variables,
PHYSIOPRINT classification results, driving simulator
validation of the PHYSIOPRINT
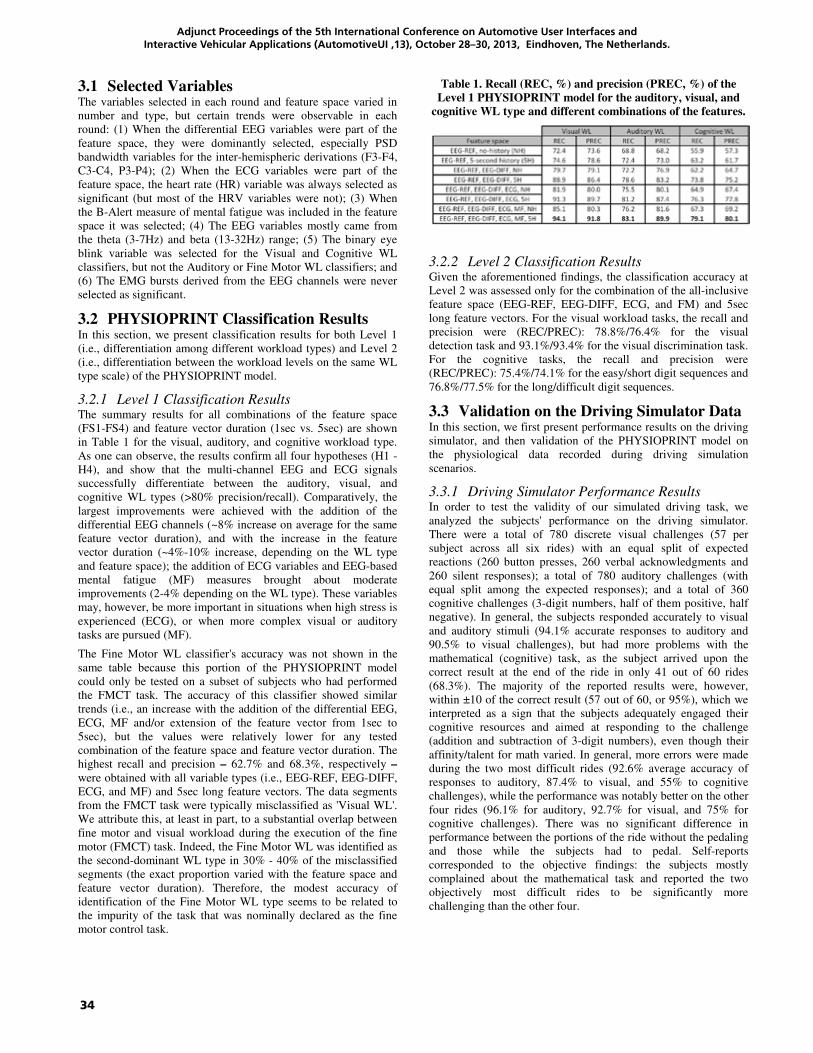
34
Adjunct Proceedings of the 5th International Conference on Automotive User Interfaces and Interactive Vehicular Applications (AutomotiveUI ‚13), October 28–30, 2013, Eindhoven, The Netherlands.
3.1 Selected Variables The variables selected in each round and feature space varied in
number and type, but certain trends were observable in each
round: (1) When the differential EEG variables were part of the
feature space, they were dominantly selected, especially PSD
bandwidth variables for the inter-hemispheric derivations (F3-F4,
C3-C4, P3-P4); (2) When the ECG variables were part of the
feature space, the heart rate (HR) variable was always selected as
significant (but most of the HRV variables were not); (3) When
the B-Alert measure of mental fatigue was included in the feature
space it was selected; (4) The EEG variables mostly came from
the theta (3-7Hz) and beta (13-32Hz) range; (5) The binary eye
blink variable was selected for the Visual and Cognitive WL
classifiers, but not the Auditory or Fine Motor WL classifiers; and
(6) The EMG bursts derived from the EEG channels were never
selected as significant.
3.2 PHYSIOPRINT Classification Results In this section, we present classification results for both Level 1
(i.e., differentiation among different workload types) and Level 2
(i.e., differentiation between the workload levels on the same WL
type scale) of the PHYSIOPRINT model.
3.2.1 Level 1 Classification Results The summary results for all combinations of the feature space
(FS1-FS4) and feature vector duration (1sec vs. 5sec) are shown
in Table 1 for the visual, auditory, and cognitive workload type.
As one can observe, the results confirm all four hypotheses (H1 -
H4), and show that the multi-channel EEG and ECG signals
successfully differentiate between the auditory, visual, and
cognitive WL types (>80% precision/recall). Comparatively, the
largest improvements were achieved with the addition of the
differential EEG channels (~8% increase on average for the same
feature vector duration), and with the increase in the feature
vector duration (~4%-10% increase, depending on the WL type
and feature space); the addition of ECG variables and EEG-based
mental fatigue (MF) measures brought about moderate
improvements (2-4% depending on the WL type). These variables
may, however, be more important in situations when high stress is
experienced (ECG), or when more complex visual or auditory
tasks are pursued (MF).
The Fine Motor WL classifier's accuracy was not shown in the
same table because this portion of the PHYSIOPRINT model
could only be tested on a subset of subjects who had performed
the FMCT task. The accuracy of this classifier showed similar
trends (i.e., an increase with the addition of the differential EEG,
ECG, MF and/or extension of the feature vector from 1sec to
5sec), but the values were relatively lower for any tested
combination of the feature space and feature vector duration. The
highest recall and precision – 62.7% and 68.3%, respectively –
were obtained with all variable types (i.e., EEG-REF, EEG-DIFF,
ECG, and MF) and 5sec long feature vectors. The data segments
from the FMCT task were typically misclassified as 'Visual WL'.
We attribute this, at least in part, to a substantial overlap between
fine motor and visual workload during the execution of the fine
motor (FMCT) task. Indeed, the Fine Motor WL was identified as
the second-dominant WL type in 30% - 40% of the misclassified
segments (the exact proportion varied with the feature space and
feature vector duration). Therefore, the modest accuracy of
identification of the Fine Motor WL type seems to be related to
the impurity of the task that was nominally declared as the fine
motor control task.
Table 1. Recall (REC, %) and precision (PREC, %) of the
Level 1 PHYSIOPRINT model for the auditory, visual, and
cognitive WL type and different combinations of the features.
3.2.2 Level 2 Classification Results Given the aforementioned findings, the classification accuracy at
Level 2 was assessed only for the combination of the all-inclusive
feature space (EEG-REF, EEG-DIFF, ECG, and FM) and 5sec
long feature vectors. For the visual workload tasks, the recall and
precision were (REC/PREC): 78.8%/76.4% for the visual
detection task and 93.1%/93.4% for the visual discrimination task.
For the cognitive tasks, the recall and precision were
(REC/PREC): 75.4%/74.1% for the easy/short digit sequences and
76.8%/77.5% for the long/difficult digit sequences.
3.3 Validation on the Driving Simulator Data In this section, we first present performance results on the driving
simulator, and then validation of the PHYSIOPRINT model on
the physiological data recorded during driving simulation
scenarios.
3.3.1 Driving Simulator Performance Results In order to test the validity of our simulated driving task, we
analyzed the subjects' performance on the driving simulator.
There were a total of 780 discrete visual challenges (57 per
subject across all six rides) with an equal split of expected
reactions (260 button presses, 260 verbal acknowledgments and
260 silent responses); a total of 780 auditory challenges (with
equal split among the expected responses); and a total of 360
cognitive challenges (3-digit numbers, half of them positive, half
negative). In general, the subjects responded accurately to visual
and auditory stimuli (94.1% accurate responses to auditory and
90.5% to visual challenges), but had more problems with the
mathematical (cognitive) task, as the subject arrived upon the
correct result at the end of the ride in only 41 out of 60 rides
(68.3%). The majority of the reported results were, however,
within ±10 of the correct result (57 out of 60, or 95%), which we
interpreted as a sign that the subjects adequately engaged their
cognitive resources and aimed at responding to the challenge
(addition and subtraction of 3-digit numbers), even though their
affinity/talent for math varied. In general, more errors were made
during the two most difficult rides (92.6% average accuracy of
responses to auditory, 87.4% to visual, and 55% to cognitive
challenges), while the performance was notably better on the other
four rides (96.1% for auditory, 92.7% for visual, and 75% for
cognitive challenges). There was no significant difference in
performance between the portions of the ride without the pedaling
and those while the subjects had to pedal. Self-reports
corresponded to the objective findings: the subjects mostly
complained about the mathematical task and reported the two
objectively most difficult rides to be significantly more
challenging than the other four.

35
Adjunct Proceedings of the 5th International Conference on Automotive User Interfaces and Interactive Vehicular Applications (AutomotiveUI ‚13), October 28–30, 2013, Eindhoven, The Netherlands.
3.3.2 Classification of Driving Simulator Data with
PHYSIOPRINT Workload Model The PHYSIOPRINT classification accuracy was in general
slightly lower on the data from the driving simulator study than it
had been on the atomic tasks. Recall and precision (REC/PREC)
during the periods with dominantly visual workload were 80.6%
and 78.3% across all subjects and rides. Recall and precision
during the periods with dominantly auditory workload were
71.5% and 73.6%, whereas recall and precision during the periods
with dominantly cognitive workload were only 64.7% and 62.1%.
When the PHYSIOPRINT classifier was applied to the subject's
atomic tasks (i.e., VDET, VDI, FBDS, and ADET), accuracy
increased (REC/PREC: 85.2%/78.3% for the VDET+VDI tasks,
74.9%/77.3% for the ADET task, and 76.3%/75.7% for the
cognitive FBDS task). The classification accuracy was, on
average, ~5% worse during the portions with the pedaling, which
suggested that changes in heart rate and heart rate variability have
relatively modest effects on this version of the classifier. The drop
in performance could not be attributed to an increased level of
noise in the signals (asserted by visual inspection). The modest
increase in the classification accuracy when the classifier was
applied to the atomic tasks on which the model was trained
(VDET, VDI, ADET, and FDBS) suggested that the between-
subject variability played a role, but was not the only or major
reason for the drop in classification accuracy in the driving
simulator study. It is possible that the overlap between the
different workload types throughout the majority of the ride
confused the classifier, and that the results could improve once
more sophisticated mechanisms for detection and resolutions of
such conflicts are built into the classifier.
4. SUMMARY AND OUTLOOK The current study sought to develop a physiologically-based
method for workload assessment applicable in the challenging
automotive setting. We addressed this need by designing a
comprehensive, sensitive, and multifaceted workload assessment
tool that incorporates the already established theoretical workload
framework that both: (1) covers the different types of workload
employed in complex tasks such as driving, and (2) helps define
the necessary atomic tasks for building the model. The
experimental results suggested that the classifier benefits from
combination of complementary input signals (EEG and ECG),
better coverage of the scalp regions by an increased number of
EEG channels, inclusion of concurrent physiological
measurement of fatigue and alertness levels, and short-term signal
history. We aimed to overcome the individual variability inherent
in the physiological data by including the relative PSD variables
in the feature vector. The generalization capability of the trained
model was tested by using leave-one-subject-out cross-validation,
as well as testing the model on the independent driving simulator
dataset. The proposed method demonstrated that integration of
physiological monitoring into automotive settings holds great
promise for real time assessment of the driver's workload.
In the future, we plan to extend the model to cover all workload
types (visual, auditory, cognitive, fine motor, gross motor, speech,
and tactile) together with the corresponding workload intensity
level subscales from the IMPRINT workload model. In order to
achieve this, we need to design new atomic tasks carefully. We
must also refine the existing tasks, especially the FMCT task that
proved not ideal for representing pure fine motor activity.
Additional physiologically based inputs, such as EOG, EMG,
respiration, and stress levels will also be included to enable better
insight into activations of different workload types. Alternative
classification algorithms such as multi-label learning [21] will be
evaluated to facilitate the process of resolving the conflicts
between different workload types. The final global workload
score will be a composite measure of all seven resource-specific
workload type scores (analogous to the overall IMPRINT
workload score). The weights will be designed in a way that also
considers the influence of environmental factors, workload
management strategies, and other individual traits and their effect
on the overall engagement level of mental resources. The
classifier will be validated on a larger sample of subjects
performing a variety of tasks in both laboratory and real-life
environments (i.e., real car).
The ultimate PHYSIOPRINT workload assessment tool is
envisioned as a flexible software platform that consists of three
main components: (1) an executable that runs on a dedicated local
(client) machine to acquire multiple physiological signals from
one or more subjects, processes them in real time, and determines
global and resource-specific workload on a fine time scale; (2) a
large server-based database of physiological signals acquired
during relevant atomic tasks from a large number of subjects with
different socio-demographic and other characteristics (e.g., degree
of driving experience); and (3) a palette of real-time signal
processing, feature extraction, and workload classification
algorithms. The platform will support a number of recording
devices from a wide range of vendors (via the appropriate device
drivers), and enable visualization of the workload measures. The
users will essentially be able to build their own workload
assessment methods from the available building blocks of feature
extraction methods and implemented classifiers. Initially, the
database will include 100-150 subjects, but we envision that the
database will continue to evolve as the community grows in the
following years.
5. ACKNOWLEDGMENTS This work was supported by the Army Research Laboratory grant
W91CRB-13-C-0007. The authors would like to thank Stephanie
Korszen for her excellent editing advice.
6. REFERENCES [1] Berka, C., Levendowski, D.J., Cvetinovic, M.M., Petrovic,
M.M., Davis, G., Lumicao, M.N., Zivkovic, V.T., Popovic,
M.V., Olmstead, R. 2004. Real-Time Analysis of EEG
Indexes of Alertness, Cognition, and Memory Acquired With
a Wireless EEG Headset. International Journal of Human-
Computer Interaction. 17, 151-170.
[2] Berka, C., Levendowski, D.J., Lumicao, M.N., Yau, A.,
Davis, G., Zivkovic, V.T., Olmstead, R.E., Tremoulet, P.D.,
Craven, P.L. 2007. EEG Correlates of Task Engagement and
Mental Workload in Vigilance, Learning, and Memory
Tasks. Aviation, Space, and Environmental Medicine. 78,
231-244.
[3] Berka, C. et al. 2005. Evaluation of an EEG-Workload
Model in an Aegis Simulation Environment. In Proceedings
of SPIE Defense and Security Symposium, Biomonitoring for
Physiological and Cognitive Performance during Military
Operations. SPIE: The International Society for Optical
Engineering: Orlando, FL, 90-99.
[4] Brett, B.E., Doyal, J.A., Malek, D.A., Martin, E.A.,
Hoagland, D.G., Anesgart, M.N. 2002. The Combat
Automation Requirements Testbed (CART) Task 5 Interim
Report: Modeling a Strike Fighter Pilot Conducting a Time
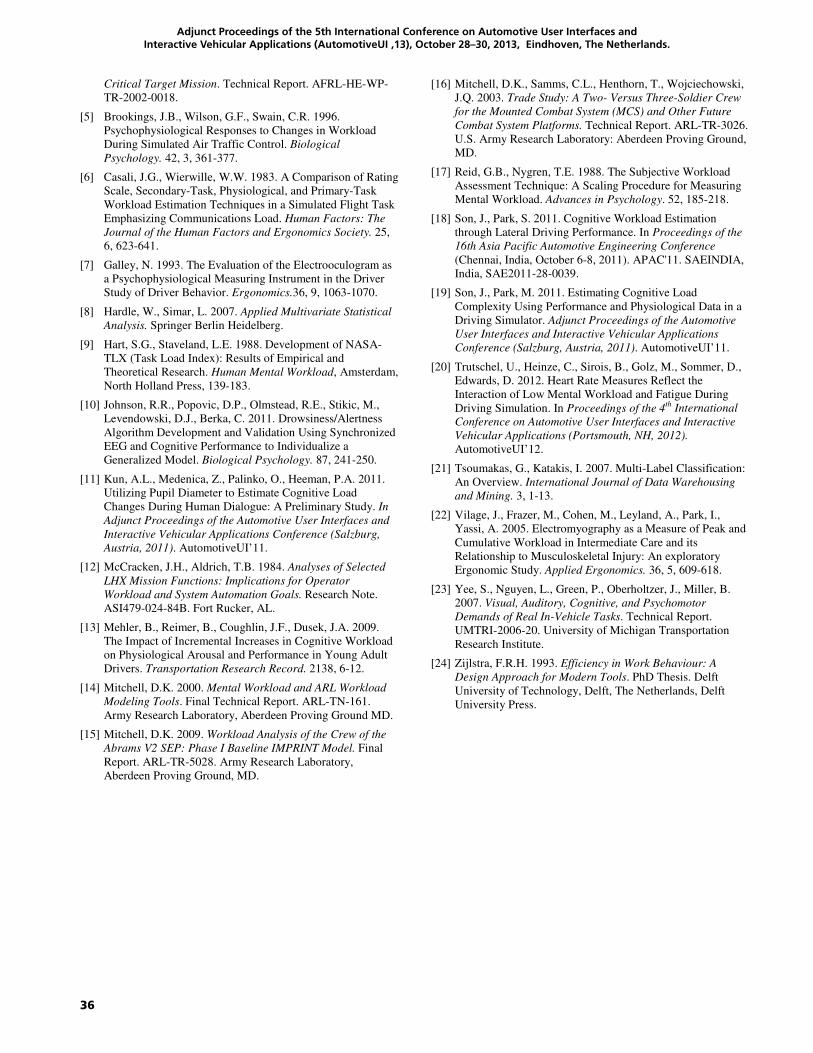
36
Adjunct Proceedings of the 5th International Conference on Automotive User Interfaces and Interactive Vehicular Applications (AutomotiveUI ‚13), October 28–30, 2013, Eindhoven, The Netherlands.
Critical Target Mission. Technical Report. AFRL-HE-WP-
TR-2002-0018.
[5] Brookings, J.B., Wilson, G.F., Swain, C.R. 1996.
Psychophysiological Responses to Changes in Workload
During Simulated Air Traffic Control. Biological
Psychology. 42, 3, 361-377.
[6] Casali, J.G., Wierwille, W.W. 1983. A Comparison of Rating
Scale, Secondary-Task, Physiological, and Primary-Task
Workload Estimation Techniques in a Simulated Flight Task
Emphasizing Communications Load. Human Factors: The
Journal of the Human Factors and Ergonomics Society. 25,
6, 623-641.
[7] Galley, N. 1993. The Evaluation of the Electrooculogram as
a Psychophysiological Measuring Instrument in the Driver
Study of Driver Behavior. Ergonomics.36, 9, 1063-1070.
[8] Hardle, W., Simar, L. 2007. Applied Multivariate Statistical
Analysis. Springer Berlin Heidelberg.
[9] Hart, S.G., Staveland, L.E. 1988. Development of NASA-
TLX (Task Load Index): Results of Empirical and
Theoretical Research. Human Mental Workload, Amsterdam,
North Holland Press, 139-183.
[10] Johnson, R.R., Popovic, D.P., Olmstead, R.E., Stikic, M.,
Levendowski, D.J., Berka, C. 2011. Drowsiness/Alertness
Algorithm Development and Validation Using Synchronized
EEG and Cognitive Performance to Individualize a
Generalized Model. Biological Psychology. 87, 241-250.
[11] Kun, A.L., Medenica, Z., Palinko, O., Heeman, P.A. 2011.
Utilizing Pupil Diameter to Estimate Cognitive Load
Changes During Human Dialogue: A Preliminary Study. In
Adjunct Proceedings of the Automotive User Interfaces and
Interactive Vehicular Applications Conference (Salzburg,
Austria, 2011). AutomotiveUI’11.
[12] McCracken, J.H., Aldrich, T.B. 1984. Analyses of Selected
LHX Mission Functions: Implications for Operator
Workload and System Automation Goals. Research Note.
ASI479-024-84B. Fort Rucker, AL.
[13] Mehler, B., Reimer, B., Coughlin, J.F., Dusek, J.A. 2009.
The Impact of Incremental Increases in Cognitive Workload
on Physiological Arousal and Performance in Young Adult
Drivers. Transportation Research Record. 2138, 6-12.
[14] Mitchell, D.K. 2000. Mental Workload and ARL Workload
Modeling Tools. Final Technical Report. ARL-TN-161.
Army Research Laboratory, Aberdeen Proving Ground MD.
[15] Mitchell, D.K. 2009. Workload Analysis of the Crew of the
Abrams V2 SEP: Phase I Baseline IMPRINT Model. Final
Report. ARL-TR-5028. Army Research Laboratory,
Aberdeen Proving Ground, MD.
[16] Mitchell, D.K., Samms, C.L., Henthorn, T., Wojciechowski,
J.Q. 2003. Trade Study: A Two- Versus Three-Soldier Crew
for the Mounted Combat System (MCS) and Other Future
Combat System Platforms. Technical Report. ARL-TR-3026.
U.S. Army Research Laboratory: Aberdeen Proving Ground,
MD.
[17] Reid, G.B., Nygren, T.E. 1988. The Subjective Workload
Assessment Technique: A Scaling Procedure for Measuring
Mental Workload. Advances in Psychology. 52, 185-218.
[18] Son, J., Park, S. 2011. Cognitive Workload Estimation
through Lateral Driving Performance. In Proceedings of the
16th Asia Pacific Automotive Engineering Conference
(Chennai, India, October 6-8, 2011). APAC'11. SAEINDIA,
India, SAE2011-28-0039.
[19] Son, J., Park, M. 2011. Estimating Cognitive Load
Complexity Using Performance and Physiological Data in a
Driving Simulator. Adjunct Proceedings of the Automotive
User Interfaces and Interactive Vehicular Applications
Conference (Salzburg, Austria, 2011). AutomotiveUI’11.
[20] Trutschel, U., Heinze, C., Sirois, B., Golz, M., Sommer, D.,
Edwards, D. 2012. Heart Rate Measures Reflect the
Interaction of Low Mental Workload and Fatigue During
Driving Simulation. In Proceedings of the 4th International
Conference on Automotive User Interfaces and Interactive
Vehicular Applications (Portsmouth, NH, 2012).
AutomotiveUI’12.
[21] Tsoumakas, G., Katakis, I. 2007. Multi-Label Classification:
An Overview. International Journal of Data Warehousing
and Mining. 3, 1-13.
[22] Vilage, J., Frazer, M., Cohen, M., Leyland, A., Park, I.,
Yassi, A. 2005. Electromyography as a Measure of Peak and
Cumulative Workload in Intermediate Care and its
Relationship to Musculoskeletal Injury: An exploratory
Ergonomic Study. Applied Ergonomics. 36, 5, 609-618.
[23] Yee, S., Nguyen, L., Green, P., Oberholtzer, J., Miller, B.
2007. Visual, Auditory, Cognitive, and Psychomotor
Demands of Real In-Vehicle Tasks. Technical Report.
UMTRI-2006-20. University of Michigan Transportation
Research Institute.
[24] Zijlstra, F.R.H. 1993. Efficiency in Work Behaviour: A
Design Approach for Modern Tools. PhD Thesis. Delft
University of Technology, Delft, The Netherlands, Delft
University Press.
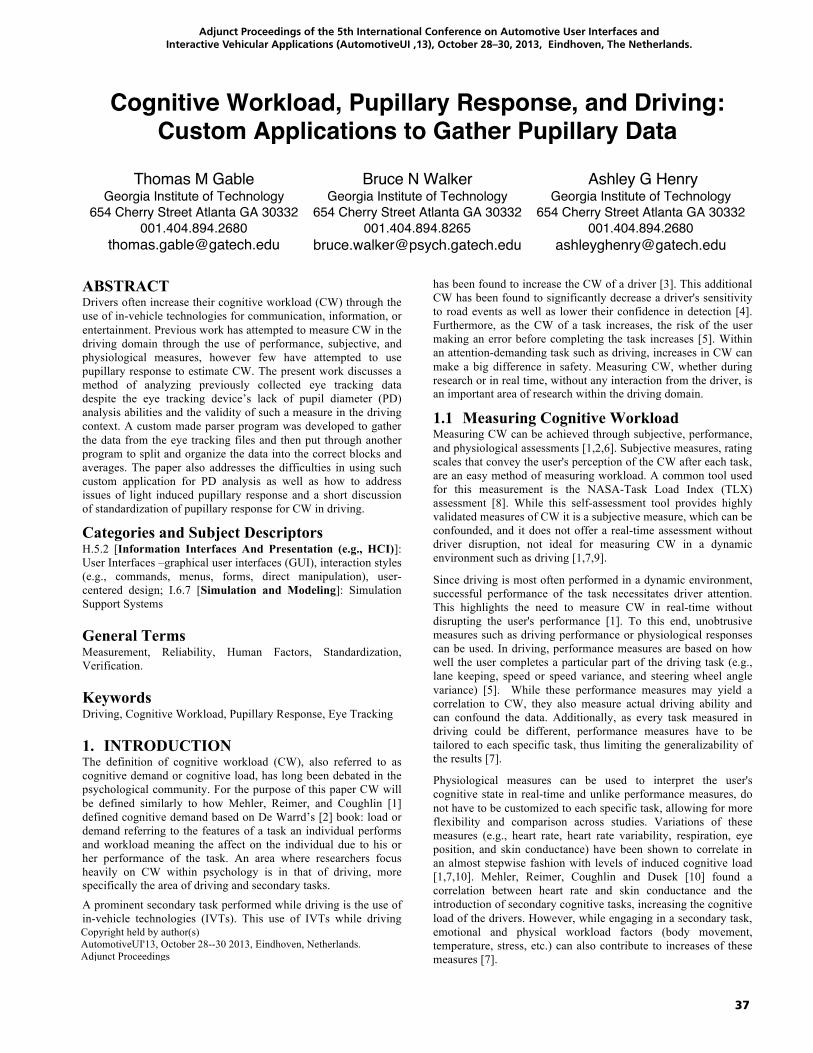
37
Adjunct Proceedings of the 5th International Conference on Automotive User Interfaces and Interactive Vehicular Applications (AutomotiveUI ‚13), October 28–30, 2013, Eindhoven, The Netherlands.
Cognitive Workload, Pupillary Response, and Driving: Custom Applications to Gather Pupillary Data
Thomas M Gable
Georgia Institute of Technology 654 Cherry Street Atlanta GA 30332
001.404.894.2680 [email protected]
Bruce N Walker Georgia Institute of Technology
654 Cherry Street Atlanta GA 30332 001.404.894.8265
Ashley G Henry Georgia Institute of Technology
654 Cherry Street Atlanta GA 30332 001.404.894.2680
ABSTRACT Drivers often increase their cognitive workload (CW) through the use of in-vehicle technologies for communication, information, or entertainment. Previous work has attempted to measure CW in the driving domain through the use of performance, subjective, and physiological measures, however few have attempted to use pupillary response to estimate CW. The present work discusses a method of analyzing previously collected eye tracking data despite the eye tracking device’s lack of pupil diameter (PD) analysis abilities and the validity of such a measure in the driving context. A custom made parser program was developed to gather the data from the eye tracking files and then put through another program to split and organize the data into the correct blocks and averages. The paper also addresses the difficulties in using such custom application for PD analysis as well as how to address issues of light induced pupillary response and a short discussion of standardization of pupillary response for CW in driving.
Categories and Subject Descriptors H.5.2 [Information Interfaces And Presentation (e.g., HCI)]: User Interfaces –graphical user interfaces (GUI), interaction styles (e.g., commands, menus, forms, direct manipulation), user-centered design; I.6.7 [Simulation and Modeling]: Simulation Support Systems
General Terms Measurement, Reliability, Human Factors, Standardization, Verification.
Keywords Driving, Cognitive Workload, Pupillary Response, Eye Tracking
1. INTRODUCTION The definition of cognitive workload (CW), also referred to as cognitive demand or cognitive load, has long been debated in the psychological community. For the purpose of this paper CW will be defined similarly to how Mehler, Reimer, and Coughlin [1] defined cognitive demand based on De Warrd’s [2] book: load or demand referring to the features of a task an individual performs and workload meaning the affect on the individual due to his or her performance of the task. An area where researchers focus heavily on CW within psychology is in that of driving, more specifically the area of driving and secondary tasks.
A prominent secondary task performed while driving is the use of in-vehicle technologies (IVTs). This use of IVTs while driving
has been found to increase the CW of a driver [3]. This additional CW has been found to significantly decrease a driver's sensitivity to road events as well as lower their confidence in detection [4]. Furthermore, as the CW of a task increases, the risk of the user making an error before completing the task increases [5]. Within an attention-demanding task such as driving, increases in CW can make a big difference in safety. Measuring CW, whether during research or in real time, without any interaction from the driver, is an important area of research within the driving domain.
1.1 Measuring Cognitive Workload Measuring CW can be achieved through subjective, performance, and physiological assessments [1,2,6]. Subjective measures, rating scales that convey the user's perception of the CW after each task, are an easy method of measuring workload. A common tool used for this measurement is the NASA-Task Load Index (TLX) assessment [8]. While this self-assessment tool provides highly validated measures of CW it is a subjective measure, which can be confounded, and it does not offer a real-time assessment without driver disruption, not ideal for measuring CW in a dynamic environment such as driving [1,7,9].
Since driving is most often performed in a dynamic environment, successful performance of the task necessitates driver attention. This highlights the need to measure CW in real-time without disrupting the user's performance [1]. To this end, unobtrusive measures such as driving performance or physiological responses can be used. In driving, performance measures are based on how well the user completes a particular part of the driving task (e.g., lane keeping, speed or speed variance, and steering wheel angle variance) [5]. While these performance measures may yield a correlation to CW, they also measure actual driving ability and can confound the data. Additionally, as every task measured in driving could be different, performance measures have to be tailored to each specific task, thus limiting the generalizability of the results [7].
Physiological measures can be used to interpret the user's cognitive state in real-time and unlike performance measures, do not have to be customized to each specific task, allowing for more flexibility and comparison across studies. Variations of these measures (e.g., heart rate, heart rate variability, respiration, eye position, and skin conductance) have been shown to correlate in an almost stepwise fashion with levels of induced cognitive load [1,7,10]. Mehler, Reimer, Coughlin and Dusek [10] found a correlation between heart rate and skin conductance and the introduction of secondary cognitive tasks, increasing the cognitive load of the drivers. However, while engaging in a secondary task, emotional and physical workload factors (body movement, temperature, stress, etc.) can also contribute to increases of these measures [7].
Copyright held by author(s) AutomotiveUI'13, October 28--30 2013, Eindhoven, Netherlands. Adjunct Proceedings
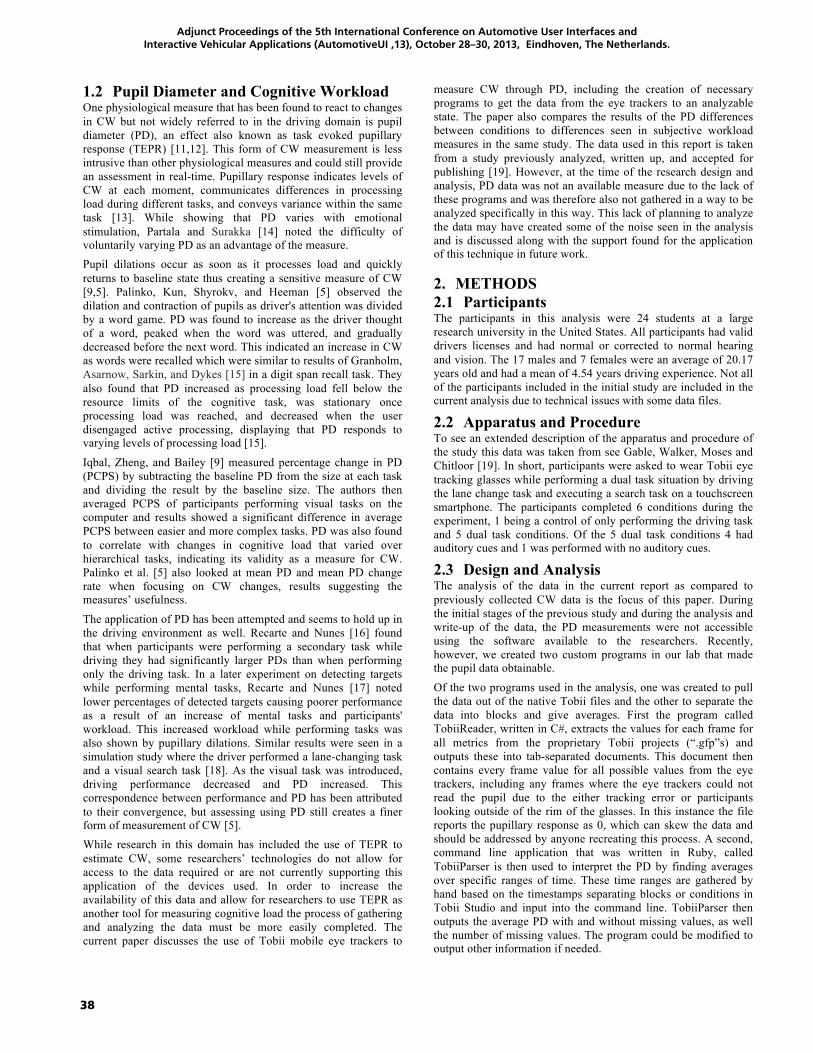
38
Adjunct Proceedings of the 5th International Conference on Automotive User Interfaces and Interactive Vehicular Applications (AutomotiveUI ‚13), October 28–30, 2013, Eindhoven, The Netherlands.
1.2 Pupil Diameter and Cognitive Workload One physiological measure that has been found to react to changes in CW but not widely referred to in the driving domain is pupil diameter (PD), an effect also known as task evoked pupillary response (TEPR) [11,12]. This form of CW measurement is less intrusive than other physiological measures and could still provide an assessment in real-time. Pupillary response indicates levels of CW at each moment, communicates differences in processing load during different tasks, and conveys variance within the same task [13]. While showing that PD varies with emotional stimulation, Partala and Surakka [14] noted the difficulty of voluntarily varying PD as an advantage of the measure. Pupil dilations occur as soon as it processes load and quickly returns to baseline state thus creating a sensitive measure of CW [9,5]. Palinko, Kun, Shyrokv, and Heeman [5] observed the dilation and contraction of pupils as driver's attention was divided by a word game. PD was found to increase as the driver thought of a word, peaked when the word was uttered, and gradually decreased before the next word. This indicated an increase in CW as words were recalled which were similar to results of Granholm, Asarnow, Sarkin, and Dykes [15] in a digit span recall task. They also found that PD increased as processing load fell below the resource limits of the cognitive task, was stationary once processing load was reached, and decreased when the user disengaged active processing, displaying that PD responds to varying levels of processing load [15].
Iqbal, Zheng, and Bailey [9] measured percentage change in PD (PCPS) by subtracting the baseline PD from the size at each task and dividing the result by the baseline size. The authors then averaged PCPS of participants performing visual tasks on the computer and results showed a significant difference in average PCPS between easier and more complex tasks. PD was also found to correlate with changes in cognitive load that varied over hierarchical tasks, indicating its validity as a measure for CW. Palinko et al. [5] also looked at mean PD and mean PD change rate when focusing on CW changes, results suggesting the measures’ usefulness.
The application of PD has been attempted and seems to hold up in the driving environment as well. Recarte and Nunes [16] found that when participants were performing a secondary task while driving they had significantly larger PDs than when performing only the driving task. In a later experiment on detecting targets while performing mental tasks, Recarte and Nunes [17] noted lower percentages of detected targets causing poorer performance as a result of an increase of mental tasks and participants' workload. This increased workload while performing tasks was also shown by pupillary dilations. Similar results were seen in a simulation study where the driver performed a lane-changing task and a visual search task [18]. As the visual task was introduced, driving performance decreased and PD increased. This correspondence between performance and PD has been attributed to their convergence, but assessing using PD still creates a finer form of measurement of CW [5]. While research in this domain has included the use of TEPR to estimate CW, some researchers’ technologies do not allow for access to the data required or are not currently supporting this application of the devices used. In order to increase the availability of this data and allow for researchers to use TEPR as another tool for measuring cognitive load the process of gathering and analyzing the data must be more easily completed. The current paper discusses the use of Tobii mobile eye trackers to
measure CW through PD, including the creation of necessary programs to get the data from the eye trackers to an analyzable state. The paper also compares the results of the PD differences between conditions to differences seen in subjective workload measures in the same study. The data used in this report is taken from a study previously analyzed, written up, and accepted for publishing [19]. However, at the time of the research design and analysis, PD data was not an available measure due to the lack of these programs and was therefore also not gathered in a way to be analyzed specifically in this way. This lack of planning to analyze the data may have created some of the noise seen in the analysis and is discussed along with the support found for the application of this technique in future work.
2. METHODS 2.1 Participants The participants in this analysis were 24 students at a large research university in the United States. All participants had valid drivers licenses and had normal or corrected to normal hearing and vision. The 17 males and 7 females were an average of 20.17 years old and had a mean of 4.54 years driving experience. Not all of the participants included in the initial study are included in the current analysis due to technical issues with some data files.
2.2 Apparatus and Procedure To see an extended description of the apparatus and procedure of the study this data was taken from see Gable, Walker, Moses and Chitloor [19]. In short, participants were asked to wear Tobii eye tracking glasses while performing a dual task situation by driving the lane change task and executing a search task on a touchscreen smartphone. The participants completed 6 conditions during the experiment, 1 being a control of only performing the driving task and 5 dual task conditions. Of the 5 dual task conditions 4 had auditory cues and 1 was performed with no auditory cues.
2.3 Design and Analysis The analysis of the data in the current report as compared to previously collected CW data is the focus of this paper. During the initial stages of the previous study and during the analysis and write-up of the data, the PD measurements were not accessible using the software available to the researchers. Recently, however, we created two custom programs in our lab that made the pupil data obtainable.
Of the two programs used in the analysis, one was created to pull the data out of the native Tobii files and the other to separate the data into blocks and give averages. First the program called TobiiReader, written in C#, extracts the values for each frame for all metrics from the proprietary Tobii projects (“.gfp”s) and outputs these into tab-separated documents. This document then contains every frame value for all possible values from the eye trackers, including any frames where the eye trackers could not read the pupil due to the either tracking error or participants looking outside of the rim of the glasses. In this instance the file reports the pupillary response as 0, which can skew the data and should be addressed by anyone recreating this process. A second, command line application that was written in Ruby, called TobiiParser is then used to interpret the PD by finding averages over specific ranges of time. These time ranges are gathered by hand based on the timestamps separating blocks or conditions in Tobii Studio and input into the command line. TobiiParser then outputs the average PD with and without missing values, as well the number of missing values. The program could be modified to output other information if needed.
39
Adjunct Proceedings of the 5th International Conference on Automotive User Interfaces and Interactive Vehicular Applications (AutomotiveUI ‚13), October 28–30, 2013, Eindhoven, The Netherlands.
This data was then entered into a spreadsheet along with the previously collected TLX ratings for the same participants for each of the blocks. Instead of comparing all of the conditions from the original study it was decided to only compare 3 of the conditions in an effort to save time while still examining the abilities of the eye trackers to measure changes in PD. The conditions that were chosen included: a control of only performing the driving task, the condition that according the TLX created the least amount of cognitive load; driving plus the secondary task with no sound, the condition that created the highest level of cognitive load according to TLX; and driving while performing the dual task with the auditory cue of spindex TTS (an advanced auditory cue, see [19] for more information), the cue that seemed to diminish the cognitive load on the drivers the most out of all the dual task conditions.
3. RESULTS Figure 1 displays the mean combined TLX ratings and PDs for each of the three experimental conditions included in this analysis. A similar trend can be seen between the two measures for the three conditions, with the control condition having a much lower value and then increasing for the no sound search task condition before slightly decreasing in the audio condition of spindex TTS. In an effort to investigate this trend a one-tailed Pearson’s r correlation test was performed, the scatterplot of which can be seen in Figure 2. Results of the test showed a moderate positive correlation between the TLX ratings and the PD (mm), r = 0.339, n = 72, p = 0.002.
Paired t-tests showed that the control condition had significantly lower TLX ratings (M = 29.8, SD= 16.5) than either the no sound condition (M = 61.1, SD= 18.0), t(23) = -8.22, p < .001, and the spindex TTS condition (M = 57.0, SD= 15.5), t(23) = -9.13, p < .001. No significant difference was seen between the two search conditions. Similar results were found for the PD measure with the control condition having significantly lower average PD (M = 102.2, SD= 13.0) than the no sound condition (M = 116.0, SD= 16.5), t(23) = -10.28, p < .001, and the spindex TTS condition (M = 113.4, SD= 16.2), t(23) = -6.20, p < .001, with no significant difference between the search conditions.
4. DISCUSSION The creation of these custom applications will allow for the measurement of pupillary response in future work and could easily be shared with other academics who have encountered the same issues with this software lacking in PD analysis abilities. The lack of differences between the two search conditions for pupil size was possibly due to a lack of trials since no difference was seen with TLX ratings, but not at the fault of PD as a measure of CW. While the correlation between the TLX and PD was only moderate, it does give merit to using this method for estimating CW, or using the measure along with other physiological, subjective, and performance measures in a multivariate analysis. The lack of a stronger correlation could be affected by multiple factors, particularly of interest being the issue of looking between the driving and secondary task, causing differences in luminance. Kun, Palinko, and Razumenić [12] reviewed this topic of luminance and the obscuring effect it can have on data when measuring CW through pupillary response. They discuss that while CW can have an affect of pupillary dilation, the major contributor to the size of an individual’s pupil is the pupillary light reflex (PLR). This reflex can confound data if luminance in part of a scenario is darker than others when using either a simulator or an on road study. Additionally, and particularly important in the current analysis, when participants are interacting with secondary tasks while driving their visual attention can move between the screen or road area, and the IVT. This visual movement from very separate luminance areas of outside and inside the vehicle or simulated cab could have large impacts on the pupillary response. Kun, Palinko, and Razumenić [12] discuss a possible way of addressing this issue through the use of a weighting function. Another option given by the authors is creating a scenario with minimal changes in target luminance, however this could be difficult to do when a study involves IVTs. Although these custom applications work, it would be to our advantage to continue to make the process more efficient. The need to use multiple applications to get the data into the correct format is time consuming. Through merging the applications this would decrease the complexity of the process and hopefully make the process faster as well. The ability to input time blocks through some sort of script would also be a helpful addition to the application, as in its current form the process must be done one block at a time. Additionally the two programs used in this
Figure 1. A bar chart displaying the mean TLX ratings and PDs of the three driving conditions: driving only, driving +
search task no sound, and driving + search task spindex TTS.
Figure 2. A scatterplot displaying PD and corresponding
TLX ratings for all the participants in the three conditions.
40
Adjunct Proceedings of the 5th International Conference on Automotive User Interfaces and Interactive Vehicular Applications (AutomotiveUI ‚13), October 28–30, 2013, Eindhoven, The Netherlands.
process run on different operating systems (Windows and Macintosh) so both types are necessary to complete the process.
Overall this expansion in abilities will allow for more measures of CW and offer variables to researchers where they were not possible before. However, before using these applications or any like them to analyze previous eye tracking data, the effect of not planning a study to measure pupillary response data should be considered due to the effects of PLR discussed above. If possible the research using this type of data and these custom applications should consider the effects of PLR and plan a way to gather the necessary data to create a weighting function. The next study investigating the effectiveness of the Tobii eye trackers and these custom applications will need to address this confounding factor to look at the relationship of pupillary response and TLX with less noise. Additionally researchers that would like access to these applications should understand the applications are not yet refined to a commercial level and the analysis remains time consuming. While this paper does not directly discuss any standards, this is an important factor to consider when investigating pupillary response and CW. In its entirety, the measurement of driving distraction has a wide range of terms used for similar constructs and forms of measurement to estimate CW, and pupillary response within CW is no different. However, pupillary response along with some of the physiological measures of CW are still in the beginning stages of becoming a mainstream form of CW measurement due to technologies becoming more affordable and research supporting their application more widely available. As these somewhat recent measures of CW grow, authors should be able to find a way to know the correct way of referring to constructs and measuring these physiological factors. This need could be addressed through the community interested and active in this area of research to come together and decide what measures of CW will be used in which way and how the data should be gathered, organized (such as the issue with the missing frames in our data or the weighting function discussed by Kun et al., [12]), and reported. Whether the workshop on cognitive load should push this effort forward through the creation of an annual report or leave the standards papers to be written through government funded groups such as NHTSA is another decision. The decision however, must be made before it is too late so as to allow enough time to go by before the standards are released and new researchers in the area begin performing research and writing it up based on literature not addressing or using these standards.
5. ACKNOWLEDGMENTS Thanks to Ben Stolvitz for creating the programs discussed. Portions of this work are supported by a National Science Foundation Graduate Research Fellowship (DGE-1148903). 6. REFERENCES [1] De Waard, D. (1996). The measurement of drivers' mental
workload. Groningen University, Traffic Research Center. [2] Mehler, B., Reimer, B., & Coughlin, J. F. (2012). Sensitivity
of Physiological Measures for Detecting Systematic Variations in Cognitive Demand From a Working Memory Task An On-Road Study Across Three Age Groups. Human Factors: The Journal of the Human Factors and Ergonomics Society, 54(3), 396-412.
[3] Engström, J., Johansson, E., & Östlund, J. 2005. Effects of Visual and Cognitive Load in Real and Simulated Motorway Driving. Transportation Research Part F: Traffic Psychology and Behaviour, 8 (2), 97–120.
[4] Lee, Y., Lee, J. D., & Boyle, L. N. 2007. Visual Attention in Driving: The Effect of Cognitive Load and Visual Disruption. Human Factors, 49, 721-733.
[5] Palinko, O., Kun, A.L., Shyrokov, A., Heeman, P. 2010. Eye Tracking Research and Applications Symposium, 141-144.
[6] Charleton, S.G., & O’Brien, T. C. 2002. Measurement of Cognitive States in Testing and Evaluation. Handbook of Human Factors and Evaluation, 97-126.
[7] Ikehara, C.S., & Crosby, M.E. 2005. Assessing Cognitive Load with Physiological Sensors. Proc. HICSS, 295-303.
[8] Hart, S.G., & Staveland, L.E. 1988. Development of NASA-TLX (Task Load Index): Results of empirical and theoretical research. In Human Mental Workload, by Meshkati, N., & Hancock, P.A., 239-250. Amsterdam: North Holland Press.
[9] Iqbal, S. T., Zheng, X. S., & Bailey, B. P. 2004. Task-Evoked Pupillary Response to Mental Workload in Human-Computer Interaction. Proc. CHI’04. Vienna: ACM 1477-1480.
[10] Mehler. B, Reimer, B., Coughlin, J. F., & Dusek, J. A. 2009. Impact of incremental increases in cognitive workload on physiological arousal and performance in young adult drivers. Transportation Research Record: Journal of the Transportation Research Board, 2138(1), 6-12.
[11] Beatty, J. (1982). Task-evoked pupillary responses, processing load, and the structure of processing resources. Psychological bulletin, 91(2), 276.
[12] Kun, A. L., Palinko, O., & Razumenić, I. (2012, October). Exploring the effects of size and luminance of visual targets on the pupillary light reflex. In Proceedings of the 4th International Conference on Automotive User Interfaces and Interactive Vehicular Applications (pp. 183-186). ACM.
[13] Hyönä, J., Tommola, J., & Alaja, A. M. 1995. Pupil dilation as a measure of processing load in simultaneous interpretation and other language tasks. The Quarterly Journal of Experimental Psychology, 48(3), 598-612.
[14] Partala, T., & Surakka, V. 2003. Pupil size variation as an indication of affective processing. International journal of human-computer studies, 59(1), 185-198.
[15] Granholm, E., Asarnow, R. F., Sarkin, A. J., & Dykes, K. L. 1996. Pupillary responses index cognitive resource limitations. Psychophysiology, 33(4), 457-461.
[16] Recarte, M. A., & Nunes, L. M. 2000. Effects of verbal and spatial-imagery tasks on eye fixations while driving. Journal of Experimental Psychology: Applied, 6(1), 31.
[17] Recarte, M. A., & Nunes, L. M. 2003. Mental workload while driving: effects on visual search, discrimination, and decision making. Journal of experimental psychology: Applied, 9(2), 119.
[18] Schwalm, M., Keinath, A., & Zimmer, H. D. 2008. Pupillometry as a method for measuring mental workload within a simulated driving task. Human Factors for assistance and automation, 1-13.
[19] Gable, T. M., Walker, B. N., Moses, H. R., & Chitloor, R. D. (2013, October). Advanced Auditory Cues on Mobile Phones Help Keep Drivers’ Eyes on the Road. Proceeding of the Fifth International Conference on Automotive User Interfaces and Interactive Vehicular Applications, Eindhoven, The Netherlands.
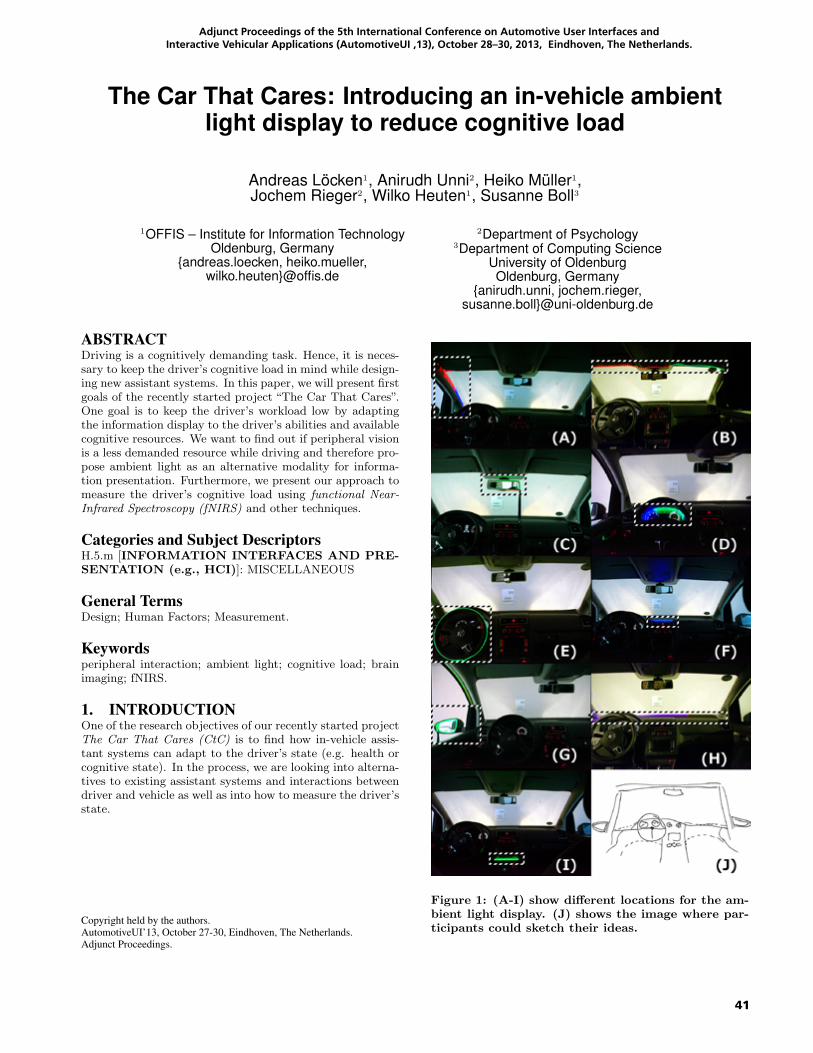
41
Adjunct Proceedings of the 5th International Conference on Automotive User Interfaces and Interactive Vehicular Applications (AutomotiveUI ‚13), October 28–30, 2013, Eindhoven, The Netherlands.
The Car That Cares: Introducing an in-vehicle ambientlight display to reduce cognitive load
Andreas Löcken1, Anirudh Unni2, Heiko Müller1,Jochem Rieger2, Wilko Heuten1, Susanne Boll3
1OFFIS – Institute for Information TechnologyOldenburg, Germany
{andreas.loecken, heiko.mueller,wilko.heuten}@offis.de
2Department of Psychology3Department of Computing Science
University of OldenburgOldenburg, Germany
{anirudh.unni, jochem.rieger,susanne.boll}@uni-oldenburg.de
ABSTRACTDriving is a cognitively demanding task. Hence, it is neces-sary to keep the driver’s cognitive load in mind while design-ing new assistant systems. In this paper, we will present firstgoals of the recently started project “The Car That Cares”.One goal is to keep the driver’s workload low by adaptingthe information display to the driver’s abilities and availablecognitive resources. We want to find out if peripheral visionis a less demanded resource while driving and therefore pro-pose ambient light as an alternative modality for informa-tion presentation. Furthermore, we present our approach tomeasure the driver’s cognitive load using functional Near-Infrared Spectroscopy (fNIRS) and other techniques.
Categories and Subject DescriptorsH.5.m [INFORMATION INTERFACES AND PRE-SENTATION (e.g., HCI)]: MISCELLANEOUS
General TermsDesign; Human Factors; Measurement.
Keywordsperipheral interaction; ambient light; cognitive load; brainimaging; fNIRS.
1. INTRODUCTIONOne of the research objectives of our recently started projectThe Car That Cares (CtC) is to find how in-vehicle assis-tant systems can adapt to the driver’s state (e.g. health orcognitive state). In the process, we are looking into alterna-tives to existing assistant systems and interactions betweendriver and vehicle as well as into how to measure the driver’sstate.
Copyright held by the authors.AutomotiveUI’13, October 27-30, Eindhoven, The Netherlands.Adjunct Proceedings.
Figure 1: (A-I) show different locations for the am-bient light display. (J) shows the image where par-ticipants could sketch their ideas.
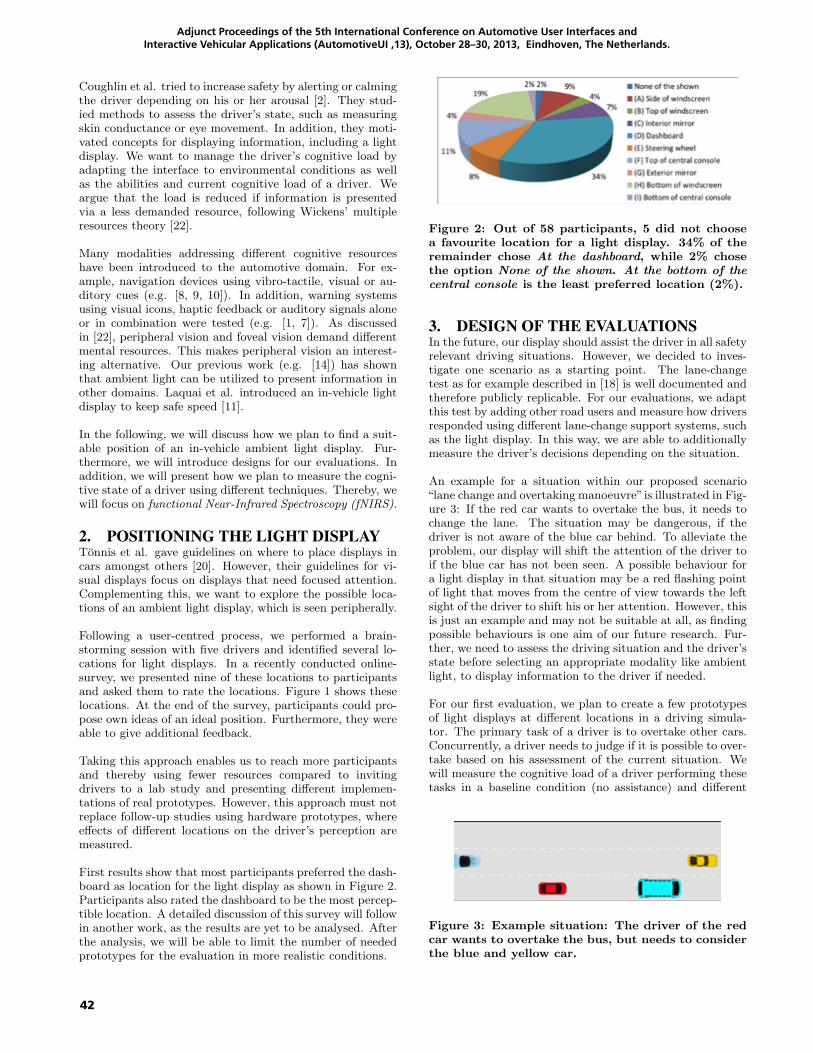
42
Adjunct Proceedings of the 5th International Conference on Automotive User Interfaces and Interactive Vehicular Applications (AutomotiveUI ‚13), October 28–30, 2013, Eindhoven, The Netherlands.
Coughlin et al. tried to increase safety by alerting or calmingthe driver depending on his or her arousal [2]. They stud-ied methods to assess the driver’s state, such as measuringskin conductance or eye movement. In addition, they moti-vated concepts for displaying information, including a lightdisplay. We want to manage the driver’s cognitive load byadapting the interface to environmental conditions as wellas the abilities and current cognitive load of a driver. Weargue that the load is reduced if information is presentedvia a less demanded resource, following Wickens’ multipleresources theory [22].
Many modalities addressing different cognitive resourceshave been introduced to the automotive domain. For ex-ample, navigation devices using vibro-tactile, visual or au-ditory cues (e.g. [8, 9, 10]). In addition, warning systemsusing visual icons, haptic feedback or auditory signals aloneor in combination were tested (e.g. [1, 7]). As discussedin [22], peripheral vision and foveal vision demand differentmental resources. This makes peripheral vision an interest-ing alternative. Our previous work (e.g. [14]) has shownthat ambient light can be utilized to present information inother domains. Laquai et al. introduced an in-vehicle lightdisplay to keep safe speed [11].
In the following, we will discuss how we plan to find a suit-able position of an in-vehicle ambient light display. Fur-thermore, we will introduce designs for our evaluations. Inaddition, we will present how we plan to measure the cogni-tive state of a driver using different techniques. Thereby, wewill focus on functional Near-Infrared Spectroscopy (fNIRS).
2. POSITIONING THE LIGHT DISPLAYTonnis et al. gave guidelines on where to place displays incars amongst others [20]. However, their guidelines for vi-sual displays focus on displays that need focused attention.Complementing this, we want to explore the possible loca-tions of an ambient light display, which is seen peripherally.
Following a user-centred process, we performed a brain-storming session with five drivers and identified several lo-cations for light displays. In a recently conducted online-survey, we presented nine of these locations to participantsand asked them to rate the locations. Figure 1 shows theselocations. At the end of the survey, participants could pro-pose own ideas of an ideal position. Furthermore, they wereable to give additional feedback.
Taking this approach enables us to reach more participantsand thereby using fewer resources compared to invitingdrivers to a lab study and presenting different implemen-tations of real prototypes. However, this approach must notreplace follow-up studies using hardware prototypes, whereeffects of different locations on the driver’s perception aremeasured.
First results show that most participants preferred the dash-board as location for the light display as shown in Figure 2.Participants also rated the dashboard to be the most percep-tible location. A detailed discussion of this survey will followin another work, as the results are yet to be analysed. Afterthe analysis, we will be able to limit the number of neededprototypes for the evaluation in more realistic conditions.
Figure 2: Out of 58 participants, 5 did not choosea favourite location for a light display. 34% of theremainder chose At the dashboard, while 2% chosethe option None of the shown. At the bottom of thecentral console is the least preferred location (2%).
3. DESIGN OF THE EVALUATIONSIn the future, our display should assist the driver in all safetyrelevant driving situations. However, we decided to inves-tigate one scenario as a starting point. The lane-changetest as for example described in [18] is well documented andtherefore publicly replicable. For our evaluations, we adaptthis test by adding other road users and measure how driversresponded using different lane-change support systems, suchas the light display. In this way, we are able to additionallymeasure the driver’s decisions depending on the situation.
An example for a situation within our proposed scenario“lane change and overtaking manoeuvre”is illustrated in Fig-ure 3: If the red car wants to overtake the bus, it needs tochange the lane. The situation may be dangerous, if thedriver is not aware of the blue car behind. To alleviate theproblem, our display will shift the attention of the driver toif the blue car has not been seen. A possible behaviour fora light display in that situation may be a red flashing pointof light that moves from the centre of view towards the leftsight of the driver to shift his or her attention. However, thisis just an example and may not be suitable at all, as findingpossible behaviours is one aim of our future research. Fur-ther, we need to assess the driving situation and the driver’sstate before selecting an appropriate modality like ambientlight, to display information to the driver if needed.
For our first evaluation, we plan to create a few prototypesof light displays at different locations in a driving simula-tor. The primary task of a driver is to overtake other cars.Concurrently, a driver needs to judge if it is possible to over-take based on his assessment of the current situation. Wewill measure the cognitive load of a driver performing thesetasks in a baseline condition (no assistance) and different
Figure 3: Example situation: The driver of the redcar wants to overtake the bus, but needs to considerthe blue and yellow car.
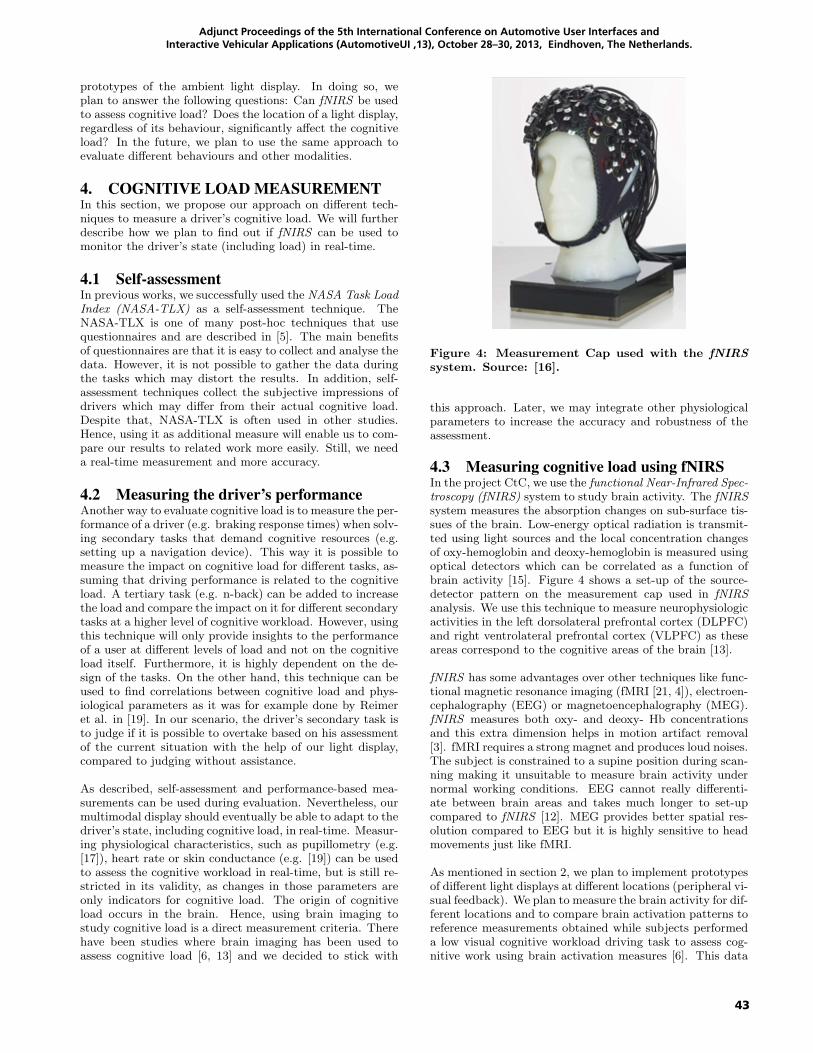
43
Adjunct Proceedings of the 5th International Conference on Automotive User Interfaces and Interactive Vehicular Applications (AutomotiveUI ‚13), October 28–30, 2013, Eindhoven, The Netherlands.
prototypes of the ambient light display. In doing so, weplan to answer the following questions: Can fNIRS be usedto assess cognitive load? Does the location of a light display,regardless of its behaviour, significantly affect the cognitiveload? In the future, we plan to use the same approach toevaluate different behaviours and other modalities.
4. COGNITIVE LOAD MEASUREMENTIn this section, we propose our approach on different tech-niques to measure a driver’s cognitive load. We will furtherdescribe how we plan to find out if fNIRS can be used tomonitor the driver’s state (including load) in real-time.
4.1 Self-assessmentIn previous works, we successfully used the NASA Task LoadIndex (NASA-TLX) as a self-assessment technique. TheNASA-TLX is one of many post-hoc techniques that usequestionnaires and are described in [5]. The main benefitsof questionnaires are that it is easy to collect and analyse thedata. However, it is not possible to gather the data duringthe tasks which may distort the results. In addition, self-assessment techniques collect the subjective impressions ofdrivers which may differ from their actual cognitive load.Despite that, NASA-TLX is often used in other studies.Hence, using it as additional measure will enable us to com-pare our results to related work more easily. Still, we needa real-time measurement and more accuracy.
4.2 Measuring the driver’s performanceAnother way to evaluate cognitive load is to measure the per-formance of a driver (e.g. braking response times) when solv-ing secondary tasks that demand cognitive resources (e.g.setting up a navigation device). This way it is possible tomeasure the impact on cognitive load for different tasks, as-suming that driving performance is related to the cognitiveload. A tertiary task (e.g. n-back) can be added to increasethe load and compare the impact on it for different secondarytasks at a higher level of cognitive workload. However, usingthis technique will only provide insights to the performanceof a user at different levels of load and not on the cognitiveload itself. Furthermore, it is highly dependent on the de-sign of the tasks. On the other hand, this technique can beused to find correlations between cognitive load and phys-iological parameters as it was for example done by Reimeret al. in [19]. In our scenario, the driver’s secondary task isto judge if it is possible to overtake based on his assessmentof the current situation with the help of our light display,compared to judging without assistance.
As described, self-assessment and performance-based mea-surements can be used during evaluation. Nevertheless, ourmultimodal display should eventually be able to adapt to thedriver’s state, including cognitive load, in real-time. Measur-ing physiological characteristics, such as pupillometry (e.g.[17]), heart rate or skin conductance (e.g. [19]) can be usedto assess the cognitive workload in real-time, but is still re-stricted in its validity, as changes in those parameters areonly indicators for cognitive load. The origin of cognitiveload occurs in the brain. Hence, using brain imaging tostudy cognitive load is a direct measurement criteria. Therehave been studies where brain imaging has been used toassess cognitive load [6, 13] and we decided to stick with
Figure 4: Measurement Cap used with the fNIRSsystem. Source: [16].
this approach. Later, we may integrate other physiologicalparameters to increase the accuracy and robustness of theassessment.
4.3 Measuring cognitive load using fNIRSIn the project CtC, we use the functional Near-Infrared Spec-troscopy (fNIRS) system to study brain activity. The fNIRSsystem measures the absorption changes on sub-surface tis-sues of the brain. Low-energy optical radiation is transmit-ted using light sources and the local concentration changesof oxy-hemoglobin and deoxy-hemoglobin is measured usingoptical detectors which can be correlated as a function ofbrain activity [15]. Figure 4 shows a set-up of the source-detector pattern on the measurement cap used in fNIRSanalysis. We use this technique to measure neurophysiologicactivities in the left dorsolateral prefrontal cortex (DLPFC)and right ventrolateral prefrontal cortex (VLPFC) as theseareas correspond to the cognitive areas of the brain [13].
fNIRS has some advantages over other techniques like func-tional magnetic resonance imaging (fMRI [21, 4]), electroen-cephalography (EEG) or magnetoencephalography (MEG).fNIRS measures both oxy- and deoxy- Hb concentrationsand this extra dimension helps in motion artifact removal[3]. fMRI requires a strong magnet and produces loud noises.The subject is constrained to a supine position during scan-ning making it unsuitable to measure brain activity undernormal working conditions. EEG cannot really differenti-ate between brain areas and takes much longer to set-upcompared to fNIRS [12]. MEG provides better spatial res-olution compared to EEG but it is highly sensitive to headmovements just like fMRI.
As mentioned in section 2, we plan to implement prototypesof different light displays at different locations (peripheral vi-sual feedback). We plan to measure the brain activity for dif-ferent locations and to compare brain activation patterns toreference measurements obtained while subjects performeda low visual cognitive workload driving task to assess cog-nitive work using brain activation measures [6]. This data
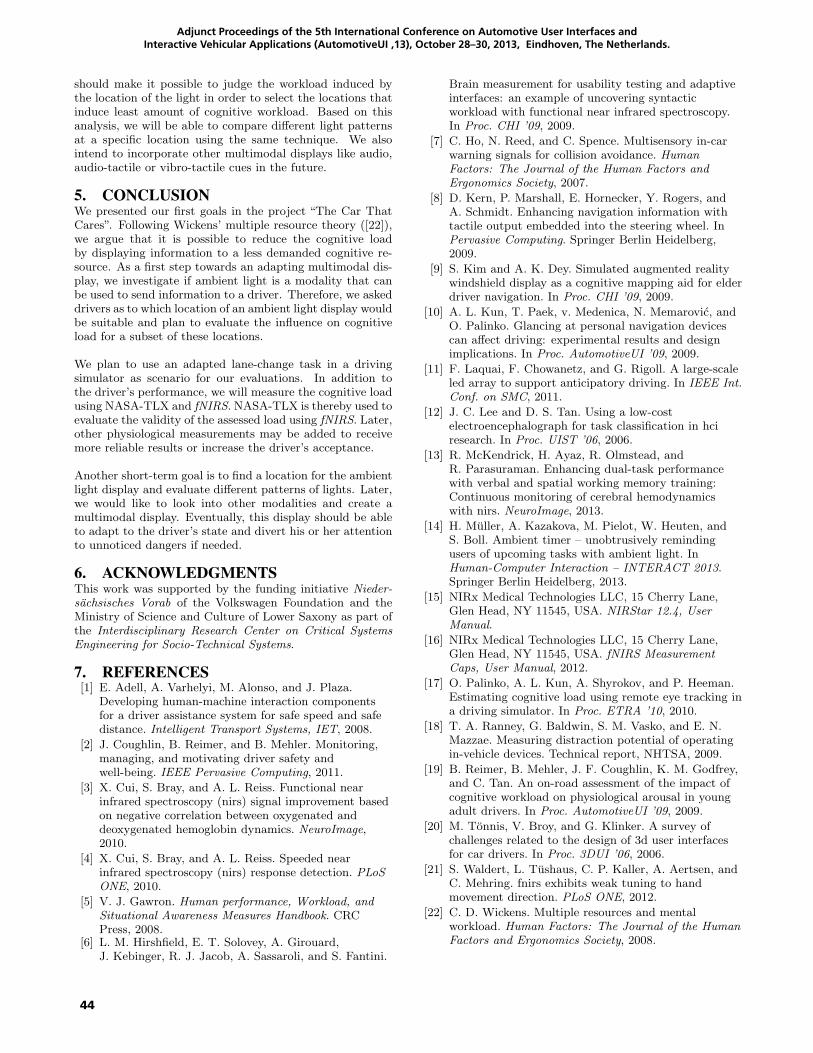
44
Adjunct Proceedings of the 5th International Conference on Automotive User Interfaces and Interactive Vehicular Applications (AutomotiveUI ‚13), October 28–30, 2013, Eindhoven, The Netherlands.
should make it possible to judge the workload induced bythe location of the light in order to select the locations thatinduce least amount of cognitive workload. Based on thisanalysis, we will be able to compare different light patternsat a specific location using the same technique. We alsointend to incorporate other multimodal displays like audio,audio-tactile or vibro-tactile cues in the future.
5. CONCLUSIONWe presented our first goals in the project “The Car ThatCares”. Following Wickens’ multiple resource theory ([22]),we argue that it is possible to reduce the cognitive loadby displaying information to a less demanded cognitive re-source. As a first step towards an adapting multimodal dis-play, we investigate if ambient light is a modality that canbe used to send information to a driver. Therefore, we askeddrivers as to which location of an ambient light display wouldbe suitable and plan to evaluate the influence on cognitiveload for a subset of these locations.
We plan to use an adapted lane-change task in a drivingsimulator as scenario for our evaluations. In addition tothe driver’s performance, we will measure the cognitive loadusing NASA-TLX and fNIRS. NASA-TLX is thereby used toevaluate the validity of the assessed load using fNIRS. Later,other physiological measurements may be added to receivemore reliable results or increase the driver’s acceptance.
Another short-term goal is to find a location for the ambientlight display and evaluate different patterns of lights. Later,we would like to look into other modalities and create amultimodal display. Eventually, this display should be ableto adapt to the driver’s state and divert his or her attentionto unnoticed dangers if needed.
6. ACKNOWLEDGMENTSThis work was supported by the funding initiative Nieder-sachsisches Vorab of the Volkswagen Foundation and theMinistry of Science and Culture of Lower Saxony as part ofthe Interdisciplinary Research Center on Critical SystemsEngineering for Socio-Technical Systems.
7. REFERENCES[1] E. Adell, A. Varhelyi, M. Alonso, and J. Plaza.
Developing human-machine interaction componentsfor a driver assistance system for safe speed and safedistance. Intelligent Transport Systems, IET, 2008.
[2] J. Coughlin, B. Reimer, and B. Mehler. Monitoring,managing, and motivating driver safety andwell-being. IEEE Pervasive Computing, 2011.
[3] X. Cui, S. Bray, and A. L. Reiss. Functional nearinfrared spectroscopy (nirs) signal improvement basedon negative correlation between oxygenated anddeoxygenated hemoglobin dynamics. NeuroImage,2010.
[4] X. Cui, S. Bray, and A. L. Reiss. Speeded nearinfrared spectroscopy (nirs) response detection. PLoSONE, 2010.
[5] V. J. Gawron. Human performance, Workload, andSituational Awareness Measures Handbook. CRCPress, 2008.
[6] L. M. Hirshfield, E. T. Solovey, A. Girouard,J. Kebinger, R. J. Jacob, A. Sassaroli, and S. Fantini.
Brain measurement for usability testing and adaptiveinterfaces: an example of uncovering syntacticworkload with functional near infrared spectroscopy.In Proc. CHI ’09, 2009.
[7] C. Ho, N. Reed, and C. Spence. Multisensory in-carwarning signals for collision avoidance. HumanFactors: The Journal of the Human Factors andErgonomics Society, 2007.
[8] D. Kern, P. Marshall, E. Hornecker, Y. Rogers, andA. Schmidt. Enhancing navigation information withtactile output embedded into the steering wheel. InPervasive Computing. Springer Berlin Heidelberg,2009.
[9] S. Kim and A. K. Dey. Simulated augmented realitywindshield display as a cognitive mapping aid for elderdriver navigation. In Proc. CHI ’09, 2009.
[10] A. L. Kun, T. Paek, v. Medenica, N. Memarovic, andO. Palinko. Glancing at personal navigation devicescan affect driving: experimental results and designimplications. In Proc. AutomotiveUI ’09, 2009.
[11] F. Laquai, F. Chowanetz, and G. Rigoll. A large-scaleled array to support anticipatory driving. In IEEE Int.Conf. on SMC, 2011.
[12] J. C. Lee and D. S. Tan. Using a low-costelectroencephalograph for task classification in hciresearch. In Proc. UIST ’06, 2006.
[13] R. McKendrick, H. Ayaz, R. Olmstead, andR. Parasuraman. Enhancing dual-task performancewith verbal and spatial working memory training:Continuous monitoring of cerebral hemodynamicswith nirs. NeuroImage, 2013.
[14] H. Muller, A. Kazakova, M. Pielot, W. Heuten, andS. Boll. Ambient timer – unobtrusively remindingusers of upcoming tasks with ambient light. InHuman-Computer Interaction – INTERACT 2013.Springer Berlin Heidelberg, 2013.
[15] NIRx Medical Technologies LLC, 15 Cherry Lane,Glen Head, NY 11545, USA. NIRStar 12.4, UserManual.
[16] NIRx Medical Technologies LLC, 15 Cherry Lane,Glen Head, NY 11545, USA. fNIRS MeasurementCaps, User Manual, 2012.
[17] O. Palinko, A. L. Kun, A. Shyrokov, and P. Heeman.Estimating cognitive load using remote eye tracking ina driving simulator. In Proc. ETRA ’10, 2010.
[18] T. A. Ranney, G. Baldwin, S. M. Vasko, and E. N.Mazzae. Measuring distraction potential of operatingin-vehicle devices. Technical report, NHTSA, 2009.
[19] B. Reimer, B. Mehler, J. F. Coughlin, K. M. Godfrey,and C. Tan. An on-road assessment of the impact ofcognitive workload on physiological arousal in youngadult drivers. In Proc. AutomotiveUI ’09, 2009.
[20] M. Tonnis, V. Broy, and G. Klinker. A survey ofchallenges related to the design of 3d user interfacesfor car drivers. In Proc. 3DUI ’06, 2006.
[21] S. Waldert, L. Tushaus, C. P. Kaller, A. Aertsen, andC. Mehring. fnirs exhibits weak tuning to handmovement direction. PLoS ONE, 2012.
[22] C. D. Wickens. Multiple resources and mentalworkload. Human Factors: The Journal of the HumanFactors and Ergonomics Society, 2008.

45
Adjunct Proceedings of the 5th International Conference on Automotive User Interfaces and Interactive Vehicular Applications (AutomotiveUI ‚13), October 28–30, 2013, Eindhoven, The Netherlands.
Cognitive Load Impairs Experienced Drivers’ Judgmentson Self-Reported Driving Superiority
Philipp KulmsSociable Agents Group, Center of Excellence
’Cognitive Interaction Technology’ (CITEC)Bielefeld University, Germany
Stefan KoppSociable Agents Group, Center of Excellence
’Cognitive Interaction Technology’ (CITEC)Bielefeld University, Germany
ABSTRACTIt seems reasonable that sooner or later, constantly over-estimating one’s driving skills may promote inappropriatedriving and misjudgments of critical situations. However, itis very common for drivers to succumb to a self-perceptionbias by evaluating their own driving skills to be superior thanthe average [2]. A web-based between-subjects experimentwas conducted to analyze drivers’ inability toward accurateself-assessments. Using Cognitive Load Theory (CLT), weassessed whether this bias is further amplified when con-scious deliberation is unavailable. First, the results clearlyreplicated the bias. Second, there was no difference betweendrivers’ self-assessments under load and without load, al-though it is suggested that automatic processing promotesself-assessments which are even more favorable. Third, therewas a significant effect of load on how experienced driversperceived their superiority judgments. Those under loadthought they rated their own abilities less superior to theaverage driver, while in fact their ratings were in line withthe overall bias. This holds only for those driving at leastthe average traveling distance in Germany of approximately1000 kilometres per month.
Categories and Subject DescriptorsJ.4 [Social and Behavioral Sciences]: Psychology
KeywordsCognitive load, Driving skills, Self-evaluation, Web-basedexperiment
1. INTRODUCTIONCognitive load plays an important role during vehicle con-
trol, there are numerous experiments highlighting this rela-tionship. In a broader sense, the implications of CLT onhuman behavior can be applied to hypothesize about loadeffects on driving that currently lie beyond driving researchinterests. Those potential load effects might just as well be
Copyright held by the authors.AutomotiveUI’13, October 27-30, Eindhoven, The Netherlands.Adjunct Proceedings..
studied in a controlled driving environment. On top of loadeffects on driving as depicted by experimental driving re-search (e.g. [3], [7]), there is a large amount of unexploredfindings, especially in the social psychology and cognitivescience literature. Many of those findings show that CLTcan be applied to driving beyond dual-task driving scenariosin order to paint a more thorough picture of how cognitiveload not only directly affects driving performance, but alsomodulates related processes such as self-perception, prospec-tive memory, and stereotypes. As a research paradigm, CLTcan be a useful source of how cognitive processes that peopleseamlessly rely on are affected when their minds are busy.Interestingly, some of these processes are connected to driv-ing. This is because driving involves an interplay of manybodily, cognitive, and social processes (e.g. motor control,experiencing distress, attention allocation between in-vehicleelements and objects outside the vehicle, multi-tasking, in-teracting with passengers and other drivers, empathy, per-forming hostile and aggressive driving). Other than driv-ing, there are probably only few highly widespread types ofhuman-machine interaction covering this many elements rel-evant for research. In this paper, we focused on how driversassess their own driving skills under load. We present resultsof a web-based experiment and discuss the role of driving ex-perience for this self-evaluation.
2. RELATED WORKPut in general words, the benefits of CLT are based on
the effects arising from a state of scant cognitive resources.In this state, conscious effortful thinking cannot be main-tained. There are manifold consequences of cognitive loadon different types of information processing. For example,under load, people are more likely to apply previously acti-vated stereotypes [4] and to forget actions they have plannedin the past because prospective memory is depleted [8]. Cog-nitive load furthermore modulates the sense of agency, thatis, an individual’s ability to identify effects caused by theself. Under load, this usually basic process of connectinga self-initiated cause and the related effect is inhibited [5].Finally, people evaluate themselves more positively underload because in contrast to the complex process of self-verification (does the stimulus confirm my self-opinion?),self-enhancement (does the stimulus put me in a favorablelight?) is performed automatically [12]. Swann et al. [12]argue that when resources are depleted, certain representa-tions of self cannot be accessed from memory and comparedwith self-relevant stimuli. Furthermore, the positive auto-matic self is highly practiced, for example through repeti-
46
Adjunct Proceedings of the 5th International Conference on Automotive User Interfaces and Interactive Vehicular Applications (AutomotiveUI ‚13), October 28–30, 2013, Eindhoven, The Netherlands.
tion over the whole lifetime [10]. To what extent are thesephenomena possibly linked to behaviors which directly orindirectly affect driving related processes? In other words,why does cognitive load as a concept warrant more attentionwithin the driving research domain?
Driving and Stereotypes. It is safe to say that for as long asvehicles will be controlled by humans, driver aggression willbe an issue for road safety. Hostile and dangerous behaviorslike honking and running red lights need to be explained byvarious reasons, such as personality, culture, context, and soforth [11]. Interestingly, some determinants of driver aggres-sion can be linked to cognitive load. In the 1970s, hostilebehaviors against female drivers were recognized to followfrom a specific stereotype against them [1]. Drivers apply-ing this stereotype, that is, letting their judgment and be-havior be influenced by it, will honk at female drivers moreoften [1]. The overall tendency, then, to apply this or anyother stereotype making assumptions about the driving per-formance of a specific group of people (e.g. elderly or novicedrivers) is facilitated by cognitive load [4]. However, thestereotype must have been activated first. In fact, the ef-fect of cognitive load on the imminent role of stereotypes istwo-sided, as Gilbert and Hixon aptly explain [4], becauseon the one hand, load facilitates the application of a stereo-type in terms of stereotype-conforming responses; on theother hand, though, load decreases the preceding activationof this stereotype. Generally, stereotype activation can beregarded as ”finding a tool in the cognitive toolbox”whereasapplication can be thought of as ”using the tool once it hasbeen found” [p. 512]. Thus, performing under load increasesthe likelihood that a driver does not see a female driver intraffic and instead, just a driver.
Driving and Prospective Memory. Completing intended ac-tions in the future is guaranteed by prospective memory. Adepleted prospective memory causes the forgetting of im-portant actions, for example taking the right freeway exit.Marsh and Hicks [8] found that attention-demanding tasksplay a key role. More specifically, inhibition was a functionof simultaneous planning and careful performance monitor-ing. When the executive functions in charge of switchingattention between planning and monitoring were heavilyloaded, prospective memory performance decreased. Thesame decrement occurred when a demanding visuospatialtask was involved. Accordingly, prospective memory decre-ments are to be expected when driving is no longer part ofthe set of routine behaviors because of environmental con-straints, and when a planning task must be maintained si-multaneously, for example wayfinding. Furthermore, the in-volvement of critical visuospatial tasks such as parking mayalso increase the likelihood of forgetting to remember.
Driving and Agency. Being a good driver obviously requiresgood driving performance. Knowing to be a good driver re-quires the right perspective on events that occur during driv-ing, for example whether dangerous situations were causedby the driver or not. Accordingly, people can only con-clude they are (not) particularly good at driving if theirsense of agency is not disturbed. Under load, there are notenough resources for accurately comparing the predicted ef-fect with the actually occurring effect, because mental modelconstruction for the prediction fails [5]. If the sense of agency
is impaired as is the case under load, drivers are more likelyto take credit on the road for outcomes that, in fact, weredue to other drivers’ actions or mere luck. Conversely, theymight attribute critical situations they can be held respon-sible for to external sources, effectively neglecting their ownresponsibility.
Self-Evaluation of Driving Skills. Last but not least, relyingon biased overly positive attitudes regarding one’s drivingskills may increase the likelihood of inappropriate driving.It is this aspect, the way how drivers usually assess theirown abilities, that we focus on. The perceived superiorityis strong, it holds for a wide range of driving skills, andit comes closer to a ”positive-self” than a ”negative-other”bias [9]. While it is still unanswered whether drivers’ self-perceptions have an actual effect on relevant outcome vari-ables like risk-taking and road safety ([2]), this may be eas-ier to unveil if we can explore whether automatic processingmodulates the perceived self-superiority. We expect an am-plification effect because automatic processing predicts theneed for self-enhancement in terms of choosing favorableevaluators and feedback [12]. Moreover, unconscious self-reflection, also called implicit self-esteem, is generally pos-itive and corresponds to explicit self-evaluations, but onlyunder time pressure or reduced cognitive resources [6].
Taken as a whole, load effects on these different aspects in-dicate how load may affect driving in terms of how driversrespond to external stimuli, how they process information,and how information is stored or accessed. Of course, thisholds for other forms of human-machine interaction as well,but driving We thus hypothesize that when drivers are putunder load and deliberate processing cannot be maintained,self-evaluations will be more favorable than in the absenceof load.
3. METHODWe conducted a web-based experiment in which we asked
subjects to evaluate their own driving skills as well as theiropinion on the average driver’s skills on various dimensions.Half of them answered the questions while being deprived ofcognitive resources (load condition); the other half answeredthe same questions under normal conditions (no-load condi-tion).
The experiment consisted of four short blocks. (A) First,subjects were asked to enter their average driving distanceper month in kilometres. (B) They then were required torate themselves and (C) the average driver along 18 drivingtasks, taken from McKenna et al. [9] and translated intoGerman.1 (D) Last, they were asked to indicate to whatextent they thought they rated themselves worse or betterthan the average driver in the previous step and, in theireyes, how positive other people rate themselves compared
1The tasks were: Driving at appropriate speed for con-ditions, Paying attention to road signs, Changing driv-ing to suit wet/icy/foggy conditions, Judging stopping dis-tances for appropriate speeds and conditions, Attention toand awareness of other vehicles, Judging correct speed forbends/corners, Leaving motorways, Hill starts, Driving inbusy town traffic, Changing lanes on motorways, Movingonto motorways, Parking, Judging the width of vehicles,Three point turns, Overtaking, and Changing traffic lanes.
47
Adjunct Proceedings of the 5th International Conference on Automotive User Interfaces and Interactive Vehicular Applications (AutomotiveUI ‚13), October 28–30, 2013, Eindhoven, The Netherlands.
to the average. All ratings were done using 7-point Likertscales.
The manipulation required subjects in the load condition torehearse an 8-digit number while answering the questions.They were given 60 seconds for learning. This rather ba-sic manipulation was successfully used in previous experi-ments to induce cognitive load (e.g. [4] [12]). After subjectswere finished with the questionnaires, load condition sub-jects were asked to enter the number they had been rehears-ing.
One hundred and seven subjects with a driver’s license forautomobiles participated in the experiment. We excludedthose with a self-reported average driving distance of 0 kilo-metres per month from the dataset. We furthermore ex-cluded one subject who indicated that he was substantiallydistracted during the experiment. We also excluded thosewith more than three errors in the rehearsing task. Thus,a total of 95 subjects remained in the dataset (32 females,63 males). 45 were in the load condition, 50 in the no-loadcondition. Mean age of the sample was 29.56 years (SD =7.38). On average, subjects drove 740.15 km per month (SD= 1459.12).
4. RESULTSPaired-samples t-tests comparing self-evaluations and eval-
uations of the average driver once more replicated the factthat drivers perceive almost each and every aspect of theirdriving abilities as superior. Of the 18 items, only 2 (’Re-versing’ and ’Navigating and driving in unfamiliar area’) didnot yield significant differences. With respect to the 16 otheritems, subjects thought they generally perform these tasksbetter than the average. For one of those items, p < .05,otherwise .001 < p < .01.2
Independent-samples t-tests comparing self-evaluations ofload and no-load subjects did not yield any significant re-sults, .15 < p < .98 for all 18 items. Thus the hypothesisstating depleted cognitive resources would lead to a strongerself-reported superiority was not supported. A closer look atthe data in the no-load condition which, according to our hy-pothesis, had to be surpassed in the load condition, revealsthat for 15 items, the means were considerably large, 5.00 <M < 6.26 (.83 < SD < 1.48). Next, we looked at how accu-rate subjects under load reflected their ratings and whetherthey assumed self-reported superiority for other drivers aswell. For both aspects we found no differences, .38< p < .39.
In the last step we focused on those with a quantitative driv-ing experience at average level or higher. We therefore ex-cluded all subjects with a monthly average driving distancebelow the average value recently found in the German Mo-bility Panel: 1055 km/month.3 Nine subjects remained in
2Since this finding is not very surprising and detailed infor-mation is not of value here, the specific dimensions will notbe mentioned.3The panel is produced on order of The German Fed-eral Ministry of Transport, Building and Urban Devel-opment. The document for the 2011/2012 version canbe found at this location: http://mobilitaetspanel.ifv.uni-karlsruhe.de/de/downloads/mop-berichte/index.html (Ger-man version only)
the load condition, 10 in the no-load condition. The averagedriving distance in this sub-sample was 2336.84 km/month(SD = 2707.49). The mean age grew slightly higher com-pared to the total sample (M = 33.53, SD = 6.11). Therewere 2 females and 17 males.
Again, there were no significant differences between bothconditions, .05 < p < .95 for all 18 items. However, sub-jects under load (M = 5.22, SD = .97) now thought theirprevious self-evaluations were less above average comparedto subjects withoud load (M = 6.30, SD = .68), t(17) =2.83, p < .05, although in fact, there was no difference forsuperiority between both conditions since the hypothesis wasnot supported.
5. DISCUSSIONWe attempted to show that drivers deprived of cognitive
resources would in an offline situation exaggerate their fa-vorable self-evaluations because automatic self-evaluationsare generally more positive. Upon success, it would havebeen interesting to analyze which forms of load (workingmemory, perceptual, communicative) affect the current, notoverall self-evaluation in an online situation. We chose anoffline setting because our concern was to explore the po-tential of two inter-related aspects for driving research: Afeasible methodology using a basic, low-effort load manip-ulation, and the diverse responses under depleted cognitiveresources. However, with respect to automatic versus con-trolled self-evaluations, there was not much left to disentan-gle. Even when drivers had sufficient resources to correctoverly positive self-evaluations along the presented tasks, theself-evaluations were still very positive. There was simply nomore potential for an increase in the load condition.
Instead, we found that in this offline situation, some driversunder load were less aware of how superior they actuallyevaluated their own abilities. Although load did not affectactual evaluations, it had an effect on meta-evaluations forthose driving as much as or more than the average Germandriver. While this result should be explored further with alarger sample, it indicates how cognitive load modulates theassessment of driving skills if driving is performed with cer-tain experience. Acquiring experience in an activity meansto perform it more automatic and mindless. It becomes anactivity that requires abilities one does no longer cast doubton. Experienced drivers may lose practice in effortfully re-considering their self-image, especially when they rarely en-counter critical situations. Under load, they are deprived ofthe possibility to accurately reflect upon their evaluations.It becomes too effortful to align their evaluations to reality.For less experienced drivers, this effort may be smaller. Moredata is needed to support this possible explanation. Further-more, future studies need to clarify whether the differencein meta-evaluations for experienced drivers under load ver-sus not under load are caused by idiosyncrasies of driving,or whether there is a general underlying tendency not par-ticularly related to driving. This can be accomplished by acomparison with self-evaluations of other skills.
The result suggests there may be a large amount of driverswhich, in certain situations, become less aware of the factthat they are likely to overestimate their own abilities. Evenif we assume this erroneous meta-evaluation has no effect
48
Adjunct Proceedings of the 5th International Conference on Automotive User Interfaces and Interactive Vehicular Applications (AutomotiveUI ‚13), October 28–30, 2013, Eindhoven, The Netherlands.
on actual driving because the exaggerated self-evaluationsalso might not, it would be hard to ignore how experienceddrivers could sometimes fail to realize their self-view as be-ing highly biased. Generally, succumbing to biased thinkingrarely is a desirable state of mind. This is, for instance, thereason why it would be important to overcome stereotypesagainst drivers belonging to a specific social category.
6. LIMITATIONSIt is important to note the limitations inherent to a web-
based experiment on cognitive load. First, even in a labora-tory study it is sometimes hard to verify whether subjectsin the load cognition were in fact under load and those inthe control condition were not [4]. This holds all the morefor the approach presented here. Second, web-based experi-ments are not set within a controlled environment. Althoughthe instructions being provided stressed the need for full con-centration, subject distraction may still have occurred. Wetried to address this issue by excluding all subjects whichindicated they were substantially distracted during the pro-cedure. Of course, being slightly or substantially distractedis rather subjective. In fact, subjects in the load conditionare expected to have been distracted to a minimum degreeor not at all because otherwise, they were most likely ex-cluded after failing to rehearse the 8-digit number. Last, itis possible that subjects cheated and wrote down the num-ber instead of rehearsing it mentally. However, as an indi-cator of validity of the present study, drivers’ self-perceivedsuperiority was replicated and emerged on a multitude ofdimensions.
7. ACKNOWLEDGMENTSThis research was supported by the German Federal Min-
istry of Education and Research (BMBF) within the Leading-Edge Cluster ”it’s OWL”, managed by the Project Manage-ment Agency Karlsruhe (PTKA), as well as by the DeutscheForschungsgemeinschaft (DFG) within the Center of Excel-lence 277 ”Cognitive Interaction Technology” (CITEC). Theauthors are responsible for the contents of this publication.
8. REFERENCES[1] K. K. Deaux. Honking at the intersection: A
replication and extension. The Journal of SocialPsychology, 84(1):159–160, 1971.
[2] P. Delhomme. Comparing one’s driving with others’:Assessment of abilities and frequency of offences.evidence for a superior conformity of self-bias?Accident Analysis & Prevention, 23(6):493–508, 1991.
[3] J. Engstrom, E. Johansson, and J. Ostlund. Effects ofvisual and cognitive load in real and simulatedmotorway driving. Transportation Research Part F:Traffic Psychology and Behaviour, 8(2):97–120, 2005.
[4] D. T. Gilbert and J. G. Hixon. The trouble ofthinking: Activation and application of stereotypicbeliefs. Journal of Personality and Social Psychology,60(4):509–517, 1991.
[5] N. Hon, J.-H. Poh, and C.-S. Soon. Preoccupied mindsfeel less control: Sense of agency is modulated bycognitive load. Consciousness and cognition,22(2):556–561, 2013.
[6] S. L. Koole, A. Dijksterhuis, and A. van Knippenberg.What’s in a name: implicit self-esteem and the
automatic self. Journal of Personality and SocialPsychology, 80(4):669–685, 2001.
[7] D. Lamble, T. Kauranen, M. Laakso, andH. Summala. Cognitive load and detection thresholdsin car following situations: safety implications forusing mobile (cellular) telephones while driving.Accident; analysis and prevention, 31(6):617–623,1999.
[8] R. L. Marsh and J. L. Hicks. Event-based prospectivememory and executive control of working memory.Journal of Experimental Psychology, 24(2):336–349,1998.
[9] F. P. McKenna, R. A. Stanier, and C. Lewis. Factorsunderlying illusory self-assessment of driving skill inmales and females. Accident Analysis & Prevention,23(1):45–52, 1991.
[10] D. L. Paulhus. Bypassing the will: the automatizationof affirmations. In D. M. Wegner and J. W.Pennebaker, editors, Handbook of mental control,pages 573–587. Prentice Hall, 1993.
[11] D. Shinar. Aggressive driving: the contribution of thedrivers and the situation. Transportation ResearchPart F: Traffic Psychology and Behaviour,1(2):137–160, 1998.
[12] W. B. J. Swann, J. G. Hixon, A. Stein-Seroussi, andD. T. Gilbert. The fleeting gleam of praise: cognitiveprocesses underlying behavioral reactions toself-relevant feedback. Journal of Personality andSocial Psychology, 59(1):17–26, 1990.
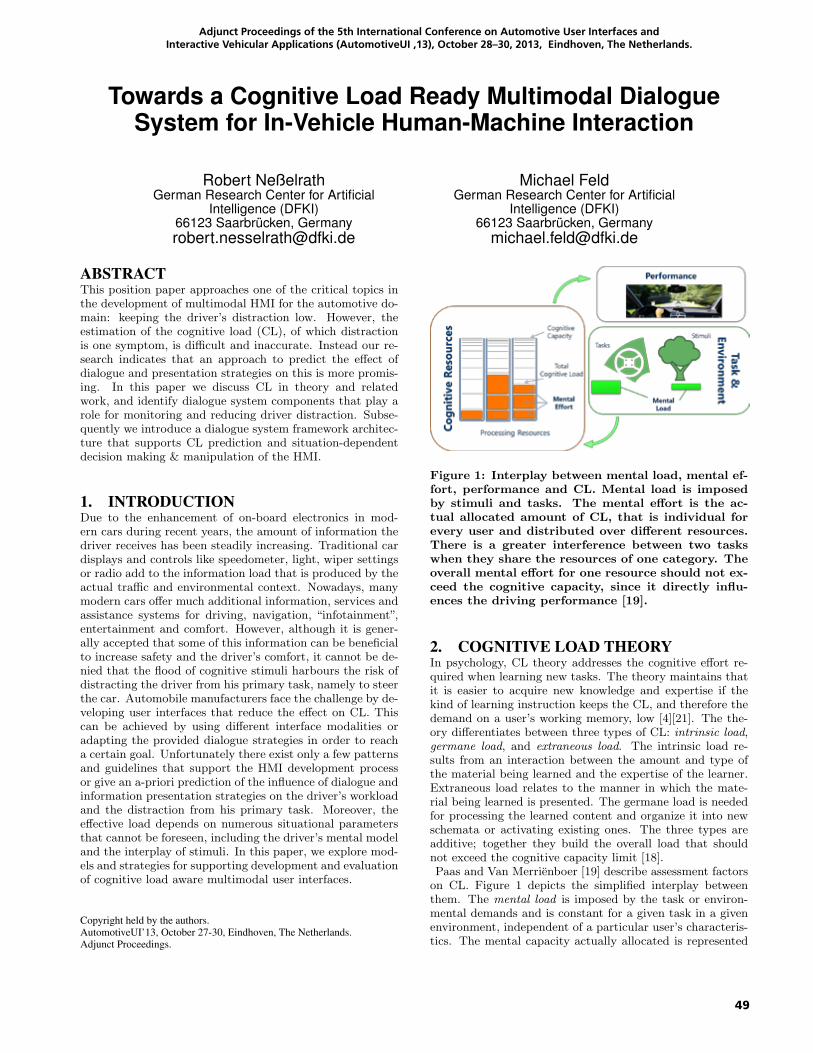
49
Adjunct Proceedings of the 5th International Conference on Automotive User Interfaces and Interactive Vehicular Applications (AutomotiveUI ‚13), October 28–30, 2013, Eindhoven, The Netherlands.
Towards a Cognitive Load Ready Multimodal DialogueSystem for In-Vehicle Human-Machine Interaction
Robert NeßelrathGerman Research Center for Artificial
Intelligence (DFKI)66123 Saarbrücken, [email protected]
Michael FeldGerman Research Center for Artificial
Intelligence (DFKI)66123 Saarbrücken, Germany
ABSTRACTThis position paper approaches one of the critical topics inthe development of multimodal HMI for the automotive do-main: keeping the driver’s distraction low. However, theestimation of the cognitive load (CL), of which distractionis one symptom, is difficult and inaccurate. Instead our re-search indicates that an approach to predict the effect ofdialogue and presentation strategies on this is more promis-ing. In this paper we discuss CL in theory and relatedwork, and identify dialogue system components that play arole for monitoring and reducing driver distraction. Subse-quently we introduce a dialogue system framework architec-ture that supports CL prediction and situation-dependentdecision making & manipulation of the HMI.
1. INTRODUCTIONDue to the enhancement of on-board electronics in mod-ern cars during recent years, the amount of information thedriver receives has been steadily increasing. Traditional cardisplays and controls like speedometer, light, wiper settingsor radio add to the information load that is produced by theactual traffic and environmental context. Nowadays, manymodern cars offer much additional information, services andassistance systems for driving, navigation, “infotainment”,entertainment and comfort. However, although it is gener-ally accepted that some of this information can be beneficialto increase safety and the driver’s comfort, it cannot be de-nied that the flood of cognitive stimuli harbours the risk ofdistracting the driver from his primary task, namely to steerthe car. Automobile manufacturers face the challenge by de-veloping user interfaces that reduce the effect on CL. Thiscan be achieved by using different interface modalities oradapting the provided dialogue strategies in order to reacha certain goal. Unfortunately there exist only a few patternsand guidelines that support the HMI development processor give an a-priori prediction of the influence of dialogue andinformation presentation strategies on the driver’s workloadand the distraction from his primary task. Moreover, theeffective load depends on numerous situational parametersthat cannot be foreseen, including the driver’s mental modeland the interplay of stimuli. In this paper, we explore mod-els and strategies for supporting development and evaluationof cognitive load aware multimodal user interfaces.
Copyright held by the authors.AutomotiveUI’13, October 27-30, Eindhoven, The Netherlands.Adjunct Proceedings.
Figure 1: Interplay between mental load, mental ef-fort, performance and CL. Mental load is imposedby stimuli and tasks. The mental effort is the ac-tual allocated amount of CL, that is individual forevery user and distributed over different resources.There is a greater interference between two taskswhen they share the resources of one category. Theoverall mental effort for one resource should not ex-ceed the cognitive capacity, since it directly influ-ences the driving performance [19].
2. COGNITIVE LOAD THEORYIn psychology, CL theory addresses the cognitive effort re-quired when learning new tasks. The theory maintains thatit is easier to acquire new knowledge and expertise if thekind of learning instruction keeps the CL, and therefore thedemand on a user’s working memory, low [4][21]. The the-ory differentiates between three types of CL: intrinsic load,germane load, and extraneous load. The intrinsic load re-sults from an interaction between the amount and type ofthe material being learned and the expertise of the learner.Extraneous load relates to the manner in which the mate-rial being learned is presented. The germane load is neededfor processing the learned content and organize it into newschemata or activating existing ones. The three types areadditive; together they build the overall load that shouldnot exceed the cognitive capacity limit [18].Paas and Van Merrienboer [19] describe assessment factorson CL. Figure 1 depicts the simplified interplay betweenthem. The mental load is imposed by the task or environ-mental demands and is constant for a given task in a givenenvironment, independent of a particular user’s characteris-tics. The mental capacity actually allocated is represented
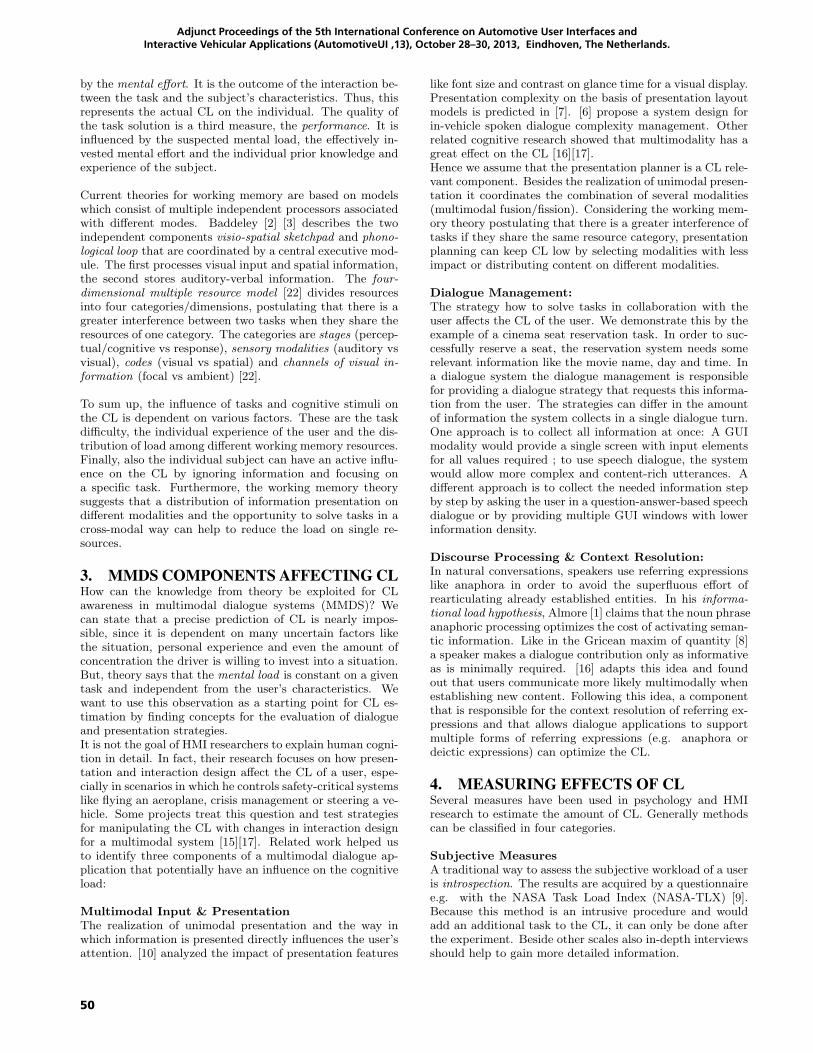
50
Adjunct Proceedings of the 5th International Conference on Automotive User Interfaces and Interactive Vehicular Applications (AutomotiveUI ‚13), October 28–30, 2013, Eindhoven, The Netherlands.
by the mental effort. It is the outcome of the interaction be-tween the task and the subject’s characteristics. Thus, thisrepresents the actual CL on the individual. The quality ofthe task solution is a third measure, the performance. It isinfluenced by the suspected mental load, the effectively in-vested mental effort and the individual prior knowledge andexperience of the subject.
Current theories for working memory are based on modelswhich consist of multiple independent processors associatedwith different modes. Baddeley [2] [3] describes the twoindependent components visio-spatial sketchpad and phono-logical loop that are coordinated by a central executive mod-ule. The first processes visual input and spatial information,the second stores auditory-verbal information. The four-dimensional multiple resource model [22] divides resourcesinto four categories/dimensions, postulating that there is agreater interference between two tasks when they share theresources of one category. The categories are stages (percep-tual/cognitive vs response), sensory modalities (auditory vsvisual), codes (visual vs spatial) and channels of visual in-formation (focal vs ambient) [22].
To sum up, the influence of tasks and cognitive stimuli onthe CL is dependent on various factors. These are the taskdifficulty, the individual experience of the user and the dis-tribution of load among different working memory resources.Finally, also the individual subject can have an active influ-ence on the CL by ignoring information and focusing ona specific task. Furthermore, the working memory theorysuggests that a distribution of information presentation ondifferent modalities and the opportunity to solve tasks in across-modal way can help to reduce the load on single re-sources.
3. MMDS COMPONENTS AFFECTING CLHow can the knowledge from theory be exploited for CLawareness in multimodal dialogue systems (MMDS)? Wecan state that a precise prediction of CL is nearly impos-sible, since it is dependent on many uncertain factors likethe situation, personal experience and even the amount ofconcentration the driver is willing to invest into a situation.But, theory says that the mental load is constant on a giventask and independent from the user’s characteristics. Wewant to use this observation as a starting point for CL es-timation by finding concepts for the evaluation of dialogueand presentation strategies.It is not the goal of HMI researchers to explain human cogni-tion in detail. In fact, their research focuses on how presen-tation and interaction design affect the CL of a user, espe-cially in scenarios in which he controls safety-critical systemslike flying an aeroplane, crisis management or steering a ve-hicle. Some projects treat this question and test strategiesfor manipulating the CL with changes in interaction designfor a multimodal system [15][17]. Related work helped usto identify three components of a multimodal dialogue ap-plication that potentially have an influence on the cognitiveload:
Multimodal Input & PresentationThe realization of unimodal presentation and the way inwhich information is presented directly influences the user’sattention. [10] analyzed the impact of presentation features
like font size and contrast on glance time for a visual display.Presentation complexity on the basis of presentation layoutmodels is predicted in [7]. [6] propose a system design forin-vehicle spoken dialogue complexity management. Otherrelated cognitive research showed that multimodality has agreat effect on the CL [16][17].Hence we assume that the presentation planner is a CL rele-vant component. Besides the realization of unimodal presen-tation it coordinates the combination of several modalities(multimodal fusion/fission). Considering the working mem-ory theory postulating that there is a greater interference oftasks if they share the same resource category, presentationplanning can keep CL low by selecting modalities with lessimpact or distributing content on different modalities.
Dialogue Management:The strategy how to solve tasks in collaboration with theuser affects the CL of the user. We demonstrate this by theexample of a cinema seat reservation task. In order to suc-cessfully reserve a seat, the reservation system needs somerelevant information like the movie name, day and time. Ina dialogue system the dialogue management is responsiblefor providing a dialogue strategy that requests this informa-tion from the user. The strategies can differ in the amountof information the system collects in a single dialogue turn.One approach is to collect all information at once: A GUImodality would provide a single screen with input elementsfor all values required ; to use speech dialogue, the systemwould allow more complex and content-rich utterances. Adifferent approach is to collect the needed information stepby step by asking the user in a question-answer-based speechdialogue or by providing multiple GUI windows with lowerinformation density.
Discourse Processing & Context Resolution:In natural conversations, speakers use referring expressionslike anaphora in order to avoid the superfluous effort ofrearticulating already established entities. In his informa-tional load hypothesis, Almore [1] claims that the noun phraseanaphoric processing optimizes the cost of activating seman-tic information. Like in the Gricean maxim of quantity [8]a speaker makes a dialogue contribution only as informativeas is minimally required. [16] adapts this idea and foundout that users communicate more likely multimodally whenestablishing new content. Following this idea, a componentthat is responsible for the context resolution of referring ex-pressions and that allows dialogue applications to supportmultiple forms of referring expressions (e.g. anaphora ordeictic expressions) can optimize the CL.
4. MEASURING EFFECTS OF CLSeveral measures have been used in psychology and HMIresearch to estimate the amount of CL. Generally methodscan be classified in four categories.
Subjective MeasuresA traditional way to assess the subjective workload of a useris introspection. The results are acquired by a questionnairee.g. with the NASA Task Load Index (NASA-TLX) [9].Because this method is an intrusive procedure and wouldadd an additional task to the CL, it can only be done afterthe experiment. Beside other scales also in-depth interviewsshould help to gain more detailed information.
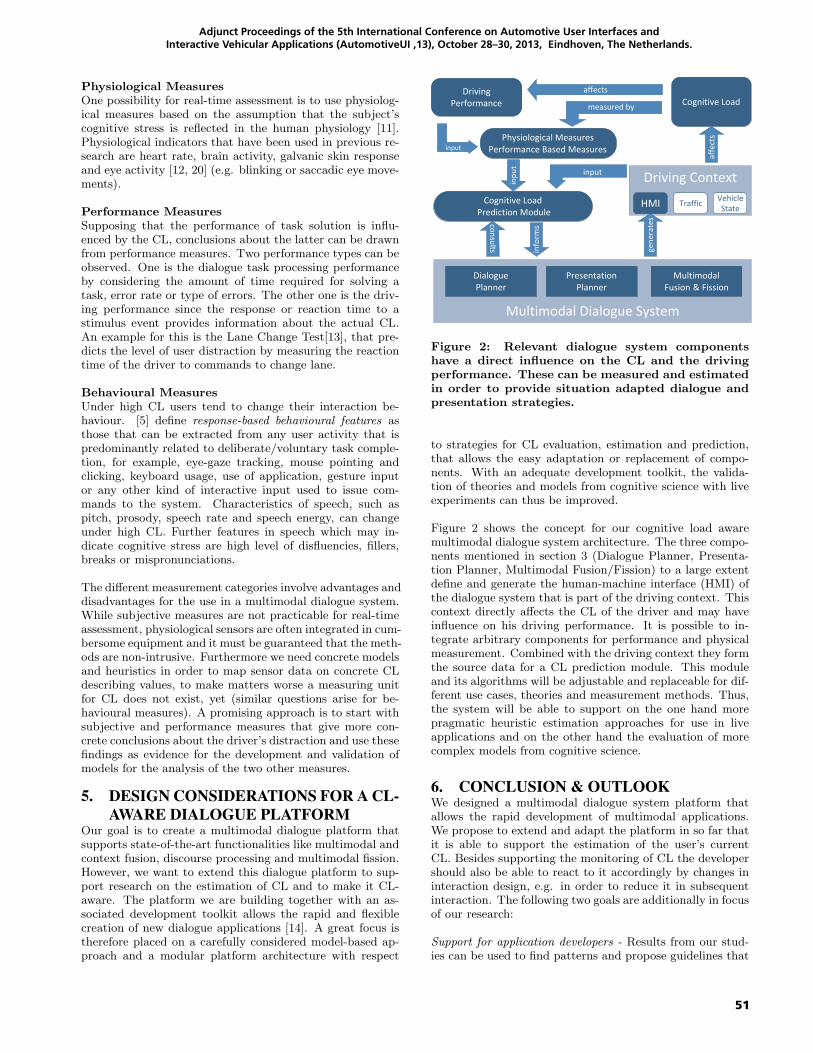
51
Adjunct Proceedings of the 5th International Conference on Automotive User Interfaces and Interactive Vehicular Applications (AutomotiveUI ‚13), October 28–30, 2013, Eindhoven, The Netherlands.
Physiological MeasuresOne possibility for real-time assessment is to use physiolog-ical measures based on the assumption that the subject’scognitive stress is reflected in the human physiology [11].Physiological indicators that have been used in previous re-search are heart rate, brain activity, galvanic skin responseand eye activity [12, 20] (e.g. blinking or saccadic eye move-ments).
Performance MeasuresSupposing that the performance of task solution is influ-enced by the CL, conclusions about the latter can be drawnfrom performance measures. Two performance types can beobserved. One is the dialogue task processing performanceby considering the amount of time required for solving atask, error rate or type of errors. The other one is the driv-ing performance since the response or reaction time to astimulus event provides information about the actual CL.An example for this is the Lane Change Test[13], that pre-dicts the level of user distraction by measuring the reactiontime of the driver to commands to change lane.
Behavioural MeasuresUnder high CL users tend to change their interaction be-haviour. [5] define response-based behavioural features asthose that can be extracted from any user activity that ispredominantly related to deliberate/voluntary task comple-tion, for example, eye-gaze tracking, mouse pointing andclicking, keyboard usage, use of application, gesture inputor any other kind of interactive input used to issue com-mands to the system. Characteristics of speech, such aspitch, prosody, speech rate and speech energy, can changeunder high CL. Further features in speech which may in-dicate cognitive stress are high level of disfluencies, fillers,breaks or mispronunciations.
The different measurement categories involve advantages anddisadvantages for the use in a multimodal dialogue system.While subjective measures are not practicable for real-timeassessment, physiological sensors are often integrated in cum-bersome equipment and it must be guaranteed that the meth-ods are non-intrusive. Furthermore we need concrete modelsand heuristics in order to map sensor data on concrete CLdescribing values, to make matters worse a measuring unitfor CL does not exist, yet (similar questions arise for be-havioural measures). A promising approach is to start withsubjective and performance measures that give more con-crete conclusions about the driver’s distraction and use thesefindings as evidence for the development and validation ofmodels for the analysis of the two other measures.
5. DESIGN CONSIDERATIONS FOR A CL-AWARE DIALOGUE PLATFORM
Our goal is to create a multimodal dialogue platform thatsupports state-of-the-art functionalities like multimodal andcontext fusion, discourse processing and multimodal fission.However, we want to extend this dialogue platform to sup-port research on the estimation of CL and to make it CL-aware. The platform we are building together with an as-sociated development toolkit allows the rapid and flexiblecreation of new dialogue applications [14]. A great focus istherefore placed on a carefully considered model-based ap-proach and a modular platform architecture with respect
Driving Context
Traffic
Multimodal Dialogue System
DrivingPerformance Cognitive Load
Cognitive Load Prediction Module
Physiological MeasuresPerformance Based Measures
DialoguePlanner
PresentationPlanner
MultimodalFusion & Fission
affects
affe
cts
measured by
input
info
rms
HMI Vehicle State
input
Figure 2: Relevant dialogue system componentshave a direct influence on the CL and the drivingperformance. These can be measured and estimatedin order to provide situation adapted dialogue andpresentation strategies.
to strategies for CL evaluation, estimation and prediction,that allows the easy adaptation or replacement of compo-nents. With an adequate development toolkit, the valida-tion of theories and models from cognitive science with liveexperiments can thus be improved.
Figure 2 shows the concept for our cognitive load awaremultimodal dialogue system architecture. The three compo-nents mentioned in section 3 (Dialogue Planner, Presenta-tion Planner, Multimodal Fusion/Fission) to a large extentdefine and generate the human-machine interface (HMI) ofthe dialogue system that is part of the driving context. Thiscontext directly affects the CL of the driver and may haveinfluence on his driving performance. It is possible to in-tegrate arbitrary components for performance and physicalmeasurement. Combined with the driving context they formthe source data for a CL prediction module. This moduleand its algorithms will be adjustable and replaceable for dif-ferent use cases, theories and measurement methods. Thus,the system will be able to support on the one hand morepragmatic heuristic estimation approaches for use in liveapplications and on the other hand the evaluation of morecomplex models from cognitive science.
6. CONCLUSION & OUTLOOKWe designed a multimodal dialogue system platform thatallows the rapid development of multimodal applications.We propose to extend and adapt the platform in so far thatit is able to support the estimation of the user’s currentCL. Besides supporting the monitoring of CL the developershould also be able to react to it accordingly by changes ininteraction design, e.g. in order to reduce it in subsequentinteraction. The following two goals are additionally in focusof our research:
Support for application developers - Results from our stud-ies can be used to find patterns and propose guidelines that

52
Adjunct Proceedings of the 5th International Conference on Automotive User Interfaces and Interactive Vehicular Applications (AutomotiveUI ‚13), October 28–30, 2013, Eindhoven, The Netherlands.
help to develop interfaces with a low effect on the CL. Sincenot every application designer will have adequate experi-ence to apply these in practice, a system that predicts thecomplexity of an interaction design and supports the appli-cation developer in his work will provide a valuable benefit.Thus, during the design process, dialogue platform tools canadvise the developer with CL predictions for dialogue andpresentation strategies.
Support for situation-adaptive systems - A future goal is tobuild systems that adapt their communication behaviourwith respect to the current context and CL of the driver.For this purpose, our architecture allows the cooperationbetween the dialogue system and the prediction module inorder to plan situation-aware behaviour of the HMI.
7. ACKNOWLEDGMENTSThis work was funded by the German Ministry of Educa-tion and Research (project SiAM: Situation-Adaptive Mul-timodal Interaction for Innovative Mobility Concepts for theFuture; grant number 01IW11004).
8. REFERENCES[1] A. Almor. Noun-phrase anaphora and focus: The
informational load hypothesis. Psychological Review,106(4):748 – 765, October 1999.
[2] A. Baddeley. Working memory: looking back andlooking forward. Nature Reviews Neuroscience,4:829–837, 2003.
[3] A. Baddeley. Working memory: theories, models, andcontroversies. Annual review of psychology, 63:1–29,2012.
[4] P. Chandler and J. Sweller. Cognitive load theory andthe format of instruction. In L. E. Associates, editor,Cognition and Instruction, pages 292–332. Taylor &Francis, 1991.
[5] F. Chen, N. Ruiz, E. Choi, J. Epps, M. A. Khawaja,R. Taib, B. Yin, and Y. Wang. Multimodal behaviorand interaction as indicators of cognitive load. ACMTrans. Interact. Intell. Syst., 2(4):22:1–22:36, Jan.2013.
[6] V. Demberg and A. Sayeed. Linguistic cognitive load:implications for automotive UIs. In AdjunctProceedings of the 3rd International Conference onAutomotive User Interfaces and Interactive VehicularApplications (Automotive UI 2011), 2011.
[7] C. Endres, M. Feld, and C. Muller. A layout-basedestimation of presentation complexity. In AdjunctProceedings of the 4th International Conference onAutomotive User Interfaces and Interactive VehicularApplications (AutomotiveUI 2012), pages 19–20,Portsmouth, New Hampshire, USA, October 2012.
[8] H. Grice. Logic and conversation. In Syntax andSemantics. Academic Press, 1975.
[9] S. G. Hart and L. E. Staveland. Development ofNASA-TLX (task load index): Results of empiricaland theoretical research. Human mental workload,1(3):139–183, 1988.
[10] D. Imbeau, W. W. Wierwille, and Y. Beauchamp.Age, display design and driving performance.Automotive ergonomics, pages 339–357, 1993.
[11] A. E. Kramer. Physiological Metrics of Mental
Workload: A Review of Recent Progress. DefenseTechnical Information Center, 1990.
[12] S. P. Marshall. The index of cognitive activity:Measuring cognitive workload. In In Proceedings of the7th IEEE Conference on Human Factors and PowerPlants, 2002.
[13] S. Mattes and A. Hallen. Driver distraction: Theory,Effects and Mitigation, chapter Surrogate DistractionMeasurement Techniques: The Lane Change Test,pages 107–122. CRC Press, 2009.
[14] R. Nesselrath and D. Porta. Rapid development ofmultimodal dialogue applications with semanticmodels. In Proceedings of the 7th IJCAI Workshop onKnowledge and Reasoning in Practical DialogueSystems (KRPD-11). Twenty-Second InternationalJoint Conference On Artificial Intelligence (IJCAI-11), Barcelona, Spain, July 2011.
[15] A. Niculescu, Y. Cao, and A. Nijholt. Manipulatingstress and cognitive load in conversational interactionswith a multimodal system for crisis managementsupport. In A. Esposito, N. Campbell, C. Vogel,A. Hussain, and A. Nijholt, editors, Development ofMultimodal Interfaces: Active Listening andSynchrony, Lecture Notes in Computer Science 5967,pages 134–147, Heidelberg, 2010.
[16] S. Oviatt, R. Coulston, and R. Lunsford. When do weinteract multimodally?: cognitive load andmultimodal communication patterns. In Proceedings ofthe 6th international conference on Multimodalinterfaces, ICMI ’04, pages 129–136, New York, NY,USA, 2004. ACM.
[17] S. Oviatt, R. Coulston, S. Tomko, B. Xiao,R. Lunsford, M. Wesson, and L. Carmichael. Toward atheory of organized multimodal integration patternsduring human-computer interaction. In Proceedings ofthe 5th international conference on Multimodalinterfaces, ICMI ’03, pages 44–51, New York, NY,USA, 2003. ACM.
[18] F. Paas, J. E. Tuovinen, H. Tabbers, and P. W. M. V.Gerven. Cognitive load measurement as a means toadvance cognitive load theory. EducationalPsychologist, 38(1):63–71, 2003.
[19] F. G. Paas and J. J. Merrienboer. Instructionalcontrol of cognitive load in the training of complexcognitive tasks. Educational Psychology Review,6(4):351–371, 1994.
[20] M. Schwalm, A. Keinath, and H. D. Zimmer.Pupillometry as a method for measuring mentalworkload within a simulated driving task. HumanFactors for assistance and automation, pages 1–13,2008.
[21] J. Sweller. Cognitive load during problem solving:Effects on learning. Cognitive Science, 12(2):257–285,1988.
[22] C. D. Wickens. Multiple resources and performanceprediction. Theoretical Issues in Ergonomics Science,3(2):159–177, 2002.

53
Adjunct Proceedings of the 5th International Conference on Automotive User Interfaces and Interactive Vehicular Applications (AutomotiveUI ‚13), October 28–30, 2013, Eindhoven, The Netherlands.
Model-based engineering of user interfacesto support cognitive load estimation in automotive
applications
Giorgio BrajnikComputer Science School
University of Manchester, UKand
Dipartimento di Matematica e InformaticaUniversità di Udine, Italy
Simon HarperComputer Science School
University of Manchester, [email protected]
ABSTRACTIn this brief position paper we argue that model-driven engineeringpractices could be adopted in the design and evaluation of automo-tive UI. We illustrate how UML state machine models can be usedfor automatic generation of executable prototypes of the UI and forcomputing graph-theoretic metrics that could bear upon cognitiveload.
Categories and Subject DescriptorsH.1.2 [Information Systems Applications]: Models and Princi-ples—Human factors; H.5.2 [Information Interfaces and Presen-tation]: User Interfaces—Prototyping, user-centered design, Graph-ical user interfaces; D.2.8 [Software Engineering]: Metrics—complexity measures, performance measures; D.2.m [Software En-gineering]: Miscellaneous—rapid prototyping; D.2.2 [SoftwareEngineering]: State diagrams—UML state machines, statecharts
General TermsSoftware engineering, model-based user interfaces, model-drivenengineering, interaction design, usability
1. INTRODUCTIONBad usability critically affects embedded systems such as those
on board of cars for two reasons. On the one hand, systems arecostly to replace (higher costs in recalling, in disseminating, in re-installing new versions); on the other hand, their context of use iscritical, as bad usability in such user interfaces often leads to lowsafety.
Although advanced UIs can be conceived that reduce drivers’cognitive load, drivers will still have to interact with them. Forexample, [5] highlight several factors that can lead to drivers’ dis-tractions when using a GPS navigator and suggest remedies suchas: while driving in familiar areas the level of detail of instructions
AutomotiveUI’13, October 27-30, Eindhoven, The Netherlands.Adjunct Proceedings.Copyright 2013 held by the authors.
provided by the navigator should be reduced, whereas it should in-crease with high traffic density, or bad weather, or when driving inunknown areas. Even with such adaptive navigators that optimizetheir output, drivers might need to interact with the navigator whiledriving: to turn off or on its voice, to change view on the map, toget an overview of the suggested route, to see the estimated timeor distance to arrival, to locate some intermediate destination onthe map, etc. Each of these use cases might require an attentionswitch that could be fatal, especially if the user interface requiresobservation and concentration.
To produce designs of user interface that are valid, there is nosubstitute of iteratively carrying out usability investigations. How-ever, designers use static prototypes (sketches, storyboards, pagemockups) or minimally interactive ones (clickable PDFs or slides),which lack most details regarding the dynamics of the user inter-face. In fact, because prototypes are manually built, not all the datanor all user actions are implemented and can be therefore investi-gated. As argued by [4], mixed-fidelity prototypes are often neededin order to perform a usability investigation that can reveal majorusability problems. Almost always, because of cost, manually builtprototypes show poor levels of fidelity in terms of richness of dataand of interactivity, reducing the interactions that could be consid-ered during the investigation. And this is despite user actions beingan important focal point of designers ([1] offers an ample discus-sion) and crucial for usability investigations (cfr. “interaction cy-cle” by [6], goal-action-effect “triangle” [3]).
A different line of attack is based on using metrics. Over theyears, metrics have been developed that can be applied to user inter-faces with the aim of characterizing some property that bears uponusability. For example, [9] illustrate a number of graph-related met-rics that can be used to highlight usability aspects of user interfaces.Using a transition network where states represent screens of theuser interface and transitions represent user actions, these authorsshow that metrics that measure centrality in a graph, such as “be-tweenness” of states, do bear upon usability defects of devices likehospital infusion pumps, and that findings deriving from such met-rics could be used to identify severe problems and hence to promptfor design modifications.
2. MODEL-DRIVEN ENGINEERINGThe context of this research is model-driven engineering (MDE)
methodologies [7, 8] for developing user interfaces. In generalthese approaches provide means for using models to direct the courseof understanding design, construction, deployment, operation, main-
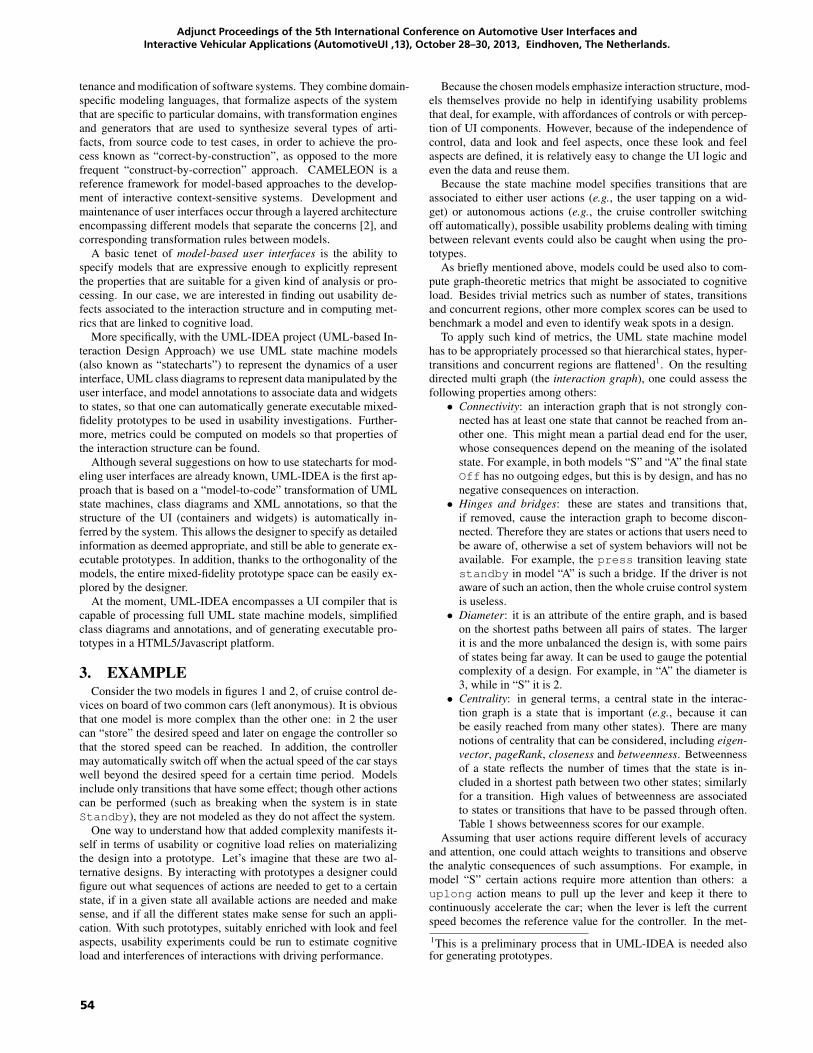
54
Adjunct Proceedings of the 5th International Conference on Automotive User Interfaces and Interactive Vehicular Applications (AutomotiveUI ‚13), October 28–30, 2013, Eindhoven, The Netherlands.
tenance and modification of software systems. They combine domain-specific modeling languages, that formalize aspects of the systemthat are specific to particular domains, with transformation enginesand generators that are used to synthesize several types of arti-facts, from source code to test cases, in order to achieve the pro-cess known as “correct-by-construction”, as opposed to the morefrequent “construct-by-correction” approach. CAMELEON is areference framework for model-based approaches to the develop-ment of interactive context-sensitive systems. Development andmaintenance of user interfaces occur through a layered architectureencompassing different models that separate the concerns [2], andcorresponding transformation rules between models.
A basic tenet of model-based user interfaces is the ability tospecify models that are expressive enough to explicitly representthe properties that are suitable for a given kind of analysis or pro-cessing. In our case, we are interested in finding out usability de-fects associated to the interaction structure and in computing met-rics that are linked to cognitive load.
More specifically, with the UML-IDEA project (UML-based In-teraction Design Approach) we use UML state machine models(also known as “statecharts”) to represent the dynamics of a userinterface, UML class diagrams to represent data manipulated by theuser interface, and model annotations to associate data and widgetsto states, so that one can automatically generate executable mixed-fidelity prototypes to be used in usability investigations. Further-more, metrics could be computed on models so that properties ofthe interaction structure can be found.
Although several suggestions on how to use statecharts for mod-eling user interfaces are already known, UML-IDEA is the first ap-proach that is based on a “model-to-code” transformation of UMLstate machines, class diagrams and XML annotations, so that thestructure of the UI (containers and widgets) is automatically in-ferred by the system. This allows the designer to specify as detailedinformation as deemed appropriate, and still be able to generate ex-ecutable prototypes. In addition, thanks to the orthogonality of themodels, the entire mixed-fidelity prototype space can be easily ex-plored by the designer.
At the moment, UML-IDEA encompasses a UI compiler that iscapable of processing full UML state machine models, simplifiedclass diagrams and annotations, and of generating executable pro-totypes in a HTML5/Javascript platform.
3. EXAMPLEConsider the two models in figures 1 and 2, of cruise control de-
vices on board of two common cars (left anonymous). It is obviousthat one model is more complex than the other one: in 2 the usercan “store” the desired speed and later on engage the controller sothat the stored speed can be reached. In addition, the controllermay automatically switch off when the actual speed of the car stayswell beyond the desired speed for a certain time period. Modelsinclude only transitions that have some effect; though other actionscan be performed (such as breaking when the system is in stateStandby), they are not modeled as they do not affect the system.
One way to understand how that added complexity manifests it-self in terms of usability or cognitive load relies on materializingthe design into a prototype. Let’s imagine that these are two al-ternative designs. By interacting with prototypes a designer couldfigure out what sequences of actions are needed to get to a certainstate, if in a given state all available actions are needed and makesense, and if all the different states make sense for such an appli-cation. With such prototypes, suitably enriched with look and feelaspects, usability experiments could be run to estimate cognitiveload and interferences of interactions with driving performance.
Because the chosen models emphasize interaction structure, mod-els themselves provide no help in identifying usability problemsthat deal, for example, with affordances of controls or with percep-tion of UI components. However, because of the independence ofcontrol, data and look and feel aspects, once these look and feelaspects are defined, it is relatively easy to change the UI logic andeven the data and reuse them.
Because the state machine model specifies transitions that areassociated to either user actions (e.g., the user tapping on a wid-get) or autonomous actions (e.g., the cruise controller switchingoff automatically), possible usability problems dealing with timingbetween relevant events could also be caught when using the pro-totypes.
As briefly mentioned above, models could be used also to com-pute graph-theoretic metrics that might be associated to cognitiveload. Besides trivial metrics such as number of states, transitionsand concurrent regions, other more complex scores can be used tobenchmark a model and even to identify weak spots in a design.
To apply such kind of metrics, the UML state machine modelhas to be appropriately processed so that hierarchical states, hyper-transitions and concurrent regions are flattened1. On the resultingdirected multi graph (the interaction graph), one could assess thefollowing properties among others:
• Connectivity: an interaction graph that is not strongly con-nected has at least one state that cannot be reached from an-other one. This might mean a partial dead end for the user,whose consequences depend on the meaning of the isolatedstate. For example, in both models “S” and “A” the final stateOff has no outgoing edges, but this is by design, and has nonegative consequences on interaction.
• Hinges and bridges: these are states and transitions that,if removed, cause the interaction graph to become discon-nected. Therefore they are states or actions that users need tobe aware of, otherwise a set of system behaviors will not beavailable. For example, the press transition leaving statestandby in model “A” is such a bridge. If the driver is notaware of such an action, then the whole cruise control systemis useless.
• Diameter: it is an attribute of the entire graph, and is basedon the shortest paths between all pairs of states. The largerit is and the more unbalanced the design is, with some pairsof states being far away. It can be used to gauge the potentialcomplexity of a design. For example, in “A” the diameter is3, while in “S” it is 2.
• Centrality: in general terms, a central state in the interac-tion graph is a state that is important (e.g., because it canbe easily reached from many other states). There are manynotions of centrality that can be considered, including eigen-vector, pageRank, closeness and betweenness. Betweennessof a state reflects the number of times that the state is in-cluded in a shortest path between two other states; similarlyfor a transition. High values of betweenness are associatedto states or transitions that have to be passed through often.Table 1 shows betweenness scores for our example.
Assuming that user actions require different levels of accuracyand attention, one could attach weights to transitions and observethe analytic consequences of such assumptions. For example, inmodel “S” certain actions require more attention than others: auplong action means to pull up the lever and keep it there tocontinuously accelerate the car; when the lever is left the currentspeed becomes the reference value for the controller. In the met-1This is a preliminary process that in UML-IDEA is needed alsofor generating prototypes.
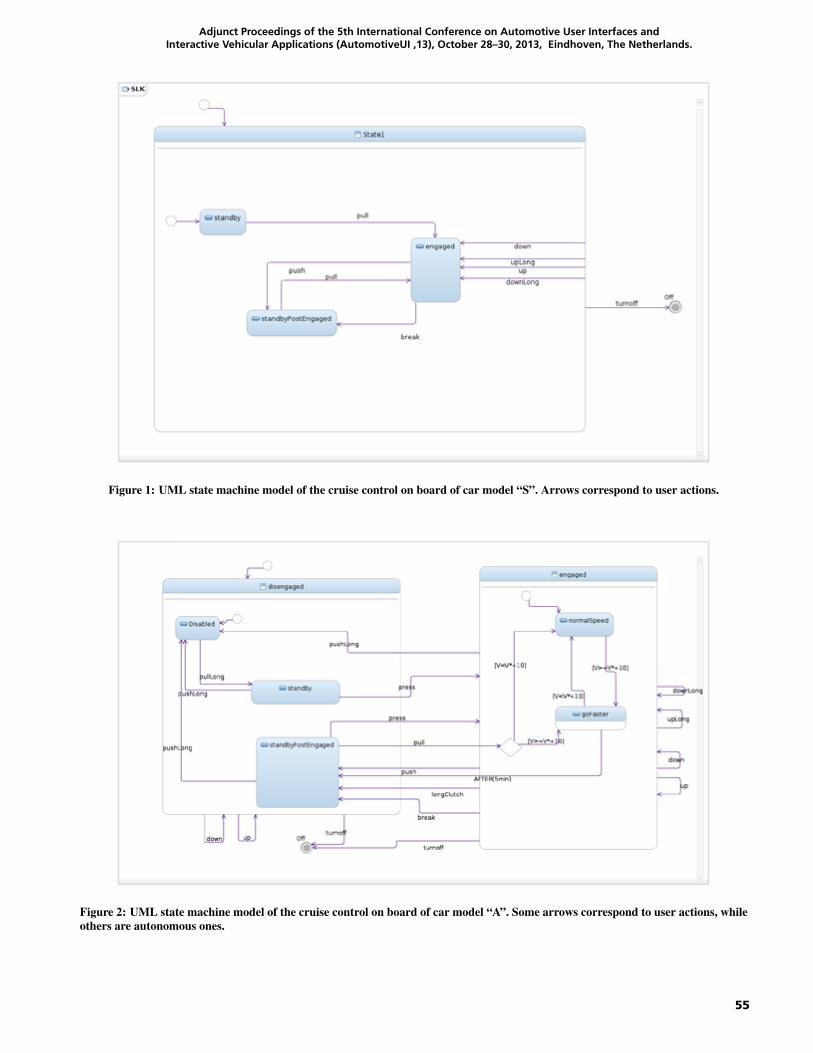
55
Adjunct Proceedings of the 5th International Conference on Automotive User Interfaces and Interactive Vehicular Applications (AutomotiveUI ‚13), October 28–30, 2013, Eindhoven, The Netherlands.
Figure 1: UML state machine model of the cruise control on board of car model “S”. Arrows correspond to user actions.
Figure 2: UML state machine model of the cruise control on board of car model “A”. Some arrows correspond to user actions, whileothers are autonomous ones.
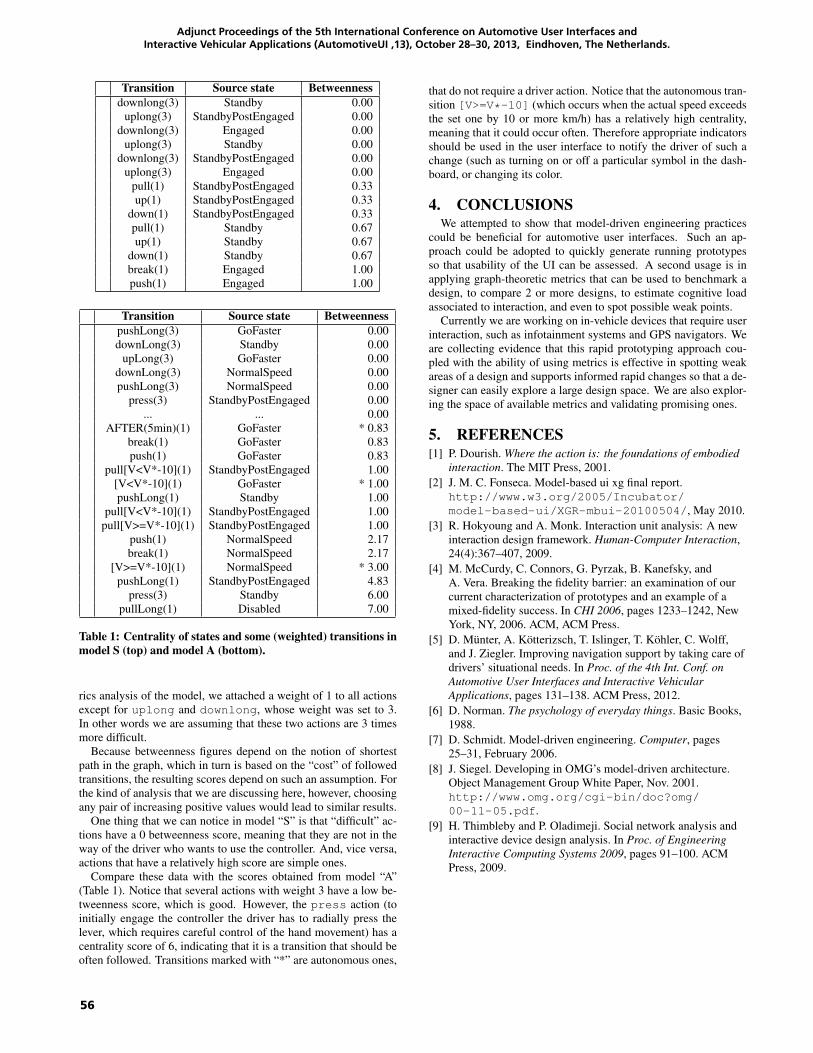
56
Adjunct Proceedings of the 5th International Conference on Automotive User Interfaces and Interactive Vehicular Applications (AutomotiveUI ‚13), October 28–30, 2013, Eindhoven, The Netherlands.
Transition Source state Betweennessdownlong(3) Standby 0.00
uplong(3) StandbyPostEngaged 0.00downlong(3) Engaged 0.00
uplong(3) Standby 0.00downlong(3) StandbyPostEngaged 0.00
uplong(3) Engaged 0.00pull(1) StandbyPostEngaged 0.33up(1) StandbyPostEngaged 0.33
down(1) StandbyPostEngaged 0.33pull(1) Standby 0.67up(1) Standby 0.67
down(1) Standby 0.67break(1) Engaged 1.00push(1) Engaged 1.00
Transition Source state BetweennesspushLong(3) GoFaster 0.00downLong(3) Standby 0.00
upLong(3) GoFaster 0.00downLong(3) NormalSpeed 0.00pushLong(3) NormalSpeed 0.00
press(3) StandbyPostEngaged 0.00... ... 0.00
AFTER(5min)(1) GoFaster * 0.83break(1) GoFaster 0.83push(1) GoFaster 0.83
pull[V<V*-10](1) StandbyPostEngaged 1.00[V<V*-10](1) GoFaster * 1.00pushLong(1) Standby 1.00
pull[V<V*-10](1) StandbyPostEngaged 1.00pull[V>=V*-10](1) StandbyPostEngaged 1.00
push(1) NormalSpeed 2.17break(1) NormalSpeed 2.17
[V>=V*-10](1) NormalSpeed * 3.00pushLong(1) StandbyPostEngaged 4.83
press(3) Standby 6.00pullLong(1) Disabled 7.00
Table 1: Centrality of states and some (weighted) transitions inmodel S (top) and model A (bottom).
rics analysis of the model, we attached a weight of 1 to all actionsexcept for uplong and downlong, whose weight was set to 3.In other words we are assuming that these two actions are 3 timesmore difficult.
Because betweenness figures depend on the notion of shortestpath in the graph, which in turn is based on the “cost” of followedtransitions, the resulting scores depend on such an assumption. Forthe kind of analysis that we are discussing here, however, choosingany pair of increasing positive values would lead to similar results.
One thing that we can notice in model “S” is that “difficult” ac-tions have a 0 betweenness score, meaning that they are not in theway of the driver who wants to use the controller. And, vice versa,actions that have a relatively high score are simple ones.
Compare these data with the scores obtained from model “A”(Table 1). Notice that several actions with weight 3 have a low be-tweenness score, which is good. However, the press action (toinitially engage the controller the driver has to radially press thelever, which requires careful control of the hand movement) has acentrality score of 6, indicating that it is a transition that should beoften followed. Transitions marked with “*” are autonomous ones,
that do not require a driver action. Notice that the autonomous tran-sition [V>=V*-10] (which occurs when the actual speed exceedsthe set one by 10 or more km/h) has a relatively high centrality,meaning that it could occur often. Therefore appropriate indicatorsshould be used in the user interface to notify the driver of such achange (such as turning on or off a particular symbol in the dash-board, or changing its color.
4. CONCLUSIONSWe attempted to show that model-driven engineering practices
could be beneficial for automotive user interfaces. Such an ap-proach could be adopted to quickly generate running prototypesso that usability of the UI can be assessed. A second usage is inapplying graph-theoretic metrics that can be used to benchmark adesign, to compare 2 or more designs, to estimate cognitive loadassociated to interaction, and even to spot possible weak points.
Currently we are working on in-vehicle devices that require userinteraction, such as infotainment systems and GPS navigators. Weare collecting evidence that this rapid prototyping approach cou-pled with the ability of using metrics is effective in spotting weakareas of a design and supports informed rapid changes so that a de-signer can easily explore a large design space. We are also explor-ing the space of available metrics and validating promising ones.
5. REFERENCES[1] P. Dourish. Where the action is: the foundations of embodied
interaction. The MIT Press, 2001.[2] J. M. C. Fonseca. Model-based ui xg final report.
http://www.w3.org/2005/Incubator/model-based-ui/XGR-mbui-20100504/, May 2010.
[3] R. Hokyoung and A. Monk. Interaction unit analysis: A newinteraction design framework. Human-Computer Interaction,24(4):367–407, 2009.
[4] M. McCurdy, C. Connors, G. Pyrzak, B. Kanefsky, andA. Vera. Breaking the fidelity barrier: an examination of ourcurrent characterization of prototypes and an example of amixed-fidelity success. In CHI 2006, pages 1233–1242, NewYork, NY, 2006. ACM, ACM Press.
[5] D. Münter, A. Kötterizsch, T. Islinger, T. Köhler, C. Wolff,and J. Ziegler. Improving navigation support by taking care ofdrivers’ situational needs. In Proc. of the 4th Int. Conf. onAutomotive User Interfaces and Interactive VehicularApplications, pages 131–138. ACM Press, 2012.
[6] D. Norman. The psychology of everyday things. Basic Books,1988.
[7] D. Schmidt. Model-driven engineering. Computer, pages25–31, February 2006.
[8] J. Siegel. Developing in OMG’s model-driven architecture.Object Management Group White Paper, Nov. 2001.http://www.omg.org/cgi-bin/doc?omg/00-11-05.pdf.
[9] H. Thimbleby and P. Oladimeji. Social network analysis andinteractive device design analysis. In Proc. of EngineeringInteractive Computing Systems 2009, pages 91–100. ACMPress, 2009.
57
Adjunct Proceedings of the 5th International Conference on Automotive User Interfaces and Interactive Vehicular Applications (AutomotiveUI ‚13), October 28–30, 2013, Eindhoven, The Netherlands.
AutoNUI: 3rd Workshop on Automotive Natural User Interfaces
Bastian Pfleging Institute for Visualization & Interactive
Systems, University of Stuttgart Pfaffenwaldring 5a
70569 Stuttgart, Germany [email protected]
Ignacio Alvarez Human-Centered Computing Lab,
Clemson University 100 McAdams Hall
29631 Clemson, SC, USA [email protected]
Nora Broy Institute for Visualization & Interactive
Systems, University of Stuttgart Pfaffenwaldring 5a
70569 Stuttgart, Germany [email protected]
Jennifer Healey Interaction and Experience Research Intel Labs, 2200 Mission College Blvd
Santa Clara, CA, USA 95054 [email protected]
ABSTRACTNatural user interfaces—generally based on gesture and speech interaction—are an increasingly hot topic in research and are already being applied in a multitude of commercial products. Most use cases currently involve consumer electronics devices like smart phones, tablets, TV sets, game consoles, or large-screen tabletop computers.
Motivated by the latest results in those areas, our vision is to apply natural user interfaces, for example gesture and conversational speech interaction, to the automotive domain as well. This integration might on one hand reduce driver distraction in certain cases and on the other hand might allow the design of new user experiences for infotainment and entertainment systems.
The goal of this workshop is to continue the discussion and exploration of the design space of natural multi-modal automotive user interfaces and to continue the fruitful discussions held at the first two workshops on Automotive Natural User Interfaces at AutomotiveUI 2011 and 2012 [8], [9]. We would like to analyze where and how new interaction techniques can be integrated into the car – for manual and (semi-) autonomous driving situations.
Categories and Subject DescriptorsH.5.2 [Information interfaces and presentation (e.g., HCI)]: User Interfaces – Input devices and strategies (e.g. mouse, touchscreen), Interaction styles (e.g., commands, menus, forms, direct manipulation), Natural language, Voice I/O.
KeywordsAutomotive user interfaces; gesture interaction; multimodal
interaction, natural user interfaces, speech interaction.
1. INTRODUCTIONHuman-computer interaction (HCI) depends, in most use cases, on the context in which the interaction between user and computer takes place. This is especially true for the automotive domain with its multitude of environment-specific requirements. The primary task of driving a car can itself often be very challenging for the driver — despite advances in assistive driving — especially as overall traffic density is growing. At the same time the car’s cockpit is getting more complex due to new, feature-rich assistance and infotainment systems on both built-in and mobile devices. In order to complete secondary and tertiary tasks [2] with these systems, many drivers execute several tasks simultaneously besides the driving task. Efficient and easy-to-use HCI is therefore of particular interest in the automotive domain, with the background goals of most research being the reduction of driver distraction and the support of safe driving. According to the U.S. Department of Transportation, the average time drivers spend per day in their cars while commuting, shopping, or traveling is 43 minutes/day in Europe and 86 minutes/day in the United States. As most drivers spend this time alone, they demand ever-wider entertainment options and an almost living room-like environment for their vehicles. This underlines the need to enhance the emotional attachment between driver and car. Interaction design with an eye towards usability can help to foster this attachment. Furthermore, societal and IT trends are resulting in an always-connected environment in which drivers and passengers demand constant access to information and in which vehicles have to be aware of their surroundings. Adding to this challenge are upcoming systems for (semi-) autonomous driving as well as the increased prevalence of car-sharing and a higher need for information when using electric cars. New interaction techniques are clearly needed to enable a new generation of interactive systems for information access and the accomplishment of tertiary tasks while driving.
Buttons and similar physical controls are still predominant in the automotive design space [4], however the increasing number of available functions has lead to a situation where dashboard space
Submitted to AutomotiveUI’13. Do not cite. Do not circulate. Copyright held by the authors.AutomotiveUI‘13, October 27–30, Eindhoven, The Netherlands. Adjunct Proceedings.
58
Adjunct Proceedings of the 5th International Conference on Automotive User Interfaces and Interactive Vehicular Applications (AutomotiveUI ‚13), October 28–30, 2013, Eindhoven, The Netherlands.
precludes a one-to-one mapping from physical key to function. In order to circumvent this problem, current systems tend to provide hierarchical menu structures to access certain functions. The drawback of this approach is that immediate access to these hierarchically nested functions is no longer possible. This might lead to longer task completion times and—depending on the visualization—might increase visual distraction.
The introduction of new electronic consumer devices like smart phones, tablet computers, and game consoles has brought with it new ways of interacting with computers and embedded devices. Thus, a growing number of people today is used to interacting with touch-sensitive devices (touchscreens and touchpads) and many have some first-hand experience with speech technologies and gestural interaction. Within HCI research, “natural user interfaces” (NUIs) [11] have become a fruitful research topic encompassing multi-touch and full body gestures, conversational dialogs and affective systems, among many others. The introduction of computer vision-based tracking technology like the Kinect for Xbox 3601, Leap Motion2 and natural speech systems like Apple’s Siri3 has extended the interaction space for consumer devices. Inspired by these developments, the question arises whether these interaction techniques might also be suitable for automotive user interfaces. Although some early research has been carried out in the automotive context (e.g., [1], [5], [7], [10]), only some basic touch- and voice-activated interfaces have found their way into deployed in-vehicle systems so far. Gestural and multimodal interfaces are not yet broadly deployed. As they might facilitate the execution of secondary or tertiary tasks without increasing driver distraction, the integration of such interfaces is of particular interest (e.g., [6]). Moreover, further development of display technologies like glasses-free 3D, high resolution, shaped, or transparent displays offer new ways for visualizing interactive as well as informative content. So far, output technologies are less investigated in terms of natural user interfaces and especially inside the car.
Additionally, natural user interfaces have the potential to enhance the user experience. Designing experiences with these user interfaces can address and fulfill psychological needs of the user while interacting with the car (e.g., [3]). The resulting emotional attachment to the car can ease the acceptance of a system and avoid disuse. Considering the daily drive times mentioned above, the user experience offered by automotive user interfaces´is likely to gain prominence in the car-buying decision. This will become even more important with the rise of assistive systems and autonomous driving modes when the driver might have more time to concentrate on secondary and tertiary tasks. Depending on the situation, these interfaces might still need to offer easy means of notifying the driver to re-gain control of the car.
Besides supporting interaction for the driver, suitable infotainment and entertainment functionalities are also of special interest for co-drivers and passengers on the backseat. Compared to living room setups, the interaction space for passengers is limited by the dimensions of the car and through safety regulations (e.g., wearing seat belts). In combination with the increased robustness requirements of a moving environment, multimodal, natural interaction might also support this sub-domain of automotive user interfaces.
1 http://www.xbox.com/kinect 2 http://www.leapmotion.com 3 http://www.apple.com/iphone/features/siri.html
Besides integrating these technologies into the car in general, we must also be concerned with how potential new interaction techniques are designed and evaluated. How can individual NUI technologies be used, and how might they be combined in new and interesting ways to foster the overall user experience?
2. OBJECTIVES This workshop addresses the following issues:
¥ Generating an overview of which (natural) user interfaces are already used in the car and how they might be used in the future.
¥ Concepts for future multimodal interactions in the car.
¥ Discussion of new display modalities in the car (e.g. 3D displays, shaped displays).
¥ Automotive user interface frameworks and toolkits.
¥ Looking into special sub-domains: the driver, the co-driver, the backseat area, or connection to the outside.
¥ Understanding the definition of “natural” for different users. What are the differences across generations, cultures, and driving habits (e.g., occasional drivers vs. professional drivers)?
¥ Understanding how NUIs can be used in the automotive domain: do they replace or rather augment other interfaces?
¥ Discussion of potential issues of bringing NUIs into the car.
¥ Researching the relevance of traditional UX factors to the automotive NUI context.
¥ Researching how UX factors might motivate the integration of new NUIs into the car.
¥ New concepts for in-car user interfaces enhancing UX and experience design in the car.
¥ Multimedia interfaces, in-car entertainment, in-car gaming.
¥ Future trends: the ubiquitous car in a mobile society.
¥ Automotive user interfaces supporting the special needs and flexibility of (semi-) autonomous driving modes.
3. BEFORE THE CONFERENCE The workshop organizers will commit to publicize their workshop. The call for participation for this workshop will be distributed via HCI and Automotive UI related mailing list like, e.g., ACM SIGCHI, British HCI News, and Local SIGs lists. Additionally, we intend to distribute the call for participation as a one-page leaflet at HCI related conferences. We will further use our own/personal distribution lists. The website of the workshop series4 will be updated in order to provide information about the upcoming workshop, the submission modality and links to related material, so candidates can get familiar with the scope of the subject and the goals of the workshop. Accepted position papers and other pre-workshop materials will be made available to participants. This way, presentations during the workshop can be kept short and the reflection on the subject is stimulated before the workshop. In the sense of the workshop we will set up a weblog on the workshop website to facilitate a pre-workshop discussion.
4 http://blog.hcilab.org/autonui
59
Adjunct Proceedings of the 5th International Conference on Automotive User Interfaces and Interactive Vehicular Applications (AutomotiveUI ‚13), October 28–30, 2013, Eindhoven, The Netherlands.
4. DETAILED PLAN FOR CONDUCTING THE WORKSHOP This workshop is planned as a one-day workshop with breakout sessions, alternated with a moderated group discussion.
The workshop will start with an introduction to the workshop topic (9:00-9:15), followed by very short introductory presentations (e.g., in a pecha kucha style) to get familiar with the participants and the topics they are working on. The introductory presentations will be kept short and focused, so there is ample time for discussion (9:15-10.30). After the break (10:30-11:00) the organizers present the common themes of the submitted papers, grouping them into different sessions (3-5 topics). The different groups will then discuss their topics during a first breakout session, creating a list of conclusions (11:00-12.15). The organizers will actively interact with the audience to stimulate discussion around the workshop topic.
After the lunch break (12:15-13:15) a short alignment of pre-lunch discussions will happen in the whole group. This continues into a second round of break-out sessions to further discuss grouped topics (13:15-14:30). After the coffee break (14:30-14:45) the results of the breakout sessions will be discussed in the whole group. The conclusions of the workshop will be worked out and follow up activities will be specified (14.45-16:00).
5. PARTICIPATION Workshop candidates are requested to submit a position paper (no longer than 4 pages in the CHI extended abstracts format) about their research that links to the workshop theme. Participants will be selected on the basis of the relevance of their work and interests and familiarity with the topic.
6. EXPECTED PARTICIPANTS AND SELECTION PROCESS The workshop aims to bring together researchers, students, and practitioners, who are interested specifically in the automotive context. In particular, we hope for participants with different backgrounds and perspectives, e.g., automotive user interface (UI) designers, experience designers and engineers from a scientific as well as from an industrial perspective are welcome to submit position papers and join the workshop. The number of participants should be limited to 20. Participants will be selected based on their submission through a review process. The organizers as well as selected researchers working in this area will form the program committee and will conduct the review process as usual for this kind of venue.
7. OUTCOMES We have identified the potential for a fruitful continuation of our workshop series on Automotive Natural User Interfaces [8], [9]. We want to give researchers and practitioners the possibility to discuss the ways of integrating NUIs into the car and measuring the “naturalness” of their designs. We think that it is furthermore necessary to identify challenges related to understanding and addressing users’ psychological and affective needs with respect to automotive user experiences. We expect that the coverage of these topics will further participants’ understanding of the role of NUIs in the car, and that workshop outcomes advancing automotive NUIs will more broadly advance the entire discipline of automotive user experience.
To capture the outcomes of the workshop, different methods will be taken. On the one hand, we intend to build up a website that discusses the different ideas on natural user interfaces. The idea is
to ask all workshop participants to take part in building up content for this website and do so even beyond the boundaries of our workshop. As the topic of natural user interface has already advanced quite a bit over the last workshops, a second idea is to also discuss the creation of a book on natural user interfaces. In this case, a call for participation could be set up after the workshop to write and submit chapters for this book. Workshop participants would be encouraged to extend their workshop contribution into separate book chapters. In order to ensure a certain scientific contribution of this book, a suitable review process would be set up.
8. Organizers’ Backgrounds Bastian Pfleging holds a Master’s (Diploma) degree in Computer Science from TU Dortmund, Germany. He is a research assistant at the Human-Computer Interaction Group of the Institute for Visualization and Interactive Systems (VIS) at the University of Stuttgart, Germany. His general research interests are multi-modal and natural user interfaces. In particular, he is interested in human-computer interaction in the automotive context. From 2010 to 2011 he was visiting the BMW Technology Office in Palo Alto, CA, USA. Bastian was involved in organizing the first two workshops on Automotive Natural User Interfaces at AutomotiveUI ’11 and ‘12 and was Publication Co-Chair of AutomotiveUI ‘12.
Ignacio Alvarez received a PhD from the University of the Basque Country and was a Research Assistant at the Human-Centered Computing Lab of the Clemson University. His research areas encompass ubiquitous computing, automotive user interface design, spoken-dialog systems and affective computing. Since 2009 he worked as a research associate at the BMW IT Research Center in South Carolina in the fields of mobility services and user experience. In February 2012 he joined BMW AG as IT Systems Architect focusing in development of vehicular speech technologies. Jennifer Healey is a scientist at Intel Corporation Research Labs, she researches devices and systems that would allow for innovations that imagines a future where computers and smartphones are capable of being sensitive to human emotions and where cars are able to talk to each other, and thus keep their drivers away from accidents. She holds a PhD from MIT in electrical engineering and computer science. While there, she pioneered “Affective Computing” with Rosalind Picard and developed the first wearable computer with physiological sensors and a video camera that allows the wearer to track their daily activities and how they feel while doing them. From there, she moved to IBM where she worked on the next generation of multi-modal interactive smartphones and helped architect the "Interaction Mark-Up language" that allows users to switch from voice to speech input seamlessly.
Nora Broy holds a Master’s degree in Computer Science from TU Munich, Germany. She is a PhD candidate at the Human-Computer Interaction Group of the Institute for Visualization and Interactive Systems (VIS) at the University of Stuttgart, Germany. Her general research interests are new display modalities in the car. In particular, she aims at integrating 3D content and interaction into the car. In 2011 she was visiting the BMW Technology Office in Palo Alto, CA, USA and is now affiliated with BMW Research & Technology in Munich, Germany.
60
Adjunct Proceedings of the 5th International Conference on Automotive User Interfaces and Interactive Vehicular Applications (AutomotiveUI ‚13), October 28–30, 2013, Eindhoven, The Netherlands.
9. REFERENCES [1] Althoff, F., Lindl, R., Walchshäusl, L. 2006. Robust
Multimodal Hand- and Head Gesture Recognition for controlling Automotive Infotainment Systems. VDI-Tagung - Der Fahrer im 21. Jahrhundert, VDI.
[2] Geiser, G. Man Machine Interaction in Vehicles. 1985. ATZ 87, 74–77.
[3] Hassenzahl, M. Experience Design. 2010. Technology for All the Right Reasons. Synthesis Lectures on Human-Centered Informatics, 3, 1, 1–95.
[4] Kern, D., Schmidt, A. 2009. Design space for driver-based automotive user interfaces. In Proc. AutomotiveUI '09. ACM, New York, NY, 3–10.
[5] Lindl, R., Schwartz, J., Walchshäusl, L. 2002. Erkennen von Kopfgesten in Videosequenzen, Interdisziplinäres Projekt (IDP).
[6] Norman, D. A. 2004. Emotional Design: Why We Love (or Hate) Everyday Things. Basic Books, New York, NY, p. 248.
[7] Pfleging, B., Schneegass, S., Schmidt, A.: Multimodal Interaction in the Car – Combining Speech and Gestures on
the Steering Wheel. In Proc. AutomotiveUI ’12 (Portsmouth, NH, USA, October 17-19, 2012). ACM, New York, NY, USA, 155-162.
[8] Pfleging, B., Döring, T., Alvarez, I., Kranz, M., Weinberg, G., Healey, J.: AutoNUI: 2nd Workshop on Automotive Natural User Interfaces. In Adjunct Proc. AutomotiveUI ’12 (Portsmouth, NH, USA, October 17 – 19, 2012), 37–38.
[9] Pfleging, B., Döring, T., Knobel, M., Schmidt, A.: A Workshop on Automotive Natural User Interfaces. In Proc. AutomotiveUI ’11 (Salzburg, Austria, November 30 – December 02, 2011).
[10] Weinberg, G., Harsham, B., Forlines, C., and Medenica, Z. 2010. Contextual push-to-talk: shortening voice dialogs to improve driving performance. In Proc. MobileHCI '10. ACM, New York, NY, 113–122.
[11] Wigdor, D. and Wixon, D. 2011. Brave NUI World: Designing Natural User Interfaces for Touch and Gesture. Morgan Kaufmann, Burlington, MA.
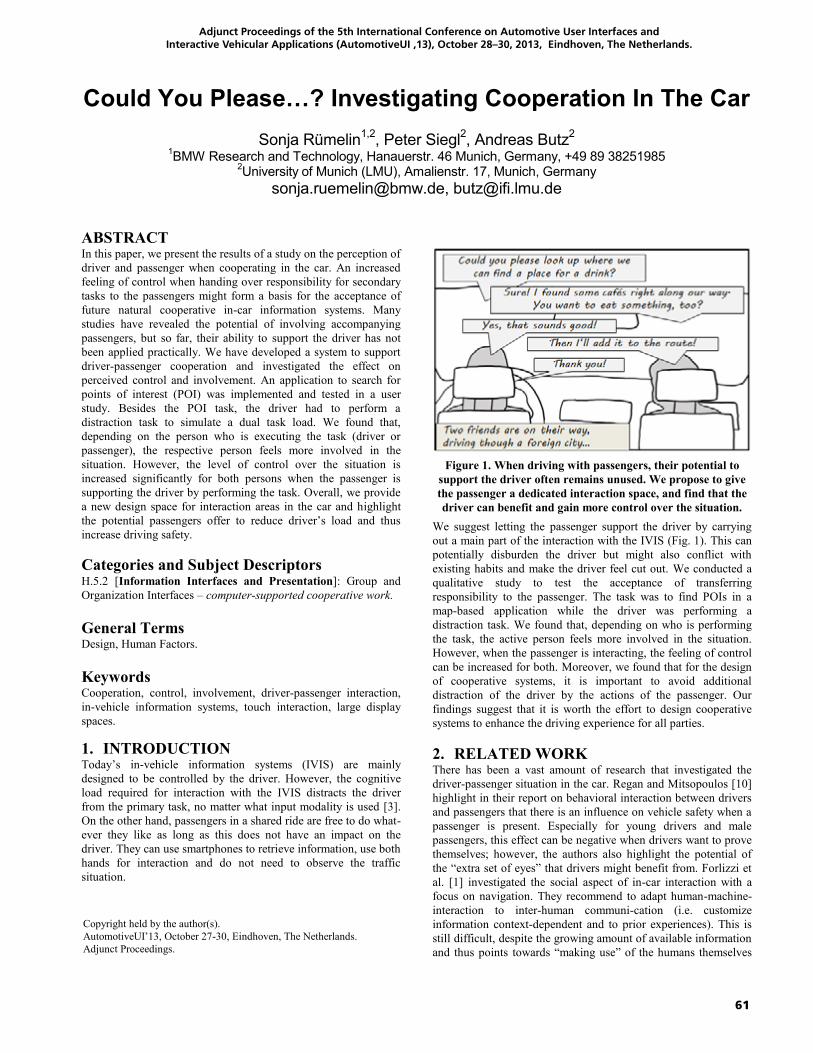
61
Adjunct Proceedings of the 5th International Conference on Automotive User Interfaces and Interactive Vehicular Applications (AutomotiveUI ‚13), October 28–30, 2013, Eindhoven, The Netherlands.
Could You Please…? Investigating Cooperation In The Car Sonja Rümelin1,2, Peter Siegl2, Andreas Butz2
1BMW Research and Technology, Hanauerstr. 46 Munich, Germany, +49 89 38251985 2University of Munich (LMU), Amalienstr. 17, Munich, Germany
[email protected], [email protected]
ABSTRACTIn this paper, we present the results of a study on the perception of driver and passenger when cooperating in the car. An increased feeling of control when handing over responsibility for secondary tasks to the passengers might form a basis for the acceptance of future natural cooperative in-car information systems. Many studies have revealed the potential of involving accompanying passengers, but so far, their ability to support the driver has not been applied practically. We have developed a system to support driver-passenger cooperation and investigated the effect on perceived control and involvement. An application to search for points of interest (POI) was implemented and tested in a user study. Besides the POI task, the driver had to perform a distraction task to simulate a dual task load. We found that, depending on the person who is executing the task (driver or passenger), the respective person feels more involved in the situation. However, the level of control over the situation is increased significantly for both persons when the passenger is supporting the driver by performing the task. Overall, we provide a new design space for interaction areas in the car and highlight the potential passengers offer to reduce driver’s load and thus increase driving safety.
Categories and Subject DescriptorsH.5.2 [Information Interfaces and Presentation]: Group and Organization Interfaces – computer-supported cooperative work.
General TermsDesign, Human Factors.
KeywordsCooperation, control, involvement, driver-passenger interaction, in-vehicle information systems, touch interaction, large display spaces.
1. INTRODUCTIONToday’s in-vehicle information systems (IVIS) are mainly designed to be controlled by the driver. However, the cognitive load required for interaction with the IVIS distracts the driver from the primary task, no matter what input modality is used [3]. On the other hand, passengers in a shared ride are free to do what-ever they like as long as this does not have an impact on the driver. They can use smartphones to retrieve information, use both hands for interaction and do not need to observe the traffic situation.
Figure 1. When driving with passengers, their potential to support the driver often remains unused. We propose to give the passenger a dedicated interaction space, and find that the driver can benefit and gain more control over the situation.
We suggest letting the passenger support the driver by carrying out a main part of the interaction with the IVIS (Fig. 1). This can potentially disburden the driver but might also conflict with existing habits and make the driver feel cut out. We conducted a qualitative study to test the acceptance of transferring responsibility to the passenger. The task was to find POIs in a map-based application while the driver was performing a distraction task. We found that, depending on who is performing the task, the active person feels more involved in the situation. However, when the passenger is interacting, the feeling of control can be increased for both. Moreover, we found that for the design of cooperative systems, it is important to avoid additional distraction of the driver by the actions of the passenger. Our findings suggest that it is worth the effort to design cooperative systems to enhance the driving experience for all parties.
2. RELATED WORK There has been a vast amount of research that investigated the driver-passenger situation in the car. Regan and Mitsopoulos [10] highlight in their report on behavioral interaction between drivers and passengers that there is an influence on vehicle safety when a passenger is present. Especially for young drivers and male passengers, this effect can be negative when drivers want to prove themselves; however, the authors also highlight the potential of the “extra set of eyes” that drivers might benefit from. Forlizzi et al. [1] investigated the social aspect of in-car interaction with a focus on navigation. They recommend to adapt human-machine-interaction to inter-human communi-cation (i.e. customize information context-dependent and to prior experiences). This is still difficult, despite the growing amount of available information and thus points towards “making use” of the humans themselves
Copyright held by the author(s). AutomotiveUI’13, October 27-30, Eindhoven, The Netherlands. Adjunct Proceedings.
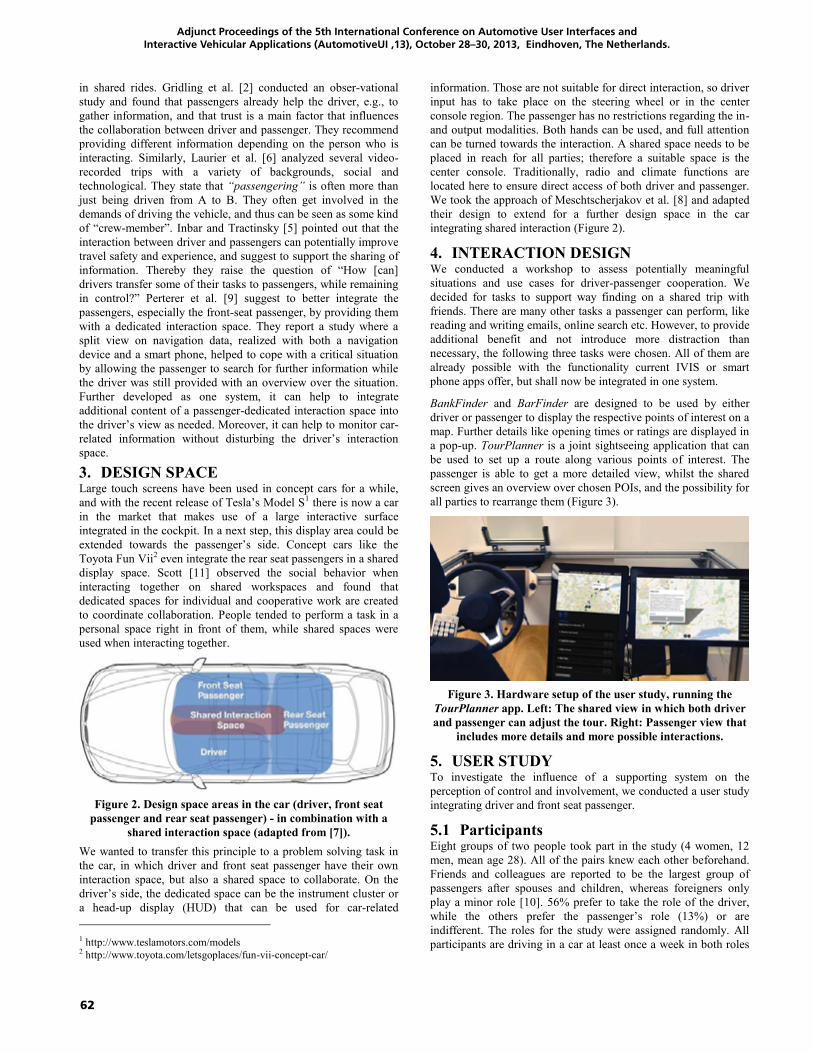
62
Adjunct Proceedings of the 5th International Conference on Automotive User Interfaces and Interactive Vehicular Applications (AutomotiveUI ‚13), October 28–30, 2013, Eindhoven, The Netherlands.
in shared rides. Gridling et al. [2] conducted an obser-vational study and found that passengers already help the driver, e.g., to gather information, and that trust is a main factor that influences the collaboration between driver and passenger. They recommend providing different information depending on the person who is interacting. Similarly, Laurier et al. [6] analyzed several video-recorded trips with a variety of backgrounds, social and technological. They state that “passengering” is often more than just being driven from A to B. They often get involved in the demands of driving the vehicle, and thus can be seen as some kind of “crew-member”. Inbar and Tractinsky [5] pointed out that the interaction between driver and passengers can potentially improve travel safety and experience, and suggest to support the sharing of information. Thereby they raise the question of “How [can] drivers transfer some of their tasks to passengers, while remaining in control?” Perterer et al. [9] suggest to better integrate the passengers, especially the front-seat passenger, by providing them with a dedicated interaction space. They report a study where a split view on navigation data, realized with both a navigation device and a smart phone, helped to cope with a critical situation by allowing the passenger to search for further information while the driver was still provided with an overview over the situation. Further developed as one system, it can help to integrate additional content of a passenger-dedicated interaction space into the driver’s view as needed. Moreover, it can help to monitor car-related information without disturbing the driver’s interaction space.
3. DESIGN SPACE Large touch screens have been used in concept cars for a while, and with the recent release of Tesla’s Model S1 there is now a car in the market that makes use of a large interactive surface integrated in the cockpit. In a next step, this display area could be extended towards the passenger’s side. Concept cars like the Toyota Fun Vii2 even integrate the rear seat passengers in a shared display space. Scott [11] observed the social behavior when interacting together on shared workspaces and found that dedicated spaces for individual and cooperative work are created to coordinate collaboration. People tended to perform a task in a personal space right in front of them, while shared spaces were used when interacting together.
Figure 2. Design space areas in the car (driver, front seat passenger and rear seat passenger) - in combination with a
shared interaction space (adapted from [7]). We wanted to transfer this principle to a problem solving task in the car, in which driver and front seat passenger have their own interaction space, but also a shared space to collaborate. On the driver’s side, the dedicated space can be the instrument cluster or a head-up display (HUD) that can be used for car-related
1 http://www.teslamotors.com/models 2 http://www.toyota.com/letsgoplaces/fun-vii-concept-car/
information. Those are not suitable for direct interaction, so driver input has to take place on the steering wheel or in the center console region. The passenger has no restrictions regarding the in- and output modalities. Both hands can be used, and full attention can be turned towards the interaction. A shared space needs to be placed in reach for all parties; therefore a suitable space is the center console. Traditionally, radio and climate functions are located here to ensure direct access of both driver and passenger. We took the approach of Meschtscherjakov et al. [8] and adapted their design to extend for a further design space in the car integrating shared interaction (Figure 2).
4. INTERACTION DESIGN We conducted a workshop to assess potentially meaningful situations and use cases for driver-passenger cooperation. We decided for tasks to support way finding on a shared trip with friends. There are many other tasks a passenger can perform, like reading and writing emails, online search etc. However, to provide additional benefit and not introduce more distraction than necessary, the following three tasks were chosen. All of them are already possible with the functionality current IVIS or smart phone apps offer, but shall now be integrated in one system.
BankFinder and BarFinder are designed to be used by either driver or passenger to display the respective points of interest on a map. Further details like opening times or ratings are displayed in a pop-up. TourPlanner is a joint sightseeing application that can be used to set up a route along various points of interest. The passenger is able to get a more detailed view, whilst the shared screen gives an overview over chosen POIs, and the possibility for all parties to rearrange them (Figure 3).
Figure 3. Hardware setup of the user study, running the TourPlanner app. Left: The shared view in which both driver and passenger can adjust the tour. Right: Passenger view that
includes more details and more possible interactions.
5. USER STUDY To investigate the influence of a supporting system on the perception of control and involvement, we conducted a user study integrating driver and front seat passenger.
5.1 Participants Eight groups of two people took part in the study (4 women, 12 men, mean age 28). All of the pairs knew each other beforehand. Friends and colleagues are reported to be the largest group of passengers after spouses and children, whereas foreigners only play a minor role [10]. 56% prefer to take the role of the driver, while the others prefer the passenger’s role (13%) or are indifferent. The roles for the study were assigned randomly. All participants are driving in a car at least once a week in both roles
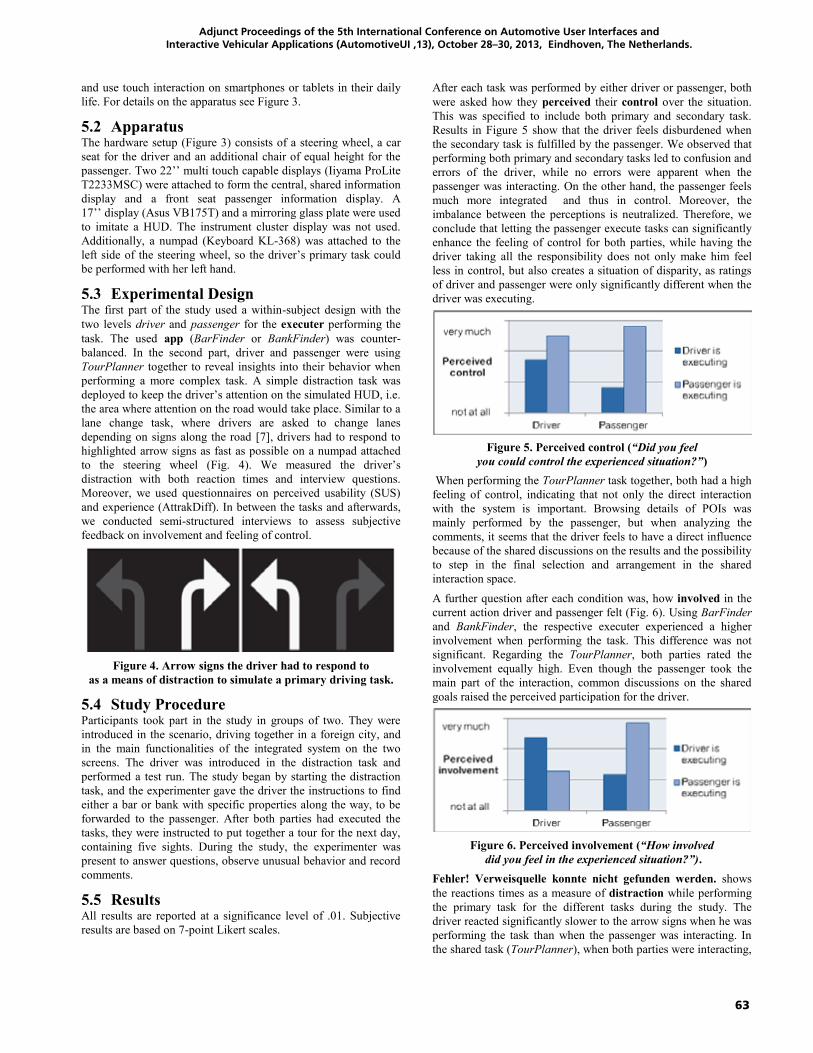
63
Adjunct Proceedings of the 5th International Conference on Automotive User Interfaces and Interactive Vehicular Applications (AutomotiveUI ‚13), October 28–30, 2013, Eindhoven, The Netherlands.
and use touch interaction on smartphones or tablets in their daily life. For details on the apparatus see Figure 3.
5.2 ApparatusThe hardware setup (Figure 3) consists of a steering wheel, a car seat for the driver and an additional chair of equal height for the passenger. Two 22’’ multi touch capable displays (Iiyama ProLite T2233MSC) were attached to form the central, shared information display and a front seat passenger information display. A 17’’ display (Asus VB175T) and a mirroring glass plate were used to imitate a HUD. The instrument cluster display was not used. Additionally, a numpad (Keyboard KL-368) was attached to the left side of the steering wheel, so the driver’s primary task could be performed with her left hand.
5.3 Experimental Design The first part of the study used a within-subject design with the two levels driver and passenger for the executer performing the task. The used app (BarFinder or BankFinder) was counter-balanced. In the second part, driver and passenger were using TourPlanner together to reveal insights into their behavior when performing a more complex task. A simple distraction task was deployed to keep the driver’s attention on the simulated HUD, i.e. the area where attention on the road would take place. Similar to a lane change task, where drivers are asked to change lanes depending on signs along the road [7], drivers had to respond to highlighted arrow signs as fast as possible on a numpad attached to the steering wheel (Fig. 4). We measured the driver’s distraction with both reaction times and interview questions. Moreover, we used questionnaires on perceived usability (SUS) and experience (AttrakDiff). In between the tasks and afterwards, we conducted semi-structured interviews to assess subjective feedback on involvement and feeling of control.
Figure 4. Arrow signs the driver had to respond to as a means of distraction to simulate a primary driving task.
5.4 Study Procedure Participants took part in the study in groups of two. They were introduced in the scenario, driving together in a foreign city, and in the main functionalities of the integrated system on the two screens. The driver was introduced in the distraction task and performed a test run. The study began by starting the distraction task, and the experimenter gave the driver the instructions to find either a bar or bank with specific properties along the way, to be forwarded to the passenger. After both parties had executed the tasks, they were instructed to put together a tour for the next day, containing five sights. During the study, the experimenter was present to answer questions, observe unusual behavior and record comments.
5.5 Results All results are reported at a significance level of .01. Subjective results are based on 7-point Likert scales.
After each task was performed by either driver or passenger, both were asked how they perceived their control over the situation. This was specified to include both primary and secondary task. Results in Figure 5 show that the driver feels disburdened when the secondary task is fulfilled by the passenger. We observed that performing both primary and secondary tasks led to confusion and errors of the driver, while no errors were apparent when the passenger was interacting. On the other hand, the passenger feels much more integrated and thus in control. Moreover, the imbalance between the perceptions is neutralized. Therefore, we conclude that letting the passenger execute tasks can significantly enhance the feeling of control for both parties, while having the driver taking all the responsibility does not only make him feel less in control, but also creates a situation of disparity, as ratings of driver and passenger were only significantly different when the driver was executing.
Figure 5. Perceived control (“Did you feel you could control the experienced situation?”)
When performing the TourPlanner task together, both had a high feeling of control, indicating that not only the direct interaction with the system is important. Browsing details of POIs was mainly performed by the passenger, but when analyzing the comments, it seems that the driver feels to have a direct influence because of the shared discussions on the results and the possibility to step in the final selection and arrangement in the shared interaction space. A further question after each condition was, how involved in the current action driver and passenger felt (Fig. 6). Using BarFinderand BankFinder, the respective executer experienced a higher involvement when performing the task. This difference was not significant. Regarding the TourPlanner, both parties rated the involvement equally high. Even though the passenger took the main part of the interaction, common discussions on the shared goals raised the perceived participation for the driver.
Figure 6. Perceived involvement (“How involveddid you feel in the experienced situation?”).
Fehler! Verweisquelle konnte nicht gefunden werden. shows the reactions times as a measure of distraction while performing the primary task for the different tasks during the study. The driver reacted significantly slower to the arrow signs when he was performing the task than when the passenger was interacting. In the shared task (TourPlanner), when both parties were interacting,
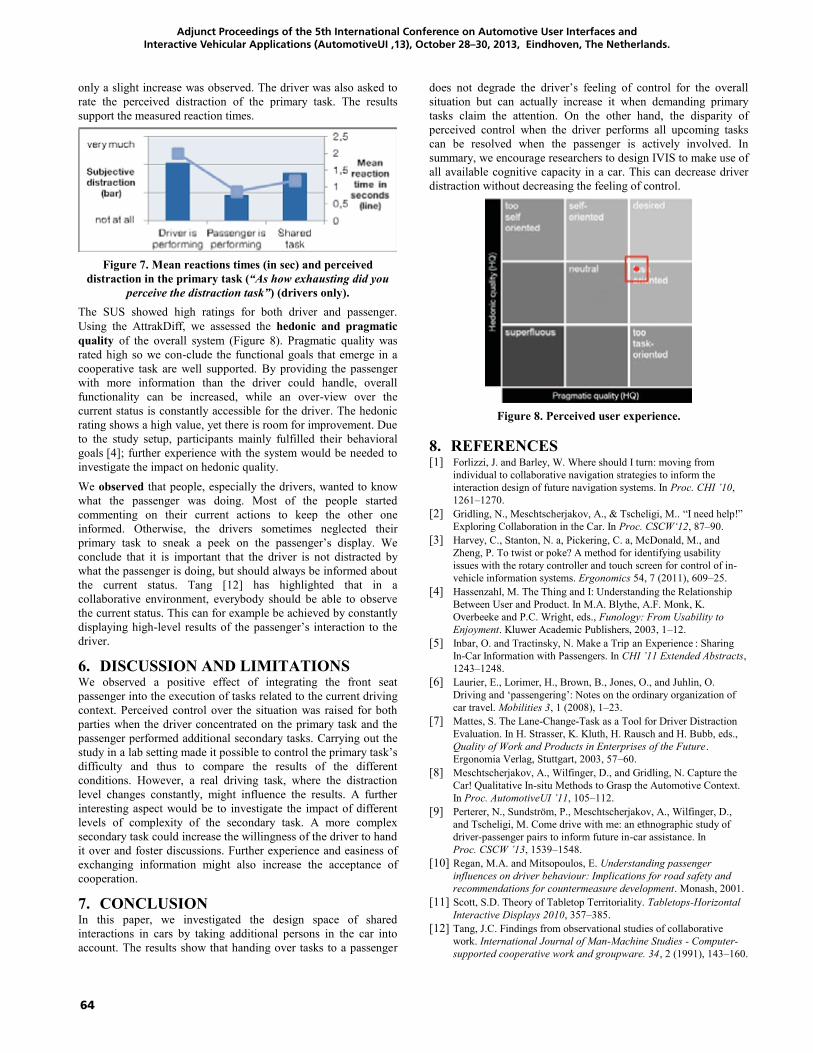
64
Adjunct Proceedings of the 5th International Conference on Automotive User Interfaces and Interactive Vehicular Applications (AutomotiveUI ‚13), October 28–30, 2013, Eindhoven, The Netherlands.
only a slight increase was observed. The driver was also asked to rate the perceived distraction of the primary task. The results support the measured reaction times.
Figure 7. Mean reactions times (in sec) and perceived distraction in the primary task (“As how exhausting did you
perceive the distraction task”) (drivers only). The SUS showed high ratings for both driver and passenger. Using the AttrakDiff, we assessed the hedonic and pragmatic quality of the overall system (Figure 8). Pragmatic quality was rated high so we con-clude the functional goals that emerge in a cooperative task are well supported. By providing the passenger with more information than the driver could handle, overall functionality can be increased, while an over-view over the current status is constantly accessible for the driver. The hedonic rating shows a high value, yet there is room for improvement. Due to the study setup, participants mainly fulfilled their behavioral goals [4]; further experience with the system would be needed to investigate the impact on hedonic quality. We observed that people, especially the drivers, wanted to know what the passenger was doing. Most of the people started commenting on their current actions to keep the other one informed. Otherwise, the drivers sometimes neglected their primary task to sneak a peek on the passenger’s display. We conclude that it is important that the driver is not distracted by what the passenger is doing, but should always be informed about the current status. Tang [12] has highlighted that in a collaborative environment, everybody should be able to observe the current status. This can for example be achieved by constantly displaying high-level results of the passenger’s interaction to the driver.
6. DISCUSSION AND LIMITATIONS We observed a positive effect of integrating the front seat passenger into the execution of tasks related to the current driving context. Perceived control over the situation was raised for both parties when the driver concentrated on the primary task and the passenger performed additional secondary tasks. Carrying out the study in a lab setting made it possible to control the primary task’s difficulty and thus to compare the results of the different conditions. However, a real driving task, where the distraction level changes constantly, might influence the results. A further interesting aspect would be to investigate the impact of different levels of complexity of the secondary task. A more complex secondary task could increase the willingness of the driver to hand it over and foster discussions. Further experience and easiness of exchanging information might also increase the acceptance of cooperation.
7. CONCLUSIONIn this paper, we investigated the design space of shared interactions in cars by taking additional persons in the car into account. The results show that handing over tasks to a passenger
does not degrade the driver’s feeling of control for the overall situation but can actually increase it when demanding primary tasks claim the attention. On the other hand, the disparity of perceived control when the driver performs all upcoming tasks can be resolved when the passenger is actively involved. In summary, we encourage researchers to design IVIS to make use of all available cognitive capacity in a car. This can decrease driver distraction without decreasing the feeling of control.
Figure 8. Perceived user experience.
8. REFERENCES [1] Forlizzi, J. and Barley, W. Where should I turn: moving from
individual to collaborative navigation strategies to inform the interaction design of future navigation systems. In Proc. CHI ’10,1261–1270.
[2] Gridling, N., Meschtscherjakov, A., & Tscheligi, M.. “I need help!” Exploring Collaboration in the Car. In Proc. CSCW‘12, 87–90.
[3] Harvey, C., Stanton, N. a, Pickering, C. a, McDonald, M., and Zheng, P. To twist or poke? A method for identifying usability issues with the rotary controller and touch screen for control of in-vehicle information systems. Ergonomics 54, 7 (2011), 609–25.
[4] Hassenzahl, M. The Thing and I: Understanding the Relationship Between User and Product. In M.A. Blythe, A.F. Monk, K. Overbeeke and P.C. Wright, eds., Funology: From Usability to Enjoyment. Kluwer Academic Publishers, 2003, 1–12.
[5] Inbar, O. and Tractinsky, N. Make a Trip an Experience : Sharing In-Car Information with Passengers. In CHI ’11 Extended Abstracts,1243–1248.
[6] Laurier, E., Lorimer, H., Brown, B., Jones, O., and Juhlin, O. Driving and ‘passengering’: Notes on the ordinary organization of car travel. Mobilities 3, 1 (2008), 1–23.
[7] Mattes, S. The Lane-Change-Task as a Tool for Driver Distraction Evaluation. In H. Strasser, K. Kluth, H. Rausch and H. Bubb, eds., Quality of Work and Products in Enterprises of the Future.Ergonomia Verlag, Stuttgart, 2003, 57–60.
[8] Meschtscherjakov, A., Wilfinger, D., and Gridling, N. Capture the Car! Qualitative In-situ Methods to Grasp the Automotive Context. In Proc. AutomotiveUI ’11, 105–112.
[9] Perterer, N., Sundström, P., Meschtscherjakov, A., Wilfinger, D., and Tscheligi, M. Come drive with me: an ethnographic study of driver-passenger pairs to inform future in-car assistance. In Proc. CSCW ’13, 1539–1548.
[10] Regan, M.A. and Mitsopoulos, E. Understanding passenger influences on driver behaviour: Implications for road safety and recommendations for countermeasure development. Monash, 2001.
[11] Scott, S.D. Theory of Tabletop Territoriality. Tabletops-Horizontal Interactive Displays 2010, 357–385.
[12] Tang, J.C. Findings from observational studies of collaborative work. International Journal of Man-Machine Studies - Computer-supported cooperative work and groupware. 34, 2 (1991), 143–160.
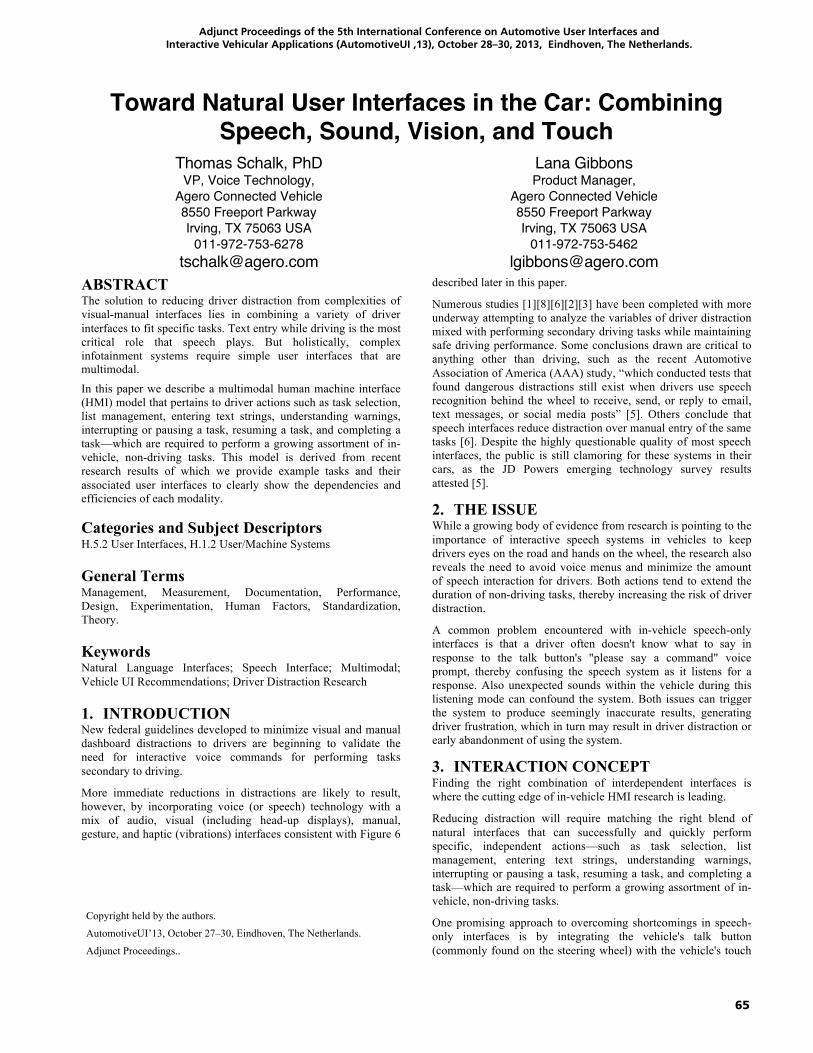
65
Adjunct Proceedings of the 5th International Conference on Automotive User Interfaces and Interactive Vehicular Applications (AutomotiveUI ‚13), October 28–30, 2013, Eindhoven, The Netherlands.
Toward Natural User Interfaces in the Car: Combining Speech, Sound, Vision, and Touch
Thomas Schalk, PhD VP, Voice Technology,
Agero Connected Vehicle 8550 Freeport Parkway Irving, TX 75063 USA
011-972-753-6278 [email protected]
Lana Gibbons Product Manager,
Agero Connected Vehicle 8550 Freeport Parkway Irving, TX 75063 USA
011-972-753-5462 [email protected]
ABSTRACT The solution to reducing driver distraction from complexities of visual-manual interfaces lies in combining a variety of driver interfaces to fit specific tasks. Text entry while driving is the most critical role that speech plays. But holistically, complex infotainment systems require simple user interfaces that are multimodal.
In this paper we describe a multimodal human machine interface (HMI) model that pertains to driver actions such as task selection, list management, entering text strings, understanding warnings, interrupting or pausing a task, resuming a task, and completing a task—which are required to perform a growing assortment of in-vehicle, non-driving tasks. This model is derived from recent research results of which we provide example tasks and their associated user interfaces to clearly show the dependencies and efficiencies of each modality.
Categories and Subject Descriptors H.5.2 User Interfaces, H.1.2 User/Machine Systems
General Terms Management, Measurement, Documentation, Performance, Design, Experimentation, Human Factors, Standardization, Theory.
Keywords Natural Language Interfaces; Speech Interface; Multimodal; Vehicle UI Recommendations; Driver Distraction Research
1. INTRODUCTION New federal guidelines developed to minimize visual and manual dashboard distractions to drivers are beginning to validate the need for interactive voice commands for performing tasks secondary to driving.
More immediate reductions in distractions are likely to result, however, by incorporating voice (or speech) technology with a mix of audio, visual (including head-up displays), manual, gesture, and haptic (vibrations) interfaces consistent with Figure 6
described later in this paper.
Numerous studies [1][8][6][2][3] have been completed with more underway attempting to analyze the variables of driver distraction mixed with performing secondary driving tasks while maintaining safe driving performance. Some conclusions drawn are critical to anything other than driving, such as the recent Automotive Association of America (AAA) study, “which conducted tests that found dangerous distractions still exist when drivers use speech recognition behind the wheel to receive, send, or reply to email, text messages, or social media posts” [5]. Others conclude that speech interfaces reduce distraction over manual entry of the same tasks [6]. Despite the highly questionable quality of most speech interfaces, the public is still clamoring for these systems in their cars, as the JD Powers emerging technology survey results attested [5].
2. THE ISSUE While a growing body of evidence from research is pointing to the importance of interactive speech systems in vehicles to keep drivers eyes on the road and hands on the wheel, the research also reveals the need to avoid voice menus and minimize the amount of speech interaction for drivers. Both actions tend to extend the duration of non-driving tasks, thereby increasing the risk of driver distraction.
A common problem encountered with in-vehicle speech-only interfaces is that a driver often doesn't know what to say in response to the talk button's "please say a command" voice prompt, thereby confusing the speech system as it listens for a response. Also unexpected sounds within the vehicle during this listening mode can confound the system. Both issues can trigger the system to produce seemingly inaccurate results, generating driver frustration, which in turn may result in driver distraction or early abandonment of using the system.
3. INTERACTION CONCEPT Finding the right combination of interdependent interfaces is where the cutting edge of in-vehicle HMI research is leading.
Reducing distraction will require matching the right blend of natural interfaces that can successfully and quickly perform specific, independent actions—such as task selection, list management, entering text strings, understanding warnings, interrupting or pausing a task, resuming a task, and completing a task—which are required to perform a growing assortment of in-vehicle, non-driving tasks.
One promising approach to overcoming shortcomings in speech-only interfaces is by integrating the vehicle's talk button (commonly found on the steering wheel) with the vehicle's touch
Copyright held by the authors.
AutomotiveUI’13, October 27–30, Eindhoven, The Netherlands.
Adjunct Proceedings..
66
Adjunct Proceedings of the 5th International Conference on Automotive User Interfaces and Interactive Vehicular Applications (AutomotiveUI ‚13), October 28–30, 2013, Eindhoven, The Netherlands.
screen (or other user interface), providing the driver with a simple, more instructive Tap-or-Say prompt.
Verbally coaching the driver what to say—a speech system's common response when an error occurs—extends the duration time to complete the task, thereby, increasing the potential for driver frustration and distraction. With the Tap-or-Say approach (refer to Figure 1), the user instinctively glances and taps from a list of items displayed on a touch screen without the need to contemplate a spoken response. No extra prompting and no extra dialog steps are required, dramatically reducing the task completion time and the risk of distraction [7].
Figure 1. Tap or Say Using Natural Language
Interactive speech will remain a critical interface in the moving vehicle—primarily as a substitute for typing text.
The guidelines issued by the National Highway Traffic Safety Administration (NHTSA) offer specifics such as ensuring in-vehicle infotainment and communications systems do not divert drivers' attention away from the roadway for more than two seconds at a time, or 12 seconds in total. To expand upon this, the following identifies an emerging list of best practices for the next generation of automotive user interfaces:
§ Maximize simplicity § Minimize number of task steps § Minimize number of menu layers § Avoid voice menus § Disallow typing § Minimize incoming messages § Maximize interruptibility § Minimize verbosity § Remove need for learning mode § Minimize speech input § Minimize glance duration § Minimize glance frequency § Minimize task completion time § Maximize driving performance
A key aspect of rethinking the interaction between cars and people (i.e., the HMI) is to realize that all tasks are not created equal, such as quick retrieval of navigation information in contrast to
exploring music choices. Likewise, driver focus also varies widely by age, driving experience, and behavior.1
As mentioned, JD Powers and Associates [4] has repeatedly reported that user satisfaction with existing speech interfaces is low, but that users still want it accessible in their vehicles. Therefore, the market is rich with demand, and the time is now to develop an effective solution.
4. THE RESEARCH In collaboration with the Virginia Transportation Technical Institute (VTTI), Agero, Inc. conducted a visual-speech study [7] comparing participant’s coordination of driving while performing simple tasks. The study included 24 Participants (ages 18-30 and ages 65-75 equally); 3 user interfaces (visual & manual, speech only, and speech & visual); and 3 destination entry tasks (address, point-of-interest [POI], and category).
4.1 Objectives Well-designed human-machine interfaces may help mitigate cognitive distraction for drivers. It is generally accepted that complicated device interfaces with high visual dependencies induce driver distraction during use.
According to research [6], for entering text, speech has proven to be a viable and significantly safer alternative to traditionally visual-intensive methods. For managing short lists, such as selecting an item from a list of options, a visual-manual interface has been shown to be safe and easy to use while driving. Many of the routine tasks associated with driving include entering text and managing lists (e.g., destination entry, music, dialing, and messaging).
The primary objective and uniqueness of the study was to compare and contrast differences in awareness, task performance, and vehicular control for three user interfaces: auditory-vocal, visual-manual, and a multimodal user interface, including vocal, auditory, visual, and touch modalities. The study was structured to use speech for text entry and avoid voice menus. The study was also aimed at comparing the behaviors of younger drivers with older drivers while using the three different interfaces.
4.1.1 Driver distraction variables of interest: § Task Duration: Critical metric while driving § Task Accuracy: Success rate at completing tasks § Speed Measures
§ Mean Speed (mph) § Speed Variance (mph)
§ Steering Measures § Steering Variance (degrees) § # of Lane Deviations § Time out of lane (seconds)
§ Eye Glances § Glance Durations (seconds) § Eyes Off Road Time (percentage)
§ Peripheral Event Detection 1 Published in The Wall Street Journal, June 3, 2013:
http://online.wsj.com/article/PR-CO-20130603-904609.html?mod=googlenews_wsj
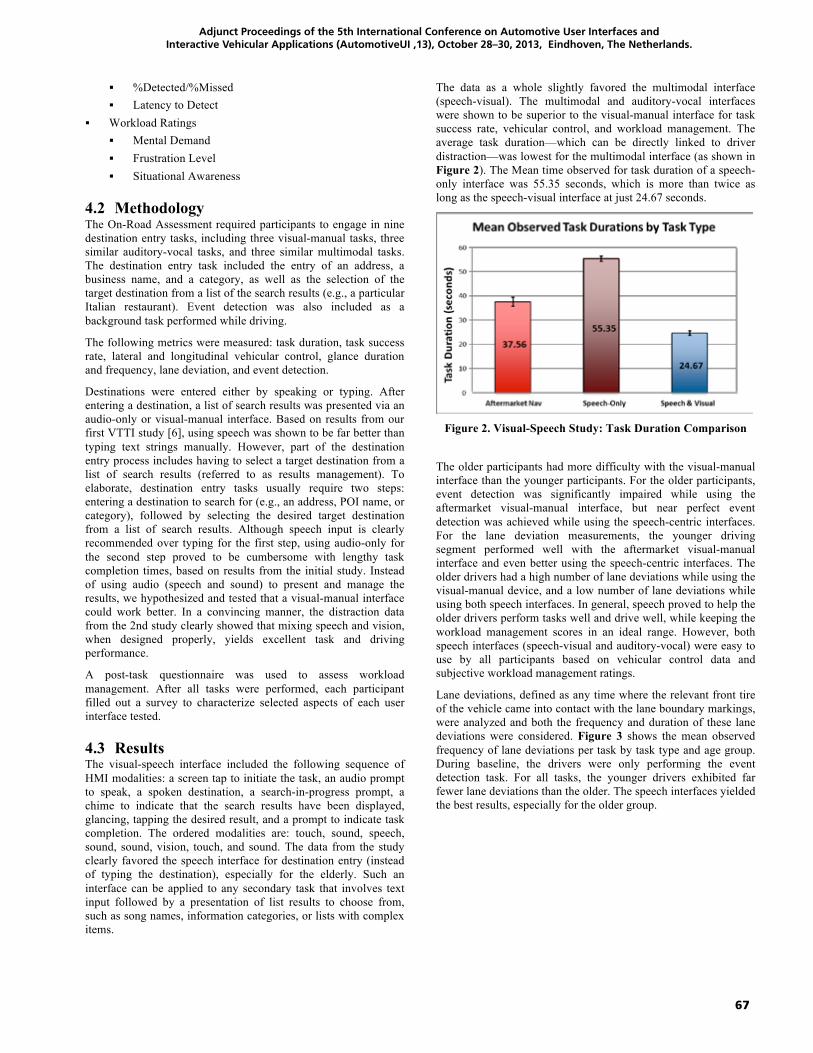
67
Adjunct Proceedings of the 5th International Conference on Automotive User Interfaces and Interactive Vehicular Applications (AutomotiveUI ‚13), October 28–30, 2013, Eindhoven, The Netherlands.
§ %Detected/%Missed § Latency to Detect
§ Workload Ratings § Mental Demand § Frustration Level § Situational Awareness
4.2 Methodology The On-Road Assessment required participants to engage in nine destination entry tasks, including three visual-manual tasks, three similar auditory-vocal tasks, and three similar multimodal tasks. The destination entry task included the entry of an address, a business name, and a category, as well as the selection of the target destination from a list of the search results (e.g., a particular Italian restaurant). Event detection was also included as a background task performed while driving.
The following metrics were measured: task duration, task success rate, lateral and longitudinal vehicular control, glance duration and frequency, lane deviation, and event detection.
Destinations were entered either by speaking or typing. After entering a destination, a list of search results was presented via an audio-only or visual-manual interface. Based on results from our first VTTI study [6], using speech was shown to be far better than typing text strings manually. However, part of the destination entry process includes having to select a target destination from a list of search results (referred to as results management). To elaborate, destination entry tasks usually require two steps: entering a destination to search for (e.g., an address, POI name, or category), followed by selecting the desired target destination from a list of search results. Although speech input is clearly recommended over typing for the first step, using audio-only for the second step proved to be cumbersome with lengthy task completion times, based on results from the initial study. Instead of using audio (speech and sound) to present and manage the results, we hypothesized and tested that a visual-manual interface could work better. In a convincing manner, the distraction data from the 2nd study clearly showed that mixing speech and vision, when designed properly, yields excellent task and driving performance.
A post-task questionnaire was used to assess workload management. After all tasks were performed, each participant filled out a survey to characterize selected aspects of each user interface tested.
4.3 Results The visual-speech interface included the following sequence of HMI modalities: a screen tap to initiate the task, an audio prompt to speak, a spoken destination, a search-in-progress prompt, a chime to indicate that the search results have been displayed, glancing, tapping the desired result, and a prompt to indicate task completion. The ordered modalities are: touch, sound, speech, sound, sound, vision, touch, and sound. The data from the study clearly favored the speech interface for destination entry (instead of typing the destination), especially for the elderly. Such an interface can be applied to any secondary task that involves text input followed by a presentation of list results to choose from, such as song names, information categories, or lists with complex items.
The data as a whole slightly favored the multimodal interface (speech-visual). The multimodal and auditory-vocal interfaces were shown to be superior to the visual-manual interface for task success rate, vehicular control, and workload management. The average task duration—which can be directly linked to driver distraction—was lowest for the multimodal interface (as shown in Figure 2). The Mean time observed for task duration of a speech-only interface was 55.35 seconds, which is more than twice as long as the speech-visual interface at just 24.67 seconds.
Figure 2. Visual-Speech Study: Task Duration Comparison
The older participants had more difficulty with the visual-manual interface than the younger participants. For the older participants, event detection was significantly impaired while using the aftermarket visual-manual interface, but near perfect event detection was achieved while using the speech-centric interfaces. For the lane deviation measurements, the younger driving segment performed well with the aftermarket visual-manual interface and even better using the speech-centric interfaces. The older drivers had a high number of lane deviations while using the visual-manual device, and a low number of lane deviations while using both speech interfaces. In general, speech proved to help the older drivers perform tasks well and drive well, while keeping the workload management scores in an ideal range. However, both speech interfaces (speech-visual and auditory-vocal) were easy to use by all participants based on vehicular control data and subjective workload management ratings.
Lane deviations, defined as any time where the relevant front tire of the vehicle came into contact with the lane boundary markings, were analyzed and both the frequency and duration of these lane deviations were considered. Figure 3 shows the mean observed frequency of lane deviations per task by task type and age group. During baseline, the drivers were only performing the event detection task. For all tasks, the younger drivers exhibited far fewer lane deviations than the older. The speech interfaces yielded the best results, especially for the older group.
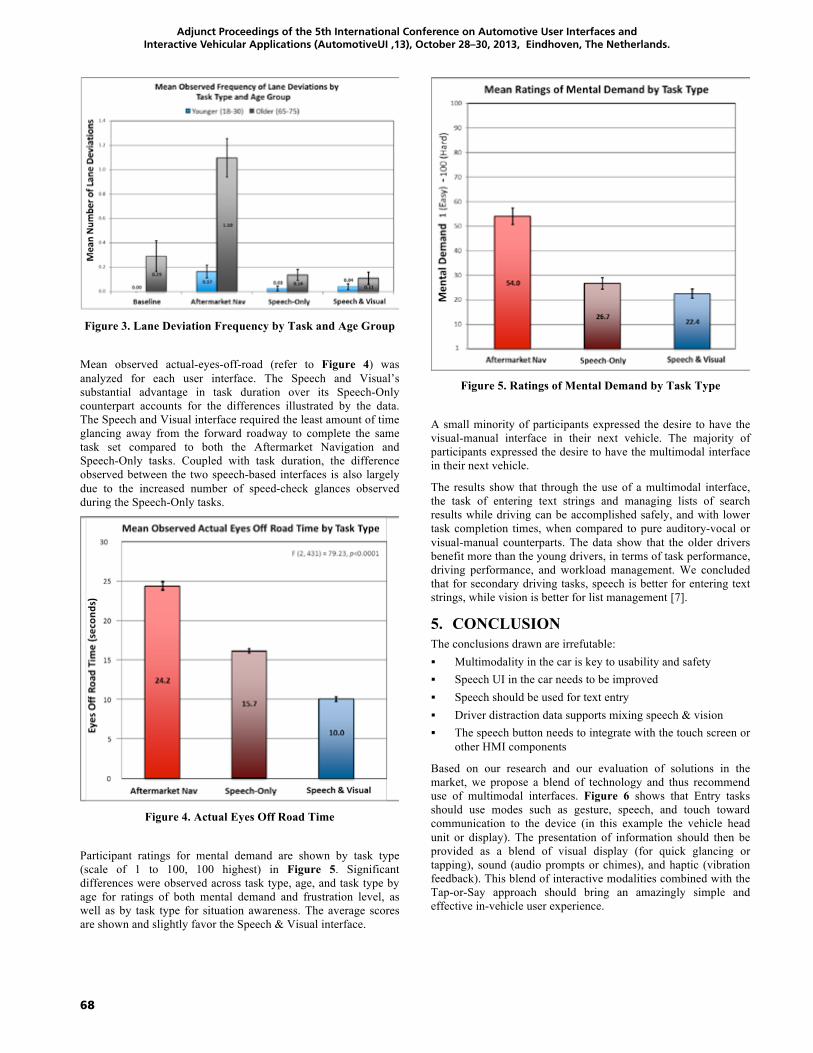
68
Adjunct Proceedings of the 5th International Conference on Automotive User Interfaces and Interactive Vehicular Applications (AutomotiveUI ‚13), October 28–30, 2013, Eindhoven, The Netherlands.
Figure 3. Lane Deviation Frequency by Task and Age Group Mean observed actual-eyes-off-road (refer to Figure 4) was analyzed for each user interface. The Speech and Visual’s substantial advantage in task duration over its Speech-Only counterpart accounts for the differences illustrated by the data. The Speech and Visual interface required the least amount of time glancing away from the forward roadway to complete the same task set compared to both the Aftermarket Navigation and Speech-Only tasks. Coupled with task duration, the difference observed between the two speech-based interfaces is also largely due to the increased number of speed-check glances observed during the Speech-Only tasks.
Figure 4. Actual Eyes Off Road Time
Participant ratings for mental demand are shown by task type (scale of 1 to 100, 100 highest) in Figure 5. Significant differences were observed across task type, age, and task type by age for ratings of both mental demand and frustration level, as well as by task type for situation awareness. The average scores are shown and slightly favor the Speech & Visual interface.
Figure 5. Ratings of Mental Demand by Task Type
A small minority of participants expressed the desire to have the visual-manual interface in their next vehicle. The majority of participants expressed the desire to have the multimodal interface in their next vehicle.
The results show that through the use of a multimodal interface, the task of entering text strings and managing lists of search results while driving can be accomplished safely, and with lower task completion times, when compared to pure auditory-vocal or visual-manual counterparts. The data show that the older drivers benefit more than the young drivers, in terms of task performance, driving performance, and workload management. We concluded that for secondary driving tasks, speech is better for entering text strings, while vision is better for list management [7].
5. CONCLUSION The conclusions drawn are irrefutable: § Multimodality in the car is key to usability and safety § Speech UI in the car needs to be improved § Speech should be used for text entry § Driver distraction data supports mixing speech & vision § The speech button needs to integrate with the touch screen or
other HMI components
Based on our research and our evaluation of solutions in the market, we propose a blend of technology and thus recommend use of multimodal interfaces. Figure 6 shows that Entry tasks should use modes such as gesture, speech, and touch toward communication to the device (in this example the vehicle head unit or display). The presentation of information should then be provided as a blend of visual display (for quick glancing or tapping), sound (audio prompts or chimes), and haptic (vibration feedback). This blend of interactive modalities combined with the Tap-or-Say approach should bring an amazingly simple and effective in-vehicle user experience.
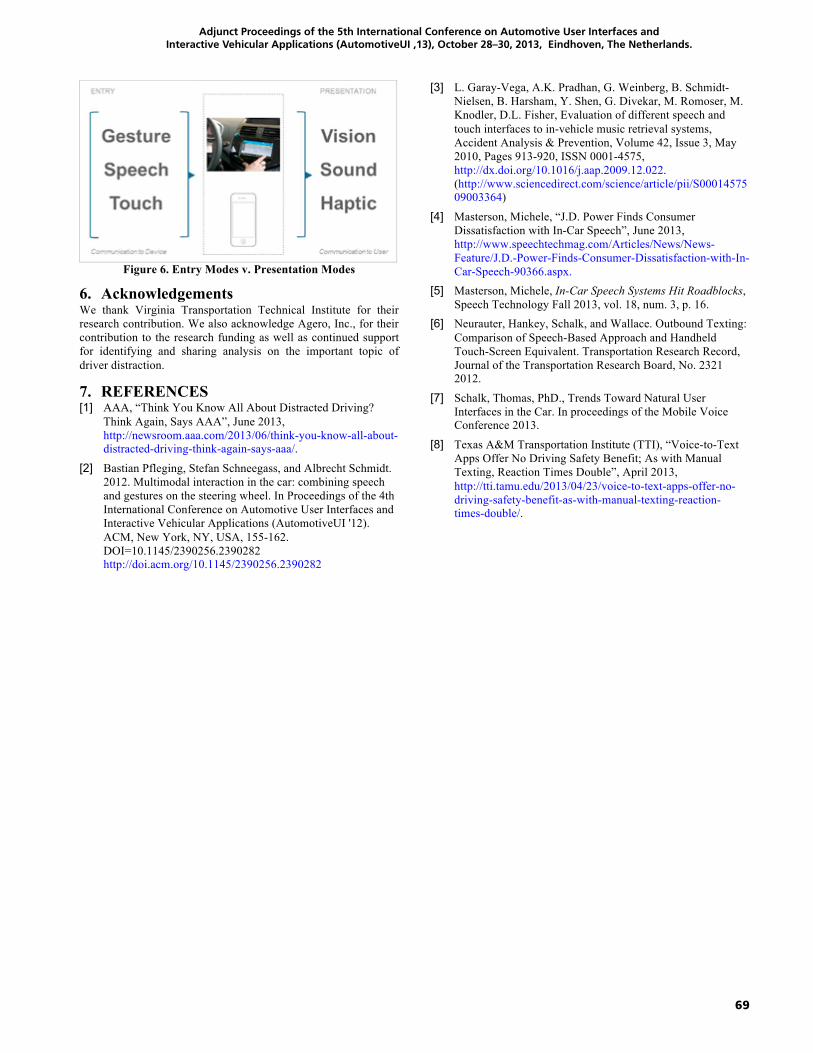
69
Adjunct Proceedings of the 5th International Conference on Automotive User Interfaces and Interactive Vehicular Applications (AutomotiveUI ‚13), October 28–30, 2013, Eindhoven, The Netherlands.
Figure 6. Entry Modes v. Presentation Modes
6. Acknowledgements We thank Virginia Transportation Technical Institute for their research contribution. We also acknowledge Agero, Inc., for their contribution to the research funding as well as continued support for identifying and sharing analysis on the important topic of driver distraction.
7. REFERENCES [1] AAA, “Think You Know All About Distracted Driving?
Think Again, Says AAA”, June 2013, http://newsroom.aaa.com/2013/06/think-you-know-all-about-distracted-driving-think-again-says-aaa/.
[2] Bastian Pfleging, Stefan Schneegass, and Albrecht Schmidt. 2012. Multimodal interaction in the car: combining speech and gestures on the steering wheel. In Proceedings of the 4th International Conference on Automotive User Interfaces and Interactive Vehicular Applications (AutomotiveUI '12). ACM, New York, NY, USA, 155-162. DOI=10.1145/2390256.2390282 http://doi.acm.org/10.1145/2390256.2390282
[3] L. Garay-Vega, A.K. Pradhan, G. Weinberg, B. Schmidt-Nielsen, B. Harsham, Y. Shen, G. Divekar, M. Romoser, M. Knodler, D.L. Fisher, Evaluation of different speech and touch interfaces to in-vehicle music retrieval systems, Accident Analysis & Prevention, Volume 42, Issue 3, May 2010, Pages 913-920, ISSN 0001-4575, http://dx.doi.org/10.1016/j.aap.2009.12.022. (http://www.sciencedirect.com/science/article/pii/S0001457509003364)
[4] Masterson, Michele, “J.D. Power Finds Consumer Dissatisfaction with In-Car Speech”, June 2013, http://www.speechtechmag.com/Articles/News/News-Feature/J.D.-Power-Finds-Consumer-Dissatisfaction-with-In-Car-Speech-90366.aspx.
[5] Masterson, Michele, In-Car Speech Systems Hit Roadblocks, Speech Technology Fall 2013, vol. 18, num. 3, p. 16.
[6] Neurauter, Hankey, Schalk, and Wallace. Outbound Texting: Comparison of Speech-Based Approach and Handheld Touch-Screen Equivalent. Transportation Research Record, Journal of the Transportation Research Board, No. 2321 2012.
[7] Schalk, Thomas, PhD., Trends Toward Natural User Interfaces in the Car. In proceedings of the Mobile Voice Conference 2013.
[8] Texas A&M Transportation Institute (TTI), “Voice-to-Text Apps Offer No Driving Safety Benefit; As with Manual Texting, Reaction Times Double”, April 2013, http://tti.tamu.edu/2013/04/23/voice-to-text-apps-offer-no-driving-safety-benefit-as-with-manual-texting-reaction-times-double/.

70
Adjunct Proceedings of the 5th International Conference on Automotive User Interfaces and Interactive Vehicular Applications (AutomotiveUI ‚13), October 28–30, 2013, Eindhoven, The Netherlands.
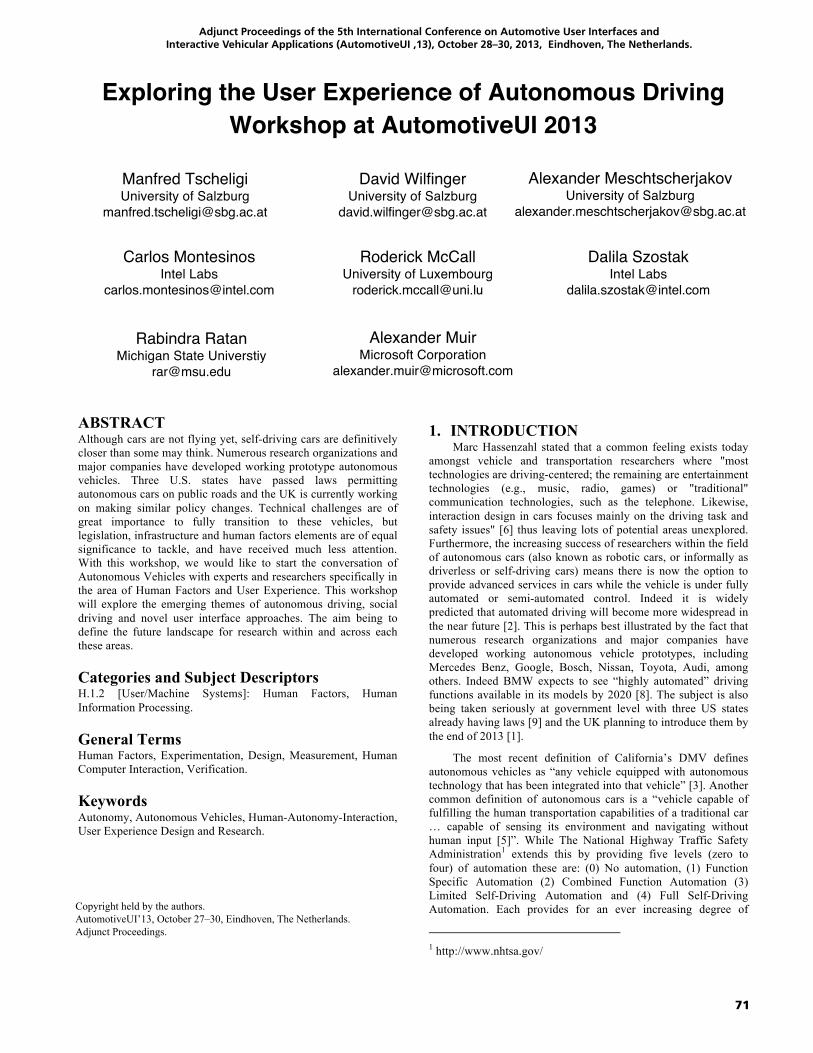
71
Adjunct Proceedings of the 5th International Conference on Automotive User Interfaces and Interactive Vehicular Applications (AutomotiveUI ‚13), October 28–30, 2013, Eindhoven, The Netherlands.
Exploring the User Experience of Autonomous Driving Workshop at AutomotiveUI 2013
ABSTRACT Although cars are not flying yet, self-driving cars are definitively closer than some may think. Numerous research organizations and major companies have developed working prototype autonomous vehicles. Three U.S. states have passed laws permitting autonomous cars on public roads and the UK is currently working on making similar policy changes. Technical challenges are of great importance to fully transition to these vehicles, but legislation, infrastructure and human factors elements are of equal significance to tackle, and have received much less attention. With this workshop, we would like to start the conversation of Autonomous Vehicles with experts and researchers specifically in the area of Human Factors and User Experience. This workshop will explore the emerging themes of autonomous driving, social driving and novel user interface approaches. The aim being to define the future landscape for research within and across each these areas.
Categories and Subject Descriptors H.1.2 [User/Machine Systems]: Human Factors, Human Information Processing.
General Terms Human Factors, Experimentation, Design, Measurement, Human Computer Interaction, Verification.
Keywords Autonomy, Autonomous Vehicles, Human-Autonomy-Interaction, User Experience Design and Research.
1. INTRODUCTION Marc Hassenzahl stated that a common feeling exists today
amongst vehicle and transportation researchers where "most technologies are driving-centered; the remaining are entertainment technologies (e.g., music, radio, games) or "traditional" communication technologies, such as the telephone. Likewise, interaction design in cars focuses mainly on the driving task and safety issues" [6] thus leaving lots of potential areas unexplored. Furthermore, the increasing success of researchers within the field of autonomous cars (also known as robotic cars, or informally as driverless or self-driving cars) means there is now the option to provide advanced services in cars while the vehicle is under fully automated or semi-automated control. Indeed it is widely predicted that automated driving will become more widespread in the near future [2]. This is perhaps best illustrated by the fact that numerous research organizations and major companies have developed working autonomous vehicle prototypes, including Mercedes Benz, Google, Bosch, Nissan, Toyota, Audi, among others. Indeed BMW expects to see “highly automated” driving functions available in its models by 2020 [8]. The subject is also being taken seriously at government level with three US states already having laws [9] and the UK planning to introduce them by the end of 2013 [1].
The most recent definition of California’s DMV defines autonomous vehicles as “any vehicle equipped with autonomous technology that has been integrated into that vehicle” [3]. Another common definition of autonomous cars is a “vehicle capable of fulfilling the human transportation capabilities of a traditional car … capable of sensing its environment and navigating without human input [5]”. While The National Highway Traffic Safety Administration1 extends this by providing five levels (zero to four) of automation these are: (0) No automation, (1) Function Specific Automation (2) Combined Function Automation (3) Limited Self-Driving Automation and (4) Full Self-Driving Automation. Each provides for an ever increasing degree of
1 http://www.nhtsa.gov/
Copyright held by the authors.
AutomotiveUI '13, October 28 - 30 2013, Eindhoven, The Netherlands Adjunct Proceedings.
Manfred Tscheligi University of Salzburg
David Wilfinger University of Salzburg
Alexander Meschtscherjakov University of Salzburg
Carlos Montesinos
Intel Labs [email protected]
Dalila Szostak Intel Labs
Roderick McCall University of Luxembourg
Rabindra Ratan Michigan State Universtiy
Alexander Muir Microsoft Corporation
Copyright held by the authors.AutomotiveUI’13, October 27–30, Eindhoven, The Netherlands. Adjunct Proceedings.
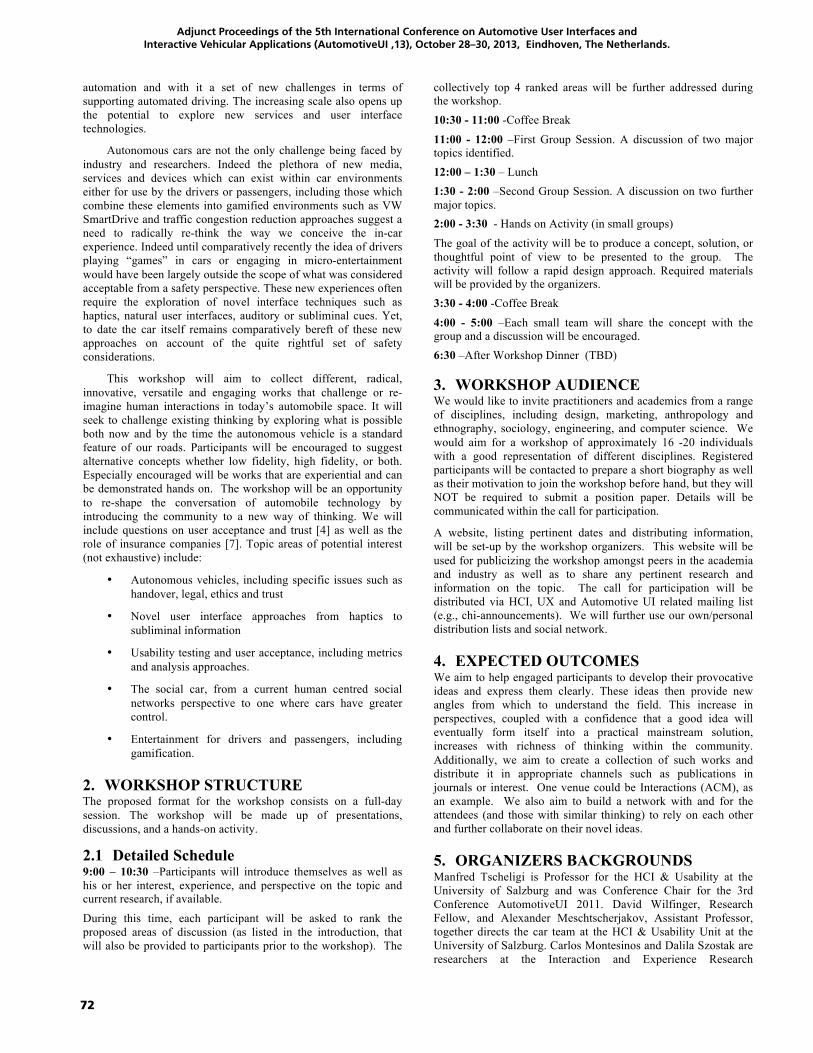
72
Adjunct Proceedings of the 5th International Conference on Automotive User Interfaces and Interactive Vehicular Applications (AutomotiveUI ‚13), October 28–30, 2013, Eindhoven, The Netherlands.
automation and with it a set of new challenges in terms of supporting automated driving. The increasing scale also opens up the potential to explore new services and user interface technologies.
Autonomous cars are not the only challenge being faced by industry and researchers. Indeed the plethora of new media, services and devices which can exist within car environments either for use by the drivers or passengers, including those which combine these elements into gamified environments such as VW SmartDrive and traffic congestion reduction approaches suggest a need to radically re-think the way we conceive the in-car experience. Indeed until comparatively recently the idea of drivers playing “games” in cars or engaging in micro-entertainment would have been largely outside the scope of what was considered acceptable from a safety perspective. These new experiences often require the exploration of novel interface techniques such as haptics, natural user interfaces, auditory or subliminal cues. Yet, to date the car itself remains comparatively bereft of these new approaches on account of the quite rightful set of safety considerations.
This workshop will aim to collect different, radical, innovative, versatile and engaging works that challenge or re-imagine human interactions in today’s automobile space. It will seek to challenge existing thinking by exploring what is possible both now and by the time the autonomous vehicle is a standard feature of our roads. Participants will be encouraged to suggest alternative concepts whether low fidelity, high fidelity, or both. Especially encouraged will be works that are experiential and can be demonstrated hands on. The workshop will be an opportunity to re-shape the conversation of automobile technology by introducing the community to a new way of thinking. We will include questions on user acceptance and trust [4] as well as the role of insurance companies [7]. Topic areas of potential interest (not exhaustive) include:
¥ Autonomous vehicles, including specific issues such as handover, legal, ethics and trust
¥ Novel user interface approaches from haptics to subliminal information
¥ Usability testing and user acceptance, including metrics and analysis approaches.
¥ The social car, from a current human centred social networks perspective to one where cars have greater control.
¥ Entertainment for drivers and passengers, including gamification.
2. WORKSHOP STRUCTURE The proposed format for the workshop consists on a full-day session. The workshop will be made up of presentations, discussions, and a hands-on activity.
2.1 Detailed Schedule 9:00 – 10:30 –Participants will introduce themselves as well as his or her interest, experience, and perspective on the topic and current research, if available.
During this time, each participant will be asked to rank the proposed areas of discussion (as listed in the introduction, that will also be provided to participants prior to the workshop). The
collectively top 4 ranked areas will be further addressed during the workshop. 10:30 - 11:00 -Coffee Break
11:00 - 12:00 –First Group Session. A discussion of two major topics identified. 12:00 – 1:30 – Lunch 1:30 - 2:00 –Second Group Session. A discussion on two further major topics. 2:00 - 3:30 - Hands on Activity (in small groups)
The goal of the activity will be to produce a concept, solution, or thoughtful point of view to be presented to the group. The activity will follow a rapid design approach. Required materials will be provided by the organizers. 3:30 - 4:00 -Coffee Break
4:00 - 5:00 –Each small team will share the concept with the group and a discussion will be encouraged. 6:30 –After Workshop Dinner (TBD)
3. WORKSHOP AUDIENCE We would like to invite practitioners and academics from a range of disciplines, including design, marketing, anthropology and ethnography, sociology, engineering, and computer science. We would aim for a workshop of approximately 16 -20 individuals with a good representation of different disciplines. Registered participants will be contacted to prepare a short biography as well as their motivation to join the workshop before hand, but they will NOT be required to submit a position paper. Details will be communicated within the call for participation.
A website, listing pertinent dates and distributing information, will be set-up by the workshop organizers. This website will be used for publicizing the workshop amongst peers in the academia and industry as well as to share any pertinent research and information on the topic. The call for participation will be distributed via HCI, UX and Automotive UI related mailing list (e.g., chi-announcements). We will further use our own/personal distribution lists and social network.
4. EXPECTED OUTCOMES We aim to help engaged participants to develop their provocative ideas and express them clearly. These ideas then provide new angles from which to understand the field. This increase in perspectives, coupled with a confidence that a good idea will eventually form itself into a practical mainstream solution, increases with richness of thinking within the community. Additionally, we aim to create a collection of such works and distribute it in appropriate channels such as publications in journals or interest. One venue could be Interactions (ACM), as an example. We also aim to build a network with and for the attendees (and those with similar thinking) to rely on each other and further collaborate on their novel ideas.
5. ORGANIZERS BACKGROUNDS Manfred Tscheligi is Professor for the HCI & Usability at the University of Salzburg and was Conference Chair for the 3rd Conference AutomotiveUI 2011. David Wilfinger, Research Fellow, and Alexander Meschtscherjakov, Assistant Professor, together directs the car team at the HCI & Usability Unit at the University of Salzburg. Carlos Montesinos and Dalila Szostak are researchers at the Interaction and Experience Research
73
Adjunct Proceedings of the 5th International Conference on Automotive User Interfaces and Interactive Vehicular Applications (AutomotiveUI ‚13), October 28–30, 2013, Eindhoven, The Netherlands.
Laboratory, Intel Labs, currently focusing in the area of transportation. Rod McCall is the leader of the IGNITE (Interaction, Games and Novel Interface Technologies) research collective at SnT, University of Luxembourg. Rabindra Ratan is an Assistant Professor at Michigan State University’s Department of Telecommunication, Information Studies, and Media. Alexander Muir is Senior Design Researcher in Microsoft Corporation’s Connected Car division, leads the UI Research efforts to explore and assess the next generation of infotainment experiences.
6. REFERENCES [1] Action for Roads A network for the 21st century. Presented
to Parliament by the Secretary of State for Transport by Command of Her Majesty. Available from: https://www.gov.uk/government/uploads/system/uploads/attachment_data/file/212590/action-for-roads.pdfJuly 2013
[2] Arth, Michael E. (2010). Democracy and the Common Wealth: Breaking the Stranglehold of the Special Interests. Golden Apples Media. pp. 363–368
[3] "Autonomous Vehicles". State of California Department of Motor Vehicles.
[4] Beattie, D. Baillie, L., Halvey, M., and McCall R Maintaining a Sense of Control in Autonomous Vehicles via Auditory Feedback. 4th International Workshop on the Perceptual Quality of Systems. September 2-4th 2013, Vienna Austria (to appear).
[5] Bishop, Richard (2005). Intelligent Vehicle Technologies and Trends. Boston: Artech House. p. 300Thrun, Sebastian (2010). "Toward robotic cars". Communications of the ACM (Association for Computing Machinery) 53 (4): 99–106.
[6] Knobel, Martin, et al. "Clique trip: Feeling related in different cars." Proceedings of the Designing Interactive Systems Conference. ACM, 2012.
[7] Light, Donald (8 May 2012). A Scenario" The End of Auto Insurance.
[8] The car that parks itself, The Economist Newspaper Limited, Jun 29, 2013
[9] Yvkoff, Liane (27 April 2012). "Many car buyers show interest in autonomous car tech". CNET.

74
Adjunct Proceedings of the 5th International Conference on Automotive User Interfaces and Interactive Vehicular Applications (AutomotiveUI ‚13), October 28–30, 2013, Eindhoven, The Netherlands.
Message from the Workshop Organizers
Welcome to our second workshop, “Socially-inspired Mechanisms for Future Mobility Services” at the 5th International Conference on Automotive User Interfaces and Interactive Vehicular Applications (AutomotiveUI 2013).
Researchers and practitioners have recently started to think more seriously about the topic of socially inspired car and this is reflected in several big projects just launched. From that background, and based on the findings from the AutoUI 2012 workshop on the same topic, this workshop aims to provoke an active debate on the adequacy of the concept of sociali-zing cars, addressing questions such as who can communicate what, when, how, and why? To tackle these questions, we invited researchers and practitioners to take part in an in-depth discussion of this timely, relevant, and important filed of investigation. We expect that the approach provides exciting challenges, which will significantly impact on an automotive community at large, by making significant contributions toward a more natural and safe communication within a car and between cars.
There are several on-going research projects regarding car-to-car services, but certainly many more inputs are needed to implement robust car-to-car services and environments. We believe that this attempt could be a basis on further research and enrich this growing research domain in automotive user interface contexts.
In conclusion, we greatly appreciate all the authors, participants, and reviewers for their contribution to shaping this work-shop. Enjoy the workshop and the remaining conference!
Andreas Riener, Myounghoon “Philart” Jeon,Ignacio Alvarez
75
Adjunct Proceedings of the 5th International Conference on Automotive User Interfaces and Interactive Vehicular Applications (AutomotiveUI ‚13), October 28–30, 2013, Eindhoven, The Netherlands.
WORKSHOP at AutoUI 2013“Socially-inspired Mechanisms for
Future Mobility Services”
Andreas RienerInst. for Pervasive Computing
Johannes Kepler University LinzEmail:[email protected]
Myounghoon JeonMind, Music, Machine LabMichigan Tech, MI, USAEmail: [email protected]
Ignacio AlvarezHuman-centered Computing LabClemson University, SC, USAEmail: [email protected]
ABSTRACTResearch on next generation automotive ICT is challengedby the complex interactions of technological advancementsand the social nature of individuals using and adopting tech-nology. Traffic in the future will no longer be considered asa network of individually behaving “dumb” cars, but ratheras the entirety of social interactions between its entities.Successful application of collective, socially inspired drivingmechanisms requires to understand how socially-inspired ve-hicles (i.e., driver-car pairs) could make use of their socialhabitus, composed from (past and present) driving behav-ior, social interactions with pedestrians, vehicles, infrastruc-ture, etc., and drivers’ vital states when exposed to otherroad participants in live traffic. In response to this emerg-ing research direction, the aim of this workshop is to achievea common understanding of the symbiosis between drivers,cars, and infrastructure from a global point of view (referredto as“collective driving”). In particular, this workshop is ex-pected to provoke an active debate on the adequacy of theconcept of socializing cars, addressing questions such as whocan communicate what, when, how, and why?
1. “The Social Car”-Workshop at AutoUI 2012Recently launched big projects reflect researchers’ and prac-titioners’ serious interests in socially inspired cars. Fromthis background, our previous workshop, “The Social Car:Socially-inspired C2X Interaction1” at AutomotiveUI 2012,was the first attempt to discuss this timely, relevant, and im-portant field of investigation. Preliminary findings showedexciting potentials of this approach, which would signifi-cantly impact on the automotive community, by making con-tributions to a more natural and safe communication withina car and between cars. In the following, we provide a shortsummary of the outcomes of the first workshop and otherpapers at AutomotiveUI 2012 devoted to this topic.
1.1 Socializing cars » current stateWith everywhere Internet connectivity and broad penetra-tion of social networks, SNS have also emerged in the auto-motive domain. Social services provide a basis for allowingcars to share sort of social information (e. g., feelings and
1https://www.pervasive.jku.at/AutoUI12_SocialCar/
Copyright held by author(s).AutomotiveUI’13, October 27–30, 2013, Eindhoven, The Netherlands
emotions) amongst other vehicles, for example by taking in-formation from diagnostics systems, on board sensors, andlive traffic information into account. The potential is enor-mous, given the number of cars on the road worldwide (cur-rently more than one billion units, with expected growthto 1.5 million in the next 10 years). To infer the plausi-ble distraction in such a highly connected setting, Lee andcolleagues [6] showed computational models of driver be-havior. Schroeter et al. [11] discussed the challenges andopportunities that place and time-specific digital informa-tion may offer to road users. They summarized findingsfrom an on-the-road experiment conducted with the over-arching goal to identify room for improvements to makedriving safer and more enjoyable. Riener’s [7] visionary con-cept of driver-vehicle confluence aimed at understanding thesymbiosis between drivers, cars, and (road) infrastructure,which includes reasoning about driver states and social oremotional interaction. This in-car service could be achievedby modeling driver behaviors, studying distributed negotia-tion processes, performing driving studies and simulations,and relating their results to observations made in reality.To extend on this, the authors of [9] outlines several samplescenarios to accentuate the potential beneficial effects of theapplication of driver-vehicle confluence on future traffic.
The workshop “The Social Car: socially inspired C2X in-teraction” [10] discussed the potential of cars’ socializing onewith the other (similar to how humans are exchanging infor-mation), and aimed to make a blueprint of next generationin-vehicle technologies. Some workshop papers contain moremacro-level perspectives about social cars – Chiesa [10, p.35ff] suggests researchers carefully translating the currentnetworking practices into the new social environment, goingbeyond merely posting pre-set messages on Facebook in acar. In [10, p. 25ff] , Diewald et al. discusses an integratedtransportation service platform called “MobiliNet”, whichprovides a blueprint of how overall vehicle-area-network ser-vices could be arranged in a single platform. Applin andFischer [10, p. 39ff] propose “PolySocial Reality”, a con-ceptual model of the global network environment amongdrivers, passengers, pedestrians, and locations. A series ofpapers discuss intra-car collaborations. Perterer [10, p. 11ff]conceptualize driving as a social activity or collaborationbetween a driver and a passenger, Ratan [10, p. 31ff] de-scribes an in-vehicle agent, but explores different types ofdrivers’ perception about their car: avatar (as an extensionof the self) versus robot (as social entity or a partner), Sonand Park [10, p. 21ff] show empirical research on age and
76
Adjunct Proceedings of the 5th International Conference on Automotive User Interfaces and Interactive Vehicular Applications (AutomotiveUI ‚13), October 28–30, 2013, Eindhoven, The Netherlands.
gender differences in acceptance and effectiveness of a in-telligent warning system. Two papers emphasize more onhow to practically design social car services, especially in-volving users in the iterative design process. Jeon [10, p.45ff] provided young drivers’ needs analysis about plausi-ble vehicle-area-network services based on vivid qualitativedescriptions. Tan and colleagues [10, p. 17ff] introduced a“Jumping Notes” application that could be used in a jam.
1.2 Socializing cars » future proliferationTo develop the future of socially inspired traffic, we focus onin-vehicle social interactions, by exchanging available datafrom on-board information systems, driver states, and pa-rameters gathered from the infrastructure. For example, itwould be relatively easy for a vehicle to continuously streamstatus information (e. g., driving speed, position, destina-tion) by wiretapping on-board information systems and nav-igation devices. Furthermore, a car could provide informa-tion about its “health” by taking information from diagnosissystems such as the engine control unit (ECU) or power-train control module (PCM) (e. g., error codes, condition ofengine, tire temperature, oil pressure, etc.). Last but notleast are non-invasive tracking devices available (capacitiveECG’s, thermal cameras, pressure sensors in the seat, skinconductance sensors in the steering wheel, etc.) that allowfor driver social/mental state detection. Related issues in-clude:
• Car-to-Driver Relationship: A car can (i) “learn”ajam every workday on a certain road, and then, the carwould recommend an alternative route, (ii) “remem-ber” a road sign with a certain speed limit and/or coldtemperature outside (i. e., ice on the road) while driv-ing through a sharp turn (e. g., “Route Buddy”, “Sen-sory Bubble” concepts [4], [5]); and (iii) “forget” theaccident previously happened after some time (e. g., af-ter the winter has passed). This social behavior shouldavoid a car being fearful and driving too slow on thesame road in summer.
• Car-to-Car Relationship: Cars in the vicinity, sameroute or destination can give and take information,such as a speed warning on icy road ahead, rerouterecommendation on traffic jam, or blocked route, etc.It can also facilitate car sharing or car pool services.
• Car-to-Infrastructure Relationship: A social carconcept would require social environments (just as hu-mans need social environments) including the car-to-infrastructure relationship as well as the car-to-driverand the car-to-car relationship. For example,
– “Smart road concept”: Dynamic reconfigurationof the road network by changing lanes per direc-tion inbound/outbound depending on time of dayor road usage,
– “Smart signs concept”: Changes the speed limitbased on the context (e. g., reducing when novicesapproaching or increasing when professional driversapproaching; an “overtaking denied” message ispopping up on a detected big truck or traffic jam,etc. In the curve ahead, “overtaking permitted”is shown if the sign detects no other car in thatarea (“Intelligent Traffic Guide” concept [4], [5]).
AssessmentThe potential is enormous, given the amount of cars on theroad worldwide (which is even higher compared to the num-ber of active Facebook users). The aim of the workshop goesbeyond “just presenting Facebook updates” (or social mediain general) to the driver which has, in our comprehension,a great potential. To outline one possible (maybe the mostprimitive) application scenario, with socially inspired car-to-car interaction automatic driver assistance systems wouldhave the foundation to autonomously communicate and ne-gotiate with each other car without driver involvement.
The central objective is to provoke an active debate on theadequacy of the concept of socializing cars. The workshoptopic raises elementary questions (e. g., 5W1H), includingwho can communicate what, when, how, and why? To tacklethese questions we would like to invite researchers to takepart in an in-depth discussion of this timely, relevant, andimportant field of investigation.
2. Organizers biosAndreas Rieneris a postdoctoral research fellow at the Institute of Perva-sive Computing at the University of Linz (Austria). He hasmore than 60 peer reviewed publications in the broader fieldof (implicit) human-computer interaction and context-awarecomputing. His core competence and current research fo-cus is human vital state recognition from embedded sensors,multimodal sensor and actuator systems, context-sensitivedata processing, and socially-inspired implicit interactioninfluencing the driver-vehicle interaction loop. Andreas ismember of the Austrian Computer Society (OCG), IEEEMember, and member of the Human Factors and ErgonomicsSociety (HFES), Europe Chapter.
Myounghoon “Philart” Jeonis an assistant professor in the Department of Cognitiveand Learning Sciences at Michigan Tech. His research areasencompass auditory displays, affective computing, assistivetechnology, and automotive interface design. His researchhas yielded around 60 publications across various journalsand conference proceedings. He received his PhD from Geor-gia Tech in 2012. His dissertation focused on the design ofin-vehicle emotion regulation interfaces using auditory dis-plays. Previously, he worked at LG Electronics and wasresponsible for all of their automotive UIs & sound designs.
Ignacio Alvarezis currently research assistant at the Human-Centered Com-puting Lab in Clemson University focusing on AutomotiveUser Interaction design and its relation to driver distraction.Furthermore he is project manager in BMW for ConnectedDrive and Innovations for the Asia Pacific Area, where hedirects the development of vehicle telematic functions fordriver assistance, security, infotainment and location basedservices. He obtained his PhD in Computer Science and Ar-tificial Intelligence at University of the Basque Country inSpain in 2012. His dissertation focused on the developmentof natural vehicle voice interfaces adaptive to the driver dis-traction level.
77
Adjunct Proceedings of the 5th International Conference on Automotive User Interfaces and Interactive Vehicular Applications (AutomotiveUI ‚13), October 28–30, 2013, Eindhoven, The Netherlands.
3. REFERENCES
[1] M. Faezipour, M. Nourani, A. Saeed, and S. Addepalli.Progress and challenges in intelligent vehicle areanetworks. Commun. ACM, 55(2):90–100, Feb. 2012.
[2] J. Forlizzi, W. C. Barley, and T. Seder. Where shouldi turn: moving from individual to collaborativenavigation strategies to inform the interaction designof future navigation systems. In Proceedings of CHI’10, pages 1261–1270. ACM, 2010.
[3] M. Jeon. “i-PASSION”: A concept car user interfacecase study from the perspective of user experiencedesign. In Adjunct proceedings of AutomotiveUI’10,2010.
[4] M. Jeon, A. Riener, J.-H. Lee, J. Schuett, andB. Walker. Cross-Cultural Differences in the Use ofIn-vehicle Technologies and Vehicle Area NetworkServices: Austria, USA, and South Korea. InProceedings of AutomotiveUI’12, page 8. ACM,October 2012. submitted, notification pending.
[5] M. Jeon, J. Schuett, J.-B. Yim, P. Raman, andB. Walker. ENGIN (Exploring Next GenerationIN-vehicle INterfaces): Drawing a new conceptualframework through iterative participatory processes.In Adjunct Proceedings of AutomotiveUI’11, page 2,December 2011.
[6] J. Lee, J. D. Lee, and D. D. Salvucci. Evaluating thedistraction potential of connected vehicles. InProceedings of the 4th International Conference onAutomotive User Interfaces and Interactive VehicularApplications, AutomotiveUI ’12, pages 33–40, NewYork, NY, USA, 2012. ACM.
[7] A. Riener. Driver-vehicle confluence or how to controlyour car in future? In Proceedings of the 4thInternational Conference on Automotive UserInterfaces and Interactive Vehicular Applications,AutomotiveUI ’12, pages 217–224, New York, NY,USA, 2012. ACM.
[8] A. Riener. Human-Computer Confluence (HC2)Visions Book, chapter Driver-vehicle confluence or howto control your car in future? Institute for PervasiveComputing, Johannes Kepler University Linz, 2012.[online], http://hcsquared.eu/hc2-visions-book.
[9] A. Riener and A. Ferscha. Enhancing Future MassICT with Social Capabilities. In E. Mitleton-Kelly,editor, Co-evolution of Intelligent Socio-technicalSystems, Understanding Complex Systems, pages141–184. Springer Berlin Heidelberg, 2013.
[10] A. Riener, M. Jeon, A. K. Dey, and A. Gaggioli.Workshop “The Social Car – Socially Inspired Car2XInteraction“. In 4th International Conference onAutomotive User Interfaces and Interactive VehicularApplications (AutomotiveUI’12), October 17-19,Portsmouth, NH, USA, page 58, October 17 2012.
[11] R. Schroeter, A. Rakotonirainy, and M. Foth. Thesocial car: new interactive vehicular applicationsderived from social media and urban informatics. InProceedings of the 4th International Conference onAutomotive User Interfaces and Interactive VehicularApplications, AutomotiveUI ’12, pages 107–110, NewYork, NY, USA, 2012. ACM.

78
Adjunct Proceedings of the 5th International Conference on Automotive User Interfaces and Interactive Vehicular Applications (AutomotiveUI ‚13), October 28–30, 2013, Eindhoven, The Netherlands.
79
Adjunct Proceedings of the 5th International Conference on Automotive User Interfaces and Interactive Vehicular Applications (AutomotiveUI ‚13), October 28–30, 2013, Eindhoven, The Netherlands.
Necessity of Vehicle to Rail Infrastructure Communication for Grade Crossing Warning & Safety
Myounghoon Jeon Mind, Music & Machine Lab
Department of Cognitive and Learning Sciences
1400 Townsend Dr, Houghton, MI [email protected]
Pasi Lautala Rail Transportation Program
Department of Civil and Environmental Engineering
1400 Townsend Dr, Houghton, MI [email protected]
ABSTRACT Vehicle area network (VAN) services have been launched in the U.S. and EU with a focus on vehicle-to-vehicle (V2V) interactions. However, V2V is not the whole story of the VAN concepts. As a case study of vehicle-to-infrastructure (V2I) communication, this position paper tries to show the necessity of vehicle-to-rail infrastructure networking with respect to the warning system at grade crossings. After describing the challenges of the current warning systems at grade crossings, we delineate a series of research plans about the possibility of the use of in-vehicle auditory warnings, plausible distracters, and the optimization of the information via V2I communication, which will lead to the ultimate conclusion of the necessity of V2I communication. We hope that this paper could contribute to the extension of the VAN concept and facilitate a debate on this topic in the Automotive UI community.
Categories and Subject Descriptors H.5.2 [Information Interfaces and Presentation (e.g., HCI)]: User Interfaces – Evaluation/methodology, Interaction Styles (e.g., commands, menus, forms, direct manipulation), Auditory (non-speech) feedback, Voice I/O, User-Centered Design
J.4 [Computer Application]: Social and Behavioral Sciences – Psychology
General Terms Design, Experimentation, Human Factors
Keywords Auditory warning; grade crossing; VAN (vehicle area network); vehicle-to-infrastructure communication
1. INTRODUCTION With the advances of networking technologies, people experience literally “seamless services” in any contexts, including their home,
workplace, or even on-the-go. This trend is also pervasive in a vehicle domain, which leads to what we call “vehicle area network” (VAN) or social car research [1]. Fairly recently, a couple of big projects about VAN services have been launched with a focus on vehicle-to-vehicle networking (V2V) [e.g., 2, 3]. However, V2V is not the only one consideration of the VAN concepts, but VAN services can be classified into four categories: IV (Intelligent Vehicle), V2V (Vehicle-to-Vehicle), V2B (Vehicle-to-Business), and V2I (Vehicle-to-Infrastructure) [4]. The present paper focuses on V2I. To illustrate, V2I can include an intelligent traffic guide that helps drivers to decide “stop or go” on the yellow light. Free parking slot finder is another example of the V2I service. Drivers can get customized infomercial (information + commercial) fitting to their situations even though it also seems close to V2B. For more examples of VAN services, see …….[5]. We propose the vehicle to rail infrastructure communications to improve highway rail at-grade crossing safety. Fatalities that take place at highway grade crossings (together with trespasser fatalities) form the great majority of rail related fatalities annually. Given that human errors account for more than one third of all train accidents in the U.S. [9], one of the potential approaches to reduction of grade crossing fatalities and accidents may be to provide drivers with optimized warnings and to decrease a chance for missing warnings. Currently, there are two main types of warnings to drivers in the highway grade crossings; visual and auditory warnings. Given that drivers’ vision is already heavily taxed while driving, auditory warnings may hold greater potential to improve driver safety. To demonstrate the necessity of V2I in this grade crossing context, Michigan Tech has planned a series of research activities to investigate the effects of auditory warning cues on driver behaviors at rail crossings and explore optimal alternative designs to compensate for the issues of the current warning systems via vehicle-to-rail infrastructure communication. When it comes to a constituent of V2I communication in grade crossings, it can include drivers (or the in-vehicle systems), locomotive cab operators, and grade crossing systems. The three phases of research include: (1) comparing the effects of warning types (visual, traditional auditory, and novel in-vehicle auditory warnings) when approaching the rail crossings, (2) analyzing the interaction effects between auditory warnings and auditory distractions at railroad crossings, and (3) designing optimal auditory warnings by considering warning sources, timings, and appropriate contents.
2. CHALLENGES AND NECESSITY OF
Permission to make digital or hard copies of all or part of this work for personal or classroom use is granted without fee provided that copies are not made or distributed for profit or commercial advantage and that copies bear this notice and the full citation on the first page. To copy otherwise, or republish, to post on servers or to redistribute to lists, requires prior specific permission and/or a fee. AutomotiveUI’13, October 27–30, 2013, Eindhoven, The Netherlands. Copyright 2013 ACM 1-58113-000-0/00/0010 …$15.00.
80
Adjunct Proceedings of the 5th International Conference on Automotive User Interfaces and Interactive Vehicular Applications (AutomotiveUI ‚13), October 28–30, 2013, Eindhoven, The Netherlands.
V2I FOR GRADE CROSSINGS Under current practices, railroads sound locomotive horns or whistles in advance of grade crossings [6]. Under the Federal regulation, locomotive engineers must sound train horns for a minimum of 15 seconds, and a maximum of 20 seconds, in advance of all public grade crossings. Grade crossings with active warning devices (gates and lights) have also bells as additional auditory warnings. One of the current auditory warning issues is that it has multiple exceptions (e.g., if a train is traveling faster than 45 mph, if a train stops in close proximity to a crossing, or when engineers can’t precisely estimate their arrival at a crossing, etc). In these exceptional cases, the auditory warning convention might be different or could even disappear. Moreover, local governments or public agencies are able to establish “quite zones”, which are equipped only with conventional visual warning devices such as flashing lights and gates. Therefore, a supplemental auditory warning is necessarily required for this situation. On the other hand, the traditional auditory warnings at rail crossings could be masked by varied distraction sources, such as in-vehicle music, speech with passengers, or phone calls. Based on this background, in-vehicle auditory warnings at grade crossings can be an alternative approach to reduce grade crossing fatalities and accidents, making vehicle-to-rail infrastructure communication necessary.
3. ON-GOING PROJECTS 3.1 Warning Types First, we will determine the incremental effects of auditory warnings including both novel in-vehicle signals and traditional train horns and crossing bells, in addition to visual warnings for the driver when the car is approaching rail crossings. Some navigation devices (e.g., TomTom, Garmin, etc.) provide a visual symbol about the rail crossings, but they do not provide auditory warnings. Auditory researchers have applied a number of auditory cues to the in-vehicle contexts (e.g., speech cues, auditory icons [7] – representative part of sounds of objects or events, and earcons [8] – short musical motives as symbolic representations of objects or events). However, there is still a debate about the best auditory cue. This study compares all of those types of auditory cues at a variety of crossing types and sees whether in-vehicle auditory warnings can equal or improve conventional ones. Drivers will complete a simulated drive that will include a series of rail crossings with diverse auditory cues.
3.2 Distraction and Masking Next, we will assess the effects of auditory distractions on drivers’ ability to recognize railroad crossings in advance and prepare for it accordingly. Plausible in-vehicle auditory distractions will include sound-based (music), speech-based (news), and cognitive-based (cell-phone conversation) ones. The intent of this study is to understand what type of auditory warnings (traditional ones and various in-vehicle ones) at crossings are less masked by auditory distracters and more effectively alert distracted drivers.
3.3 Optimization of Warnings via V2I Networking Finally, we will explore more specific details of auditory warnings. Currently, train horns must be sounded in a standardized pattern of 2 long, 1 short, and 1 long and the horn must continue to sound until the lead locomotive or train car occupies the grade crossing [6]. Taken the results of the previous
phases, optimal warning alternatives will be designed and tested in terms of auditory cue types, sources, and timings (when to provide auditory cues and how many warnings to provide). In this phase, we are specifically interested in warning contents (e.g., how to synchronize the warning with the arrival to the rail crossing with the current car speed, whether there is an approaching train, where the train is coming from, etc.). Some of the information should be obtained via the communication with locomotive operators or grade crossing systems. We are also interested in measuring drivers’ perceived performance and subjective safety in addition to objective performance in their readiness.
4. CONCLUSIONS & FUTURE WORKS This research will provide a deeper understanding of how drivers can be more effectively prepared to approach railroad crossings with newer types of auditory warnings, and that could be possible only with appropriate V2I communication. As an outcome, this research can also inform the decisions on how to design optimized auditory warnings and when to provide drivers with critical auditory warning information. The timing and the range (i.e., trigger zone) of the communication and who is in charge of communication (e.g., driver and operator or in-vehicle – i.e., automation) need to be further addressed.
5. REFERENCES [1] Riener, A. Jeon, M. Gaggioli, A. and Dey, A. 2012. Auto-UI
workshop proposal: “The social car”. In Proceedings of the 3rd International Conference on Automotive User Interfaces and Vehicular Applications (Portsmouth, New Hampshire, USA, October 17 – 19, 2012). AutomotiveUI’12.
[2] http://www.annarbor.com/business-review/u-m-connected-vehicles-study-is-a-potential-vehicle-safety-game-changer-and-research-deal-of-the-yea/ retrieved August, 2013.
[3] http://www.fhwa.dot.gov/advancedresearch/pubs/12033/004.cfm retrieved August, 2013.
[4] Faezipour, M., Nourani, M., Safed, A., and Addepalli, S. 2012. Progress and challenges in intelligent vehicle area networks. Communications of the ACM. 55, 2, 90-100.
[5] Jeon, M., Riener, A., Lee, J.-H., Schuett, J., and Walker, B. N. 2012. Cross-cultural differences in the use of in-vehicle technologies and vehicle area network services: Austria, USA, and South Korea. In Proceedings of the 3rd International Conference on Automotive User Interfaces and Vehicular Applications (Portsmouth, New Hampshire, USA, October 17 – 19, 2012). AutomotiveUI’12.
[6] FRA Office of Public Affairs. 2013. Federal railroad administration locomotive horn sounding and quiet zone establishment fact sheet. February, 2013.
[7] Gaver, W. W. 1986. Auditory icons: Using sound in computer interfaces. Human-Computer Interaction. 2, 167-177.
[8] Blattner, M. M. Sumikawa, D. A. and Greenberg, R. M. 1989. Earcons and icons: Their structure and common design principles. Human-Computer Interaction. 4, 11-44.
[9] U.S. Department of Transportation. 2013. Broad agency announcement (DTFR53-BAA-2013-1) Federal Railroad Administration Office of Research and Development, Research Initiatives in support of rail safety.

81
Adjunct Proceedings of the 5th International Conference on Automotive User Interfaces and Interactive Vehicular Applications (AutomotiveUI ‚13), October 28–30, 2013, Eindhoven, The Netherlands.
Cards as design tools for the “Social Car” domainMario Chiesa
Istituto Superiore Mario Boellavia P.C. Boggio 61
10138 [email protected]
Alessandro BrancifortiIstituto Superiore Mario Boella
via P.C. Boggio 6110138 Torino
Matteo RuffinengoIstituto Superiore Mario Boella
via P.C. Boggio 6110138 Torino
ABSTRACTIn this paper, we present our “Social-based Services for Mobility” card deck, as a powerful tool for brainstorming sessions and design inspirations, focused on the ‘Social Car’ domain.
Categories and Subject DescriptorsH.3.5 [Online Information Services]: Web-based services
General TermsDesign, Human Factors.
KeywordsCar, social car, social-based services.
1. INTRODUCTIONIn the initial phase of our collaborative research project AUTUMN2 - AUTomotive hUman Mobile Network 2 – our group was mainly focused into the exploration of new ideas, concepts and paradigms about social-based services for the automotive domain.During the activities we collected a huge amount of data, material and notes about existing services, users’ wants and needs, typical users’ scenarios, etc. Then, one of the project’s goals was re-defined as the implementation of a set of services, or a meta-service, rather than the implementation of a single, vertical, narrow service for a single need/scenario.
For this reason, we went deeper into the analysis of possible correlations, overlapping, integrations and mutual interactions among what discovered until that moment. We understood that a card deck could be an useful tool to communicate initial results, engage users, stakeholders, other designers and researchers in further brainstorming sessions and design. We discovered through the use that it helps especially in the discovery of unexpected interactions and relationships between different scenarios, and more.
Permission to make digital or hard copies of all or part of this work for personal or classroom use is granted without fee provided that copies are not made or distributed for profit or commercial advantage and that copies bear this notice and the full citation on the first page. To copy otherwise, or republish, to post on servers or to redistribute to lists, requires prior specific permission and/or a fee.Copyright held by author(s)AutomotiveUI'13, October 28-30 2013, Eindhoven, Netherlands.Adjunct Proceedings
2. CARDS CATEGORIESDuring the initial phase of the project we explored, without limitations, a huge set of possible scenarios for automotive/mobility services, considering several patterns and behaviors, from commuters to tourists, from young drivers to elderly people, from existing services to futuristic ones.
Explorations went through brainstorming and bodystorming sessions, observations, interviews with actual drivers, personal logs. After some clustering sessions, we organize 40 cards into four main categories:
Driving, Parking, Commuting, Identity.
Figure 1 - A shot caught during one clustering sessionTemporal and functional relationships were the main criteria for the affinity diagram built during clustering sessions, with the aim of ‘covering’ the largest possible spectrum of scenarios, within a typical all-day-long usage, or for special occasions.
In ‘Driving’ we consider all the services, scenarios or needs that happen while driving. In ‘Parking’, services, scenarios or needs that happen while the car is parked. The category ‘Commuting’ refers to services especially focused on the interaction with other transport systems, like metro, bus, bike, etc. Finally, the ‘Identity’ category
3. CARDS LAYOUT AND CONTENT3.1 The back sideOn the back side, a picture suggests and shows the theme/service described by the card itself. A colored strip defines the category of
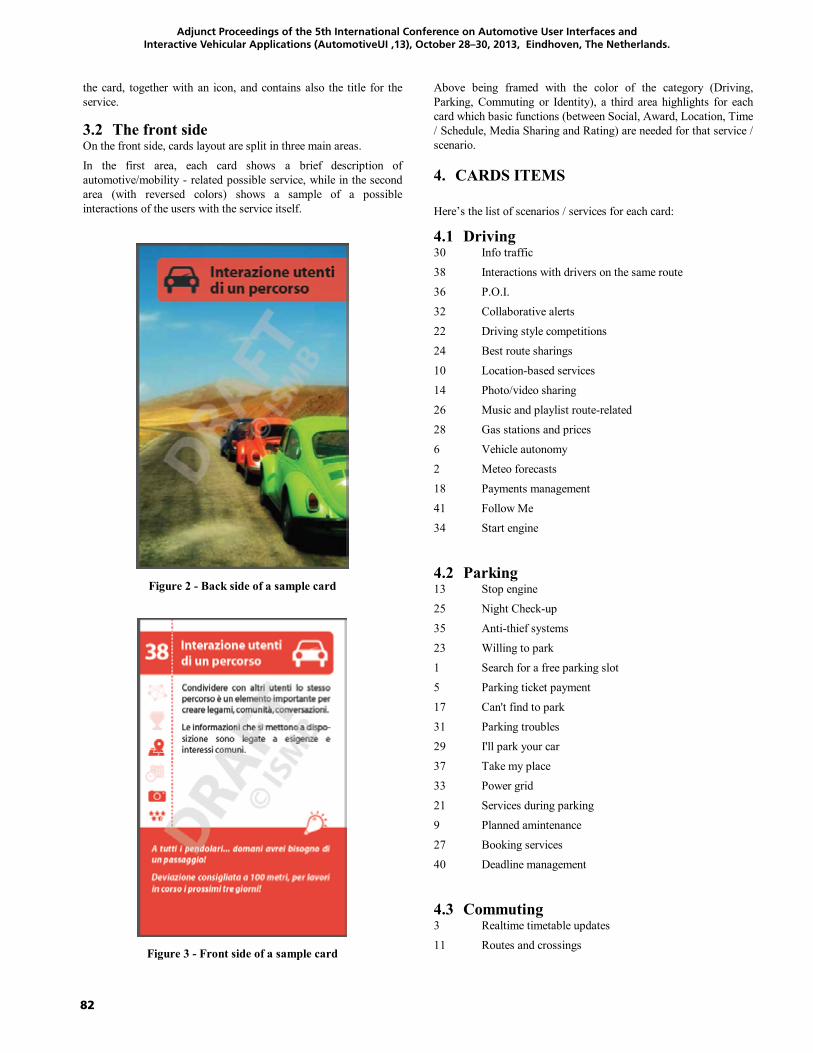
82
Adjunct Proceedings of the 5th International Conference on Automotive User Interfaces and Interactive Vehicular Applications (AutomotiveUI ‚13), October 28–30, 2013, Eindhoven, The Netherlands.
the card, together with an icon, and contains also the title for the service.
3.2 The front sideOn the front side, cards layout are split in three main areas.
In the first area, each card shows a brief description of automotive/mobility - related possible service, while in the second area (with reversed colors) shows a sample of a possible interactions of the users with the service itself.
Figure 2 - Back side of a sample card
Figure 3 - Front side of a sample card
Above being framed with the color of the category (Driving, Parking, Commuting or Identity), a third area highlights for each card which basic functions (between Social, Award, Location, Time/ Schedule, Media Sharing and Rating) are needed for that service / scenario.
4. CARDS ITEMS
Here’s the list of scenarios / services for each card:
4.1 Driving30 Info traffic
38 Interactions with drivers on the same route
36 P.O.I.
32 Collaborative alerts
22 Driving style competitions
24 Best route sharings
10 Location-based services
14 Photo/video sharing
26 Music and playlist route-related
28 Gas stations and prices
6 Vehicle autonomy
2 Meteo forecasts
18 Payments management
41 Follow Me
34 Start engine
4.2 Parking13 Stop engine
25 Night Check-up
35 Anti-thief systems
23 Willing to park
1 Search for a free parking slot
5 Parking ticket payment
17 Can't find to park
31 Parking troubles
29 I'll park your car
37 Take my place
33 Power grid
21 Services during parking
9 Planned amintenance
27 Booking services
40 Deadline management
4.3 Commuting3 Realtime timetable updates
11 Routes and crossings
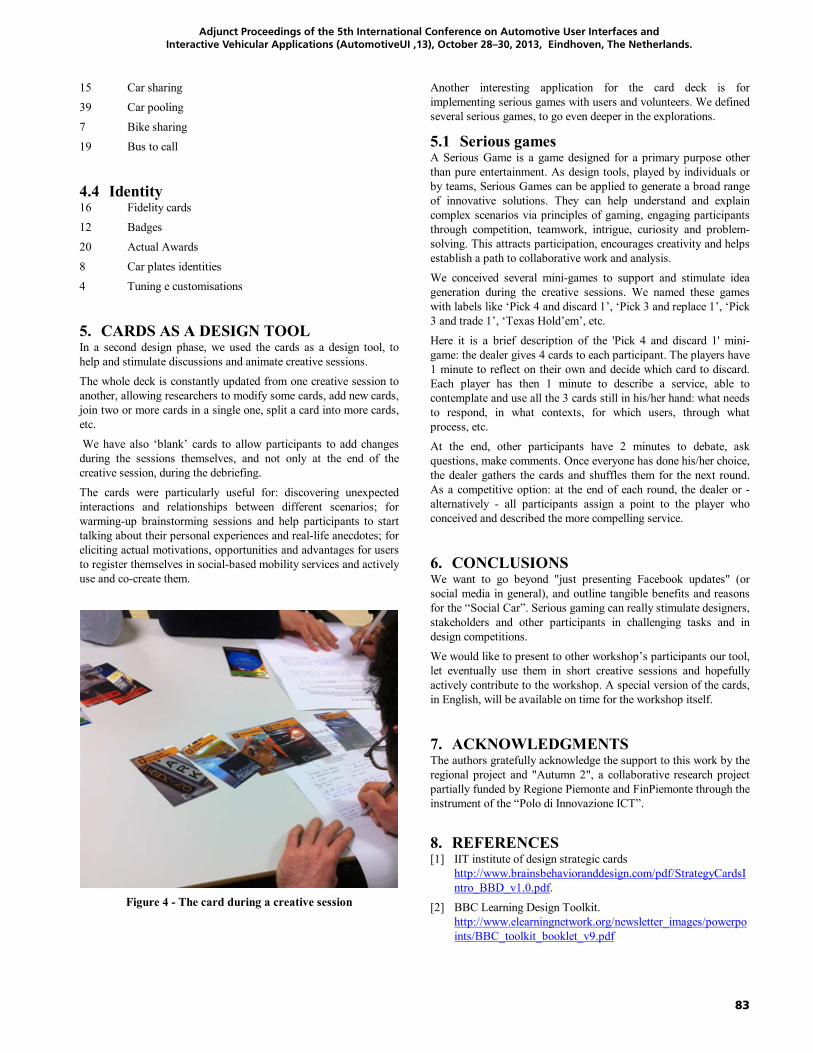
83
Adjunct Proceedings of the 5th International Conference on Automotive User Interfaces and Interactive Vehicular Applications (AutomotiveUI ‚13), October 28–30, 2013, Eindhoven, The Netherlands.
15 Car sharing
39 Car pooling
7 Bike sharing
19 Bus to call
4.4 Identity16 Fidelity cards
12 Badges
20 Actual Awards
8 Car plates identities
4 Tuning e customisations
5. CARDS AS A DESIGN TOOLIn a second design phase, we used the cards as a design tool, to help and stimulate discussions and animate creative sessions.
The whole deck is constantly updated from one creative session to another, allowing researchers to modify some cards, add new cards, join two or more cards in a single one, split a card into more cards, etc.
We have also ‘blank’ cards to allow participants to add changes during the sessions themselves, and not only at the end of the creative session, during the debriefing.
The cards were particularly useful for: discovering unexpected interactions and relationships between different scenarios; for warming-up brainstorming sessions and help participants to start talking about their personal experiences and real-life anecdotes; for eliciting actual motivations, opportunities and advantages for users to register themselves in social-based mobility services and actively use and co-create them.
Figure 4 - The card during a creative session
Another interesting application for the card deck is for implementing serious games with users and volunteers. We defined several serious games, to go even deeper in the explorations.
5.1 Serious games A Serious Game is a game designed for a primary purpose other than pure entertainment. As design tools, played by individuals or by teams, Serious Games can be applied to generate a broad range of innovative solutions. They can help understand and explain complex scenarios via principles of gaming, engaging participants through competition, teamwork, intrigue, curiosity and problem-solving. This attracts participation, encourages creativity and helps establish a path to collaborative work and analysis.
We conceived several mini-games to support and stimulate idea generation during the creative sessions. We named these games with labels like ‘Pick 4 and discard 1’, ‘Pick 3 and replace 1’, ‘Pick 3 and trade 1’, ‘Texas Hold’em’, etc.
Here it is a brief description of the 'Pick 4 and discard 1' mini-game: the dealer gives 4 cards to each participant. The players have 1 minute to reflect on their own and decide which card to discard. Each player has then 1 minute to describe a service, able to contemplate and use all the 3 cards still in his/her hand: what needs to respond, in what contexts, for which users, through what process, etc.
At the end, other participants have 2 minutes to debate, ask questions, make comments. Once everyone has done his/her choice, the dealer gathers the cards and shuffles them for the next round.As a competitive option: at the end of each round, the dealer or -alternatively - all participants assign a point to the player who conceived and described the more compelling service.
6. CONCLUSIONSWe want to go beyond "just presenting Facebook updates" (or social media in general), and outline tangible benefits and reasons for the “Social Car”. Serious gaming can really stimulate designers, stakeholders and other participants in challenging tasks and in design competitions.
We would like to present to other workshop’s participants our tool, let eventually use them in short creative sessions and hopefully actively contribute to the workshop. A special version of the cards, in English, will be available on time for the workshop itself.
7. ACKNOWLEDGMENTSThe authors gratefully acknowledge the support to this work by the regional project and "Autumn 2", a collaborative research project partially funded by Regione Piemonte and FinPiemonte through the instrument of the “Polo di Innovazione ICT”.
8. REFERENCES[1] IIT institute of design strategic cards
http://www.brainsbehavioranddesign.com/pdf/StrategyCardsIntro_BBD_v1.0.pdf.
[2] BBC Learning Design Toolkit.http://www.elearningnetwork.org/newsletter_images/powerpoints/BBC_toolkit_booklet_v9.pdf

84
Adjunct Proceedings of the 5th International Conference on Automotive User Interfaces and Interactive Vehicular Applications (AutomotiveUI ‚13), October 28–30, 2013, Eindhoven, The Netherlands.
[3] IDEO Method cardshttp://www.ideo.com/work/method-cards/.
[4] HAPTIMAP Context cards for dynamic user experiencehttp://www.english.certec.lth.se/haptics/DynamicUserExperiences_ContextCards_110915.pdf
85
Adjunct Proceedings of the 5th International Conference on Automotive User Interfaces and Interactive Vehicular Applications (AutomotiveUI ‚13), October 28–30, 2013, Eindhoven, The Netherlands.
Socially-inspired Driving Mechanisms
Andreas RienerJKU Linz, Institute for Pervasive ComputingAltenberger Strasse 69, 4040 Linz, Austria
E-Mail: [email protected]
ABSTRACTToday’s cars include plenty of technology, however, they arestill mindless and need to be controlled by an individual. Aseach and every driver has its own personality and the inter-nal state of a driver may change from one moment to thenext, this individuality is affecting vehicle movement on theroad, leading to an unpredictable and unsafe movement be-havior. Looking into the future of traffic, which is expectedto be shaped by (gradually emerging) self driving cars, a safe(and effective) coexistence would require social interaction,collective negotiation, and concerted (re)action between allthe entities (i. e., manually controlled cars and autonomousvehicles). This position paper aims to identify problems andhighlight possible solutions in this regard.
1. SOCIAL PRINCIPLES IN TRAFFICSocial interaction in the car domain has up to now be pro-
vided only on individual level. Technical advances affectingvehicle handling (e. g., power steering, assisted braking, etc.)and driving comfort (route guidance, driving assistance, onboard entertainment, etc.) have led to a strong(er) interre-lationship between the driver and the technical systems in acar [4]. With latest achievements in wireless communicationtechnologies the whole new class of vehicle-to-“x” applica-tions allows now spontaneous formation of car collectives orcooperative crowds to offer services and applications on car-to-car, car-to-roadside, and car-to-infrastructure levels. Thecritical question here is, however, if the information tech-nology available in the car actually allows for “real” socialbehavior in networks of cars. According to [5], social awarecars (with abilities and intentions for adaptation) have tocope with individual and group behaviors and goals. Thebasic entities of such a system are many local actors (driver-car pairs) with 1) individualism (habits, customs, character,daily routine, (un)consciousness, personality, emotions, cog-nitions, physical states, intrinsic and extrinsic behaviors),restricted perception of their environment, and a limitedcapacity of action as well as 2) collectivism (social group-ing, long and short term social behaviors, social practice,both prejudices and tolerance, fashion, tradition, social eti-quette). What has been observed so far is that most of thestated principles have been seriously neglected in presentsystems and that also ethics need to be built-in in any so-lution in order to provide ethical sensitivity to each of the
Copyright held by author(s).AutomotiveUI’13, October 28–30 2013, Eindhoven, Netherlands.Adjunct Proceedings
above aspects. To approach an answer for individualism,a number of (social) criteria characterizing human behav-ior and/or reputation need to be validated. Attributes toconsider include the ability to communicate and interact,willingness to negotiate, own cognitive abilities, self-managebehavior history, good/bad reputation, judgment, ability toassert oneself, forget/forgive, rapid assessment and decisionmaking, and learning/adaptation capabilities. With regardto collectivism, cars are socializing to achieve a global opti-mum (the goal) based on a cost (fitness) function that con-cerns the environment of the problem in its totality. Thedifficulty in traffic is, that different time scales are evident(driving action: seconds, emergence of a jam: minutes tohours; change of weather: hours to days; legal regulations:month to years), that driving is a highly dynamic task (ne-gotiation, re-distribution of the decision to local actors, be-havior adaption, etc. is often not possible in the due time),that there are many (local) actors with maybe individualbehavior, restricted perception of their environment, anda limited capacity of action involved, and that the contextand its boundary conditions are continuously changing (traf-fic situation, jams/accidents (driver fell asleep), infrastruc-ture failures (traffic lights), weather conditions (dry to snowstorm), etc.) [1] [2]. Furthermore, in order to provide sta-ble solutions (interplay of individualism and collectivism) itis required to perfectly understand the reality to be faced,i. e., the context and its boundary condition in which thescenario is embedded into.
1.1 Evolution of Social Interaction in TrafficCars may have become “smart” during the last time, but
still they are mindless and need to be controlled by an indi-vidual. Each and every driver has its own personality andthe internal state of a driver may change by different rea-sons from one moment to the next. And this is, of course,a source of unpredictable and unsafe behavior. Legislatoryregulations and traffic control can prevent danger caused byalcohol, drugs, maybe fatigue, but there are other sourcesthat (temporarily) influence the normal competence of adriver that might not (yet) be detected reliably by tech-nology (for example, stress, anger, or rage). Before estab-lishing vehicle-to-X communication on broad scale (and withit, enable self-driving on larger scale), the before mentionedproblems need to be solved. For a very long time, automo-tive assistance systems were operated in isolation in singlecars and only with broad availability of mobile communi-cation, first applications under the umbrella of “networkedcars” emerged. At this time, connected car services werepromised to drive improvements in driving efficiency, safety,
86
Adjunct Proceedings of the 5th International Conference on Automotive User Interfaces and Interactive Vehicular Applications (AutomotiveUI ‚13), October 28–30, 2013, Eindhoven, The Netherlands.
comfort, etc., but unfortunately, they were mostly realizedas manufacturer specific applications (e. g., BMW connect)with the hidden thought in mind to enable remote inspec-tion of car use or situated in the multimedia/gaming domain(sharing of media, playing network games, or chatting be-tween cars), which is also not really useful with regard tothe original aim. Nowadays almost each newly sold car isconnected to the Internet, and with it is the transition fromformerly independently acting drivers and cars to connect-edness with ’the rest of the planet’ completed. (Even if thecoverage of wireless vehicle communication technology on aglobal scale is still some years away, this is mainly a tech-nological issue and actually will happen [15].) Completeinterconnectedness of vehicles offers tremendous potentialfor services in the car centered around “social intelligence”or the ability of a system to understand and manage socialbehavior.
Until now, computers (and assistance systems) have beensocially ignorant, i. e., they have not accounted for the factthat humans decisions are always socially inspired. But thiswill have to change in next-generation automotive informa-tion processing systems to include the essence of social in-telligence in order to increase effectiveness and safety – timehas come to offer social services to cars to allow them tointeract in a similar way humans communicate and inter-act one with another. The car should, for example, relievethe driver by taking over tasks and accomplish them as effi-ciently as the human driver by applying sort of social intel-ligence. Socially behaving cars should create true value [3]for the road participants, and not just post the social status(feelings) of a driver or provide status information of the car(and collect “Like”s) as Facebook does...
Problems and Possible SolutionsLooking on global problems in road traffic, it is evident thattraffic density and likelihood/duration of jams has consid-erably increased in the past decades. Together with it feelmore and more drivers increased stress or anger from traffic,and a lot of people cancels or postpones planned trips due toanticipated high traffic. These problems cannot be solved byjust adding another lane to the highway, build new roads, orpush public transportation. A sustainable solution requiresan holistic approach including new ways of traveling (pla-tooning, car- and bike-sharing, active mobility, i. e. walking,bicycling, etc.), concerted coordination, and proactive man-agement of traffic. This can be achieved, already today, bycombining real time tracking data of vehicles, traffic flowsensing, and weather and event information, with analysistools and simulation models to proactively control trafficand, thus, keep people moving more efficiently or safe. Byapplying concepts like incentivization it is likely that thebehavior of cars/drivers can be (sustainably) changed.
Social acting vehicles could, for example, allow cars to au-tomatically resolve conflicts in mass traffic, negotiate witheach other, behave as a collective to optimize characteris-tics such as driving time or efficiency (e. g., waiting time intraffic jams or road charge to pay), to address the topic ofenvironmental protection (reduced CO2 emission), to raisesafety on the road by monitoring other cars’ behavior in thevicinity, etc. More precisely, connected vehicles could issuewarnings about potential dangers to other cars behind. Con-certed deviation in the steering angle could, for instance, beused as an indicator of an obstruction on a otherwise straight
road segment. If a vehicle at some distance ahead appliesthe brake hard, a system alert can be issued to all the carsbehind to avoid (mass) rear-end collisions and a “slipperyroad surface” warning could be relayed to all drivers in acertain region if at some point, e. g., on a bridge ahead,several cars have applied their brake during the past time(recognized by a sensor in the power brake unit) and at thesame time the CAN bus provide information that tractionwas lost. Depending on the outside temperature this mighthave been caused by road ice or oil slick.
More provocative, a social car could require a social en-vironment (for example, intelligent roads with dynamicallychanging lanes; road signs adapting to the driver, etc.) andsocial cars should have real social capabilities, such as“learn-ing” (car automatically recommends alternative routes ifhaving learned that there is a traffic jam every workday inthat region at a certain time; such behavior would in par-ticular relevant for drivers using a rental car in an unknownarea), “forgetting” (for example, vehicle moves more care-fully after having been involved in an accident; however, theincident is forgotten after some time and avoids that the caris fearful and drive too slow in the long term), or“remember-ing” (a vehicle remembers from one winter to the next, thatdriving at or near the speed limit is not wise on tempera-tures below zero degrees or snow coverage on the road), etc.A presentation in the workshop would allow us to discusseven more potential application scenarios.
2. CONCLUSIONThe“individual behavior enhancing”add-on of vehicles of-
fers huge chances to improve driving efficiency, safety, etc.In particular, it is expected that sort of collective under-standing of the traffic situation together with a concertedbehavior modification of cars’ should have the potential toenable improvements such as lowering global fuel consump-tion or CO2 emission, reducing traveling times, or increasingdriving experience and pleasure. Achieved could this by akind of “collective brain” gathering neural input from all thedrivers in a common area of interest and featuring commondecision making and negotiation on the route or lane takenby each individual driver within the collective...
3. REFERENCES[1] H. Bersini. My vision on “fundamentals of collective adaptive
systems”. Universite Libre de Bruxelles (IRIDIA), page 2,January 2010.
[2] H. Bersini and C. Philemotte. Emergent phenomena onlybelong to biology. In Proceedings of the 9th Europeanconference on Advances in artificial life, ECAL’07, pages53–62, Berlin, Heidelberg, 2007. Springer-Verlag.
[3] A. Riener. Driver-vehicle confluence or How to control yourcar in future? In 4th International Conference onAutomotive User Interfaces and Interactive VehicularApplications (AutomotiveUI’12), October 17-19,Portsmouth, NH, USA, page 8. ACM, October 2012.
[4] A. Riener and A. Ferscha. Enhancing Future Mass ICT withSocial Capabilities. In E. Mitleton-Kelly, editor,Co-evolution of Intelligent Socio-technical Systems,Understanding Complex Systems, pages 141–184. SpringerBerlin Heidelberg, 2013.
[5] N. Serbedzja. Privacy in Emerging Pervasive Systems. InThe 3rd International PERADA-ASSYST Summer Schoolon Adaptive Socio-Technical Pervasive Systems, Budapest.Fraunhofer FIRST, Berlin, Germany, September 20–27 2010.[Online].

87
Adjunct Proceedings of the 5th International Conference on Automotive User Interfaces and Interactive Vehicular Applications (AutomotiveUI ‚13), October 28–30, 2013, Eindhoven, The Netherlands.
Reviewer appreciation
We very much appreciate and warmly thank many people who have worked to make this workshop possible. We recognize and appreciate all the work the Technical Program Committee members and additional expert reviewers put in to promote the conference, review papers, and select the work that composes these proceedings. In addition, this workshop’s chairs appreciate the support from the Technical University Eindhoven and the AutoUI workshop chairs.
Ashad Kabir Swinburne University of Technology AustraliaRonald Schroeter QUT AustraliaMonika Mitrevska DFKI GermanyVedran Podobnik University of Zagreb CroatiaRabindra Ratan Michigan State University United StatesHelen Harris Google US United StatesBruce Walker Georgia Tech Sonification Lab United StatesMelanie Lamara BMW Research and Technology GermanyMichael Doering Robert Bosch GmbH, Corporate Research GermanyRod McCall University of Luxembourg LuxembourgJu-Hwan Lee Korean German Institute of Technology Korea, Republic OfJennifer Healey Intel Labs United States


Work in Progress

90
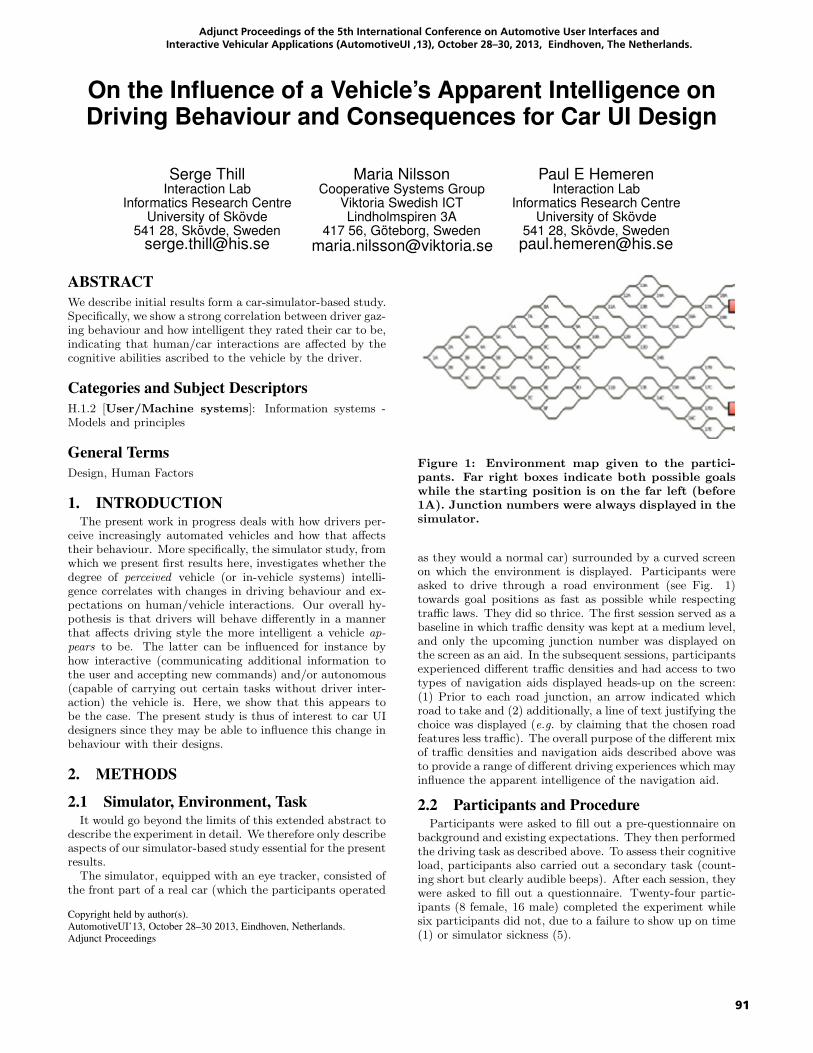
91
Adjunct Proceedings of the 5th International Conference on Automotive User Interfaces and Interactive Vehicular Applications (AutomotiveUI ‚13), October 28–30, 2013, Eindhoven, The Netherlands.
On the Influence of a Vehicle’s Apparent Intelligence onDriving Behaviour and Consequences for Car UI Design
Serge ThillInteraction Lab
Informatics Research CentreUniversity of Skövde
541 28, Skövde, [email protected]
Maria NilssonCooperative Systems Group
Viktoria Swedish ICTLindholmspiren 3A
417 56, Göteborg, Sweden
Paul E HemerenInteraction Lab
Informatics Research CentreUniversity of Skövde
541 28, Skövde, [email protected]
ABSTRACT
We describe initial results form a car-simulator-based study.Specifically, we show a strong correlation between driver gaz-ing behaviour and how intelligent they rated their car to be,indicating that human/car interactions are affected by thecognitive abilities ascribed to the vehicle by the driver.
Categories and Subject Descriptors
H.1.2 [User/Machine systems]: Information systems -Models and principles
General Terms
Design, Human Factors
1. INTRODUCTIONThe present work in progress deals with how drivers per-
ceive increasingly automated vehicles and how that affectstheir behaviour. More specifically, the simulator study, fromwhich we present first results here, investigates whether thedegree of perceived vehicle (or in-vehicle systems) intelli-gence correlates with changes in driving behaviour and ex-pectations on human/vehicle interactions. Our overall hy-pothesis is that drivers will behave differently in a mannerthat affects driving style the more intelligent a vehicle ap-
pears to be. The latter can be influenced for instance byhow interactive (communicating additional information tothe user and accepting new commands) and/or autonomous(capable of carrying out certain tasks without driver inter-action) the vehicle is. Here, we show that this appears tobe the case. The present study is thus of interest to car UIdesigners since they may be able to influence this change inbehaviour with their designs.
2. METHODS
2.1 Simulator, Environment, TaskIt would go beyond the limits of this extended abstract to
describe the experiment in detail. We therefore only describeaspects of our simulator-based study essential for the presentresults.
The simulator, equipped with an eye tracker, consisted ofthe front part of a real car (which the participants operated
Copyright held by author(s).
AutomotiveUI’13, October 28–30 2013, Eindhoven, Netherlands.
Adjunct Proceedings
Figure 1: Environment map given to the partici-pants. Far right boxes indicate both possible goalswhile the starting position is on the far left (before1A). Junction numbers were always displayed in thesimulator.
as they would a normal car) surrounded by a curved screenon which the environment is displayed. Participants wereasked to drive through a road environment (see Fig. 1)towards goal positions as fast as possible while respectingtraffic laws. They did so thrice. The first session served as abaseline in which traffic density was kept at a medium level,and only the upcoming junction number was displayed onthe screen as an aid. In the subsequent sessions, participantsexperienced different traffic densities and had access to twotypes of navigation aids displayed heads-up on the screen:(1) Prior to each road junction, an arrow indicated whichroad to take and (2) additionally, a line of text justifying thechoice was displayed (e.g. by claiming that the chosen roadfeatures less traffic). The overall purpose of the different mixof traffic densities and navigation aids described above wasto provide a range of different driving experiences which mayinfluence the apparent intelligence of the navigation aid.
2.2 Participants and ProcedureParticipants were asked to fill out a pre-questionnaire on
background and existing expectations. They then performedthe driving task as described above. To assess their cognitiveload, participants also carried out a secondary task (count-ing short but clearly audible beeps). After each session, theywere asked to fill out a questionnaire. Twenty-four partic-ipants (8 female, 16 male) completed the experiment whilesix participants did not, due to a failure to show up on time(1) or simulator sickness (5).
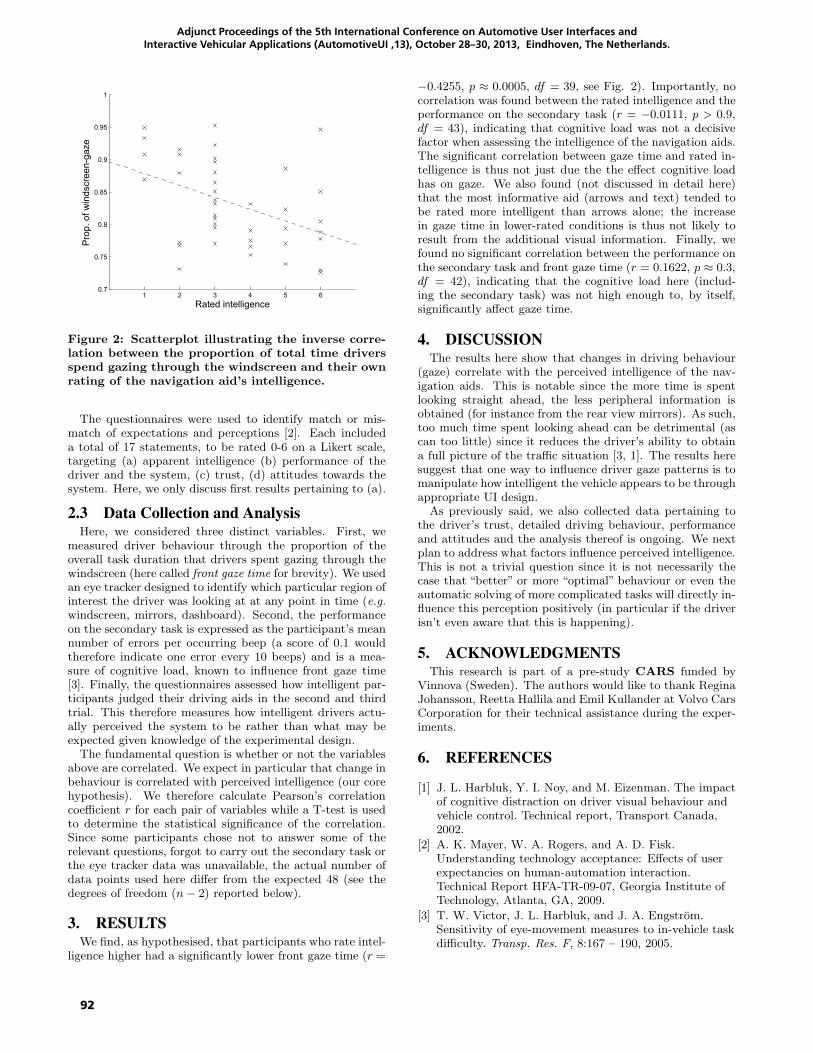
92
Adjunct Proceedings of the 5th International Conference on Automotive User Interfaces and Interactive Vehicular Applications (AutomotiveUI ‚13), October 28–30, 2013, Eindhoven, The Netherlands.
1 2 3 4 5 60.7
0.75
0.8
0.85
0.9
0.95
1
Rated intelligence
Pro
p. o
f win
dscr
een-
gaze
Figure 2: Scatterplot illustrating the inverse corre-lation between the proportion of total time driversspend gazing through the windscreen and their ownrating of the navigation aid’s intelligence.
The questionnaires were used to identify match or mis-match of expectations and perceptions [2]. Each includeda total of 17 statements, to be rated 0-6 on a Likert scale,targeting (a) apparent intelligence (b) performance of thedriver and the system, (c) trust, (d) attitudes towards thesystem. Here, we only discuss first results pertaining to (a).
2.3 Data Collection and AnalysisHere, we considered three distinct variables. First, we
measured driver behaviour through the proportion of theoverall task duration that drivers spent gazing through thewindscreen (here called front gaze time for brevity). We usedan eye tracker designed to identify which particular region ofinterest the driver was looking at at any point in time (e.g.windscreen, mirrors, dashboard). Second, the performanceon the secondary task is expressed as the participant’s meannumber of errors per occurring beep (a score of 0.1 wouldtherefore indicate one error every 10 beeps) and is a mea-sure of cognitive load, known to influence front gaze time[3]. Finally, the questionnaires assessed how intelligent par-ticipants judged their driving aids in the second and thirdtrial. This therefore measures how intelligent drivers actu-ally perceived the system to be rather than what may beexpected given knowledge of the experimental design.
The fundamental question is whether or not the variablesabove are correlated. We expect in particular that change inbehaviour is correlated with perceived intelligence (our corehypothesis). We therefore calculate Pearson’s correlationcoefficient r for each pair of variables while a T-test is usedto determine the statistical significance of the correlation.Since some participants chose not to answer some of therelevant questions, forgot to carry out the secondary task orthe eye tracker data was unavailable, the actual number ofdata points used here differ from the expected 48 (see thedegrees of freedom (n− 2) reported below).
3. RESULTSWe find, as hypothesised, that participants who rate intel-
ligence higher had a significantly lower front gaze time (r =
−0.4255, p ≈ 0.0005, df = 39, see Fig. 2). Importantly, nocorrelation was found between the rated intelligence and theperformance on the secondary task (r = −0.0111, p > 0.9,df = 43), indicating that cognitive load was not a decisivefactor when assessing the intelligence of the navigation aids.The significant correlation between gaze time and rated in-telligence is thus not just due the the effect cognitive loadhas on gaze. We also found (not discussed in detail here)that the most informative aid (arrows and text) tended tobe rated more intelligent than arrows alone; the increasein gaze time in lower-rated conditions is thus not likely toresult from the additional visual information. Finally, wefound no significant correlation between the performance onthe secondary task and front gaze time (r = 0.1622, p ≈ 0.3,df = 42), indicating that the cognitive load here (includ-ing the secondary task) was not high enough to, by itself,significantly affect gaze time.
4. DISCUSSIONThe results here show that changes in driving behaviour
(gaze) correlate with the perceived intelligence of the nav-igation aids. This is notable since the more time is spentlooking straight ahead, the less peripheral information isobtained (for instance from the rear view mirrors). As such,too much time spent looking ahead can be detrimental (ascan too little) since it reduces the driver’s ability to obtaina full picture of the traffic situation [3, 1]. The results heresuggest that one way to influence driver gaze patterns is tomanipulate how intelligent the vehicle appears to be throughappropriate UI design.
As previously said, we also collected data pertaining tothe driver’s trust, detailed driving behaviour, performanceand attitudes and the analysis thereof is ongoing. We nextplan to address what factors influence perceived intelligence.This is not a trivial question since it is not necessarily thecase that “better” or more “optimal” behaviour or even theautomatic solving of more complicated tasks will directly in-fluence this perception positively (in particular if the driverisn’t even aware that this is happening).
5. ACKNOWLEDGMENTSThis research is part of a pre-study CARS funded by
Vinnova (Sweden). The authors would like to thank ReginaJohansson, Reetta Hallila and Emil Kullander at Volvo CarsCorporation for their technical assistance during the exper-iments.
6. REFERENCES
[1] J. L. Harbluk, Y. I. Noy, and M. Eizenman. The impactof cognitive distraction on driver visual behaviour andvehicle control. Technical report, Transport Canada,2002.
[2] A. K. Mayer, W. A. Rogers, and A. D. Fisk.Understanding technology acceptance: Effects of userexpectancies on human-automation interaction.Technical Report HFA-TR-09-07, Georgia Institute ofTechnology, Atlanta, GA, 2009.
[3] T. W. Victor, J. L. Harbluk, and J. A. Engstrom.Sensitivity of eye-movement measures to in-vehicle taskdifficulty. Transp. Res. F, 8:167 – 190, 2005.
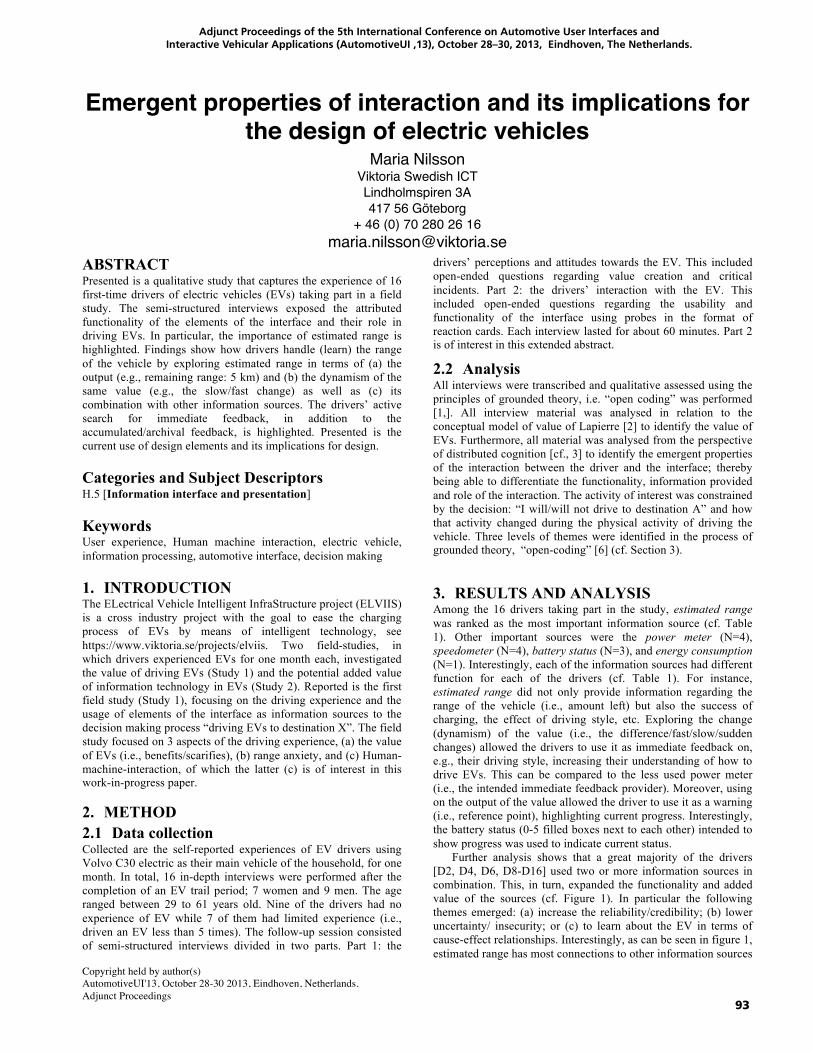
93
Adjunct Proceedings of the 5th International Conference on Automotive User Interfaces and Interactive Vehicular Applications (AutomotiveUI ‚13), October 28–30, 2013, Eindhoven, The Netherlands.
Copyright held by author(s) AutomotiveUI'13, October 28-30 2013, Eindhoven, Netherlands. Adjunct Proceedings
Emergent properties of interaction and its implications for the design of electric vehicles
Maria Nilsson Viktoria Swedish ICT Lindholmspiren 3A 417 56 Göteborg
+ 46 (0) 70 280 26 16 [email protected]
ABSTRACT Presented is a qualitative study that captures the experience of 16 first-time drivers of electric vehicles (EVs) taking part in a field study. The semi-structured interviews exposed the attributed functionality of the elements of the interface and their role in driving EVs. In particular, the importance of estimated range is highlighted. Findings show how drivers handle (learn) the range of the vehicle by exploring estimated range in terms of (a) the output (e.g., remaining range: 5 km) and (b) the dynamism of the same value (e.g., the slow/fast change) as well as (c) its combination with other information sources. The drivers’ active search for immediate feedback, in addition to the accumulated/archival feedback, is highlighted. Presented is the current use of design elements and its implications for design.
Categories and Subject Descriptors H.5 [Information interface and presentation]
Keywords User experience, Human machine interaction, electric vehicle, information processing, automotive interface, decision making
1. INTRODUCTION The ELectrical Vehicle Intelligent InfraStructure project (ELVIIS) is a cross industry project with the goal to ease the charging process of EVs by means of intelligent technology, see https://www.viktoria.se/projects/elviis. Two field-studies, in which drivers experienced EVs for one month each, investigated the value of driving EVs (Study 1) and the potential added value of information technology in EVs (Study 2). Reported is the first field study (Study 1), focusing on the driving experience and the usage of elements of the interface as information sources to the decision making process “driving EVs to destination X”. The field study focused on 3 aspects of the driving experience, (a) the value of EVs (i.e., benefits/scarifies), (b) range anxiety, and (c) Human-machine-interaction, of which the latter (c) is of interest in this work-in-progress paper.
2. METHOD 2.1 Data collection Collected are the self-reported experiences of EV drivers using Volvo C30 electric as their main vehicle of the household, for one month. In total, 16 in-depth interviews were performed after the completion of an EV trail period; 7 women and 9 men. The age ranged between 29 to 61 years old. Nine of the drivers had no experience of EV while 7 of them had limited experience (i.e., driven an EV less than 5 times). The follow-up session consisted of semi-structured interviews divided in two parts. Part 1: the
drivers’ perceptions and attitudes towards the EV. This included open-ended questions regarding value creation and critical incidents. Part 2: the drivers’ interaction with the EV. This included open-ended questions regarding the usability and functionality of the interface using probes in the format of reaction cards. Each interview lasted for about 60 minutes. Part 2 is of interest in this extended abstract.
2.2 Analysis All interviews were transcribed and qualitative assessed using the principles of grounded theory, i.e. “open coding” was performed [1,]. All interview material was analysed in relation to the conceptual model of value of Lapierre [2] to identify the value of EVs. Furthermore, all material was analysed from the perspective of distributed cognition [cf., 3] to identify the emergent properties of the interaction between the driver and the interface; thereby being able to differentiate the functionality, information provided and role of the interaction. The activity of interest was constrained by the decision: “I will/will not drive to destination A” and how that activity changed during the physical activity of driving the vehicle. Three levels of themes were identified in the process of grounded theory, “open-coding” [6] (cf. Section 3).
3. RESULTS AND ANALYSIS Among the 16 drivers taking part in the study, estimated range was ranked as the most important information source (cf. Table 1). Other important sources were the power meter (N=4), speedometer (N=4), battery status (N=3), and energy consumption (N=1). Interestingly, each of the information sources had different function for each of the drivers (cf. Table 1). For instance, estimated range did not only provide information regarding the range of the vehicle (i.e., amount left) but also the success of charging, the effect of driving style, etc. Exploring the change (dynamism) of the value (i.e., the difference/fast/slow/sudden changes) allowed the drivers to use it as immediate feedback on, e.g., their driving style, increasing their understanding of how to drive EVs. This can be compared to the less used power meter (i.e., the intended immediate feedback provider). Moreover, using on the output of the value allowed the driver to use it as a warning (i.e., reference point), highlighting current progress. Interestingly, the battery status (0-5 filled boxes next to each other) intended to show progress was used to indicate current status.
Further analysis shows that a great majority of the drivers [D2, D4, D6, D8-D16] used two or more information sources in combination. This, in turn, expanded the functionality and added value of the sources (cf. Figure 1). In particular the following themes emerged: (a) increase the reliability/credibility; (b) lower uncertainty/ insecurity; or (c) to learn about the EV in terms of cause-effect relationships. Interestingly, as can be seen in figure 1, estimated range has most connections to other information sources
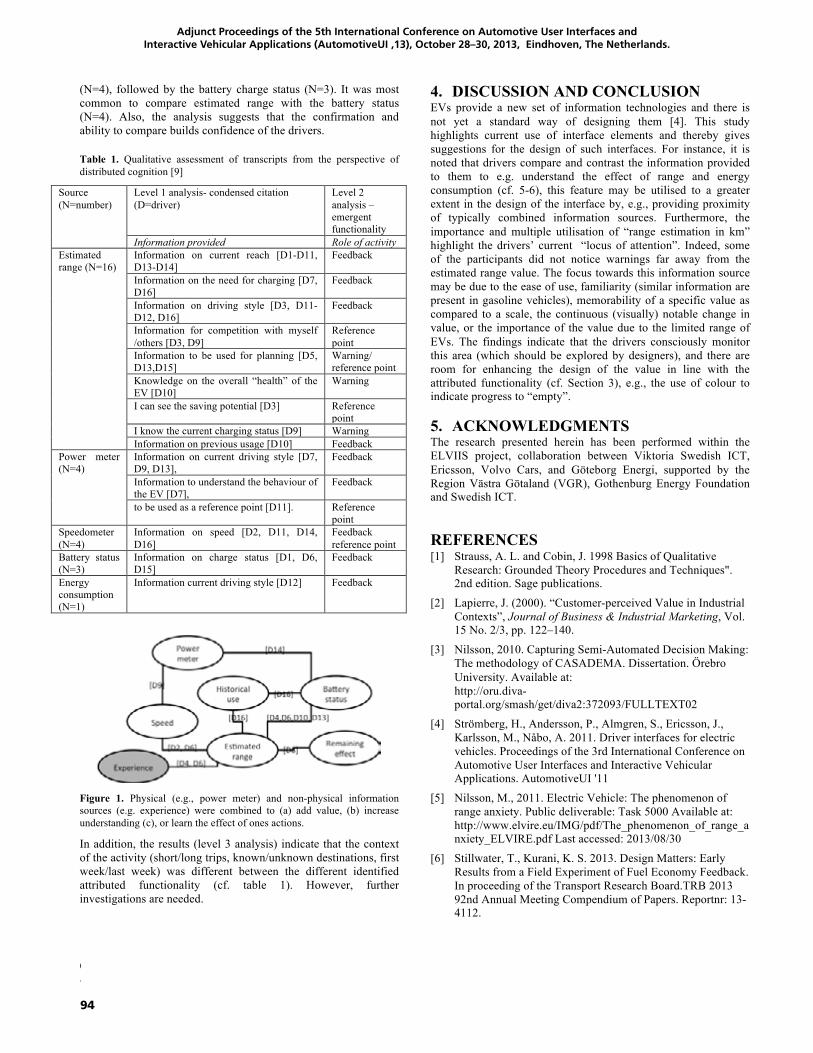
94
Adjunct Proceedings of the 5th International Conference on Automotive User Interfaces and Interactive Vehicular Applications (AutomotiveUI ‚13), October 28–30, 2013, Eindhoven, The Netherlands.
Copyright held by author(s) AutomotiveUI'13, October 28-30 2013, Eindhoven, Netherlands. Adjunct Proceedings
(N=4), followed by the battery charge status (N=3). It was most common to compare estimated range with the battery status (N=4). Also, the analysis suggests that the confirmation and ability to compare builds confidence of the drivers.
Table 1. Qualitative assessment of transcripts from the perspective of distributed cognition [9]
Source (N=number)
Level 1 analysis- condensed citation (D=driver)
Level 2 analysis – emergent functionality
Information provided Role of activity Estimated range (N=16)
Information on current reach [D1-D11, D13-D14]
Feedback
Information on the need for charging [D7, D16]
Feedback
Information on driving style [D3, D11-D12, D16]
Feedback
Information for competition with myself /others [D3, D9]
Reference point
Information to be used for planning [D5, D13,D15]
Warning/ reference point
Knowledge on the overall “health” of the EV [D10]
Warning
I can see the saving potential [D3] Reference point
I know the current charging status [D9] Warning Information on previous usage [D10] Feedback
Power meter (N=4)
Information on current driving style [D7, D9, D13],
Feedback
Information to understand the behaviour of the EV [D7],
Feedback
to be used as a reference point [D11].
Reference point
Speedometer (N=4)
Information on speed [D2, D11, D14, D16]
Feedback reference point
Battery status (N=3)
Information on charge status [D1, D6, D15]
Feedback
Energy consumption (N=1)
Information current driving style [D12] Feedback
Figure 1. Physical (e.g., power meter) and non-physical information sources (e.g. experience) were combined to (a) add value, (b) increase understanding (c), or learn the effect of ones actions.
In addition, the results (level 3 analysis) indicate that the context of the activity (short/long trips, known/unknown destinations, first week/last week) was different between the different identified attributed functionality (cf. table 1). However, further investigations are needed.
4. DISCUSSION AND CONCLUSION EVs provide a new set of information technologies and there is not yet a standard way of designing them [4]. This study highlights current use of interface elements and thereby gives suggestions for the design of such interfaces. For instance, it is noted that drivers compare and contrast the information provided to them to e.g. understand the effect of range and energy consumption (cf. 5-6), this feature may be utilised to a greater extent in the design of the interface by, e.g., providing proximity of typically combined information sources. Furthermore, the importance and multiple utilisation of “range estimation in km” highlight the drivers’ current “locus of attention”. Indeed, some of the participants did not notice warnings far away from the estimated range value. The focus towards this information source may be due to the ease of use, familiarity (similar information are present in gasoline vehicles), memorability of a specific value as compared to a scale, the continuous (visually) notable change in value, or the importance of the value due to the limited range of EVs. The findings indicate that the drivers consciously monitor this area (which should be explored by designers), and there are room for enhancing the design of the value in line with the attributed functionality (cf. Section 3), e.g., the use of colour to indicate progress to “empty”.
5. ACKNOWLEDGMENTS The research presented herein has been performed within the ELVIIS project, collaboration between Viktoria Swedish ICT, Ericsson, Volvo Cars, and Göteborg Energi, supported by the Region Västra Götaland (VGR), Gothenburg Energy Foundation and Swedish ICT.
REFERENCES [1] Strauss, A. L. and Cobin, J. 1998 Basics of Qualitative
Research: Grounded Theory Procedures and Techniques". 2nd edition. Sage publications.
[2] Lapierre, J. (2000). “Customer-perceived Value in Industrial Contexts”, Journal of Business & Industrial Marketing, Vol. 15 No. 2/3, pp. 122–140.
[3] Nilsson, 2010. Capturing Semi-Automated Decision Making: The methodology of CASADEMA. Dissertation. Örebro University. Available at: http://oru.diva-portal.org/smash/get/diva2:372093/FULLTEXT02
[4] Strömberg, H., Andersson, P., Almgren, S., Ericsson, J., Karlsson, M., Nåbo, A. 2011. Driver interfaces for electric vehicles. Proceedings of the 3rd International Conference on Automotive User Interfaces and Interactive Vehicular Applications. AutomotiveUI '11
[5] Nilsson, M., 2011. Electric Vehicle: The phenomenon of range anxiety. Public deliverable: Task 5000 Available at: http://www.elvire.eu/IMG/pdf/The_phenomenon_of_range_anxiety_ELVIRE.pdf Last accessed: 2013/08/30
[6] Stillwater, T., Kurani, K. S. 2013. Design Matters: Early Results from a Field Experiment of Fuel Economy Feedback. In proceeding of the Transport Research Board.TRB 2013 92nd Annual Meeting Compendium of Papers. Reportnr: 13-4112.
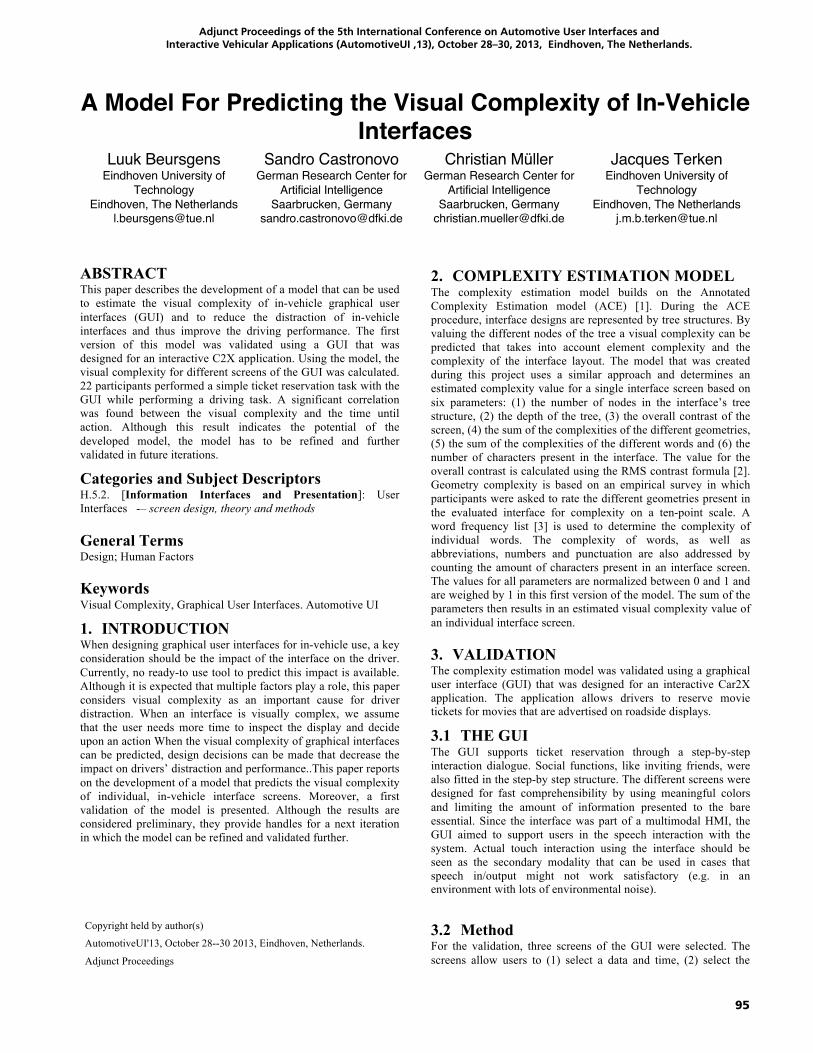
95
Adjunct Proceedings of the 5th International Conference on Automotive User Interfaces and Interactive Vehicular Applications (AutomotiveUI ‚13), October 28–30, 2013, Eindhoven, The Netherlands.
A Model For Predicting the Visual Complexity of In-Vehicle Interfaces
Luuk Beursgens Eindhoven University of
Technology Eindhoven, The Netherlands
Sandro Castronovo German Research Center for
Artificial Intelligence Saarbrucken, Germany
Christian Müller German Research Center for
Artificial Intelligence Saarbrucken, Germany
Jacques Terken Eindhoven University of
Technology Eindhoven, The Netherlands
ABSTRACT This paper describes the development of a model that can be used to estimate the visual complexity of in-vehicle graphical user interfaces (GUI) and to reduce the distraction of in-vehicle interfaces and thus improve the driving performance. The first version of this model was validated using a GUI that was designed for an interactive C2X application. Using the model, the visual complexity for different screens of the GUI was calculated. 22 participants performed a simple ticket reservation task with the GUI while performing a driving task. A significant correlation was found between the visual complexity and the time until action. Although this result indicates the potential of the developed model, the model has to be refined and further validated in future iterations.
Categories and Subject Descriptors H.5.2. [Information Interfaces and Presentation]: User Interfaces -– screen design, theory and methods
General Terms Design; Human Factors
Keywords Visual Complexity, Graphical User Interfaces. Automotive UI 1. INTRODUCTION When designing graphical user interfaces for in-vehicle use, a key consideration should be the impact of the interface on the driver. Currently, no ready-to use tool to predict this impact is available. Although it is expected that multiple factors play a role, this paper considers visual complexity as an important cause for driver distraction. When an interface is visually complex, we assume that the user needs more time to inspect the display and decide upon an action When the visual complexity of graphical interfaces can be predicted, design decisions can be made that decrease the impact on drivers’ distraction and performance..This paper reports on the development of a model that predicts the visual complexity of individual, in-vehicle interface screens. Moreover, a first validation of the model is presented. Although the results are considered preliminary, they provide handles for a next iteration in which the model can be refined and validated further.
2. COMPLEXITY ESTIMATION MODEL The complexity estimation model builds on the Annotated Complexity Estimation model (ACE) [1]. During the ACE procedure, interface designs are represented by tree structures. By valuing the different nodes of the tree a visual complexity can be predicted that takes into account element complexity and the complexity of the interface layout. The model that was created during this project uses a similar approach and determines an estimated complexity value for a single interface screen based on six parameters: (1) the number of nodes in the interface’s tree structure, (2) the depth of the tree, (3) the overall contrast of the screen, (4) the sum of the complexities of the different geometries, (5) the sum of the complexities of the different words and (6) the number of characters present in the interface. The value for the overall contrast is calculated using the RMS contrast formula [2]. Geometry complexity is based on an empirical survey in which participants were asked to rate the different geometries present in the evaluated interface for complexity on a ten-point scale. A word frequency list [3] is used to determine the complexity of individual words. The complexity of words, as well as abbreviations, numbers and punctuation are also addressed by counting the amount of characters present in an interface screen. The values for all parameters are normalized between 0 and 1 and are weighed by 1 in this first version of the model. The sum of the parameters then results in an estimated visual complexity value of an individual interface screen.
3. VALIDATION The complexity estimation model was validated using a graphical user interface (GUI) that was designed for an interactive Car2X application. The application allows drivers to reserve movie tickets for movies that are advertised on roadside displays.
3.1 THE GUI The GUI supports ticket reservation through a step-by-step interaction dialogue. Social functions, like inviting friends, were also fitted in the step-by step structure. The different screens were designed for fast comprehensibility by using meaningful colors and limiting the amount of information presented to the bare essential. Since the interface was part of a multimodal HMI, the GUI aimed to support users in the speech interaction with the system. Actual touch interaction using the interface should be seen as the secondary modality that can be used in cases that speech in/output might not work satisfactory (e.g. in an environment with lots of environmental noise).
3.2 Method For the validation, three screens of the GUI were selected. The screens allow users to (1) select a data and time, (2) select the
Copyright held by author(s)
AutomotiveUI'13, October 28--30 2013, Eindhoven, Netherlands.
Adjunct Proceedings
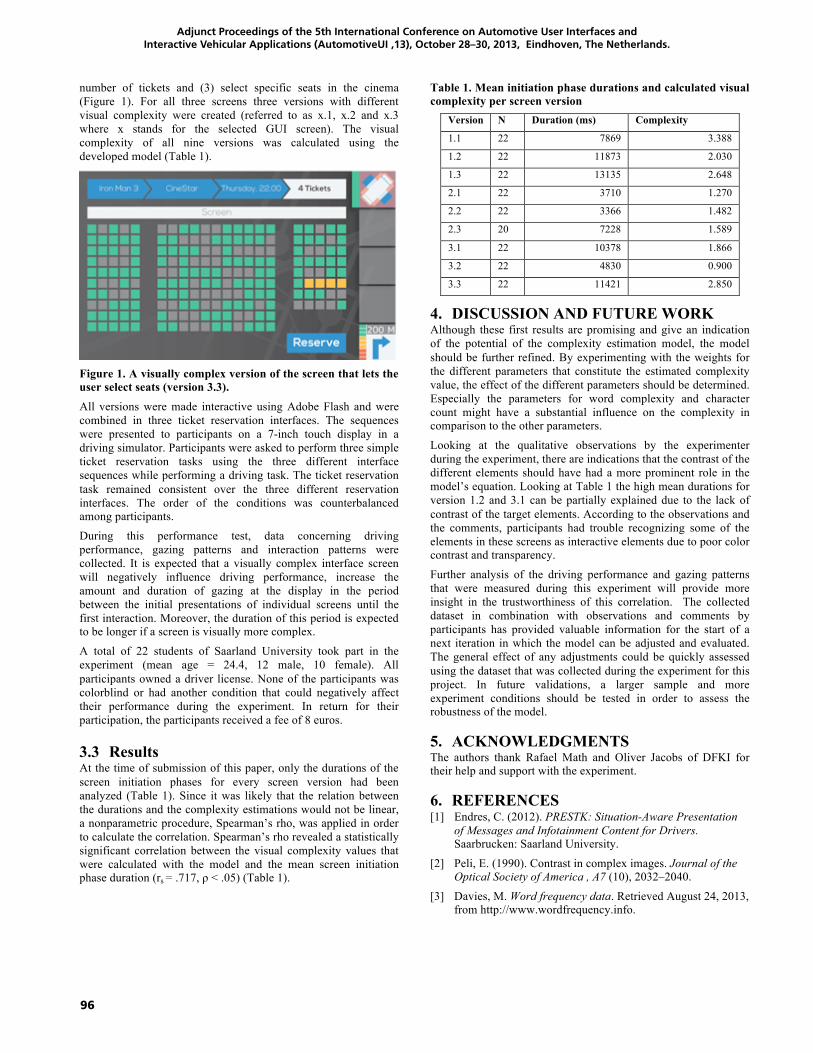
96
Adjunct Proceedings of the 5th International Conference on Automotive User Interfaces and Interactive Vehicular Applications (AutomotiveUI ‚13), October 28–30, 2013, Eindhoven, The Netherlands.
number of tickets and (3) select specific seats in the cinema (Figure 1). For all three screens three versions with different visual complexity were created (referred to as x.1, x.2 and x.3 where x stands for the selected GUI screen). The visual complexity of all nine versions was calculated using the developed model (Table 1).
Figure 1. A visually complex version of the screen that lets the user select seats (version 3.3). All versions were made interactive using Adobe Flash and were combined in three ticket reservation interfaces. The sequences were presented to participants on a 7-inch touch display in a driving simulator. Participants were asked to perform three simple ticket reservation tasks using the three different interface sequences while performing a driving task. The ticket reservation task remained consistent over the three different reservation interfaces. The order of the conditions was counterbalanced among participants.
During this performance test, data concerning driving performance, gazing patterns and interaction patterns were collected. It is expected that a visually complex interface screen will negatively influence driving performance, increase the amount and duration of gazing at the display in the period between the initial presentations of individual screens until the first interaction. Moreover, the duration of this period is expected to be longer if a screen is visually more complex.
A total of 22 students of Saarland University took part in the experiment (mean age = 24.4, 12 male, 10 female). All participants owned a driver license. None of the participants was colorblind or had another condition that could negatively affect their performance during the experiment. In return for their participation, the participants received a fee of 8 euros.
3.3 Results At the time of submission of this paper, only the durations of the screen initiation phases for every screen version had been analyzed (Table 1). Since it was likely that the relation between the durations and the complexity estimations would not be linear, a nonparametric procedure, Spearman’s rho, was applied in order to calculate the correlation. Spearman’s rho revealed a statistically significant correlation between the visual complexity values that were calculated with the model and the mean screen initiation phase duration (rs = .717, ρ < .05) (Table 1).
Table 1. Mean initiation phase durations and calculated visual complexity per screen version
Version N Duration (ms) Complexity
1.1 22 7869 3.388
1.2 22 11873 2.030
1.3 22 13135 2.648
2.1 22 3710 1.270
2.2 22 3366 1.482
2.3 20 7228 1.589
3.1 22 10378 1.866
3.2 22 4830 0.900
3.3 22 11421 2.850
4. DISCUSSION AND FUTURE WORK Although these first results are promising and give an indication of the potential of the complexity estimation model, the model should be further refined. By experimenting with the weights for the different parameters that constitute the estimated complexity value, the effect of the different parameters should be determined. Especially the parameters for word complexity and character count might have a substantial influence on the complexity in comparison to the other parameters.
Looking at the qualitative observations by the experimenter during the experiment, there are indications that the contrast of the different elements should have had a more prominent role in the model’s equation. Looking at Table 1 the high mean durations for version 1.2 and 3.1 can be partially explained due to the lack of contrast of the target elements. According to the observations and the comments, participants had trouble recognizing some of the elements in these screens as interactive elements due to poor color contrast and transparency.
Further analysis of the driving performance and gazing patterns that were measured during this experiment will provide more insight in the trustworthiness of this correlation. The collected dataset in combination with observations and comments by participants has provided valuable information for the start of a next iteration in which the model can be adjusted and evaluated. The general effect of any adjustments could be quickly assessed using the dataset that was collected during the experiment for this project. In future validations, a larger sample and more experiment conditions should be tested in order to assess the robustness of the model.
5. ACKNOWLEDGMENTS The authors thank Rafael Math and Oliver Jacobs of DFKI for their help and support with the experiment.
6. REFERENCES [1] Endres, C. (2012). PRESTK: Situation-Aware Presentation
of Messages and Infotainment Content for Drivers. Saarbrucken: Saarland University.
[2] Peli, E. (1990). Contrast in complex images. Journal of the Optical Society of America , A7 (10), 2032–2040.
[3] Davies, M. Word frequency data. Retrieved August 24, 2013, from http://www.wordfrequency.info.
97
Adjunct Proceedings of the 5th International Conference on Automotive User Interfaces and Interactive Vehicular Applications (AutomotiveUI ‚13), October 28–30, 2013, Eindhoven, The Netherlands.
Detection of Drivers’ Incidental and Integral Affect Using Physiological Measures
Samantha Jansen Wichita State University 1845 Fairmount Box 34
Wichita, KS 67260 [email protected]
Abbey Westphal, Myounghoon Jeon
Michigan Technological University 1400 Townsend Dr. Harold Meese Ctr.
Houghton, MI 49931 [email protected]
Andreas Riener Institute for Pervasive Computing Johannes Kepler University Linz
Altenberger St 69, 4040 Linz, Austria [email protected]
ABSTRACT This paper discusses the initial findings of an on-going study to determine the affective state of the driver using physiological measures. Incidental (writing past experiences) and integral (hazard events while driving) anger were induced and heart rate was measured throughout the simulated driving experiment. This exploratory study shows the possibility that average heart rate (i.e., beats per minute) can be used to detect both incidental and integral anger, respectively. Future research is planned to determine if the patterns of data fusion can be used by in-vehicle systems to identify specific emotions of the driver and offer counteractive feedback to reduce potential driving errors.
Categories and Subject Descriptors J.4 [Computer Application]: Social and Behavioral Sciences–Psychology
General Terms Measurement, Design, Human Factors
Keywords Affect, Driving Simulation, Emotion, Physiological Measurement
1. INTRODUCTION It is understood that a driver experiences an array of emotions while driving; an example is that angry driving and road rage can decrease driving performance most seriously [e.g., 2, 8]. Recent literature [6] confirms that angry drivers made more driving errors than fearful drivers, which demonstrates that emotions of the same negative valence (i.e., anger and fear) could result in different driving performance. Such emotions (e.g., anger) can be experienced incidentally or integrally [1], meaning that the source of the emotion is either unrelated (e.g., fighting before driving) or related to the primary task (e.g., tailgating while driving).
Researchers have sought to detect emotions for drivers using speech detection or facial detection [e.g., 7, 10]. However, physiological measures have typically been used to monitor drivers’ mental workload [e.g., 9], but rarely used to detect drivers’ emotions. This study is part of a larger project to develop a real-time emotion detection and regulation system for various drivers. Ultimately, we aim to implement such a system based on data fusion (i.e., integration of autonomic measures, startle response magnitude, brain states, and behavioral measures). The current phase explored the idea that physiological measures (e.g., heart rate, respiration, etc.) could be used to determine the driver’s current emotional state and potentially differentiate between incidental and integral affect. The present paper concentrates on
the result of heart rate data with induced anger. The results of this study are expected to help develop an in-vehicle system to determine the driver’s emotional state and provide multimodal feedback to reduce potential driving errors associated with such affect.
2. METHOD 2.1 Participants Ten students, 6 females and 4 males, participated in this study for partial credit in their psychology course. Students ranged between 19 and 39 years of age (median years of age = 21, SD = 6) and had at least 3 years of driving experience (median years driving = 6, SD = 6) with a valid driver’s license.
2.2 Apparatuses The BioPac Student Lab PRO® electrocardiogram (ECG) hardware was used to obtain average heart rate (i.e., beats per minute (BPM)) before and during simulated driving. A modified 3-lead ECG sensor set-up was used to obtain the average BPM. Sensors were placed on the participant’s chest as opposed to the limbs to help reduce output noise due to physical movement. We used a quarter cab version of National Advanced Driving Simulator’s MiniSim version 1.8.3.31.
2.3 Procedure After completing a consent form, participants were screened for simulation sickness. If the participant was prone to simulation sickness, the experiment ended and the participant was debriefed. If the participant was not prone to simulation sickness, they were asked to rate their affective state using a seven-point Likert scale [5]. The ECG sensors were then placed on the participant and they remained still, for 5 minutes to obtain their average resting BPM (e.g., baseline BPM). Following baseline BPM measurements, incidental affect induction took place. To induce anger, participants were asked to write about a past experience, that they could vividly revisit, in which they became angry. Prior to writing, the participant read two example paragraphs, which described two situations where a person became angry, including a driving-related example [6]. After writing, the participant rated their current affective states and completed a general driving and risk perception questionnaire [e.g., 3]. Next, the participant drove approximately 12 minutes in the driving simulator, which included 9 hazard events (e.g., car swerving into their lane, deer in the road, pedestrian running into the street). After driving the participants rated their affective states for the third time and completed an electronic version of the NASA-TLX [4]. After completing a demographics survey, they were debriefed. 1 See (http://www.nads-sc.uiowa.edu/minisim/) for the detailed
specification. Retrieved September 25, 2013. Automotive UI’13, October 27-30, 2013, Eindhoven, The Netherlands. Copyright 2013 ACM 1-58113-000-0/00/0010 …$15.00.

98
Adjunct Proceedings of the 5th International Conference on Automotive User Interfaces and Interactive Vehicular Applications (AutomotiveUI ‚13), October 28–30, 2013, Eindhoven, The Netherlands.
3. RESULTS 3.1 Self-Rating Data The average score for each of the three anger ratings is shown in Figure 1. All ten participants’ data were used for self-rating analysis; however, three participants’ data were excluded from the physiological data analysis due to extreme noise within the data. A paired-samples t-test showed significant differences between the three anger ratings. The anger rating after induction (M = 3.20, SD = 1.23) was significantly higher than before induction (M =1.10, SD = 0.32), t(9) = -5.55, p < .001. The anger rating after the study (i.e., following driving) (M = 2.30, SD = 1.49) was also significantly higher than before induction (M = 1.10, SD = 0.32), t(9) = -2.57, p < .05. Overall, anger level increased after induction and decreased while driving; however, both anger ratings after induction and at the end of the study were significantly higher than before induction.
Figure 1. Average anger-rating scores across rating timings. Error bars indicate standard error of the mean.
3.2 Physiological Data Figure 2 shows the average heart rate (i.e., BPM) during the following events: baseline, reading, writing, driving-only, hazards one through nine. Reading and writing were assumed to induce incidental anger and hazards while driving were assumed to induce integral anger. Average heart rate increased after incidental affect induction as compared to the baseline. Moreover, all but one hazard event resulted in an increased heart rate as compared to both baseline and driving-only measurements. Specifically, the hazard 2 (motorbike) (M = 76.85, SD = 7.50) showed significantly higher BPM than the driving only (M = 71.10, SD = 7.46) t(9) = -2.77, p < .05. However, other than that, none of the heart rate differences led to the conventionally significant level, potentially attributed to a small sample size. A decrease in heart was observed during the driving-only part of the experiment. This decrease is speculated to be a result of the participant’s comfort with driving in the simulator, as writing about a past angry experience was a novel activity in comparison to previously driving in the simulator. This past simulator experience may have made the participant feel more comfortable than the novelty of writing and thus their heart rate decreased while driving-only.
4. CONCLUSION & FUTURE WORKS Overall data patterns indicate that physiological measurement (i.e., average heart rate measured in BPM) could be used to identify the affective state, anger, compared to the baseline. Further, it demonstrates the benefits of physiological measurement in detection of both incidental and integral affect, whereas the self-rating can be used to identify only incidental affect.
Figure 2. Average heart rate (BPM) at each experimental event. Error bars indicate standard error of the mean.
More detailed pattern recognition techniques will be applied to create an algorithm with which our in-vehicle assistive technology can identify the various affective states (e.g., anxiety, depression, happiness, in addition to anger) of the driver and offer intervention strategies to potentially enhance driver’s experiences and reduce driving errors. In addition to the analysis of the accompanied respiration data, planned research includes the combination of the use of multiple measures: facial detection, body posture, brainwaves, etc.
5. REFERENCES[1] Bodenhausen, G.V. (1993). Emotions, arousal, and stereotypic
judgments: A heuristic model of affect and stereotyping. In Mackie, D.M., & Hamilton, D.L. (Eds.), Affect, cognition, and stereotyping: Interactive processes in group perception, 13-37. San Diego, CA: Academic Press.
[2] Deffenbacher, J.L., Deffenbacher, D.M., Lynch, R.S., & Richards, T.L. (2003). Anger, aggression, and risky behavior: A comparison of high and low anger drivers. Behav. Research and Therapy, 41(6),701-718.
[3] Dorn, L. & Matthews, G. (1995). Prediction of mood and risk appraisals from trait measures: Two studies of simulated driving. Eur. J. Personality, 9(1), 25-42.
[4] Hart, S.G. (2006). NASA-Task Load Index (NASA-TLX); 20 years later. Hum. Fac. Erg. Soc. P., 904-908. Santa Monica: HFES.
[5] Jeon, M. & Walker, B.N. (2011). What to detect?: Analyzing factor structures of affect in driving contexts for an emotion detection and regulation system. Hum. Fac. Erg. Soc. P., 55(1) 1889-1893.
[6] Jeon, M., Yim, J.-B., & Walker, B. (2011). An angry driver is not the same as a fearful driver: Effects of specific negative emotions on risk perception, driving performance, and workload. Proc. of theAutomotiveUI, 137-140.
[7] Jones, C. and Jonsson, I.-M. (2008). Using paralinguistic cues in speech to recognise emotions in older car drivers. In: Peter, C. & Beale, R. (Eds.) Lect. Notes Comput. SC 4868, 229-240. Berlin, Heidelberg: Springer.
[8] Underwood, G., Chapman, P., Wright, S., & Crundall, D. (1999). Anger while driving. Transport. Res. F-TRAF, 2(1), 55-68.
[9] Brookhuis, K.A., & de Waard, D. (2010). Monitoring drivers’ mental workload in driving simulators using physiological measures. Accident Anal. Prev., 42(3), 898-903.
[10] Jeon, M., & Walker, B.N. (2011). Emotion detection and regulation interface for drivers with traumatic brain injury. Proc. of the ACM SIGCHI.
1
2
3
4
5
6
7
Aff
ectiv
e St
ate
Rat
ing
Scal
e
60.00
70.00
80.00
90.00
Aver
age
Hea
rt R
ate
(BPM
)
99
Adjunct Proceedings of the 5th International Conference on Automotive User Interfaces and Interactive Vehicular Applications (AutomotiveUI ‚13), October 28–30, 2013, Eindhoven, The Netherlands.
Influences of Socio-Demographic Factors, PersonalityTraits and Car Usage on Cooperative Guidance and Control
Sonja Meier, Eugen Altendorf, Marcel Baltzer, Frank FlemischInstitute of Industrial Engineering and Ergonomics, RWTH Aachen University
Bergdriesch 27Aachen, Germany
{s.meier, e.altendorf, m.baltzer, f.flemisch}@iaw.rwth-aachen.de
ABSTRACTThis article investigates the relations between di↵erent usergroups and the perception of a cooperative approach of guid-ance and control of highly automated vehicles. Results of auser study regarding the influences of user characteristics,such as personality traits, gender, education, driving expe-rience, and driving habits, on preferences for cooperativeguidance and control are reported and discussed.
Categories and Subject DescriptorsH.5.2 [Information Interfaces and Presentation]: UserInterfaces—Haptic I/O, User-centered design; H.1.2 [Models
and Principals]: User/Machine Systems—Human factors
General TermsHuman Factors, Experimentation
KeywordsUser diversity, man-machine systems, cooperative guidanceand control, highly automated, socio-demographic factors,personality traits, car usage, driving experience
1. INTRODUCTIONIn the last decades mobility gained an enormous impacton everyday life. Distances regarding commuting, businesstrips, and private obligations are continuously increasing.At the same time the user group of individual traffic is be-coming more and more heterogeneous. A user study wasconducted using a simulator to reveal the di↵erent expec-tations on cooperative guidance and control due to gender,education, personality traits, such as communicativeness oropenness, and driving experience and habits.
2. STUDYA user study was conducted in a driving simulator with ahorizontal FOV of about 80 degrees and an active sidestickas control device. The driving scene was a section of a three-lane highway with fellow cars. The cooperative guidance
Copyright held by authors.AutomotiveUI’13, October 28–30 2013, Eindhoven, Netherlands.Adjunct Proceedings
and control concept [1, 3, 5] was the H-mode [3] inspiredby the design metaphor of horse and rider [2]. H-mode is aholistic haptic-multimodal approach to cooperative guidanceand control, where the control is dynamically distributedbetween driver and automation [3, 4].
In total 20 people (10f, 10m) participated in two test se-ries. Participants were aged between 19 and 34 years withan average age of 24.5 years (SD=3.8,Mf=24.4,Mm=24.5)and held a driving license. The two-hour study included apreliminary questionnaire regarding socio-demographic data,personality traits, and car usage. The second part particu-larly aimed at user participation in the design process [4].The last part was a two-stage evaluation with a 10-minutetraining in between. The participants rated items, such asperceived safety, on a 7-point semantic di↵erential scale.The results of the preliminary questionnaire and the eval-uation after the last simulator drive are most valuable forinvestigating correlations with user groups since participantsgained high familiarity with the system. In the following thecorrelations are reported and discussed.
3. RESULTSThe data analysis revealed important correlations betweensocio-demographic data, personality traits, car usage, andthe perception of the cooperative approach of guidance andcontrol. As the number of participants was limited to 20,the results might not be representative for the overall pop-ulation but provide essential indications for further studies.The correlations were quantified using Spearman’s correla-tion coefficient, rs, and the t-test.
3.1 Socio-Demographic FactorsThe study revealed numerous correlations between gender
and the perception of the cooperative approach of guid-ance and control. Men answered the general item of theoverall perception of the approach more positive (t=1.857,p=0.08). Women rated higher on the haptic option of fluidtransition between automation levels by gripping strength(t=1.958, p=0.066). Due to small age variance no correla-tions were found whereas several e↵ects regarding educationwere revealed. Education measured by the highest edu-cational achievement correlated significantly with perceivedsafety (rs=0.461, p=0.041), perceived ease of driving, andperceived controllability of the vehicle especially due to au-tomation level transitions (rse=0.475, p=0.034; rsc=0.530,p=0.016), although there were no correlations for subjec-tively perceived learnability and ease of system use.
100
Adjunct Proceedings of the 5th International Conference on Automotive User Interfaces and Interactive Vehicular Applications (AutomotiveUI ‚13), October 28–30, 2013, Eindhoven, The Netherlands.
3.2 Personality TraitsThe personality traits were rated on a 5-point Likert scale.Communicativeness and openness – defined as average of theitems general openness for new experiences and the highlysignificantly correlating item open-mindedness for new tech-nical developments (rs=0.728, p=0.000) – showed the mostinteresting influences on the evaluation of the approach ofcooperative guidance and control. Communicativeness
includes not only communication skills, but also enjoymentof communication, which is basic for cooperation. Someonemight expect that especially highly communicative peopleenjoy cooperative approaches but communicativeness alsoimplies a higher need for communication. In general, com-municativeness and estimation of the cooperative approachtend to correlate negatively including some significant cases,such as subjective contentment while driving with H-mode(rs=0.456, p=0.043) and especially the perceived safetywhile driving temporarily fully automated (rs=0.445,p=0.049). The reason might be the comparatively low inter-action between driver and system in this automation level.Another explanation might be the perceived imbalance ofcontrol distribution in favor of the system, which is sup-ported by the negative correlation between communicative-ness and how comfortable participants felt with the controldistribution (rs=0.412, p=0.071). Other significantly neg-ative correlations were found for mode awareness (rs=0.525,p=0.017), transitions using buttons on the interaction screen(rs=0.454, p=0.044), and the overall understandability ofthe interaction screen (rs=0.459, p=0.042), which is in linewith the above mentioned explanation of higher needs andexpectations regarding communication. Though not signif-icantly correlating with the general estimation of H-mode,openness correlates significantly negative with the comfort-ableness of participants while using the highly cooperativeautomation level of highly automated driving (rs=0.452,p=0.045). It also correlates negatively with the perceivedsafety (rs=0.403, p=0.078). In future work it is interestingto investigate the relations between automation level percep-tion, openness, and additionally participants’ general needfor security as highly automated driving is in general per-ceived to be the safest level (Massisted=4.3,Mhighaut=6.1,Mtempaut=5.7).
3.3 Car UsageCar usage includes the aspects driving experience and driv-ing habits. Driving experience is deduced from the aver-age mileage per year and the highly significantly correlatingdriving frequency (rs=0.655, p=0.001). The strongest rela-tion between driving experience and the perception of the co-operative approach of guidance and control was found in howmuch easier driving was experienced by less driving people inthe cooperative approach than without assistance in the sim-ulator (rs=0.468, p=0.038). The perceived quality of co-operation between participant and system correlated nega-tively with driving experience (rs=0.458, p=0.042). For alllevels of automation, the same tendency can be found. Par-ticipants with low driving experience reported the biggestbenefits including feeling pleasant, perceived safety and con-trol distribution. The weakest correlations were found for as-sisted driving, while highly automated and temporarily fullyautomated driving had strong negative correlations with driv-ing experience. Driving experience correlated significantlynegative in the automation level highly automated with per-
ceived safety (rs=0.451, p=0.046) and contentment of theparticipants with the control distribution (rs=0.455,p=0.044). Besides driving experience driving habits re-vealed important correlations. People who enjoy drivingacross the country tend to devalue the utility of the sys-tem (rs=0.403, p=0.078) whereas people who mainly drivefrom A to B were more positive about the quality of coop-eration (rs=0.424, p=0.063). People using the car mainlyfor routine drives, which highly correlates with driving ex-perience (rs=0.592, p=0.006), rated the predictability of thesystem significantly low (rs=0.448, p=0.047). Any smalldeviation from their routine might be perceived exaggerated.For the interaction screen a significantly negative correlationwas found (rs=0.535, p=0.015). Not surprisingly, peoplestating to enjoy the activity of driving tended to rate com-paratively high on only assisted driving (rs=0.402, p=0.079)and had a significantly good mode awareness (rs=0.545,p=0.013), which is contrary to the influence of communica-tiveness (see above). The less people drive alone the morethey enjoyed the control distribution of the very cooperativeautomation level of highly automated driving (rs=0.503,p=0.024). In future work it should be investigated if thiswas a result of sociable character in general.
4. CONCLUSIONThe study revealed numerous important correlations be-tween aspects of cooperative guidance and user characteris-tics, especially regarding the socio-demographic factors gen-der and education, the personality traits communicativenessand openness, and the car usage aspects driving experienceand habits. These results indicate a need for a flexible, versa-tile driving assistance that easily adapts to the expectationsof di↵erent user groups. Future studies need to be performedin order to investigate these influences with a larger numberof participants to deduce specific design recommendations.
5. REFERENCES[1] R. Bruder, B. Franz, M. Kauer, and M. Schreiber.
Fahrerverhalten einer kooperativenFahrer-Fahrzeug-Interaktion. In Zukunft derFahrzeugfuhrung – kooperativ oder autonom? 5.Darmstadter Kolloquium Mensch & Fahrzeug, 2011.
[2] F. Flemisch, C. Adams, S. Conway, K. Goodrich,M. Palmer, and P. Schutte. The H-Metaphor as aGuideline for Vehicle Automation and Interaction.NASA/TM-2003-212672. Technical report, Hampton,NASA Research Center, 2003.
[3] F. O. Flemisch, J. Kelsch, A. Schieben, andJ. Schindler. Stucke des Puzzles hochautomatisiertesFahren: H-Metapher und H-Mode. In C. Stiller andM. Maurer, editors, 4. WorkshopFahrerassistenzsysteme, Karlsruhe, 2006.
[4] S. Meier, E. Altendorf, M. Baltzer, and F. Flemisch.Partizipative Interaktions- und Automationsgestaltungteil- bis hochautomatisierter Fahrzeuge: AusgewahlteErgebnisse explorativer Nutzerstudien zu H-Mode 1.1.In 10. Berliner Werkstatt Mensch-Maschine-Systeme,Oct 10-12, Berlin, 2013. Accepted.
[5] H. Winner and S. Hakuli. Conduct-by-Wire – followinga new paradigm for driving into the future. In FISITA2006 World Automotive Congress, Oct 22 - 27,Yokohama, Japan. FISITA, SAE of Japan, 2006.
101
Adjunct Proceedings of the 5th International Conference on Automotive User Interfaces and Interactive Vehicular Applications (AutomotiveUI ‚13), October 28–30, 2013, Eindhoven, The Netherlands.
Driving Simulator Sickness Screening: Efficient and Effective New Protocol
Thomas M Gable Georgia Institute of Technology
654 Cherry Street Atlanta GA 30332 001.404.894.2680
Bruce N Walker Georgia Institute of Technology
654 Cherry Street Atlanta GA 30332 001.404.894.8265
ABSTRACT Driving simulators allow researchers to study situations that would otherwise be difficult or impossible to investigate. Simulator sickness can negatively affect these studies, make participants uncomfortable or ill, and waste the time of both participants and researchers. A new, faster, simulator sickness screening protocol has been developed, based on prior protocols. We describe an ongoing longitudinal quantitative assessment using an electronic version of the screening protocol to verify our initial experience with a paper version of high accuracy in excluding participants who would otherwise have to drop out of a driving study due to simulator sickness.
Categories and Subject Descriptors H.5.2 [Information Interfaces And Presentation (e.g., HCI)]: User Interfaces –graphical user interfaces (GUI), interaction styles (e.g., commands, menus, forms, direct manipulation), user-centered design; I.6.7 [Simulation and Modeling]: Simulation Support Systems
General Terms Design, Experimentation, Human Factors.
Keywords Simulator Sickness Screening, Driving.
1. INTRODUCTION 1.1 Simulator Sickness Simulator sickness (SS) occurs for some people when they use a simulator. Symptoms of SS are similar to those of motion sickness (MS), and can include disorientation, dizziness, headache, dry mouth, and even drowsiness, vomiting, and nausea. Fortunately, SS tends to occur less frequently than MS, and with less severe physical and mental symptoms [1, 2, 3]. Nevertheless, SS can still have negative effects on an experiment, and confound data through reductions in psychomotor control and participant dropout [2]. And, of course, due to the potential negative effects of SS on participants it is vital to try to decrease the frequency and severity of symptoms, so as not to harm participants [1].
1.2 Screening for Simulator Sickness Several attributes of driving scenarios (e.g., curves, steady braking, intersections, time driving, and speed of the simulated vehicle) and physical simulator or environment-based factors (e.g., room temperature) have been found to impact SS [1,5,6,7,8,9]. While researchers have attempted to modify these
factors to address SS, others have attempted measuring SS (and then dealing with it later during data analysis) to tackle the issue. To this end multiple SS measurement scales have been developed over the years. Some of the original SS measurement scales were based on measurements of purely motion-related symptoms; examples include the Pensacola Diagnostic Index (PDI) and the Pensacola Motion Sickness Questionnaire (MSQ) [10,11]. Problems with these measurements for driving simulator use included their reliance on a single score of determining SS, and not being designed specifically for SS. This led researchers to create new multidimensional scales such as the SS questionnaire (SSQ), and MS assessment questionnaire (MSAQ) [3,11].
Unfortunately, addressing environmental factors and measuring any residual SS was not sufficient. Researchers determined they needed to screen individuals before participating in a driving study. However, by giving pre-screening surveys based on previous SS or MS, researchers screened out some who would not get SS in the study. Other researchers saw the possibility of using an SS survey, plus the completion of a scenario in the simulator, to screen for SS [1,7]. For that reason, Brooks et al. adapted the MSAQ and reported more than 90% accuracy in their screening protocol [1].
The present study is an attempt to measure the effectiveness of the new Georgia Tech SS screening protocol. The procedure and supporting software tools, were developed for the Georgia Tech School of Psychology’s mid-fidelity, fixed base driving simulator, and is discussed in greater technical detail in [4]. The ongoing research aims to determine how well the screening protocol identifies participants who may experience SS during a study, before they begin. This is done to avoid harming subjects through experiencing strong reactions of SS after longer exposure, and in order to save time of the researchers and participants. The earlier version of the SS screening method worked very well after its development, but the current electronic version was created to speed up the process and to allow for ease of quantitative longitudinal evaluation of its effectiveness.
2. METHOD 2.1 Participants The sample for this research is a combination of participants from separate driving research studies in a large research university in the southeastern United States. Participants are required to have a valid driver’s license and normal or corrected-to-normal vision.
2.2 Apparatus 2.2.1 Driving Simulator The driving simulator used in this study is a quarter-cab National Advanced Driving Simulator (NADS) MiniSim. The simulator’s visuals are displayed on three 42” plasma monitors and an LCD
Copyright held by author(s) AutomotiveUI'13, October 28--30 2013, Eindhoven, Netherlands. Adjunct Proceedings
102
Adjunct Proceedings of the 5th International Conference on Automotive User Interfaces and Interactive Vehicular Applications (AutomotiveUI ‚13), October 28–30, 2013, Eindhoven, The Netherlands.
screen for the instrument panel. The simulator conveys sound through a 2.1 audio system and participants use an adjustable steering wheel, gas and brake pedals, and gear shifter for input.
2.2.2 Screening Protocol The current screening protocol including the apparatus and the procedure will be briefly described below, however for more detail see Gable and Walker [4]. The GT SS screening survey used here is a modified version of the version of MSAQ used in Brooks et al. [1]. In this version, participants use a touch screen unit fixed in the simulator to answer 17 questions about their current state of feeling. The survey uses a scale from 0 to 10 where 0 is “not at all” and 10 is “severely” regarding the dimensions of: sick to stomach, faint-like, annoyed/irritated, sweaty, queasy, lightheaded, drowsy, clammy/cold sweat, disoriented, tired/fatigued, nauseated, hot/warm, dizzy, like I am spinning, if I may vomit, uneasy, and floating. They then complete a short (2 minute) drive through a purpose-built scenario using the NADS scenario development tool. The driving scenario’s brevity keeps the acclimation drive short, while still introducing drivers to maneuvers that may trigger feelings of SS. Finally, drivers complete the survey a second time, after the drive.
The computer then calculates any changes in physical feeling between the two drives, and recommends whether the driver should continue with the study or not. If at any time during the acclimation drive (or later in the study) participants report any feelings of sickness, the simulation is stopped.
2.3 Procedure Over the course of a number of months all participants who partake in simulator studies using the School of Psychology simulator have gone, and will continue to go, through this new electronic version of the protocol before the start of the experiment. When a participant is removed from a study due to the screening or partway through a study due to SS these data are recorded in the database. At the end of the study period all of the screening files output by the program will be analyzed to quantitatively assess the effectiveness of this screening technique.
3. CURRENT AND EXPECTED RESULTS Since this screening process was adapted in part from Brooks et al. who found accuracy of above 90% in their screening process it is to be expected that this screening should show a similar validity [1]. Accordingly it is predicted that only 10% or less of participants that make it through the protocol without being recommended to stop will exhibit SS symptoms and have to stop the study part way through. Although not enough screenings were done with the paper version of the screening for a statistical analysis of the magnitude desired we did not have any participants drop out of studies due to simulator sickness post screening.
It is our expectation that the current, more formal, and quantitative evaluation will echo our initial and anecdotal findings. It should also be said that, even though screening times and ease of assessment are not reported in other studies, this new protocol is expected to be faster and more efficient than other screenings due to our use of in-vehicle assessment, a computerized survey using a touchscreen interface, automated scoring, integrated data archiving for longitudinal evaluation, and the short (2 min) acclimation driving scenario.
4. DISCUSSION The newly developed GT simulator sickness protocol is already showing great promise. If, after this more formal evaluation, the
screening protocol is indeed found to be as effective and efficient as it seems, it will enhance the driving research performed at Georgia Tech. Of course, our intentions in developing such a tool is to share it widely with other MiniSim users, and help adapt it for use in other simulators. While the current investigation is focused on young populations, research has found relationships between age and prevalence of SS [1,8]. Thus, we plan to systematically expand the range of participants screened, including older adults and those who have various special challenges (e.g., drivers with traumatic brain injury, low vision).
5. ACKNOWLEDGMENTS Thanks to Ben Stolvitz for creating the touchscreen application. Portions of this work are supported by a National Science Foundation Graduate Research Fellowship (DGE-1148903).
6. REFERENCES [1] Brooks, J. O., Goodenough, R. R., Crisler, M. C., Klein, N.
D., Alley, R. L., Koon, B. L., ... & Wills, R. F. (2010). Simulator sickness during driving simulation studies. Accident Analysis & Prevention, 42(3), 788-796.
[2] Cobb, S. V., Nichols, S., Ramsey, A., & Wilson, J. R. (1999). Virtual reality-induced symptoms and effects (VRISE). Presence: Teleoperators and Virtual Environments, 8(2), 169-186.
[3] Kennedy, R. S., Lane, N. E., Berbaum, K. S., & Lilienthal, M. G. (1993). Simulator sickness questionnaire: An enhanced method for quantifying simulator sickness. The international journal of aviation psychology, 3(3), 203-220.
[4] Gable, T. M., & Walker, B. N. (2013). Driving Simulator Sickness Screening Protocol. Georgia Tech Sonification lab Tech Report, 2013-01.
[5] Lee, G. C., Yoo, Y., & Jones, S. (1997). Investigation of driving performance, vection, postural sway, and simulator sickness in a fixed-based driving simulator. Computers & industrial engineering, 33(3), 533-536.
[6] Roe, C., Brown, T., & Watson, G. (2007). Factors Associated with Simulator Sickness in a High-Fidelity Simulator. Education, 251, 5A.
[7] Watson, G. (2000, July). A synthesis of simulator sickness studies conducted in a high-fidelity driving simulator. In Proceedings of Driving Simulation Conference (pp. 69-78).
[8] Kennedy, R. S., Stanney, K. M., & Dunlap, W. P. (2000). Duration and exposure to virtual environments: Sickness curves during and across sessions. Presence: Teleoperators and Virtual Environments, 9(5), 463-472.
[9] Mourant, R. R., & Thattacherry, T. R. (2000, July). Simulator sickness in a virtual environments driving simulator. In Proceedings of the Human Factors and Ergonomics Society Annual Meeting (Vol. 44, No. 5, pp. 534-537). SAGE Publications.
[10] Graybiel, A., Wood, C. D., Miller, E. F., & Cramer, D. B. (1968). Diagnostic criteria for grading the severity of acute motion sickness (No. NAMI-1030). NAVAL AEROSPACE MEDICAL INST PENSACOLA FLA.
[11] Gianaros, P. J., Muth, E. R., Mordkoff, J. T., Levine, M. E., & Stern, R. M. (2001). A questionnaire for the assessment of the multiple dimensions of motion sickness. Aviation, space, and environmental medicine, 72(2), 115.
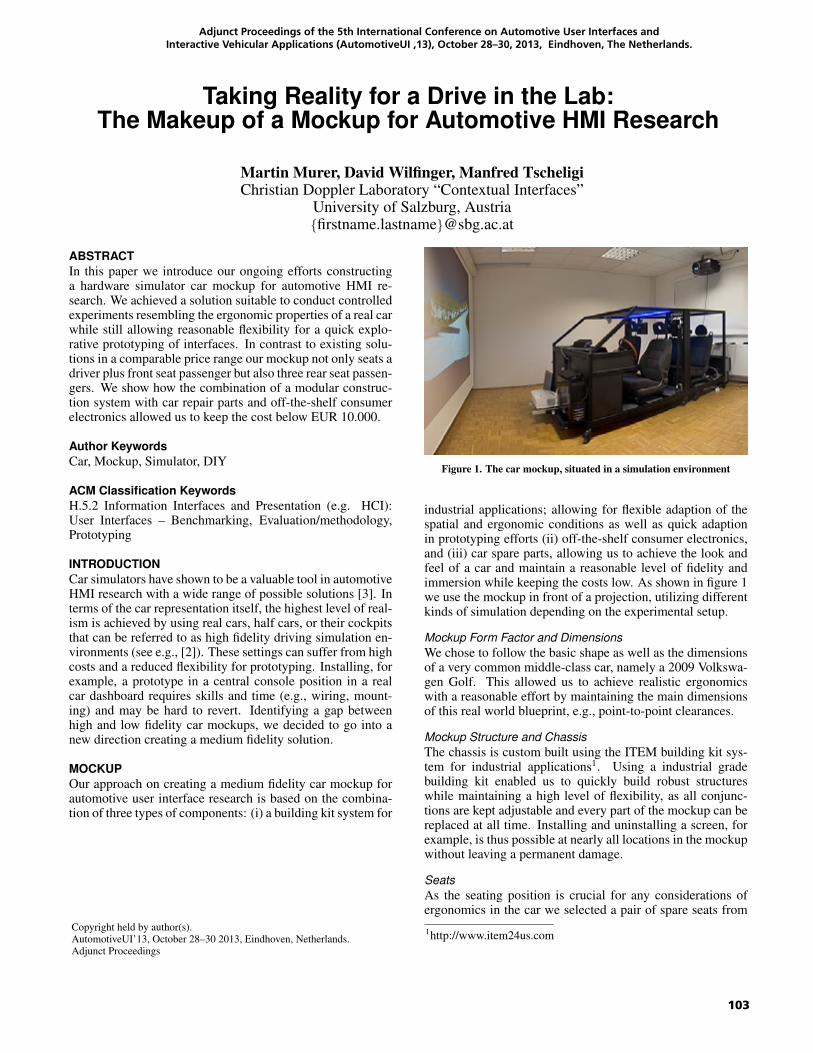
103
Adjunct Proceedings of the 5th International Conference on Automotive User Interfaces and Interactive Vehicular Applications (AutomotiveUI ‚13), October 28–30, 2013, Eindhoven, The Netherlands.
Taking Reality for a Drive in the Lab:The Makeup of a Mockup for Automotive HMI Research
Martin Murer, David Wilfinger, Manfred TscheligiChristian Doppler Laboratory “Contextual Interfaces”
University of Salzburg, Austria{firstname.lastname}@sbg.ac.at
ABSTRACTIn this paper we introduce our ongoing efforts constructinga hardware simulator car mockup for automotive HMI re-search. We achieved a solution suitable to conduct controlledexperiments resembling the ergonomic properties of a real carwhile still allowing reasonable flexibility for a quick explo-rative prototyping of interfaces. In contrast to existing solu-tions in a comparable price range our mockup not only seats adriver plus front seat passenger but also three rear seat passen-gers. We show how the combination of a modular construc-tion system with car repair parts and off-the-shelf consumerelectronics allowed us to keep the cost below EUR 10.000.
Author KeywordsCar, Mockup, Simulator, DIY
ACM Classification KeywordsH.5.2 Information Interfaces and Presentation (e.g. HCI):User Interfaces – Benchmarking, Evaluation/methodology,Prototyping
INTRODUCTIONCar simulators have shown to be a valuable tool in automotiveHMI research with a wide range of possible solutions [3]. Interms of the car representation itself, the highest level of real-ism is achieved by using real cars, half cars, or their cockpitsthat can be referred to as high fidelity driving simulation en-vironments (see e.g., [2]). These settings can suffer from highcosts and a reduced flexibility for prototyping. Installing, forexample, a prototype in a central console position in a realcar dashboard requires skills and time (e.g., wiring, mount-ing) and may be hard to revert. Identifying a gap betweenhigh and low fidelity car mockups, we decided to go into anew direction creating a medium fidelity solution.
MOCKUPOur approach on creating a medium fidelity car mockup forautomotive user interface research is based on the combina-tion of three types of components: (i) a building kit system for
Copyright held by author(s).AutomotiveUI’13, October 28–30 2013, Eindhoven, Netherlands.Adjunct Proceedings
Figure 1. The car mockup, situated in a simulation environment
industrial applications; allowing for flexible adaption of thespatial and ergonomic conditions as well as quick adaptionin prototyping efforts (ii) off-the-shelf consumer electronics,and (iii) car spare parts, allowing us to achieve the look andfeel of a car and maintain a reasonable level of fidelity andimmersion while keeping the costs low. As shown in figure 1we use the mockup in front of a projection, utilizing differentkinds of simulation depending on the experimental setup.
Mockup Form Factor and DimensionsWe chose to follow the basic shape as well as the dimensionsof a very common middle-class car, namely a 2009 Volkswa-gen Golf. This allowed us to achieve realistic ergonomicswith a reasonable effort by maintaining the main dimensionsof this real world blueprint, e.g., point-to-point clearances.
Mockup Structure and ChassisThe chassis is custom built using the ITEM building kit sys-tem for industrial applications1. Using a industrial gradebuilding kit enabled us to quickly build robust structureswhile maintaining a high level of flexibility, as all conjunc-tions are kept adjustable and every part of the mockup can bereplaced at all time. Installing and uninstalling a screen, forexample, is thus possible at nearly all locations in the mockupwithout leaving a permanent damage.
SeatsAs the seating position is crucial for any considerations ofergonomics in the car we selected a pair of spare seats from
1http://www.item24us.com
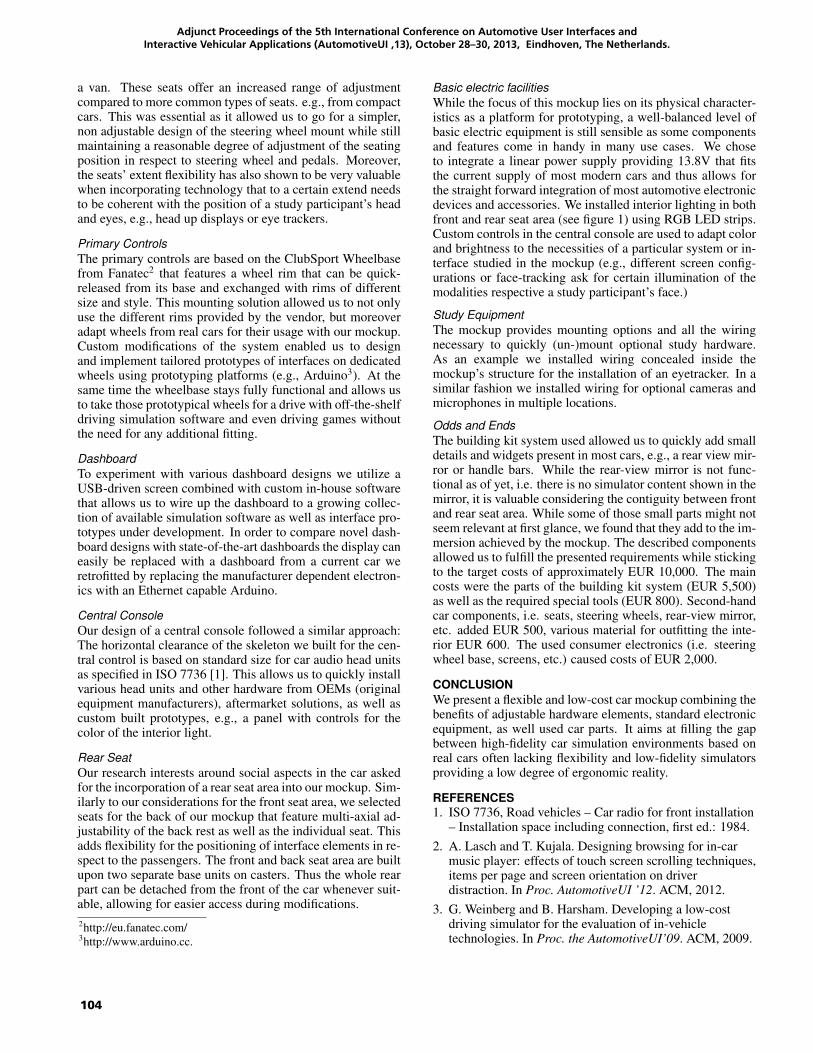
104
Adjunct Proceedings of the 5th International Conference on Automotive User Interfaces and Interactive Vehicular Applications (AutomotiveUI ‚13), October 28–30, 2013, Eindhoven, The Netherlands.
a van. These seats offer an increased range of adjustmentcompared to more common types of seats. e.g., from compactcars. This was essential as it allowed us to go for a simpler,non adjustable design of the steering wheel mount while stillmaintaining a reasonable degree of adjustment of the seatingposition in respect to steering wheel and pedals. Moreover,the seats’ extent flexibility has also shown to be very valuablewhen incorporating technology that to a certain extend needsto be coherent with the position of a study participant’s headand eyes, e.g., head up displays or eye trackers.
Primary ControlsThe primary controls are based on the ClubSport Wheelbasefrom Fanatec2 that features a wheel rim that can be quick-released from its base and exchanged with rims of differentsize and style. This mounting solution allowed us to not onlyuse the different rims provided by the vendor, but moreoveradapt wheels from real cars for their usage with our mockup.Custom modifications of the system enabled us to designand implement tailored prototypes of interfaces on dedicatedwheels using prototyping platforms (e.g., Arduino3). At thesame time the wheelbase stays fully functional and allows usto take those prototypical wheels for a drive with off-the-shelfdriving simulation software and even driving games withoutthe need for any additional fitting.
DashboardTo experiment with various dashboard designs we utilize aUSB-driven screen combined with custom in-house softwarethat allows us to wire up the dashboard to a growing collec-tion of available simulation software as well as interface pro-totypes under development. In order to compare novel dash-board designs with state-of-the-art dashboards the display caneasily be replaced with a dashboard from a current car weretrofitted by replacing the manufacturer dependent electron-ics with an Ethernet capable Arduino.
Central ConsoleOur design of a central console followed a similar approach:The horizontal clearance of the skeleton we built for the cen-tral control is based on standard size for car audio head unitsas specified in ISO 7736 [1]. This allows us to quickly installvarious head units and other hardware from OEMs (originalequipment manufacturers), aftermarket solutions, as well ascustom built prototypes, e.g., a panel with controls for thecolor of the interior light.
Rear SeatOur research interests around social aspects in the car askedfor the incorporation of a rear seat area into our mockup. Sim-ilarly to our considerations for the front seat area, we selectedseats for the back of our mockup that feature multi-axial ad-justability of the back rest as well as the individual seat. Thisadds flexibility for the positioning of interface elements in re-spect to the passengers. The front and back seat area are builtupon two separate base units on casters. Thus the whole rearpart can be detached from the front of the car whenever suit-able, allowing for easier access during modifications.2http://eu.fanatec.com/3http://www.arduino.cc.
Basic electric facilitiesWhile the focus of this mockup lies on its physical character-istics as a platform for prototyping, a well-balanced level ofbasic electric equipment is still sensible as some componentsand features come in handy in many use cases. We choseto integrate a linear power supply providing 13.8V that fitsthe current supply of most modern cars and thus allows forthe straight forward integration of most automotive electronicdevices and accessories. We installed interior lighting in bothfront and rear seat area (see figure 1) using RGB LED strips.Custom controls in the central console are used to adapt colorand brightness to the necessities of a particular system or in-terface studied in the mockup (e.g., different screen config-urations or face-tracking ask for certain illumination of themodalities respective a study participant’s face.)
Study EquipmentThe mockup provides mounting options and all the wiringnecessary to quickly (un-)mount optional study hardware.As an example we installed wiring concealed inside themockup’s structure for the installation of an eyetracker. In asimilar fashion we installed wiring for optional cameras andmicrophones in multiple locations.
Odds and EndsThe building kit system used allowed us to quickly add smalldetails and widgets present in most cars, e.g., a rear view mir-ror or handle bars. While the rear-view mirror is not func-tional as of yet, i.e. there is no simulator content shown in themirror, it is valuable considering the contiguity between frontand rear seat area. While some of those small parts might notseem relevant at first glance, we found that they add to the im-mersion achieved by the mockup. The described componentsallowed us to fulfill the presented requirements while stickingto the target costs of approximately EUR 10,000. The maincosts were the parts of the building kit system (EUR 5,500)as well as the required special tools (EUR 800). Second-handcar components, i.e. seats, steering wheels, rear-view mirror,etc. added EUR 500, various material for outfitting the inte-rior EUR 600. The used consumer electronics (i.e. steeringwheel base, screens, etc.) caused costs of EUR 2,000.
CONCLUSIONWe present a flexible and low-cost car mockup combining thebenefits of adjustable hardware elements, standard electronicequipment, as well used car parts. It aims at filling the gapbetween high-fidelity car simulation environments based onreal cars often lacking flexibility and low-fidelity simulatorsproviding a low degree of ergonomic reality.
REFERENCES1. ISO 7736, Road vehicles – Car radio for front installation
– Installation space including connection, first ed.: 1984.2. A. Lasch and T. Kujala. Designing browsing for in-car
music player: effects of touch screen scrolling techniques,items per page and screen orientation on driverdistraction. In Proc. AutomotiveUI ’12. ACM, 2012.
3. G. Weinberg and B. Harsham. Developing a low-costdriving simulator for the evaluation of in-vehicletechnologies. In Proc. the AutomotiveUI’09. ACM, 2009.
105
Adjunct Proceedings of the 5th International Conference on Automotive User Interfaces and Interactive Vehicular Applications (AutomotiveUI ‚13), October 28–30, 2013, Eindhoven, The Netherlands.
Personalized situation-adaptive User Interaction in the Car
Nadine Siegmund1, Tobias Altmüller1, Klaus Bengler2
1Robert Bosch GmbH, Daimlerstraße 6, 71229 Leonberg, Germany2Institute of Ergonomics, Technical University of Munich,
Boltzmannstraße 15, 85747 Garching, Germany
[email protected], [email protected], [email protected]
ABSTRACTThe complexity of the interaction with DAS and IVIS in-creases due to the steadily rising number of functions in thevehicle which can result in the problem of driver distrac-tion. A solution is to provide a personalized and situation-adaptive support. This means offering an easy and fastway to access the needed functionality. The existing ap-proaches provide solutions only for specific functions in thefield of IVIS. Our approach is based on an overall architec-ture, which includes DAS and IVIS and which provides aprioritization of support possibilities depending on the situ-ation. The needs of the driver are identified depending onthe situation and a support in form of the adaptation of thefunction set in the menu or executing preconfigured actionswith or without confirmation of the driver is provided. Bothreduce the complexity of the interaction by minimizing thenumber of operation steps.
Categories and Subject DescriptorsH.1.2 [User/Machine Systems]: Human factors
General TermsArchitecture, Human Factors
Keywordsdistraction, personalization, situation awareness, adaption,user interaction
1. INTRODUCTIONThe rising number of functions in the vehicle within both
driver assistance systems (DAS) and in-vehicle informationsystems (IVIS) results in an increasing complexity of the in-teraction which can lead to driver distraction. A study fromthe German Federal Highway Research Institute (BASt) onthe topic of distraction due to non-driving tasks points outthis problem. For instance 12% of the accidents caused bydistraction in the vehicle are related to entertainment sys-tems. And 92% of these accidents happened because thedriver was operating the system [5]. The challenge for thehuman-machine interaction (HMI) development is to sup-port the driver by providing an easy way to operate and use
Copyright held by author(s).AutomotiveUI’13, October 28–30 2013, Eindhoven, Netherlands.Adjunct Proceedings.
the functions of such a complex system. This means havinga higher user acceptance and less distraction, e.g. by reduc-ing the number of operation steps. At present, several ap-proaches provide solutions for specific functions in the fieldof IVIS. But there is no solution, which addresses an over-all architecture, where both DAS and IVIS are integrated,and which provides a prioritization of support possibilitiesdepending on user needs. To achieve this, we propose anapproach which is based on an overall architecture and pro-vides prioritization to realize a fast access of functions.
2. RELATED WORKWithin the project AIDE, wherein the goal was to develop
technologies for integration of ADAS, IVIS and nomadic de-vices into the driving environment, an overall system withan Interaction and Communication Assistant (ICA) and aDriver-Vehicle-Environment (DVE) module was developed.The DVE module gets sensor information about driver, ve-hicle and environment, deduces knowledge and provides theknowledge to applications and the ICA. The ICA managesand adapts the driver system interaction based on rules anddependent on the knowledge provided by the DVE module[1]. A DVE module for situation recognition similar to theone from AIDE was developed in the smart car project toprovide context-awareness in the vehicle. It uses a layeredarchitecture to deduce context information from sensor val-ues and then concludes situations using an ontology [8].On this basis, the needs of the driver can be identified. Manyapproaches that support the driver within a specific task like[4] and [7] primarily observe the user behavior concerning theuse of functions relating to a situation to identify the needsand preferences in the present and future. In [2] a modelfor situation recognition similar to the one in the smart carproject is used, which also uses knowledge about the pastand the current situation and in [3] only a user model anda data base for personalization is used.If the driver needs are identified, there are several strategiesto provide an easy and comfortable access to functions. Oneapproach is to use adaptive user interfaces (AUIs) whichadapt menus or the set of functions according to the situa-tion. The major disadvantage of AUIs is their inconsistency,therefore different levels of adaptivity from intermediate tofully adaptive relating to the requirements (e.g. routine vs.non-routine tasks) could be offered [6]. Another approachto support the driver is to provide preconfigured functionsrelating to personal preferences and the situation for exam-ple by using information about the situation to predict thenext destination to which the driver wants to navigate [4].
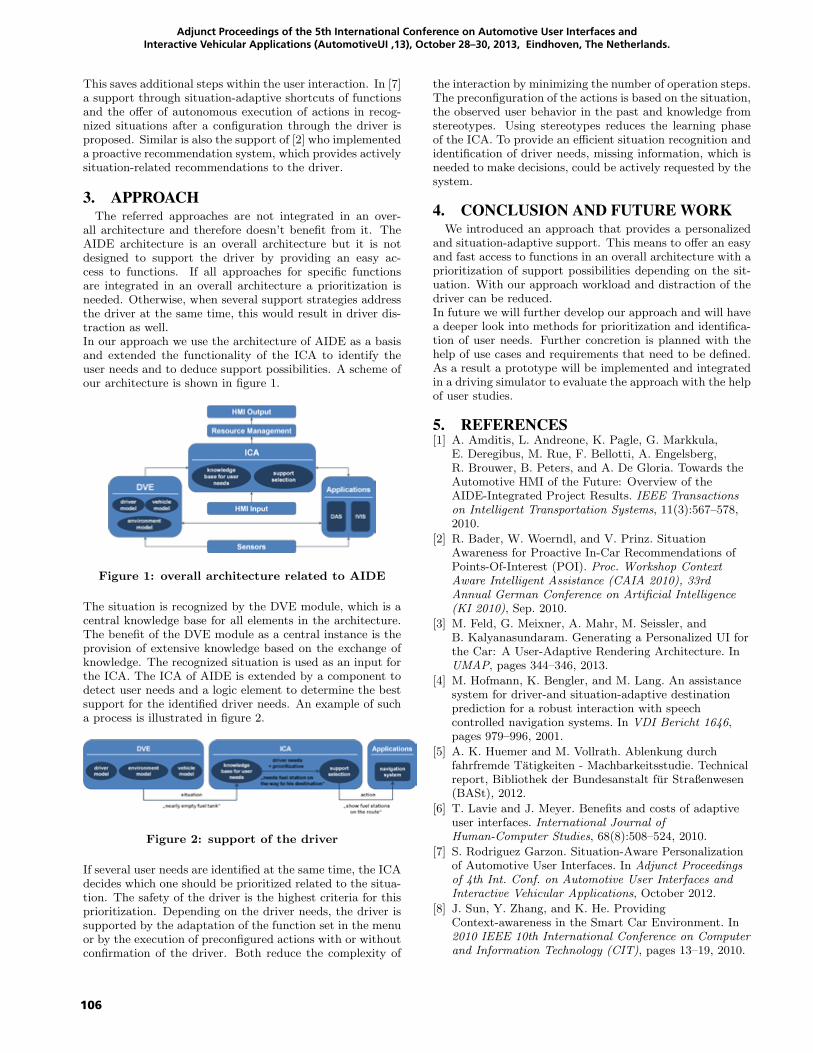
106
Adjunct Proceedings of the 5th International Conference on Automotive User Interfaces and Interactive Vehicular Applications (AutomotiveUI ‚13), October 28–30, 2013, Eindhoven, The Netherlands.
This saves additional steps within the user interaction. In [7]a support through situation-adaptive shortcuts of functionsand the offer of autonomous execution of actions in recog-nized situations after a configuration through the driver isproposed. Similar is also the support of [2] who implementeda proactive recommendation system, which provides activelysituation-related recommendations to the driver.
3. APPROACHThe referred approaches are not integrated in an over-
all architecture and therefore doesn’t benefit from it. TheAIDE architecture is an overall architecture but it is notdesigned to support the driver by providing an easy ac-cess to functions. If all approaches for specific functionsare integrated in an overall architecture a prioritization isneeded. Otherwise, when several support strategies addressthe driver at the same time, this would result in driver dis-traction as well.In our approach we use the architecture of AIDE as a basisand extended the functionality of the ICA to identify theuser needs and to deduce support possibilities. A scheme ofour architecture is shown in figure 1.
Figure 1: overall architecture related to AIDE
The situation is recognized by the DVE module, which is acentral knowledge base for all elements in the architecture.The benefit of the DVE module as a central instance is theprovision of extensive knowledge based on the exchange ofknowledge. The recognized situation is used as an input forthe ICA. The ICA of AIDE is extended by a component todetect user needs and a logic element to determine the bestsupport for the identified driver needs. An example of sucha process is illustrated in figure 2.
Figure 2: support of the driver
If several user needs are identified at the same time, the ICAdecides which one should be prioritized related to the situa-tion. The safety of the driver is the highest criteria for thisprioritization. Depending on the driver needs, the driver issupported by the adaptation of the function set in the menuor by the execution of preconfigured actions with or withoutconfirmation of the driver. Both reduce the complexity of
the interaction by minimizing the number of operation steps.The preconfiguration of the actions is based on the situation,the observed user behavior in the past and knowledge fromstereotypes. Using stereotypes reduces the learning phaseof the ICA. To provide an efficient situation recognition andidentification of driver needs, missing information, which isneeded to make decisions, could be actively requested by thesystem.
4. CONCLUSION AND FUTURE WORKWe introduced an approach that provides a personalized
and situation-adaptive support. This means to offer an easyand fast access to functions in an overall architecture with aprioritization of support possibilities depending on the sit-uation. With our approach workload and distraction of thedriver can be reduced.In future we will further develop our approach and will havea deeper look into methods for prioritization and identifica-tion of user needs. Further concretion is planned with thehelp of use cases and requirements that need to be defined.As a result a prototype will be implemented and integratedin a driving simulator to evaluate the approach with the helpof user studies.
5. REFERENCES[1] A. Amditis, L. Andreone, K. Pagle, G. Markkula,
E. Deregibus, M. Rue, F. Bellotti, A. Engelsberg,R. Brouwer, B. Peters, and A. De Gloria. Towards theAutomotive HMI of the Future: Overview of theAIDE-Integrated Project Results. IEEE Transactionson Intelligent Transportation Systems, 11(3):567–578,2010.
[2] R. Bader, W. Woerndl, and V. Prinz. SituationAwareness for Proactive In-Car Recommendations ofPoints-Of-Interest (POI). Proc. Workshop ContextAware Intelligent Assistance (CAIA 2010), 33rdAnnual German Conference on Artificial Intelligence(KI 2010), Sep. 2010.
[3] M. Feld, G. Meixner, A. Mahr, M. Seissler, andB. Kalyanasundaram. Generating a Personalized UI forthe Car: A User-Adaptive Rendering Architecture. InUMAP, pages 344–346, 2013.
[4] M. Hofmann, K. Bengler, and M. Lang. An assistancesystem for driver-and situation-adaptive destinationprediction for a robust interaction with speechcontrolled navigation systems. In VDI Bericht 1646,pages 979–996, 2001.
[5] A. K. Huemer and M. Vollrath. Ablenkung durchfahrfremde Tatigkeiten - Machbarkeitsstudie. Technicalreport, Bibliothek der Bundesanstalt fur Straßenwesen(BASt), 2012.
[6] T. Lavie and J. Meyer. Benefits and costs of adaptiveuser interfaces. International Journal ofHuman-Computer Studies, 68(8):508–524, 2010.
[7] S. Rodriguez Garzon. Situation-Aware Personalizationof Automotive User Interfaces. In Adjunct Proceedingsof 4th Int. Conf. on Automotive User Interfaces andInteractive Vehicular Applications, October 2012.
[8] J. Sun, Y. Zhang, and K. He. ProvidingContext-awareness in the Smart Car Environment. In2010 IEEE 10th International Conference on Computerand Information Technology (CIT), pages 13–19, 2010.
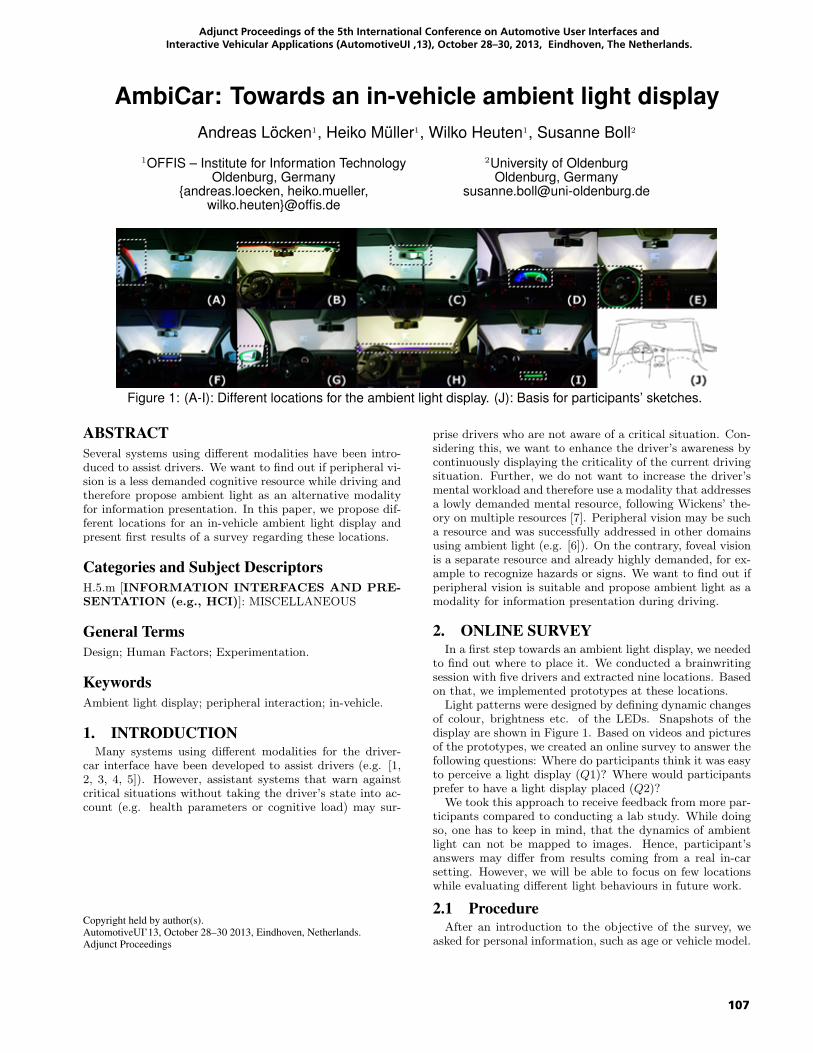
107
Adjunct Proceedings of the 5th International Conference on Automotive User Interfaces and Interactive Vehicular Applications (AutomotiveUI ‚13), October 28–30, 2013, Eindhoven, The Netherlands.
AmbiCar: Towards an in-vehicle ambient light displayAndreas Löcken1, Heiko Müller1, Wilko Heuten1, Susanne Boll2
1OFFIS – Institute for Information TechnologyOldenburg, Germany
{andreas.loecken, heiko.mueller,wilko.heuten}@offis.de
2University of OldenburgOldenburg, Germany
Figure 1: (A-I): Different locations for the ambient light display. (J): Basis for participants’ sketches.
ABSTRACTSeveral systems using different modalities have been intro-duced to assist drivers. We want to find out if peripheral vi-sion is a less demanded cognitive resource while driving andtherefore propose ambient light as an alternative modalityfor information presentation. In this paper, we propose dif-ferent locations for an in-vehicle ambient light display andpresent first results of a survey regarding these locations.
Categories and Subject DescriptorsH.5.m [INFORMATION INTERFACES AND PRE-SENTATION (e.g., HCI)]: MISCELLANEOUS
General TermsDesign; Human Factors; Experimentation.
KeywordsAmbient light display; peripheral interaction; in-vehicle.
1. INTRODUCTIONMany systems using different modalities for the driver-
car interface have been developed to assist drivers (e.g. [1,2, 3, 4, 5]). However, assistant systems that warn againstcritical situations without taking the driver’s state into ac-count (e.g. health parameters or cognitive load) may sur-
Copyright held by author(s).AutomotiveUI’13, October 28–30 2013, Eindhoven, Netherlands.Adjunct Proceedings
prise drivers who are not aware of a critical situation. Con-sidering this, we want to enhance the driver’s awareness bycontinuously displaying the criticality of the current drivingsituation. Further, we do not want to increase the driver’smental workload and therefore use a modality that addressesa lowly demanded mental resource, following Wickens’ the-ory on multiple resources [7]. Peripheral vision may be sucha resource and was successfully addressed in other domainsusing ambient light (e.g. [6]). On the contrary, foveal visionis a separate resource and already highly demanded, for ex-ample to recognize hazards or signs. We want to find out ifperipheral vision is suitable and propose ambient light as amodality for information presentation during driving.
2. ONLINE SURVEYIn a first step towards an ambient light display, we needed
to find out where to place it. We conducted a brainwritingsession with five drivers and extracted nine locations. Basedon that, we implemented prototypes at these locations.
Light patterns were designed by defining dynamic changesof colour, brightness etc. of the LEDs. Snapshots of thedisplay are shown in Figure 1. Based on videos and picturesof the prototypes, we created an online survey to answer thefollowing questions: Where do participants think it was easyto perceive a light display (Q1)? Where would participantsprefer to have a light display placed (Q2)?
We took this approach to receive feedback from more par-ticipants compared to conducting a lab study. While doingso, one has to keep in mind, that the dynamics of ambientlight can not be mapped to images. Hence, participant’sanswers may differ from results coming from a real in-carsetting. However, we will be able to focus on few locationswhile evaluating different light behaviours in future work.
2.1 ProcedureAfter an introduction to the objective of the survey, we
asked for personal information, such as age or vehicle model.

108
Adjunct Proceedings of the 5th International Conference on Automotive User Interfaces and Interactive Vehicular Applications (AutomotiveUI ‚13), October 28–30, 2013, Eindhoven, The Netherlands.
Next, participants could watch videos of different lightpatterns at different locations to get an impression of whatis possible. They were reminded that the survey is about lo-cations of a light display and not about these light patterns.
For each location shown in Figure 1, an image consisting ofseven examples of light patterns was presented. Participantscould rate each location for its perceptibility (Q1) and theparticipant’s preference (Q2) using a seven-point Likert-typescale and comment on it.
Afterwards, participants were asked to select their favouriteor the option none of the shown. In addition, they couldsketch their own ideas for a location and comment on it. Fi-nally, they could give general feedback regarding the survey.
2.2 Results58 people participated in the survey (38 male, 19 female,
1 without answer). Most participants (24) were between 24and 30 years old. Most drivers (19) received their licence 5to 10 years ago. 8 participants stated they do not drive, 12drive less than 5,000km per year, 15 up to 10,000km, 11 upto 20,000km and 12 more than that.
We used Friedman’s ANOVA to test our findings regard-ing Q1 and Q2 for significant effects. In addition, we per-formed Wilcoxon signed-rank tests to follow-up our findingsand applied Holm corrections. Effect sizes were calculatedusing the formula r = Z√
N, where N is the total number of
the samples, and among other results shown in table 1.Likings and perceptibilities differed significantly (χ2
l (8) =88.9, p < .001 resp. χ2
p(8) = 128.6, p < .001). (D) is thefavourite location for 18 people. Next, (H) was preferred by10 participants. Both locations’ perceptibilities were ratedhigher than for most other locations, but don’t differ sig-nificantly. (G) and (I) were the least preferred locations.The perceptibilities of both locations were rated significantlylower than any other location. Looking into the ratings forlikings, the results of (D) are significantly higher than theones of most other locations, reflecting the high number ofvotes. Interestingly though, (F) and (H) are on the samelevel, both having higher ratings than (E), (G) and (I),which retrieved comparably low ratings.
We used Kruskal–Wallis ANOVA to search for differencesbetween groups of participants regarding Q1 and Q2, per-formed Mann–Whitney’s U tests to follow up our findings
# xp xl rpD rpG rpH rpI rlD rlF rlHA 5 5 4 * .47 * .44 -.34 * *B 2 5 4 -.36 .38 -.37 .44 -.46 * -.3C 4 4 3 -.36 .39 -.32 .39 -.39 * *D 18 5 5 – .53 * .52 – * .28E 4 4 3 -.42 .35 -.36 .38 -.45 -.34 -.29F 6 5 5 * .4 * .53 * – *G 2 2 2 -.53 – -.49 * -.46 -.33 -.29H 10 6 5 * .49 – .51 -.28 * –I 1 3 2 -.52 * -.51 – -.48 -.52 -.36
Table 1: Number of votes for favourite location(#), medians for perceptibilities and likings (xp, xl)and effect sizes (rpX , rlX) for significant differencesto other locations (p < .05 after correction). Non-significant effects were marked with * or dropped.The names of the rows refer to the names of thelocations given in Figure 1.
and applied Holm corrections. We found several gender-,age- and experience-related differences. For example, femaleparticipants liked (E) more compared to male participants(xlAM = 2, xlAF = 4, r = −.32), while men liked (A) more(xlEM = 4, xlEW = 2, r = .31). Though the analysis is notyet finished, also within most of the groups (D) seems to bepreferred, while (I) seems to be the least preferred location.
Looking into the participant’s sketches, a heads-up dis-play (HUD) integrated into the windscreen is the most pro-posed alternative so far beside variations of the presentedlocations. Further analysis of the survey is yet to be done.
3. CONCLUSIONS AND FURTHER WORKAs a first step towards an in-vehicle ambient light display,
we conducted a brainwriting session and an online surveyto find a suitable location for the display. According to ourfindings so far, the best location is At the dashboard (D).After analysing our results, we will be able to limit the
number of prototypes that are needed to evaluate the loca-tions in a more realistic setting. Furthermore, with a largenumber of participants, we may be able to identify differentgroups of drivers that prefer different locations.
A short-term goal is to evaluate different prototypes usingdifferent light patterns to display information to the driver.In the future, we plan to use ambient light as an additionalmodality for a multimodal driver interface.
4. ACKNOWLEDGMENTSThis work was supported by the funding initiative Nieder-
sachsisches Vorab of the Volkswagen Foundation and theMinistry of Science and Culture of Lower Saxony as part ofthe Interdisciplinary Research Center on Critical SystemsEngineering for Socio-Technical Systems.
5. REFERENCES[1] E. Adell, A. Varhelyi, M. Alonso, and J. Plaza.
Developing human-machine interaction components fora driver assistance system for safe speed and safedistance. Intelligent Transport Systems, IET, 2008.
[2] C. Ho, N. Reed, and C. Spence. Multisensory in-carwarning signals for collision avoidance. Human Factors:The Journal of the Human Factors and ErgonomicsSociety, 2007.
[3] S. Kim and A. K. Dey. Simulated augmented realitywindshield display as a cognitive mapping aid for elderdriver navigation. In Proc. of CHI ’09, 2009.
[4] A. L. Kun, T. Paek, v. Medenica, N. Memarovic, andO. Palinko. Glancing at personal navigation devices canaffect driving: experimental results and designimplications. In Proc. of AutomotiveUI ’09, 2009.
[5] F. Laquai, F. Chowanetz, and G. Rigoll. A large-scaleled array to support anticipatory driving. In IEEE Int.Conf. on SMC, 2011.
[6] H. Muller, A. Kazakova, M. Pielot, W. Heuten, andS. Boll. Ambient timer – unobtrusively reminding usersof upcoming tasks with ambient light. InHuman-Computer Interaction – INTERACT 2013.Springer Berlin Heidelberg, 2013.
[7] C. D. Wickens. Multiple resources and mentalworkload. Human Factors: The Journal of the HumanFactors and Ergonomics Society, 2008.
109
Adjunct Proceedings of the 5th International Conference on Automotive User Interfaces and Interactive Vehicular Applications (AutomotiveUI ‚13), October 28–30, 2013, Eindhoven, The Netherlands.
Tactile-Acoustic Devices for Automotive SafetyApplications
Maria KaramKings College London
Department of InformaticsStrand, London, UK
ABSTRACTTactile-acoustic devices represent a class of sensory augmen-tation technology that is typically considered as an assis-tive device for increasing access to movie or music sound-tracks when hearing is limited or unavailable to an indi-vidual. However, the use of the skin as an input channelfor critical information when the visual and auditory chan-nels are engaged represents a new area of research for thistechnology. The paper presents preliminary arguments andmotivation for expanding research into sensory augmenta-tion with tactile-audio devices into automotive applicationsas a means to increase safety and awareness for drivers.
Categories and Subject DescriptorsB [Hardware]: B.4 Input/Output and Data Communica-tions—B.4.2 Input/Output Devices
KeywordsTactile-acoustic devices, driver engagement, attention, dis-traction reduction, multi-sensory interactions
1. INTRODUCTIONComputers have enabled researchers to explore the con-
cept of sensory substitution or cross-modal interactions formany interesting and creative applications to assist peoplewith disabilities access, navigate and interact with the envi-ronment using an alternative sensory modality to augmentor replace vision and sound. But these technologies canalso enhance perceptions and awareness for everyone, espe-cially when our eyes and ears are overloaded with informa-tion while operating a vehicle. The sense of touch opens upa new form of sensory display that can provide increasedaccess to environmental information in general, offering annovel form of extra-sensory information that can improveawareness and safety. This work introduces a new researchinitiative that explores the use of multi-modal tactile inter-faces to increase awareness and reduce driver distraction.
Copyright held by author(s).AutomotiveUI’13, October 28–30 2013, Eindhoven, Netherlands.Adjunct Proceedings
Driver distraction and attentionDriving represents one of the most attention-intensive ev-eryday activities we all engage in, and the technology wecan now use to improve safety and awareness, like GPS dis-plays, and ubiquitous access to email and phone calls ac-tually place additional demands on our limited visual andauditory attention resources. Though these devices help usbetter navigate and keep connected while on the road, theyserve to further distract us from the critical attention levelsneeded just to maintain our basic driving skills, and rep-resent a growing problem for all drivers. Sensory augmen-tation of visual and audio information through the tactilesenses represents an excellent opportunity to begin explor-ing ways to support this increasing influx of information thatis presented to drivers. By leveraging the ability of the skinto receive and process information that is intended for oureyes and ears, we can start to offload some demands placedin our eyes and ears to the body.
2. BACKGROUNDSeveral years of research into sensory augmentation of
sound to the tactile senses have revealed benefits worth ex-ploring that can increase driver awareness and safety. Atactile acoustic device (TAD) transfers audio information di-rectly to the body in an effort to emulate the human cochleaon the skin, and has demonstrated effective results in com-municating characteristics of sound to the tactile senses fordeaf and hard of hearing people [2]. Research into TADsalso suggest that hearing people can just as effectively pro-cess sound information through the skin, which may havevaluable applications in providing an alternative means ofreceiving information that is intended for the eyes and ears[3]. TADs present sound to the body using multiple audio-transducers in a similar way that our ears process audiosignals. For example, most existing tactile systems tend toprocess signals within the low frequency spectrum, rangingfrom 60Hz to 200Hz [1]. However, these signals are alreadyeasily detected simply by placing your hand on a speaker, oralong the door of a car when loud music is playing. TAD hasshown that the skin has a much higher capacity for process-ing audio signals, and includes the entire range of the audiospectrum to provide a potential for creating a much higherresolution form of tactile-acoustic display format using thebody. This, coupled with the available surface area of theskin provides the potential to create an exceptional alter-native to delivering safety critical information to the driverwithout placing additional demands on our eyes and ears.
110
Adjunct Proceedings of the 5th International Conference on Automotive User Interfaces and Interactive Vehicular Applications (AutomotiveUI ‚13), October 28–30, 2013, Eindhoven, The Netherlands.
MotivationOver the past 5 years, TADs have been explored as an as-sistive device, in addition to an entertainment enhancementsystem to augment sound from film, music, and gaming withtactile-sound. Studies suggest that augmenting audio-visualexperiences with tactile-sound can increase awareness, emo-tional connections, immersion, and enjoyment for users, withthe added benefit of providing accurate and important in-formation about sound through the skin alone [4]. However,it is the gaming research that has led to this move towardsautomotive applications as a safety critical device. Early re-sults from an ongoing series of usability studies involving thegame GranTurismo 5 (GT5) and TADs suggest many signif-icant benefits to driver performance, engagement, and com-mitment to the game with the addition of the tactile-sound.Although gaming is not the same as driving, the added at-tention, immersion, and information that drivers reportedexperiencing with the tactile-sound could be transferrable tothe driving safety enhancement system. The TAD systempresents the sounds from the game through chairs that areused by a driver and passenger in our gaming scenario. Thestudy presents sound from the car engine, the road noise,and game music through the TAD, using different combi-nations for the study. Each of these sound sources can beclearly identified by users, and even slight changes or disrup-tions to the sound can have a profound impact on the usersattention to that signal. This occurs even when all threesources of sound are presented through the TAD concur-rently. All of our gaming participants preferred the TAD-enabled condition, with drivers reporting feeling increasedheart rates and perceived improved scores in race times andprecision in handling the vehicle. It is anticipated that sim-ilar effects will be transferrable to actual driver scenarios,and the goal is to evaluate these effects in an actual drivingscenario to expand on the gaming research.
Research GoalsResults of previous research that show that the body caninterpret a significant amount of information about soundthrough vibrations, including detecting emotional content ofmusic [3], musical timbre [4] as well as the gender and inten-tionality of speech. Other forms of audio cues that are notdirectly based on sound have also been shown to be effectivefor providing critical information to drivers [1]. Using theTAD system as a tool for investigating and implementingtactile audio and audio-cues together in combinations andconfigurations that will potentially reduce driver distractionand increase awareness of their environment. Additionalfactors that will be explored and validated include deter-mining optimal size and placement of transducers, effects ofthe integration of audio and non-audio signals, quantitativemeasures on driver attention and distraction, and optimalcombinations of the multiple sources of audio signals.
MethodologyA combination of ethnography and empirical methods willbe applied to support the hypotheses being proposed inthis research, which focus on the use of multi-sensory stim-ulus as a means of increasing driver awareness, while re-ducing distraction. The TAD systems will be refined andadapted for use in automotive vehicles as a low cost, adapt-able multi-sensory integration tool for investigating the nu-ances of tactile-audio and audio-cues for automotive appli-
cations. Biometrics, response times, and performance mea-sures of drivers in the different sensory conditions will beconsidered, as well as driver perception, preference, and en-joyment reports, towards understanding the relationshipsand factors of the multi-sensory feedback system being pro-posed, and to explore tactile-sound as a new mode of infor-mation that can offer many distinct ways of providing ve-hicle operators with a new channel for receiving meaningfulinformation from the environment, and from the automobileitself.
Prototype DevelopmentA flexible and adaptable model of current TAD system willbe developed based on early research results towards deter-mining the critical factors of installation and integration intothe automotive system. While a plug-and-play version iscurrently in use, the aim is to develop an integrated systemthat can be adapted to integrate seamlessly with the cur-rent and existing audio sources and automobile informationsystems including surround sound, road noise, driver alerts,communication, and other feedback sources. The hardwarethat drives the signal processing to the TAD can be pow-ered using a 12V power outlet, the system comes with a suiteof audio cables, splitters, and connecters to support accessto different and multiple sources of audio signals to makeexperimental design more efficient and flexible.
3. NEXT STEPSThe auto-TAD is being used in actual driving scenarios
now, and has begun to take shape as a robust experimentaldevice that will be used in the upcoming research projects.In addition to testing and modifying the prototype, signal-processing studies will be conducted independently to pro-vide a broader understanding of the combined sound andaudio-cue signals that can support the hypotheses that tac-tile displays can improve driver safety, increase attention,and reduce distraction.
4. REFERENCES[1] M. Jeon, B. K. Davison, M. A. Nees, J. Wilson, and
B. N. Walker. Enhanced auditory menu cues improvedual task performance and are preferred with in-vehicletechnologies. In Proceedings of the 1st InternationalConference on Automotive User Interfaces andInteractive Vehicular Applications, AutomotiveUI ’09,pages 91–98, New York, NY, USA, 2009. ACM.
[2] M. Karam. The coffee lab: developing a public usabilityspace. In CHI ’10 Extended Abstracts on HumanFactors in Computing Systems, CHI EA ’10, pages2671–2680, New York, NY, USA, 2010. ACM.
[3] M. Karam, G. Nespoli, F. Russo, and D. I. Fels.Modelling perceptual elements of music in avibrotactile display for deaf users: A field study. InProceedings of the 2009 Second InternationalConferences on Advances in Computer-HumanInteractions, ACHI ’09, pages 249–254, Washington,DC, USA, 2009. IEEE Computer Society.
[4] F. A. Russo, P. Ammirante, and D. I. Fels. VibrotactileDiscrimination of Musical Timbre. Journal ofExperimental Psychology-human Perception andPerformance, 38:822–826, 2012.
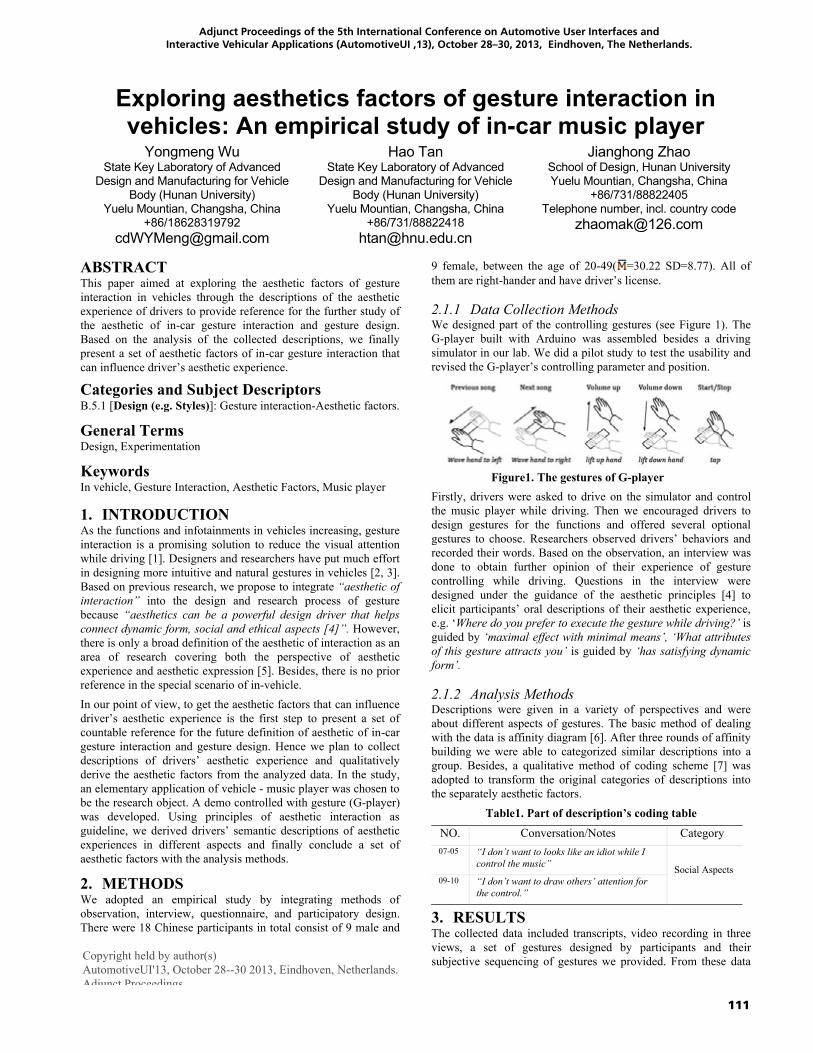
111
Adjunct Proceedings of the 5th International Conference on Automotive User Interfaces and Interactive Vehicular Applications (AutomotiveUI ‚13), October 28–30, 2013, Eindhoven, The Netherlands.
Exploring aesthetics factors of gesture interaction in vehicles: An empirical study of in-car music player
Yongmeng Wu State Key Laboratory of Advanced
Design and Manufacturing for Vehicle Body (Hunan University)
Yuelu Mountian, Changsha, China +86/18628319792
Hao Tan State Key Laboratory of Advanced
Design and Manufacturing for Vehicle Body (Hunan University)
Yuelu Mountian, Changsha, China +86/731/88822418
Jianghong Zhao School of Design, Hunan University Yuelu Mountian, Changsha, China
+86/731/88822405 Telephone number, incl. country code
ABSTRACTThis paper aimed at exploring the aesthetic factors of gesture interaction in vehicles through the descriptions of the aesthetic experience of drivers to provide reference for the further study of the aesthetic of in-car gesture interaction and gesture design. Based on the analysis of the collected descriptions, we finally present a set of aesthetic factors of in-car gesture interaction that can influence driver’s aesthetic experience.
Categories and Subject Descriptors B.5.1 [Design (e.g. Styles)]: Gesture interaction-Aesthetic factors.
General Terms Design, Experimentation
Keywords In vehicle, Gesture Interaction, Aesthetic Factors, Music player
1. INTRODUCTION As the functions and infotainments in vehicles increasing, gesture interaction is a promising solution to reduce the visual attention while driving [1]. Designers and researchers have put much effort in designing more intuitive and natural gestures in vehicles [2, 3]. Based on previous research, we propose to integrate “aesthetic of interaction” into the design and research process of gesture because “aesthetics can be a powerful design driver that helps connect dynamic form, social and ethical aspects [4]”. However, there is only a broad definition of the aesthetic of interaction as an area of research covering both the perspective of aesthetic experience and aesthetic expression [5]. Besides, there is no prior reference in the special scenario of in-vehicle. In our point of view, to get the aesthetic factors that can influence driver’s aesthetic experience is the first step to present a set of countable reference for the future definition of aesthetic of in-car gesture interaction and gesture design. Hence we plan to collect descriptions of drivers’ aesthetic experience and qualitatively derive the aesthetic factors from the analyzed data. In the study, an elementary application of vehicle - music player was chosen to be the research object. A demo controlled with gesture (G-player) was developed. Using principles of aesthetic interaction as guideline, we derived drivers’ semantic descriptions of aesthetic experiences in different aspects and finally conclude a set of aesthetic factors with the analysis methods.
2. METHODS We adopted an empirical study by integrating methods of observation, interview, questionnaire, and participatory design. There were 18 Chinese participants in total consist of 9 male and
9 female, between the age of 20-49( =30.22 SD=8.77). All of them are right-hander and have driver’s license.
2.1.1 Data Collection Methods We designed part of the controlling gestures (see Figure 1). The G-player built with Arduino was assembled besides a driving simulator in our lab. We did a pilot study to test the usability and revised the G-player’s controlling parameter and position.
Figure1. The gestures of G-playerFirstly, drivers were asked to drive on the simulator and control the music player while driving. Then we encouraged drivers to design gestures for the functions and offered several optional gestures to choose. Researchers observed drivers’ behaviors and recorded their words. Based on the observation, an interview was done to obtain further opinion of their experience of gesture controlling while driving. Questions in the interview were designed under the guidance of the aesthetic principles [4] to elicit participants’ oral descriptions of their aesthetic experience, e.g. ‘Where do you prefer to execute the gesture while driving?’ is guided by ‘maximal effect with minimal means’, ‘What attributes of this gesture attracts you’ is guided by ‘has satisfying dynamic form’.
2.1.2 Analysis Methods Descriptions were given in a variety of perspectives and were about different aspects of gestures. The basic method of dealing with the data is affinity diagram [6]. After three rounds of affinity building we were able to categorized similar descriptions into a group. Besides, a qualitative method of coding scheme [7] was adopted to transform the original categories of descriptions intothe separately aesthetic factors.
Table1. Part of description’s coding table
NO. Conversation/Notes Category 07-05 “I don’t want to looks like an idiot while I
control the music” Social Aspects 09-10 “I don’t want to draw others’ attention for
the control.”
3. RESULTSThe collected data included transcripts, video recording in three views, a set of gestures designed by participants and their subjective sequencing of gestures we provided. From these data Copyright held by author(s)
AutomotiveUI'13, October 28--30 2013, Eindhoven, Netherlands. Adjunct Proceedings

112
Adjunct Proceedings of the 5th International Conference on Automotive User Interfaces and Interactive Vehicular Applications (AutomotiveUI ‚13), October 28–30, 2013, Eindhoven, The Netherlands.
we selected 142 Chinese descriptions of in-car gestures referring participants’ aesthetic experience. With the analyzing methods, we summarized two categories of aesthetic factors that can influence the drivers’ aesthetic experience of in-car gesture interaction. Physical factors are mainly about the physical attributes of gestures while mental factors concerns drivers’ subjective aesthetic experiences and feelings.
3.1.1 Physical Factors Kinematic impulse. The kinematic impulse consists of gesture’sweight and speed. Drivers suggest the gesture have proper weight and speed as gestures too strong or fast may impact the other hand holding the steering wheel and gestures too light or slow need more time to conduct and may distract them from driving.
Complexity. Complexity is related to the gesture’s dimensionality and track. Some drivers don’t like vertical gestures because it requires much more efforts by raising arm than gestures in other dimensions. Besides, most drivers prefer gestures with easier track.
Position. The position to conduct gesture in vehicle is vital for driver’s experience because the available space for driver is limited. Their favorite position is the right and upper space of steering wheel. They mentioned this area is the most accessible and safest one to conduct gestures when driving.
Size. Size refers the range of gesture, which is closely related to the effort of conducting. Most drivers mentioned smaller gesture is better because it can be conducted with only wrist or forearm. Thus, it will save much effort.
3.1.2 Mental Factors Social aspects. Social aspect refers to socio-cultural factors including descriptions about normality and trustworthy. Drivers care about how the gesture looks like by passengers and people outside of the vehicle. They want be normal and not draw others’attention while performing the task. Besides, the gesture should be reliable without any possible misoperation.
Gesture mapping. Gesture mapping means gesture should be coherent with function in the aspects of meaning, user’sknowledge and experience, e.g. the previous experience of using a computer. Moreover, the gesture’s meaning should also be coherent with the corresponding function.
Beauty. Beauty concerns driver’s direct feelings of aesthetic gestures, which are related to the descriptions involving natural, elegant, fluency and gesture track. However, there is no agreement on the specific style of an aesthetic gesture for the various subjective perspectives. The distinction between male and female is huge, for a gesture considered to be elegant by female participants creates the opposite feelings to male. The track also affects the experience of gesture beauty. Generally, a smooth and fluent track without any sharp turn is thought to be beautiful while a decisive track is regarded to be ugly.
Mental workload. Mental workload is the efforts a driver put to understand, remember, recall and conduct a gesture while driving. It is related to the descriptions about track, comprehension, memory, and inaccuracy. As a gesture being more comprehensible, less accurate, easier to remember and recall, driver will put much less attention resources on controlling. Thus they will feel more relaxed and safer with gesture control in vehicle, which may greatly increase drivers’ aesthetic experience.
4. DISCUSSION & FUTURE WORKS In this paper we conducted an empirical study to collected drivers’ aesthetic descriptions of their experience with aesthetic principles as guideline, and finally presented a set of aesthetic factors that can affect the aesthetic experiences of in-car gesture interaction. Our ultimate research goal is to get a definition of the aesthetic of in-car gesture interaction. The current work is the very first step to explore the theme. The initial challenge for our work is whether the aesthetic factors can be derived from the descriptions of aesthetic experience. As the experience is the outcome of interaction design, we believe descriptions of aesthetic experience implied the factors that shape the final aesthetic experience, which can be a reference for further research and design. Another challenge is whether this can be a countable reference for designing gestures. The results are in a macro view and lack of specific details to help solving practical and complex design problems. What we proposed are only a small part of the whole. Besides, the relationship between physical factors and mental factors remains to be discussed as we did notice there are connections between them. The future work is to enrich, revise and verify these aesthetics factors. To explore more aesthetic factors, we plan to conduct a larger scale of study on collecting gesture behaviors involved aesthetics. In order to verify and revise the credibility of these factors, we will adopt them as a design guide in a practical project to test their effect as references. Moreover, the present experiment was done with only Chinese participants and in a lab environment. We’ll conduct a universal experiment involving people from other cultures in natural scenarios of driving to explore more countable aesthetic factors.
5. REFERENCE[1] Bach, K. M., Jæger, M. G., Skov, M. B., and Thomassen,
N. G., 2008, You Can Touch, but You Can’t Look: Interacting with In-Vehicle Systems. CHI 2008 Proceedings-Tangibles: Input & Output
[2] Tanja Döring, Dagmar Kern, Paul Marshall, Max Pfeiffer, Johannes Schöning, Volker Gruhn, Albrecht Schmidt, 2011, Gestural Interaction on the Steering Wheel-Reducing the Visual Demand, CHI 2011 • Session: Driving
[3] A. Riener and M. Rossbory, Natural and Intuitive Hand Gestures: A Substitute for Traditional Vehicle Control?Proc. AutomotiveUI, 2011.
[4] Ross, P. R., & Wensveen, S. A. G. (2010). Designing aesthetics of behavior in interaction: Using aesthetic experience as a mechanism for design. International Journal of Design, 4(2), 3-13.
[5] Petersen, M. G., & Jacob, R. J. (2008). Introduction to the special issue on the aesthetics of interaction. ACM Transactions on Computer-Human Interaction.
[6] Holztblatt, K., Wendell, J.B., and Wood, S. 2004. Rapid Contextual Design: A How - to Guide to Key Techniques for User - Centered Design. Morgan Kaufmann, San Francisco, CA. U.S.A.
[7] Tan, H., Zhu, Y., & Zhao, J. (2012). Development of an automotive user interface design knowledge system. In Proceedings of the 4th International Conference on Automotive User Interfaces and Interactive Vehicular Applications (pp. 201-208). ACM.
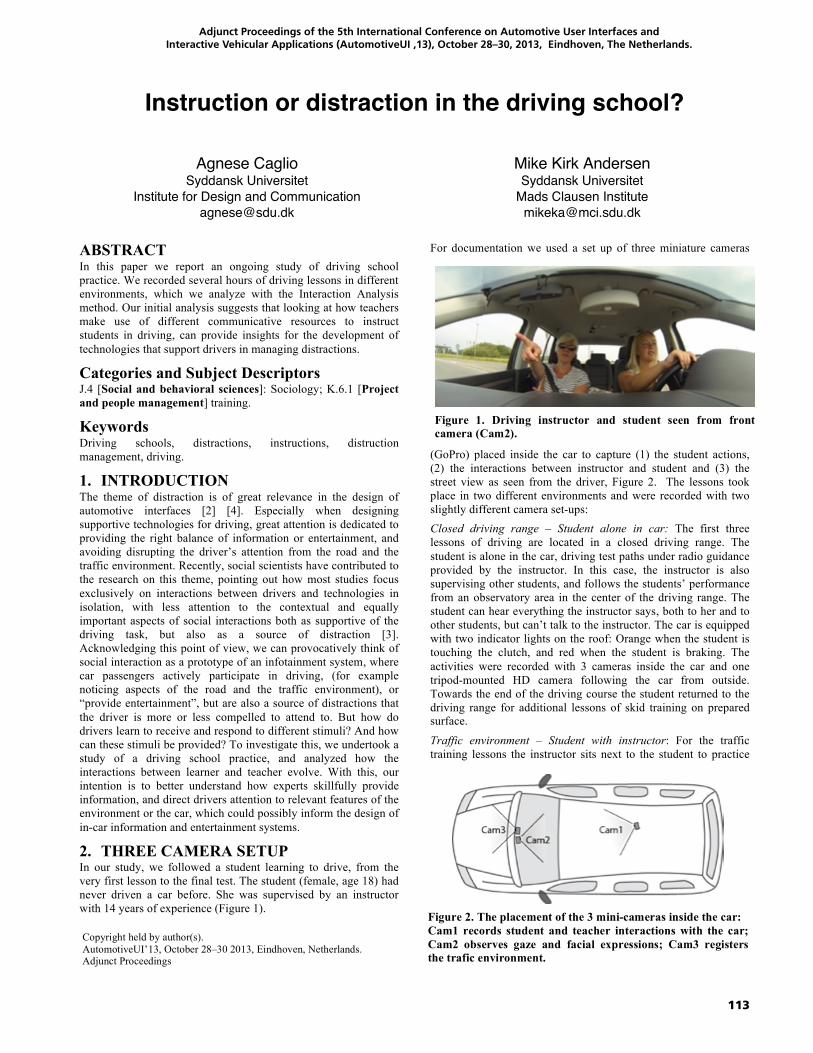
113
Adjunct Proceedings of the 5th International Conference on Automotive User Interfaces and Interactive Vehicular Applications (AutomotiveUI ‚13), October 28–30, 2013, Eindhoven, The Netherlands.
Instruction or distraction in the driving school?
Agnese Caglio Syddansk Universitet
Institute for Design and Communication [email protected]
Mike Kirk Andersen Syddansk Universitet
Mads Clausen Institute [email protected]
ABSTRACT In this paper we report an ongoing study of driving school practice. We recorded several hours of driving lessons in different environments, which we analyze with the Interaction Analysis method. Our initial analysis suggests that looking at how teachers make use of different communicative resources to instruct students in driving, can provide insights for the development of technologies that support drivers in managing distractions.
Categories and Subject Descriptors J.4 [Social and behavioral sciences]: Sociology; K.6.1 [Project and people management] training.
Keywords Driving schools, distractions, instructions, distruction management, driving.
1. INTRODUCTION The theme of distraction is of great relevance in the design of automotive interfaces [2] [4]. Especially when designing supportive technologies for driving, great attention is dedicated to providing the right balance of information or entertainment, and avoiding disrupting the driver’s attention from the road and the traffic environment. Recently, social scientists have contributed to the research on this theme, pointing out how most studies focus exclusively on interactions between drivers and technologies in isolation, with less attention to the contextual and equally important aspects of social interactions both as supportive of the driving task, but also as a source of distraction [3]. Acknowledging this point of view, we can provocatively think of social interaction as a prototype of an infotainment system, where car passengers actively participate in driving, (for example noticing aspects of the road and the traffic environment), or “provide entertainment”, but are also a source of distractions that the driver is more or less compelled to attend to. But how do drivers learn to receive and respond to different stimuli? And how can these stimuli be provided? To investigate this, we undertook a study of a driving school practice, and analyzed how the interactions between learner and teacher evolve. With this, our intention is to better understand how experts skillfully provide information, and direct drivers attention to relevant features of the environment or the car, which could possibly inform the design of in-car information and entertainment systems.
2. THREE CAMERA SETUP In our study, we followed a student learning to drive, from the very first lesson to the final test. The student (female, age 18) had never driven a car before. She was supervised by an instructor with 14 years of experience (Figure 1).
For documentation we used a set up of three miniature cameras
(GoPro) placed inside the car to capture (1) the student actions, (2) the interactions between instructor and student and (3) the street view as seen from the driver, Figure 2. The lessons took place in two different environments and were recorded with two slightly different camera set-ups: Closed driving range – Student alone in car: The first three lessons of driving are located in a closed driving range. The student is alone in the car, driving test paths under radio guidance provided by the instructor. In this case, the instructor is also supervising other students, and follows the students’ performance from an observatory area in the center of the driving range. The student can hear everything the instructor says, both to her and to other students, but can’t talk to the instructor. The car is equipped with two indicator lights on the roof: Orange when the student is touching the clutch, and red when the student is braking. The activities were recorded with 3 cameras inside the car and one tripod-mounted HD camera following the car from outside. Towards the end of the driving course the student returned to the driving range for additional lessons of skid training on prepared surface.
Traffic environment – Student with instructor: For the traffic training lessons the instructor sits next to the student to practice
Figure 1. Driving instructor and student seen from front camera (Cam2).
Figure 2. The placement of the 3 mini-cameras inside the car: Cam1 records student and teacher interactions with the car; Cam2 observes gaze and facial expressions; Cam3 registers the trafic environment.
Copyright held by author(s). AutomotiveUI’13, October 28–30 2013, Eindhoven, Netherlands. Adjunct Proceedings
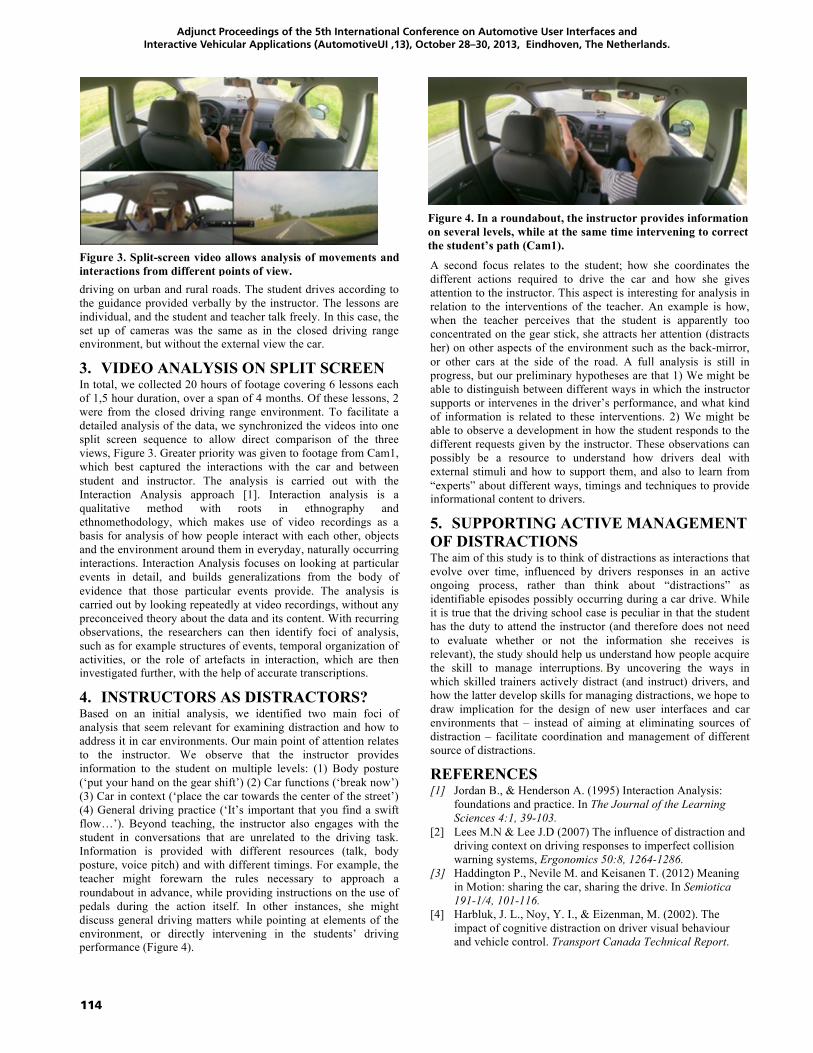
114
Adjunct Proceedings of the 5th International Conference on Automotive User Interfaces and Interactive Vehicular Applications (AutomotiveUI ‚13), October 28–30, 2013, Eindhoven, The Netherlands.
driving on urban and rural roads. The student drives according to the guidance provided verbally by the instructor. The lessons are individual, and the student and teacher talk freely. In this case, the set up of cameras was the same as in the closed driving range environment, but without the external view the car.
3. VIDEO ANALYSIS ON SPLIT SCREEN In total, we collected 20 hours of footage covering 6 lessons each of 1,5 hour duration, over a span of 4 months. Of these lessons, 2 were from the closed driving range environment. To facilitate a detailed analysis of the data, we synchronized the videos into one split screen sequence to allow direct comparison of the three views, Figure 3. Greater priority was given to footage from Cam1, which best captured the interactions with the car and between student and instructor. The analysis is carried out with the Interaction Analysis approach [1]. Interaction analysis is a qualitative method with roots in ethnography and ethnomethodology, which makes use of video recordings as a basis for analysis of how people interact with each other, objects and the environment around them in everyday, naturally occurring interactions. Interaction Analysis focuses on looking at particular events in detail, and builds generalizations from the body of evidence that those particular events provide. The analysis is carried out by looking repeatedly at video recordings, without any preconceived theory about the data and its content. With recurring observations, the researchers can then identify foci of analysis, such as for example structures of events, temporal organization of activities, or the role of artefacts in interaction, which are then investigated further, with the help of accurate transcriptions.
4. INSTRUCTORS AS DISTRACTORS? Based on an initial analysis, we identified two main foci of analysis that seem relevant for examining distraction and how to address it in car environments. Our main point of attention relates to the instructor. We observe that the instructor provides information to the student on multiple levels: (1) Body posture (‘put your hand on the gear shift’) (2) Car functions (‘break now’) (3) Car in context (‘place the car towards the center of the street’) (4) General driving practice (‘It’s important that you find a swift flow…’). Beyond teaching, the instructor also engages with the student in conversations that are unrelated to the driving task. Information is provided with different resources (talk, body posture, voice pitch) and with different timings. For example, the teacher might forewarn the rules necessary to approach a roundabout in advance, while providing instructions on the use of pedals during the action itself. In other instances, she might discuss general driving matters while pointing at elements of the environment, or directly intervening in the students’ driving performance (Figure 4).
A second focus relates to the student; how she coordinates the different actions required to drive the car and how she gives attention to the instructor. This aspect is interesting for analysis in relation to the interventions of the teacher. An example is how, when the teacher perceives that the student is apparently too concentrated on the gear stick, she attracts her attention (distracts her) on other aspects of the environment such as the back-mirror, or other cars at the side of the road. A full analysis is still in progress, but our preliminary hypotheses are that 1) We might be able to distinguish between different ways in which the instructor supports or intervenes in the driver’s performance, and what kind of information is related to these interventions. 2) We might be able to observe a development in how the student responds to the different requests given by the instructor. These observations can possibly be a resource to understand how drivers deal with external stimuli and how to support them, and also to learn from “experts” about different ways, timings and techniques to provide informational content to drivers.
5. SUPPORTING ACTIVE MANAGEMENT OF DISTRACTIONS The aim of this study is to think of distractions as interactions that evolve over time, influenced by drivers responses in an active ongoing process, rather than think about “distractions” as identifiable episodes possibly occurring during a car drive. While it is true that the driving school case is peculiar in that the student has the duty to attend the instructor (and therefore does not need to evaluate whether or not the information she receives is relevant), the study should help us understand how people acquire the skill to manage interruptions..By uncovering the ways in which skilled trainers actively distract (and instruct) drivers, and how the latter develop skills for managing distractions, we hope to draw implication for the design of new user interfaces and car environments that – instead of aiming at eliminating sources of distraction – facilitate coordination and management of different source of distractions.
REFERENCES [1] Jordan B., & Henderson A. (1995) Interaction Analysis:
foundations and practice. In The Journal of the Learning Sciences 4:1, 39-103.
[2] Lees M.N & Lee J.D (2007) The influence of distraction and driving context on driving responses to imperfect collision warning systems, Ergonomics 50:8, 1264-1286.
[3] Haddington P., Nevile M. and Keisanen T. (2012) Meaning in Motion: sharing the car, sharing the drive. In Semiotica 191-1/4, 101-116.
[4] Harbluk, J. L., Noy, Y. I., & Eizenman, M. (2002). The impact of cognitive distraction on driver visual behaviour and vehicle control. Transport Canada Technical Report.
Figure 3. Split-screen video allows analysis of movements and interactions from different points of view.
Figure 4. In a roundabout, the instructor provides information on several levels, while at the same time intervening to correct the student’s path (Cam1).

Interactive Demos

116
Adjunct Proceedings of the 5th International Conference on Automotive User Interfaces and Interactive Vehicular Applications (AutomotiveUI ‚13), October 28–30, 2013, Eindhoven, The Netherlands.
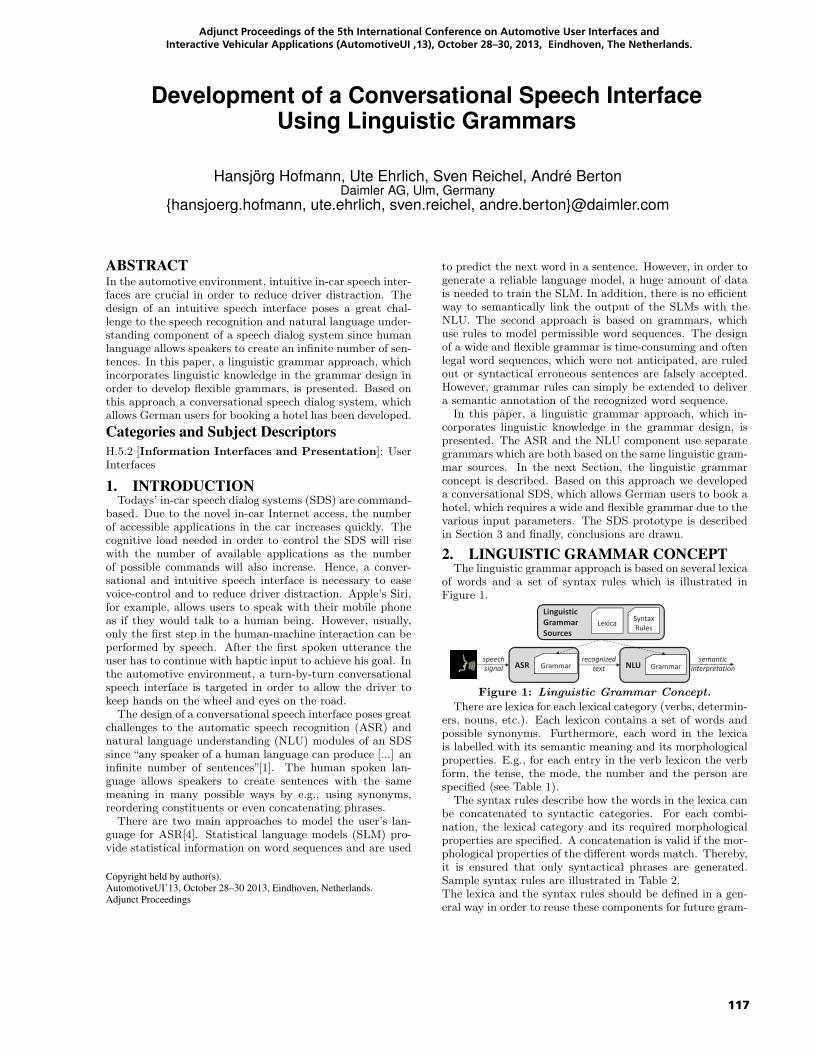
117
Adjunct Proceedings of the 5th International Conference on Automotive User Interfaces and Interactive Vehicular Applications (AutomotiveUI ‚13), October 28–30, 2013, Eindhoven, The Netherlands.
Development of a Conversational Speech InterfaceUsing Linguistic Grammars
Hansjörg Hofmann, Ute Ehrlich, Sven Reichel, André BertonDaimler AG, Ulm, Germany
{hansjoerg.hofmann, ute.ehrlich, sven.reichel, andre.berton}@daimler.com
ABSTRACTIn the automotive environment, intuitive in-car speech inter-faces are crucial in order to reduce driver distraction. Thedesign of an intuitive speech interface poses a great chal-lenge to the speech recognition and natural language under-standing component of a speech dialog system since humanlanguage allows speakers to create an infinite number of sen-tences. In this paper, a linguistic grammar approach, whichincorporates linguistic knowledge in the grammar design inorder to develop flexible grammars, is presented. Based onthis approach a conversational speech dialog system, whichallows German users for booking a hotel has been developed.
Categories and Subject DescriptorsH.5.2 [Information Interfaces and Presentation]: UserInterfaces
1. INTRODUCTIONTodays’ in-car speech dialog systems (SDS) are command-
based. Due to the novel in-car Internet access, the numberof accessible applications in the car increases quickly. Thecognitive load needed in order to control the SDS will risewith the number of available applications as the numberof possible commands will also increase. Hence, a conver-sational and intuitive speech interface is necessary to easevoice-control and to reduce driver distraction. Apple’s Siri,for example, allows users to speak with their mobile phoneas if they would talk to a human being. However, usually,only the first step in the human-machine interaction can beperformed by speech. After the first spoken utterance theuser has to continue with haptic input to achieve his goal. Inthe automotive environment, a turn-by-turn conversationalspeech interface is targeted in order to allow the driver tokeep hands on the wheel and eyes on the road.
The design of a conversational speech interface poses greatchallenges to the automatic speech recognition (ASR) andnatural language understanding (NLU) modules of an SDSsince “any speaker of a human language can produce [...] aninfinite number of sentences”[1]. The human spoken lan-guage allows speakers to create sentences with the samemeaning in many possible ways by e.g., using synonyms,reordering constituents or even concatenating phrases.
There are two main approaches to model the user’s lan-guage for ASR[4]. Statistical language models (SLM) pro-vide statistical information on word sequences and are used
Copyright held by author(s).AutomotiveUI’13, October 28–30 2013, Eindhoven, Netherlands.Adjunct Proceedings
to predict the next word in a sentence. However, in order togenerate a reliable language model, a huge amount of datais needed to train the SLM. In addition, there is no efficientway to semantically link the output of the SLMs with theNLU. The second approach is based on grammars, whichuse rules to model permissible word sequences. The designof a wide and flexible grammar is time-consuming and oftenlegal word sequences, which were not anticipated, are ruledout or syntactical erroneous sentences are falsely accepted.However, grammar rules can simply be extended to delivera semantic annotation of the recognized word sequence.
In this paper, a linguistic grammar approach, which in-corporates linguistic knowledge in the grammar design, ispresented. The ASR and the NLU component use separategrammars which are both based on the same linguistic gram-mar sources. In the next Section, the linguistic grammarconcept is described. Based on this approach we developeda conversational SDS, which allows German users to book ahotel, which requires a wide and flexible grammar due to thevarious input parameters. The SDS prototype is describedin Section 3 and finally, conclusions are drawn.
2. LINGUISTIC GRAMMAR CONCEPTThe linguistic grammar approach is based on several lexica
of words and a set of syntax rules which is illustrated inFigure 1.
Figure 1: Linguistic Grammar Concept.
There are lexica for each lexical category (verbs, determin-ers, nouns, etc.). Each lexicon contains a set of words andpossible synonyms. Furthermore, each word in the lexicais labelled with its semantic meaning and its morphologicalproperties. E.g., for each entry in the verb lexicon the verbform, the tense, the mode, the number and the person arespecified (see Table 1).
The syntax rules describe how the words in the lexica canbe concatenated to syntactic categories. For each combi-nation, the lexical category and its required morphologicalproperties are specified. A concatenation is valid if the mor-phological properties of the different words match. Thereby,it is ensured that only syntactical phrases are generated.Sample syntax rules are illustrated in Table 2.The lexica and the syntax rules should be defined in a gen-eral way in order to reuse these components for future gram-
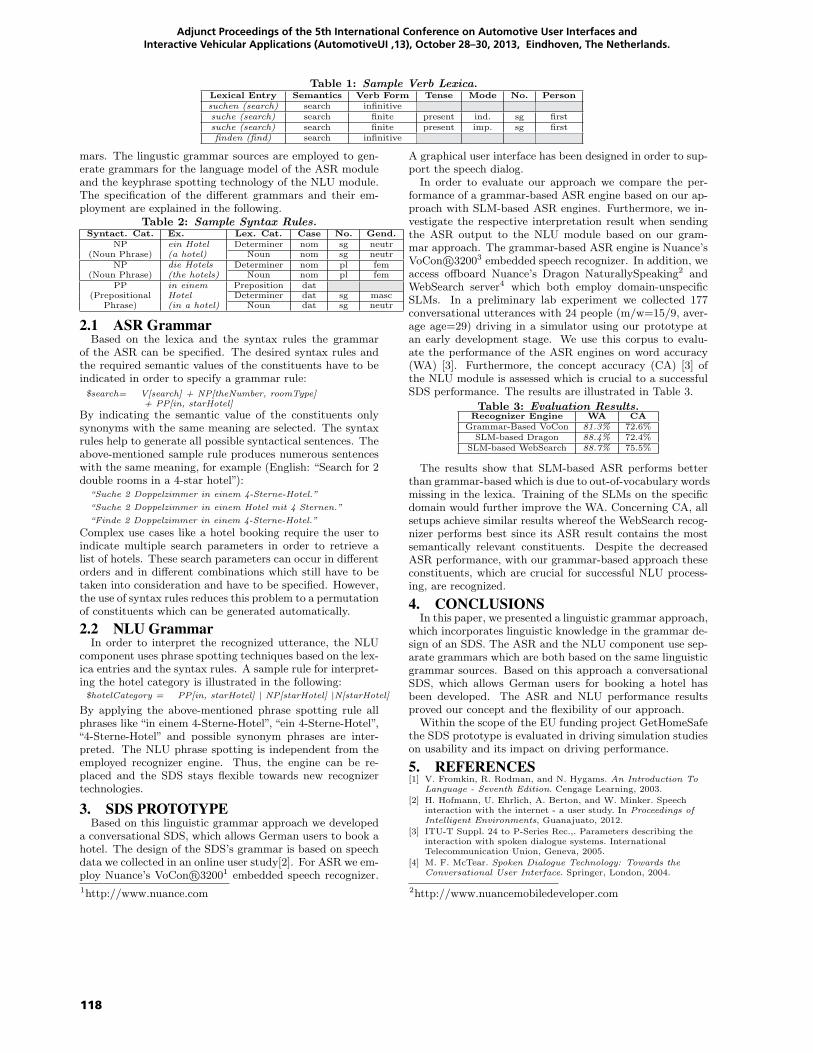
118
Adjunct Proceedings of the 5th International Conference on Automotive User Interfaces and Interactive Vehicular Applications (AutomotiveUI ‚13), October 28–30, 2013, Eindhoven, The Netherlands.
Table 1: Sample Verb Lexica.Lexical Entry Semantics Verb Form Tense Mode No. Personsuchen (search) search infinitivesuche (search) search finite present ind. sg firstsuche (search) search finite present imp. sg firstfinden (find) search infinitive
mars. The lingustic grammar sources are employed to gen-erate grammars for the language model of the ASR moduleand the keyphrase spotting technology of the NLU module.The specification of the different grammars and their em-ployment are explained in the following.
Table 2: Sample Syntax Rules.Syntact. Cat. Ex. Lex. Cat. Case No. Gend.
NP ein Hotel Determiner nom sg neutr(Noun Phrase) (a hotel) Noun nom sg neutr
NP die Hotels Determiner nom pl fem(Noun Phrase) (the hotels) Noun nom pl fem
PP in einem Preposition dat(Prepositional Hotel Determiner dat sg masc
Phrase) (in a hotel) Noun dat sg neutr
2.1 ASR GrammarBased on the lexica and the syntax rules the grammar
of the ASR can be specified. The desired syntax rules andthe required semantic values of the constituents have to beindicated in order to specify a grammar rule:
$search= V[search] + NP[theNumber, roomType]+ PP[in, starHotel]
By indicating the semantic value of the constituents onlysynonyms with the same meaning are selected. The syntaxrules help to generate all possible syntactical sentences. Theabove-mentioned sample rule produces numerous sentenceswith the same meaning, for example (English: “Search for 2double rooms in a 4-star hotel”):
“Suche 2 Doppelzimmer in einem 4-Sterne-Hotel.”
“Suche 2 Doppelzimmer in einem Hotel mit 4 Sternen.”
“Finde 2 Doppelzimmer in einem 4-Sterne-Hotel.”
Complex use cases like a hotel booking require the user toindicate multiple search parameters in order to retrieve alist of hotels. These search parameters can occur in differentorders and in different combinations which still have to betaken into consideration and have to be specified. However,the use of syntax rules reduces this problem to a permutationof constituents which can be generated automatically.
2.2 NLU GrammarIn order to interpret the recognized utterance, the NLU
component uses phrase spotting techniques based on the lex-ica entries and the syntax rules. A sample rule for interpret-ing the hotel category is illustrated in the following:$hotelCategory = PP[in, starHotel] | NP[starHotel] |N[starHotel]
By applying the above-mentioned phrase spotting rule allphrases like “in einem 4-Sterne-Hotel”, “ein 4-Sterne-Hotel”,“4-Sterne-Hotel” and possible synonym phrases are inter-preted. The NLU phrase spotting is independent from theemployed recognizer engine. Thus, the engine can be re-placed and the SDS stays flexible towards new recognizertechnologies.
3. SDS PROTOTYPEBased on this linguistic grammar approach we developed
a conversational SDS, which allows German users to book ahotel. The design of the SDS’s grammar is based on speechdata we collected in an online user study[2]. For ASR we em-ploy Nuance’s VoCon R©32001 embedded speech recognizer.1http://www.nuance.com
A graphical user interface has been designed in order to sup-port the speech dialog.
In order to evaluate our approach we compare the per-formance of a grammar-based ASR engine based on our ap-proach with SLM-based ASR engines. Furthermore, we in-vestigate the respective interpretation result when sendingthe ASR output to the NLU module based on our gram-mar approach. The grammar-based ASR engine is Nuance’sVoCon R©32003 embedded speech recognizer. In addition, weaccess offboard Nuance’s Dragon NaturallySpeaking2 andWebSearch server4 which both employ domain-unspecificSLMs. In a preliminary lab experiment we collected 177conversational utterances with 24 people (m/w=15/9, aver-age age=29) driving in a simulator using our prototype atan early development stage. We use this corpus to evalu-ate the performance of the ASR engines on word accuracy(WA) [3]. Furthermore, the concept accuracy (CA) [3] ofthe NLU module is assessed which is crucial to a successfulSDS performance. The results are illustrated in Table 3.
Table 3: Evaluation Results.Recognizer Engine WA CA
Grammar-Based VoCon 81.3% 72.6%SLM-based Dragon 88.4% 72.4%
SLM-based WebSearch 88.7% 75.5%
The results show that SLM-based ASR performs betterthan grammar-based which is due to out-of-vocabulary wordsmissing in the lexica. Training of the SLMs on the specificdomain would further improve the WA. Concerning CA, allsetups achieve similar results whereof the WebSearch recog-nizer performs best since its ASR result contains the mostsemantically relevant constituents. Despite the decreasedASR performance, with our grammar-based approach theseconstituents, which are crucial for successful NLU process-ing, are recognized.
4. CONCLUSIONSIn this paper, we presented a linguistic grammar approach,
which incorporates linguistic knowledge in the grammar de-sign of an SDS. The ASR and the NLU component use sep-arate grammars which are both based on the same linguisticgrammar sources. Based on this approach a conversationalSDS, which allows German users for booking a hotel hasbeen developed. The ASR and NLU performance resultsproved our concept and the flexibility of our approach.
Within the scope of the EU funding project GetHomeSafethe SDS prototype is evaluated in driving simulation studieson usability and its impact on driving performance.
5. REFERENCES[1] V. Fromkin, R. Rodman, and N. Hygams. An Introduction To
Language - Seventh Edition. Cengage Learning, 2003.
[2] H. Hofmann, U. Ehrlich, A. Berton, and W. Minker. Speechinteraction with the internet - a user study. In Proceedings ofIntelligent Environments, Guanajuato, 2012.
[3] ITU-T Suppl. 24 to P-Series Rec.,. Parameters describing theinteraction with spoken dialogue systems. InternationalTelecommunication Union, Geneva, 2005.
[4] M. F. McTear. Spoken Dialogue Technology: Towards theConversational User Interface. Springer, London, 2004.
2http://www.nuancemobiledeveloper.com
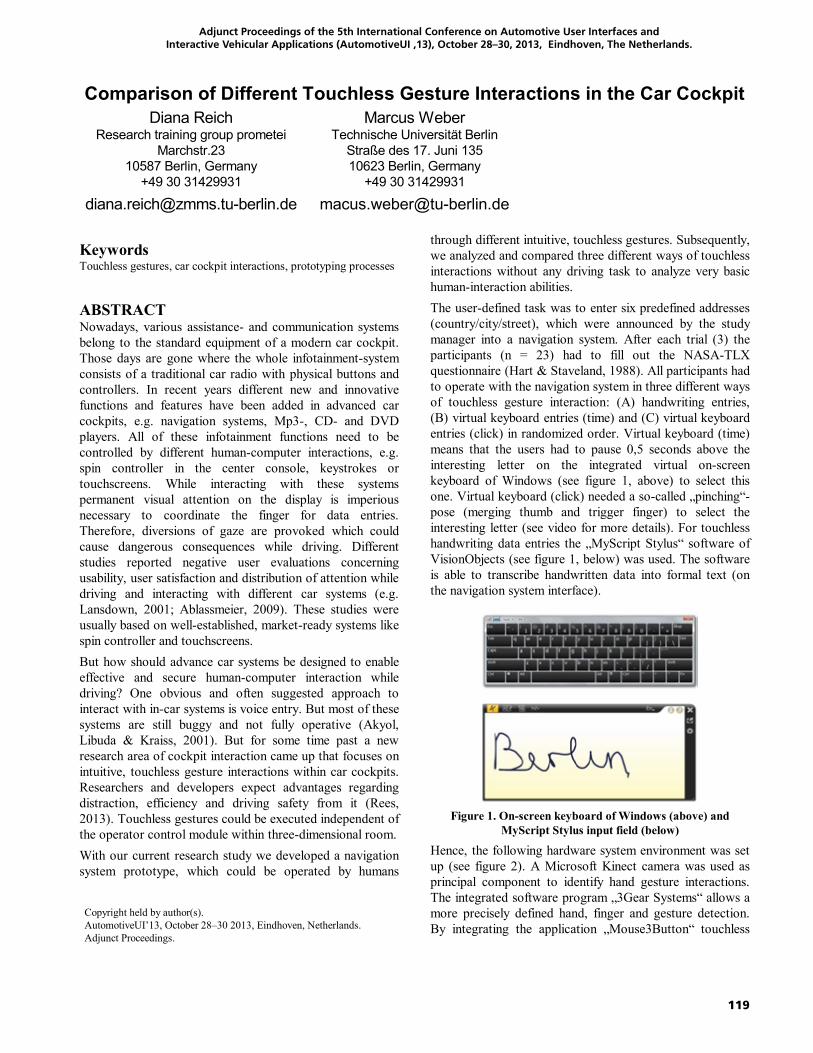
119
Adjunct Proceedings of the 5th International Conference on Automotive User Interfaces and Interactive Vehicular Applications (AutomotiveUI ‚13), October 28–30, 2013, Eindhoven, The Netherlands.
1
Comparison of Different Touchless Gesture Interactions in the Car Cockpit Diana Reich
Research training group prometei Marchstr.23
10587 Berlin, Germany +49 30 31429931
Marcus Weber Technische Universität Berlin
Straße des 17. Juni 135 10623 Berlin, Germany
+49 30 31429931
KeywordsTouchless gestures, car cockpit interactions, prototyping processes
ABSTRACTNowadays, various assistance- and communication systems belong to the standard equipment of a modern car cockpit. Those days are gone where the whole infotainment-system consists of a traditional car radio with physical buttons and controllers. In recent years different new and innovative functions and features have been added in advanced car cockpits, e.g. navigation systems, Mp3-, CD- and DVD players. All of these infotainment functions need to be controlled by different human-computer interactions, e.g. spin controller in the center console, keystrokes or touchscreens. While interacting with these systems permanent visual attention on the display is imperious necessary to coordinate the finger for data entries. Therefore, diversions of gaze are provoked which could cause dangerous consequences while driving. Different studies reported negative user evaluations concerning usability, user satisfaction and distribution of attention while driving and interacting with different car systems (e.g. Lansdown, 2001; Ablassmeier, 2009). These studies were usually based on well-established, market-ready systems like spin controller and touchscreens. But how should advance car systems be designed to enable effective and secure human-computer interaction while driving? One obvious and often suggested approach to interact with in-car systems is voice entry. But most of these systems are still buggy and not fully operative (Akyol, Libuda & Kraiss, 2001). But for some time past a new research area of cockpit interaction came up that focuses on intuitive, touchless gesture interactions within car cockpits. Researchers and developers expect advantages regarding distraction, efficiency and driving safety from it (Rees, 2013). Touchless gestures could be executed independent of the operator control module within three-dimensional room. With our current research study we developed a navigation system prototype, which could be operated by humans
through different intuitive, touchless gestures. Subsequently, we analyzed and compared three different ways of touchless interactions without any driving task to analyze very basic human-interaction abilities. The user-defined task was to enter six predefined addresses (country/city/street), which were announced by the study manager into a navigation system. After each trial (3) the participants (n = 23) had to fill out the NASA-TLX questionnaire (Hart & Staveland, 1988). All participants had to operate with the navigation system in three different ways of touchless gesture interaction: (A) handwriting entries, (B) virtual keyboard entries (time) and (C) virtual keyboard entries (click) in randomized order. Virtual keyboard (time) means that the users had to pause 0,5 seconds above the interesting letter on the integrated virtual on-screen keyboard of Windows (see figure 1, above) to select this one. Virtual keyboard (click) needed a so-called „pinching“-pose (merging thumb and trigger finger) to select the interesting letter (see video for more details). For touchless handwriting data entries the „MyScript Stylus“ software of VisionObjects (see figure 1, below) was used. The software is able to transcribe handwritten data into formal text (on the navigation system interface).
Figure 1. On-screen keyboard of Windows (above) and MyScript Stylus input field (below)
Hence, the following hardware system environment was set up (see figure 2). A Microsoft Kinect camera was used as principal component to identify hand gesture interactions. The integrated software program „3Gear Systems“ allows a more precisely defined hand, finger and gesture detection. By integrating the application „Mouse3Button“ touchless
Copyright held by author(s). AutomotiveUI’13, October 28–30 2013, Eindhoven, Netherlands. Adjunct Proceedings.
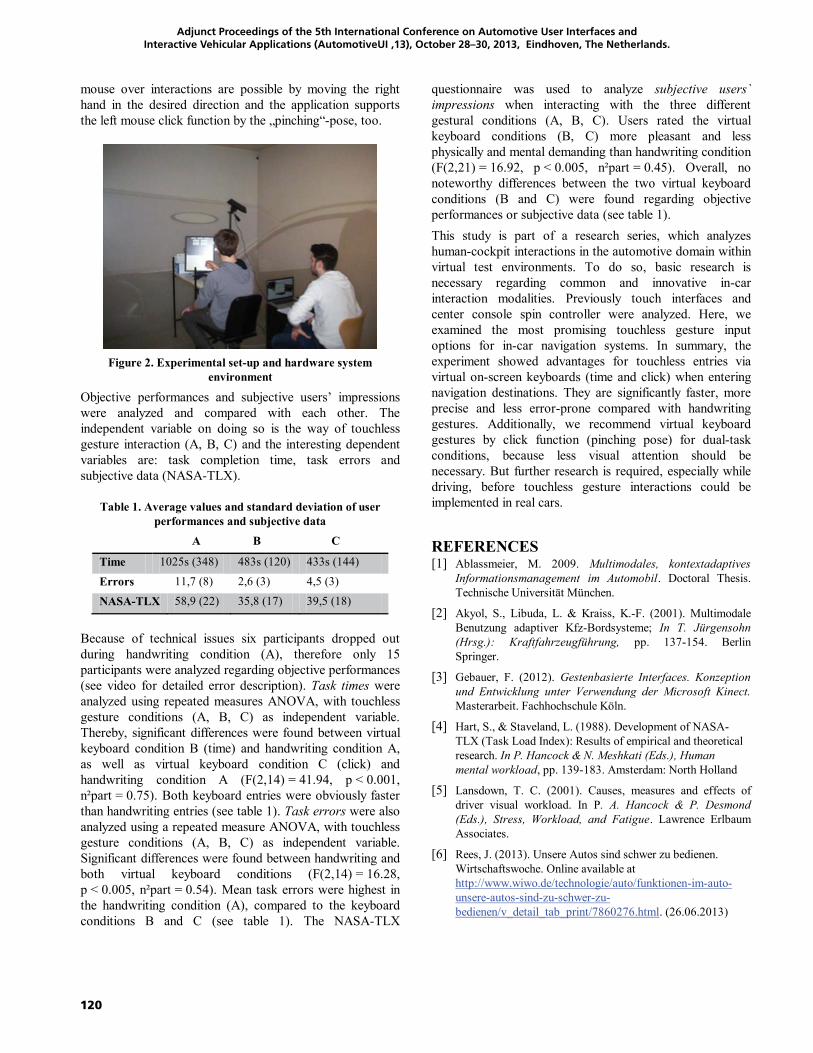
120
Adjunct Proceedings of the 5th International Conference on Automotive User Interfaces and Interactive Vehicular Applications (AutomotiveUI ‚13), October 28–30, 2013, Eindhoven, The Netherlands.
2
mouse over interactions are possible by moving the right hand in the desired direction and the application supports the left mouse click function by the „pinching“-pose, too.
Figure 2. Experimental set-up and hardware system
environment
Objective performances and subjective users’ impressions were analyzed and compared with each other. The independent variable on doing so is the way of touchless gesture interaction (A, B, C) and the interesting dependent variables are: task completion time, task errors and subjective data (NASA-TLX).
Table 1. Average values and standard deviation of user performances and subjective data
A B C
Time 1025s (348) 483s (120) 433s (144)
Errors 11,7 (8) 2,6 (3) 4,5 (3)
NASA-TLX 58,9 (22) 35,8 (17) 39,5 (18)
Because of technical issues six participants dropped out during handwriting condition (A), therefore only 15 participants were analyzed regarding objective performances (see video for detailed error description). Task times were analyzed using repeated measures ANOVA, with touchless gesture conditions (A, B, C) as independent variable. Thereby, significant differences were found between virtual keyboard condition B (time) and handwriting condition A, as well as virtual keyboard condition C (click) and handwriting condition A (F(2,14) = 41.94, p < 0.001, n²part = 0.75). Both keyboard entries were obviously faster than handwriting entries (see table 1). Task errors were also analyzed using a repeated measure ANOVA, with touchless gesture conditions (A, B, C) as independent variable. Significant differences were found between handwriting and both virtual keyboard conditions (F(2,14) = 16.28, p < 0.005, n²part = 0.54). Mean task errors were highest in the handwriting condition (A), compared to the keyboard conditions B and C (see table 1). The NASA-TLX
questionnaire was used to analyze subjective users` impressions when interacting with the three different gestural conditions (A, B, C). Users rated the virtual keyboard conditions (B, C) more pleasant and less physically and mental demanding than handwriting condition (F(2,21) = 16.92, p < 0.005, n²part = 0.45). Overall, no noteworthy differences between the two virtual keyboard conditions (B and C) were found regarding objective performances or subjective data (see table 1). This study is part of a research series, which analyzes human-cockpit interactions in the automotive domain within virtual test environments. To do so, basic research is necessary regarding common and innovative in-car interaction modalities. Previously touch interfaces and center console spin controller were analyzed. Here, we examined the most promising touchless gesture input options for in-car navigation systems. In summary, the experiment showed advantages for touchless entries via virtual on-screen keyboards (time and click) when entering navigation destinations. They are significantly faster, more precise and less error-prone compared with handwriting gestures. Additionally, we recommend virtual keyboard gestures by click function (pinching pose) for dual-task conditions, because less visual attention should be necessary. But further research is required, especially while driving, before touchless gesture interactions could be implemented in real cars.
REFERENCES [1] Ablassmeier, M. 2009. Multimodales, kontextadaptives
Informationsmanagement im Automobil. Doctoral Thesis. Technische Universität München.
[2] Akyol, S., Libuda, L. & Kraiss, K.-F. (2001). Multimodale Benutzung adaptiver Kfz-Bordsysteme; In T. Jürgensohn (Hrsg.): Kraftfahrzeugführung, pp. 137-154. Berlin Springer.
[3] Gebauer, F. (2012). Gestenbasierte Interfaces. Konzeption und Entwicklung unter Verwendung der Microsoft Kinect. Masterarbeit. Fachhochschule Köln.
[4] Hart, S., & Staveland, L. (1988). Development of NASA-TLX (Task Load Index): Results of empirical and theoretical research. In P. Hancock & N. Meshkati (Eds.), Human mental workload, pp. 139-183. Amsterdam: North Holland
[5] Lansdown, T. C. (2001). Causes, measures and effects of driver visual workload. In P. A. Hancock & P. Desmond (Eds.), Stress, Workload, and Fatigue. Lawrence Erlbaum Associates.
[6] Rees, J. (2013). Unsere Autos sind schwer zu bedienen. Wirtschaftswoche. Online available at http://www.wiwo.de/technologie/auto/funktionen-im-auto-unsere-autos-sind-zu-schwer-zu-bedienen/v_detail_tab_print/7860276.html. (26.06.2013)

121


