automotive supply chain best practice recommendation€¦ · buchanan, john ford motor company ltd...
TRANSCRIPT

Automotive Supply Chain Best Practice Recommendation
Version No: 1.0
Ref No: LG08
Date: September 2013
GUIDELINES FOR REPORTING FREIGHT
GREENHOUSE GAS EMISSIONS

GUIDELINES FOR REPORTING FREIGHT GREENHOUSE GAS EMISSIONS DOC REF NO: LG08
VERSION NO: 1.0 DATE: SEPTEMBER 2013
P a g e | 1/ 108
© Odette International Ltd
CONTRIBUTORS
These Guidelines have been written by a working party created under the auspices of Odette
International and including the following individuals:
Blechschmidt, Manja Audi AG, Germany
Buchanan, John Ford Motor Company Ltd - Project Leader
Canvin, John Odette International
Carlson, Raul Viktoria Swedish ICT, Sweden
Dagher, Elie Renault SAS, France
Dinçarslan, Özlem TOFAŞ, Turkey
Li, Yiyang Renault SAS, France
Lindgren, Sten Odette Sweden
Morbin, Robert SMMT, UK
Özkan, İbrahim TOFAŞ, Turkey
Robert, Frederic Renault SAS, France
Soderlind, Andreas Volvo Group, Sweden
Tomingas, Michael Volvo Group, Sweden
Turner, Jeff Odette International
Walker, Robert SMMT, UK
The team is very grateful to a number of other individuals for their contributions and comments
during the pre-publication review stages of this document.

GUIDELINES FOR REPORTING FREIGHT GREENHOUSE GAS EMISSIONS DOC REF NO: LG08
VERSION NO: 1.0 DATE: SEPTEMBER 2013
P a g e | 2/ 108
© Odette International Ltd
EXECUTIVE SUMMARY
Freight Greenhouse Gas (GHG) reporting is becoming an increasingly important topic for the industry
and cannot be ignored.
New standards are being published and there are rising demands for data both from external
customers and public bodies as well as to meet the internal GHG accounting objectives of companies.
These Guidelines have been published by Odette specifically for the automotive sector. They are
directed at helping all those involved to understand the basic principles and to adopt a consistent
approach that will support both recent and future standards and legislative requirements.
Rather than introducing new methodologies, these Guidelines make recommendations based on use
of the most appropriate existing initiatives. These are initiatives being adopted by industry as a whole
and so these Guidelines may be helpful to those engaged in other sectors besides automotive.
Companies may have different objectives for GHG reporting and so, as explained in these Guidelines,
may need to use different calculation methods. The over-riding principle however must be that
methods used should be clearly explained and transparent and that they should be based on publicly
recognised approaches.
6 Steps to Success:
1) Identify your reporting objectives 2) Understand the sources of your emissions 3) Select your calculation method 4) Gather required data as accurately as you can 5) Present results in an appropriate report including methodology used
and all assumptions made 6) Use publicly recognised methods and emissions factors as referenced
in these Guidelines wherever possible

GUIDELINES FOR REPORTING FREIGHT GREENHOUSE GAS EMISSIONS DOC REF NO: LG08
VERSION NO: 1.0 DATE: SEPTEMBER 2013
P a g e | 3/ 108
© Odette International Ltd
HIGH LEVEL SUMMARY OF THE GUIDELINES
The Guidelines begin with a general introduction (Section 1) and then follow with some background
information to explain why GHG reporting is becoming an increasingly important issue (Section 2).
There then follows the core sections of the Guidelines which can be used as a step by step approach to
best reporting practice, summarised below. (The methods used are based on several existing
standards for Greenhouse Gas Reporting, referenced in Section 4).
Final sections of these guidelines cover strategies for reducing emissions (Section 9) and a discussion
on future trends in GHG reporting (Section 10).
KEY STEPS TO FREIGHT GREENHOUSE GAS REPORTING
1) Identify your reporting objectives Refer Section 3
This may be to answer requests from external sources or for your own internal needs
Sections 3.2-3.4 explain different aspects to consider, depending on your objectives
(Section 3.3.1 introduces the French Decree)
2) Understand the sources of your emissions Refer Section 5 Breakdown your operations into systems/ sub-systems
If your freight emissions are to be part of wider company reporting then the Greenhouse Gas Protocol framework can be used as explained in Section 5.3
Align your approach with your objectives- Section 5.4
3) Select your calculation method Refer Section 6
Generate a best estimate of fuel used and then calculate the resulting emissions as explained in Section 6.1
As a default, Odette recommend following the CEN methodology as described in Section 6.2. This section also discusses assumptions required and methods of allocating emissions for shared transport
4) Gather required data Refer Section 7
Accuracy of results will depend on quality of data available
Section 7.1 defines the different accuracy levels that may be used
Section 7.2 discusses ways of collecting the necessary data
Section 7.3 explains where to get appropriate emissions factors to use for the calculations

GUIDELINES FOR REPORTING FREIGHT GREENHOUSE GAS EMISSIONS DOC REF NO: LG08
VERSION NO: 1.0 DATE: SEPTEMBER 2013
P a g e | 4/ 108
© Odette International Ltd
5) Present results in an appropriate report Refer Section 8
Makes sure all necessary explanations and references are submitted with your report
Section 8.2 identifies aspects to include within an internal report
Section 8.3 identifies how to specify reporting requirements between different parties
Section 8.4 looks at reporting requirements for the French Decree
Section 8.5 explores how in the future EDI might be used for sharing of emissions data
6) Use publicly recognised methods Refer Section 11
Use the methods and data sources referenced in these guidelines wherever possible

GUIDELINES FOR REPORTING FREIGHT GREENHOUSE GAS EMISSIONS DOC REF NO: LG08
VERSION NO: 1.0 DATE: SEPTEMBER 2013
P a g e | 5/ 108
© Odette International Ltd
CONTENTS
CONTRIBUTORS .......................................................................................................................................... 1
EXECUTIVE SUMMARY ............................................................................................................................... 2
HIGH LEVEL SUMMARY OF THE GUIDELINES ............................................................................................. 3
Key Steps to Freight Greenhouse Gas Reporting .................................................................................. 3
CONTENTS .................................................................................................................................................. 5
APPENDICES ............................................................................................................................................... 9
LIST OF FIGURES AND TABLES .................................................................................................................. 10
1. INTRODUCTION ............................................................................................................................... 12
1.1 Purpose .................................................................................................................................... 12
1.2 Objectives for Reporting .......................................................................................................... 12
1.3 Development of Standards ...................................................................................................... 13
1.4 Scope of the Guidelines ........................................................................................................... 14
1.4.1 Who is the audience?....................................................................................................... 14
1.4.2 Guideline objectives ......................................................................................................... 14
1.4.3 What is involved? ............................................................................................................. 14
1.5 Auditing .................................................................................................................................... 15
1.6 General Recommendation ....................................................................................................... 15
2. BACKGROUND TO GREENHOUSE GAS REPORTING ......................................................................... 16
2.1 Climate change is a reality ....................................................................................................... 16
2.2 The science of the greenhouse effect ...................................................................................... 16
2.3 Which gases should be considered? ........................................................................................ 16
2.4 The significance of CO2 ............................................................................................................ 17
2.5 Road transport and freight’s contribution ............................................................................... 17
2.6 Energy stakes ........................................................................................................................... 19

GUIDELINES FOR REPORTING FREIGHT GREENHOUSE GAS EMISSIONS DOC REF NO: LG08
VERSION NO: 1.0 DATE: SEPTEMBER 2013
P a g e | 6/ 108
© Odette International Ltd
2.7 Policy action to limit climate change ....................................................................................... 19
2.8 Future risks ............................................................................................................................... 20
3. RESPONSIBILITIES & OBJECTIVES FOR REPORTING ......................................................................... 21
3.1 Overview of roles in the supply chain ...................................................................................... 21
3.2 Objectives for reporting ........................................................................................................... 22
3.3 External demands .................................................................................................................... 22
3.3.1 Legal obligations (including the French Decree) .............................................................. 22
3.3.2 Customer requests ........................................................................................................... 23
3.3.3 Corporate Social Responsibility reporting ....................................................................... 24
3.3.4 Industry benchmarking .................................................................................................... 25
3.4 Internal demands ..................................................................................................................... 25
4. STANDARDS FOR GHG REPORTING ................................................................................................. 26
4.1 General standards on GHG measurement and reporting ........................................................ 26
4.2 Standards to support GHG data acquisition ............................................................................ 27
4.3 The CEN Standard .................................................................................................................... 27
4.4 Additional information sources and reporting guidance ......................................................... 27
5. SYSTEMS APPROACH TO ANALYSING EMISSIONS ........................................................................... 28
5.1 The need for a systems approach ............................................................................................ 28
5.2 Sources of logistics emissions within the Automotive Industry .............................................. 28
5.3 Systems breakdown of typical transport operations ............................................................... 29
5.4 Use of the Greenhouse Gas Protocol to categorise emissions ................................................ 30
5.5 Breaking down the system into smaller sub-systems .............................................................. 31
5.6 Which gas emissions to consider within the calculations? ...................................................... 35
5.7 Conclusions & recommendations ............................................................................................ 36
6. CALCULATION METHODOLOGY ....................................................................................................... 38
6.1 Principle of calculation ............................................................................................................. 38

GUIDELINES FOR REPORTING FREIGHT GREENHOUSE GAS EMISSIONS DOC REF NO: LG08
VERSION NO: 1.0 DATE: SEPTEMBER 2013
P a g e | 7/ 108
© Odette International Ltd
6.2 Calculation methodology according to CEN Standard ............................................................. 39
6.2.1 Step 1: Describe the legs .................................................................................................. 39
6.2.2 Step 2: Define the VOS and perform the calculations ..................................................... 39
6.2.3 Allocation ......................................................................................................................... 40
6.2.4 Step 3: Summing of all legs .............................................................................................. 41
6.2.5 Calculation example ......................................................................................................... 41
6.3 Methods to use when comparing different scenarios ............................................................. 43
6.3.1 Comparison of total emissions......................................................................................... 43
6.3.2 Calculation of relative emissions impact ......................................................................... 43
6.4 Automating the calculation process ........................................................................................ 44
7. DATA ACQUISITION ......................................................................................................................... 46
7.1 Accuracy levels ......................................................................................................................... 46
7.1.1 Accuracy levels within the CEN Standard ........................................................................ 46
7.1.2 Accuracy levels according to the French Decree ............................................................. 47
7.1.3 Accuracy levels considered by DEFRA/ GHG Protocol ..................................................... 48
7.1.4 Selecting the calculation method to suit data availability ............................................... 49
7.2 Collecting operational data ...................................................................................................... 50
7.2.1 Sources of operational data ............................................................................................. 50
7.2.2 Choices for collection of data .......................................................................................... 53
7.2.3 Templates for gathering data .......................................................................................... 53
7.2.4 Data for rail freight........................................................................................................... 54
7.2.5 Data for sea freight .......................................................................................................... 54
7.2.6 Data for air freight ........................................................................................................... 55
7.3 Selecting emissions factors ...................................................................................................... 55
7.3.1 Fuel factors ....................................................................................................................... 55
7.3.2 Parameter-based emission factors .................................................................................. 56
GUIDELINES FOR REPORTING FREIGHT GREENHOUSE GAS EMISSIONS DOC REF NO: LG08
VERSION NO: 1.0 DATE: SEPTEMBER 2013
P a g e | 8/ 108
© Odette International Ltd
7.3.3 Which emissions factors to use ....................................................................................... 59
8. REPORTING GUIDANCE ................................................................................................................... 60
8.1 Different types of reporting ..................................................................................................... 60
8.2 Reporting principles ................................................................................................................. 61
8.3 First steps in reporting ............................................................................................................. 61
8.4 Internal reporting ..................................................................................................................... 62
8.5 Reporting between different parties ....................................................................................... 62
8.5.1 Legal requirements (including the French Decree).......................................................... 63
8.5.2 Commercial agreements on reporting requirements ...................................................... 64
8.6 Electronic exchange of emissions data .................................................................................... 67
8.7 Energy usage reporting ............................................................................................................ 68
9. STRATEGIES FOR REDUCING EMISSIONS......................................................................................... 69
9.1 Establishing a baseline ............................................................................................................. 69
9.2 Use of metrics .......................................................................................................................... 69
9.3 Opportunities for improvement .............................................................................................. 70
9.4 Benefits of a strategic approach .............................................................................................. 71
10. FUTURE TRENDS ........................................................................................................................... 72
10.1 Government actions ................................................................................................................ 72
10.1.1 CO2 reduction commitments ........................................................................................... 72
10.1.2 Freight CO2 reporting ....................................................................................................... 72
10.1.3 Carbon taxation................................................................................................................ 73
10.1.4 Carbon trading ................................................................................................................. 73
10.1.5 Vehicle emissions standards ............................................................................................ 74
10.1.6 Clean air zones ................................................................................................................. 75
10.1.7 Infrastructure improvements .......................................................................................... 75
10.2 Shareholder interests ............................................................................................................... 75

GUIDELINES FOR REPORTING FREIGHT GREENHOUSE GAS EMISSIONS DOC REF NO: LG08
VERSION NO: 1.0 DATE: SEPTEMBER 2013
P a g e | 9/ 108
© Odette International Ltd
10.3 Customer information demands .............................................................................................. 78
10.4 Technological trends ................................................................................................................ 78
10.4.1 Speed reduction, Eco driving ........................................................................................... 79
10.4.2 Equipment improvements ............................................................................................... 79
10.4.3 Systems developments .................................................................................................... 79
10.4.4 Cleaner powertrains ......................................................................................................... 80
10.5 Sector initiatives....................................................................................................................... 80
11. REFERENCE INFORMATION .......................................................................................................... 82
11.1 General standards for GHG measurement and reporting ....................................................... 82
11.1.1 ISO Standards ................................................................................................................... 82
11.1.2 Global Reporting Initiative ............................................................................................... 84
11.1.3 Greenhouse Gas Protocol ................................................................................................ 84
11.2 STANDARDS SPECIFIC FOR FREIGHT GHG REPORTING ............................................................ 85
11.2.1 CEN Standard ................................................................................................................... 85
11.2.2 French Decree .................................................................................................................. 85
11.2.3 UK DEFRA Guidance ......................................................................................................... 85
11.3 Datasets for use in GHG calculations ....................................................................................... 86
11.4 Other relevant freight GHG initiatives ..................................................................................... 87
APPENDICES
APPENDIX 1: Reporting logistics emissions within the framework of the GHG Protocol ........................ 90
APPENDIX 2: Further examples of calculations in line with the French Decree ...................................... 93
1 Railway transport .............................................................................................................................. 93
Level 1- Default values .................................................................................................................... 93
Level 3 -Transport Operator’s average values ................................................................................ 94

GUIDELINES FOR REPORTING FREIGHT GREENHOUSE GAS EMISSIONS DOC REF NO: LG08
VERSION NO: 1.0 DATE: SEPTEMBER 2013
P a g e | 10/ 108
© Odette International Ltd
2 Air transport ..................................................................................................................................... 95
Level 1-Default values ..................................................................................................................... 95
Level 3 Transport Operator’s average values ................................................................................. 96
APPENDIX 3: Examples of GHG reporting formats .................................................................................. 97
APPENDIX 4: Glossary of terms .............................................................................................................. 101
LIST OF FIGURES AND TABLES
Figure N°1: Final energy consumption by sector 2010 ......................................................................... 18
Figure N°2: Final energy consumption by mode of transport 2010 (% of Mtoe*total)........................ 18
Figure N°3: Evolution of light duty vehicle CO2 standards in different countries (ICCT) ...................... 19
Figure N°4: Overview of roles in supply chain from a GHG reporting perspective .............................. 21
Figure N°5: The three scopes of emissions defined by the Greenhouse Gas Protocol ........................ 30
Figure N°6 Example of freight transport in the life cycle of a car ......................................................... 32
Figure N°7: Example of transport chains with transport legs and parties involved ............................. 33
Figure N°8: The Well to Wheel approach to fuel life cycle analysis ..................................................... 36
Figure N°9: Example of emissions calculation (Level 1) ........................................................................ 42
Figure N°10: Example of spreadsheet to support emissions calculations from shipments of finished
vehicles by road .................................................................................................................................... 45
Figure N°11: DEFRA Calculation Diagram ............................................................................................. 50
Table N°1: Strategies for data collection/ calculation .......................................................................... 53
Figure N°12: Basic model for communicating and fulfilling GHG reporting demands ......................... 60
Table N°2: Basic requirements for a reporting agreement .................................................................. 64
Table N°3: Examples of technical data formats .................................................................................... 68
Figure N°13: Keys parameters for improvements ................................................................................ 70
Table N°4: Frequently encountered sustainability reporting initiatives ............................................... 76
Figure N°14: Life cycle of a vehicle ....................................................................................................... 83
GUIDELINES FOR REPORTING FREIGHT GREENHOUSE GAS EMISSIONS DOC REF NO: LG08
VERSION NO: 1.0 DATE: SEPTEMBER 2013
P a g e | 11/ 108
© Odette International Ltd
Table N°5: Examples of the three emission scopes .............................................................................. 90
Table N°6 GHG Protocol Scope 3 categories......................................................................................... 91
Table N°7: Examples of different sources of logistics related emissions .............................................. 92
Table N°8: Default values for railway transportation ........................................................................... 93
Table N°9: Energy source emission factors ........................................................................................... 94
Table N°10: Fuel consumption for different sized aircraft over different distances ............................ 95

GUIDELINES FOR REPORTING FREIGHT GREENHOUSE GAS EMISSIONS DOC REF NO: LG08
VERSION NO: 1.0 DATE: SEPTEMBER 2013
P a g e | 12/ 108
© Odette International Ltd
1. INTRODUCTION
This section considers the objectives of these Guidelines and the benefits that may be gained by using a
standardised approach to freight greenhouse gas reporting.
1.1 PURPOSE
This publication is intended to improve understanding of the relevance of freight greenhouse gas
(GHG) emissions to the automotive industry and to provide clear guidance on the steps needed to
produce high quality emissions reports*.
Freight transport has a number of environmental impacts besides GHG emissions, such as resource
use, noise, traffic congestion, land usage and emission of other pollutants such as NOX, SOX and
particulates. These Guidelines are focussed on GHG emissions. Nevertheless, it should be noted that
actions to reduce GHG emissions by making freight more efficient usually have positive benefits in
reducing other environmental impacts as well.
This document is designed to provide help in using established methods of calculation and sources of
emission data that are in general use in the freight industry, rather than introducing a new process
specific for the automotive industry.
* The term “Greenhouse Gas” refers to Carbon Dioxide and other climate change gases recognised as
contributing to global warming- see Section 2.3 for fuller details
1.2 OBJECTIVES FOR REPORTING
There are various and increasing demands for information on freight GHG emissions, including:
External demands:
Legal obligations
Customer requests
Corporate social responsibility surveys
Industry benchmarking
Internal demands:
Identifying opportunities for cutting carbon and improving efficiencies
Assessing the carbon impact of logistics decisions and investments
Measuring changes in carbon emissions through time
Comparison/ evaluation of transport suppliers
Transport emissions are to be part of a mandatory government emissions reporting scheme in France
from 1st October 2013 and other governments are likely to introduce similar measures.

GUIDELINES FOR REPORTING FREIGHT GREENHOUSE GAS EMISSIONS DOC REF NO: LG08
VERSION NO: 1.0 DATE: SEPTEMBER 2013
P a g e | 13/ 108
© Odette International Ltd
In order to support the ambitious carbon reduction targets that governments have set for 2020 and
beyond, individual companies operating within the automotive sector will need to implement carbon
reduction strategies over the next few years. Many industry sectors and companies have already
begun the early stages of this process, analysing their GHG emissions and exploring options for
reducing them.
GHG reporting requirements are also becoming more frequent in the business environment due to:
Voluntary initiatives related to brand image and/or ISO 14000 environmental management
systems
Legal and/or commercial requirements for procurement of transport services or products
In a commercial relationship, reporting requirements, if they are applied, have often been given in
many different ways since there are various definitions and calculation methods available. Reporting,
if carried out, is often not an integrated part of normal business processes. As a result, there is a
growing demand for the kind of harmonisation offered in these Guidelines from a business point of
view.
A more standardised, and from an administrative point of view, a more efficient procedure for
handling freight GHG reporting is necessary for the continuous improvement of automotive industry
freight transport.
1.3 DEVELOPMENT OF STANDARDS
Efforts have been made internationally to standardise the measurement and reporting of GHG
emissions in order to make life simpler and to ensure comparability of results. While there is no single
agreed standard, the two main standards developed by the World Business Council on Sustainable
Development / World Resources Institute (2004) (the Greenhouse Gas Protocol) and International
Standards Organisation (ISO 14064) are broadly similar.
Both set out Guidelines for the carbon auditing of individual businesses and provide advice on the
scoping of the calculation, data collection methods and the allocation of emissions. Neither, however,
provides detailed guidance on how to measure and acquire the data needed to calculate the carbon
emissions from specific activities, such as transport. ISO published a standard for structuring the
handling of quantitative environmental information in 2012, and a separate initiative by CEN, the
European Committee for Standardisation, for calculation of freight GHG emissions was published in
January 2013. If the European Commission issues any Directives relating to GHG reporting of transport
it is likely that the latter will be the reference document.
In the meantime, various data and forms of advice are available on calculations and emissions
reporting of transport operations from government departments/other agencies, such as DEFRA in the
UK, ADEME in France, NTM in Sweden or UBA in Germany and national standards bodies, such as the
British Standards Institution and the French AFNOR.

GUIDELINES FOR REPORTING FREIGHT GREENHOUSE GAS EMISSIONS DOC REF NO: LG08
VERSION NO: 1.0 DATE: SEPTEMBER 2013
P a g e | 14/ 108
© Odette International Ltd
In the absence of agreed data and measurement standards, however, there is a danger that individual
sectors will adopt standards and procedures that produce inconsistent results. These Odette
Guidelines consider different ways in which data for calculations of carbon emissions from freight
transport might be measured and acquired. Using those as a basis, they recommend best practices for
carbon foot-printing for automotive transport operations.
1.4 SCOPE OF THE GUIDELINES
These Guidelines focus on freight operations, including transport of raw materials, finished parts and
complete vehicles. The advice is applicable to all modes of freight transport- road, rail, river, canal, sea
and air. While the general principles are also relevant to reporting emissions from other elements of
the logistics processes, such as warehousing and packaging, these are not covered explicitly.
1.4.1 WHO IS THE AUDIENCE?
This Guideline is aimed at all professionals involved in transportation within the European Automotive
Industry. It includes:
Vehicle manufacturers
Suppliers, logistics service providers and freight transport operators
Other participants who have an interest in transportation: governments, city councils, legal
institutions etc….
Those who specify and purchase transport services and receive the GHG emissions
information.
1.4.2 GUIDELINE OBJECTIVES
To provide clear overall guidance on automotive freight emissions reporting to any interested
parties
To address in more detail the difficulties to be encountered in gathering and allocating data
and calculating and reporting emissions within what can be complex supply chains
To assist the customers of freight transport operators in specifying reporting requirements
and to help them in verifying the results
To encourage a standardised approach, leading to a more level playing field in the reporting
and comparison of emissions within the automotive freight sector
To advance the collaboration between shippers and carriers in working to reduce overall levels
of emissions and improve the environmental footprint of the automotive logistics sector
1.4.3 WHAT IS INVOLVED?
Calculating and reporting the GHG emissions from freight transport operations need not be difficult,
and can have multiple business benefits. Fundamentally, measuring the GHG emissions from transport
is based on measuring or estimating fuel use for the transport work, and as such is aligned with good
logistics and fuel management practices – and all the cost savings this can bring.

GUIDELINES FOR REPORTING FREIGHT GREENHOUSE GAS EMISSIONS DOC REF NO: LG08
VERSION NO: 1.0 DATE: SEPTEMBER 2013
P a g e | 15/ 108
© Odette International Ltd
Key requirements are:
Identification of the operations that produce freight-related emissions
Adoption of an appropriate calculation methodology and set of related assumptions, including
selection of an appropriate set of emissions factors
Gathering of data to quantify the level of activity
Use of a reporting format that clearly explains the source and quality of the data used and
gives recipients an unambiguous and authoritative response to their enquiries
1.5 AUDITING
It is anticipated that as the subject of emissions reporting grows in significance, freight GHG reporting
will increasingly be of interest to external auditors.
It is therefore of key importance that the integrity of emissions reporting can be demonstrated
through using approaches such as those outlined in these Guidelines.
1.6 GENERAL RECOMMENDATION
It is recommended to adopt GHG reporting for freight activities as a routine practice within all
automotive related companies by applying the basic principles and approach within this document.
The benefits will be:
Use of recognised methods that can be used to answer information requests from
customers, government bodies and contribute to the whole company carbon footprint
Alignment to new French legislation and European CEN standard
Ability to support Corporate Sociability/Sustainability surveys without duplication of effort
Alignment with other industry sectors.

GUIDELINES FOR REPORTING FREIGHT GREENHOUSE GAS EMISSIONS DOC REF NO: LG08
VERSION NO: 1.0 DATE: SEPTEMBER 2013
P a g e | 16/ 108
© Odette International Ltd
2. BACKGROUND TO GREENHOUSE GAS REPORTING
This section provides an overview of the nature of Greenhouse Gases, their relationship to climate
change and the significance of transport emissions.
2.1 CLIMATE CHANGE IS A REALITY
Our planet has undergone climate change throughout its history as a result of natural factors like
changes in the Earth's path around the sun, volcanic activity and fluctuations in weather systems.
However, there is an overwhelming scientific consensus that climate change is now happening at a
rate we should be concerned about and that it is being accelerated as a result of human activity.
Humans are having an increasing influence through burning fossil fuels, cutting down forests and
changing farming practices. “Climate change is one of the greatest challenges of our time”, according
to the United Nations Framework Convention on Climate Change (UNFCCC), Copenhagen Protocol,
2009). 2000–09 was the warmest decade on record, and 2010 matched 2005 and 1998 as the equal
warmest year.
2.2 THE SCIENCE OF THE GREENHOUSE EFFECT
As the sun's energy warms up the Earth, our planet radiates some of this heat back out into space.
Certain gases in the upper atmosphere act like the glass in a greenhouse, allowing the sun's energy in
but preventing heat from escaping.
Some gases with a greenhouse effect, such as water vapour - the most abundant - are naturally
present in the atmosphere; without them, the Earth's average temperature would be an unbearably
cold -18oC instead of the +15oC it is today.
However, human activities are releasing immense additional amounts of greenhouse gases into the
atmosphere, enhancing the greenhouse effect and warming the climate.
2.3 WHICH GASES SHOULD BE CONSIDERED?
A variety of gases are considered by scientists to contribute to the greenhouse effect. The
Intergovernmental Panel on Climate Change (IPCC) agreed on a list at the Kyoto Climate Conference of
6 Greenhouse Gases of principal concern.
It is this set of Greenhouse Gases that is generally considered in GHG reporting activities and which is
included in these Guidelines. Each of these gases has a different relative contribution to the
Greenhouse Effect, which is quantified in terms of a figure, the ‘global warming potential’ (gwp) that
compares the impact with that of CO2.

GUIDELINES FOR REPORTING FREIGHT GREENHOUSE GAS EMISSIONS DOC REF NO: LG08
VERSION NO: 1.0 DATE: SEPTEMBER 2013
P a g e | 17/ 108
© Odette International Ltd
These 6 principal Greenhouse Gases, along with their global warming potentials, are:
Carbon Dioxide (CO2) gwp= 1
Methane (CH4) gwp= 56
Nitrous Oxide (N2O) gwp= 280
Hydrofluorocarbons (HFCs) gwp= 460-9100
Perfluorocarbons (PFCs) gwp= 4400-6200
Sulphur Hexafluoride (SF6) gwp= 16300
Note: the gwps cited here are the values recognised by the UNFCCC on their website 1/7/2013 and are based on a 20 year
horizon.
2.4 THE SIGNIFICANCE OF CO2
Of these greenhouse gases, the one most commonly produced by human activities is carbon dioxide
(CO2). It is responsible for 63% of man-made global warming. The principal cause is the combustion of
fossil fuels - coal, oil and gas.
Over the past couple of centuries, our societies have burnt increasing amounts of these fossil fuels to
power machines, generate electricity, heat buildings and transport people and goods. There is now
almost 40% more CO2 in the atmosphere than there was before the industrial revolution; the highest
level seen in at least the last 800,000 years.
Besides CO2, vehicle emissions also contain some methane. The majority of fuel currently used in
freight transport is diesel and the quantity of methane produced is small. However, due to methane’s
much higher relative global warming potential, its effect still needs to be considered. In particular,
methane should be considered when comparing the use of alternative fuels, as for example, natural
gas/ biogas exhaust contains a much higher percentage of methane than does that of petrol and
diesel.
Small quantities of other Greenhouse Gases can escape from air conditioning systems (‘fugitive
emissions’). This can be significant where refrigerated transport is used, however as this form of
transport is generally not used within the automotive industry it is not of major concern here.
The impact of GHG gases is handled by using a ‘CO2 equivalent’ factor. This is explained in more detail
in Section 5.6.
2.5 ROAD TRANSPORT AND FREIGHT’S CONTRIBUTION
The transport sector consumes more energy than any other in the European Union (EU), even more
than the power generation sector (see Figure 1). While greenhouse gas emissions in other sectors
decreased 15% between 1990 and 2007, emissions from transport (road, sea, air) increased 36%
during the same period. This increase has happened despite improved vehicle efficiency because the
amount of personal and freight transport has increased.

GUIDELINES FOR REPORTING FREIGHT GREENHOUSE GAS EMISSIONS DOC REF NO: LG08
VERSION NO: 1.0 DATE: SEPTEMBER 2013
P a g e | 18/ 108
© Odette International Ltd
As we can see in Figure 1, nearly one third of final energy consumption by sector in 2010 was from
transport activities. There are also industry and household activities who take great part in the energy
consumption, which represent separately about a quarter of the total.
Figure N°1: Final energy consumption by sector 2010
Source: Eurostat, April 2012 cited in DG Energy Statistical Pocketbook 2012
http://ec.europa.eu/energy/observatory/statistics/statistics_en.htm
Note: The percentage for transport in Figure 1 includes contributions from passenger cars as well as
light and heavy goods vehicles.
As we can see in Figure 2 below, more than two thirds of transport-related greenhouse gas emissions
are from road transport. However, there are also significant emissions from the aviation and maritime
sectors and these sectors are experiencing the fastest growth in emissions, meaning that policies to
reduce greenhouse gas emissions are required for a range of transport modes.
Figure N°2: Final energy consumption by mode of transport 2010 (% of Mtoe*total)
Source: Eurostat, April 2012 cited in DG Energy Statistical Pocketbook 2012 http://ec.europa.eu/energy/observatory/statistics/statistics_en.htm
25%
32%
27%
2%
14%
Industry
Transport
Households
Agriculture
Services,etc.
82%
0,6%
4,3%0,5%
0,2%
Road
Railways
Air
Inland navigation
Consumption in pipeline,transport etc.
Road transport: 26% of total energy, 82% of transport
82%
0,6%
4,3%0,5%
0,2%
Road
Railways
Air
Inland navigation
Consumption in pipeline,transport etc.
Road transport: 26% of total energy, 82% of transport

GUIDELINES FOR REPORTING FREIGHT GREENHOUSE GAS EMISSIONS DOC REF NO: LG08
VERSION NO: 1.0 DATE: SEPTEMBER 2013
P a g e | 19/ 108
© Odette International Ltd
Heavy-duty vehicles (HDV) represent about a quarter of EU road transport CO2 emissions, 6% of the
total EU emissions and more than both international aviation and shipping. In spite of continuing
improvements in fuel consumption efficiency in recent years, total HDV emissions are still rising,
mainly due to increasing road freight traffic.
2.6 ENERGY STAKES
Greenhouse Gas emissions are closely linked to energy consumption, particularly with freight
transport where most freight is still moved using diesel powered trucks.
Fuel costs form a large proportion of transportation costs (typically 25-30%) so most businesses are
working already to make their energy use more efficient. This economic driver to reducing energy use
will only increase as fuel costs continue to rise.
Fortunately in the context of Greenhouse Gas Reporting, actions to reduce energy usage will generally
reduce GHG emissions as well.
2.7 POLICY ACTION TO LIMIT CLIMATE CHANGE
The UNFCCC (United Nations Framework Convention on Climate Change) aims to stabilise GHG
concentrations in the atmosphere at a level that would prevent dangerous human interference with
the climate system and recognises the scientific view that the increase in global temperature should
be limited to 2 degrees Celsius compared to pre-industrial levels if the worst effects of climate change
are to be avoided.
Many regions have established vehicle fuel efficiency targets, as shown in the graph below. In North
America the first regulation related to fuel usage came in 1975, known as Corporate Average Fuel
Economy (CAFE). The purpose of CAFE is to reduce energy consumption by increasing the fuel
economy of cars and light trucks. The US has recently set standards to increase the CAFE ambitions
rapidly over the next several years.
Figure N°3: Evolution of light duty vehicle CO2 standards in different countries (ICCT)

GUIDELINES FOR REPORTING FREIGHT GREENHOUSE GAS EMISSIONS DOC REF NO: LG08
VERSION NO: 1.0 DATE: SEPTEMBER 2013
P a g e | 20/ 108
© Odette International Ltd
In Europe, similar corporate average fuel economy requirements exist, following the European
Commission’s comprehensive 2007 strategy to reduce CO2 emissions from various sectors of the
economy and the 2011 Transport White Paper, which aims for a 60% cut in transport GHG emissions
by 2050. An important strand of the strategy is the mandatory target for new cars and vans sold in the
EU. For instance, average CO2 emissions from new cars will be reduced by 25% between 2006 -15 and
a further 27% by 2020 in line with EC Regulation No 443/2009. As the automotive industry works
towards meeting these targets, average emissions are falling each year.
The Commission’s HDV strategy (Heavy Duty Vehicles) is expected in late 2013 and, in preparation, it
is developing a methodology for measuring the CO2 emissions of heavy duty vehicles, taking into
account not only the engine, but the whole system – engine, truck, driving resistance, aerodynamics
etc.
2.8 FUTURE RISKS
Climate change means we are likely to experience more flooding, heat-waves, droughts, other
extreme weather events and faster coastal erosion.
Climate change and the actions being taken to mitigate the effects will impact in some way on almost
every business, but the main risks to logistics operations are likely to be:
Increased supply chain disruptions and costs of emergency actions
Increased fuel costs due to combination of shortages of supply and increased taxation
Increased operating costs- traffic tolls, more expensive vehicle technologies
If unprepared, your business could have additional economic impacts due to:
Power supply interruptions, internet failures or fuel shortages
Operational inefficiencies from environmental influences such as high working temperatures,
floods preventing movement of employees and raw material shortages
Higher insurance premiums
Failure to adopt new opportunities from a decarbonising economy
Negative competitive advantage vs. companies seen to be more environmentally friendly
GUIDELINES FOR REPORTING FREIGHT GREENHOUSE GAS EMISSIONS DOC REF NO: LG08
VERSION NO: 1.0 DATE: SEPTEMBER 2013
P a g e | 21/ 108
© Odette International Ltd
3. RESPONSIBILITIES & OBJECTIVES FOR REPORTING
This section describes the roles and responsibilities of the different stakeholders in the supply chain and
considers the different objectives organisations have for reporting Greenhouse Gas emissions.
3.1 OVERVIEW OF ROLES IN THE SUPPLY CHAIN
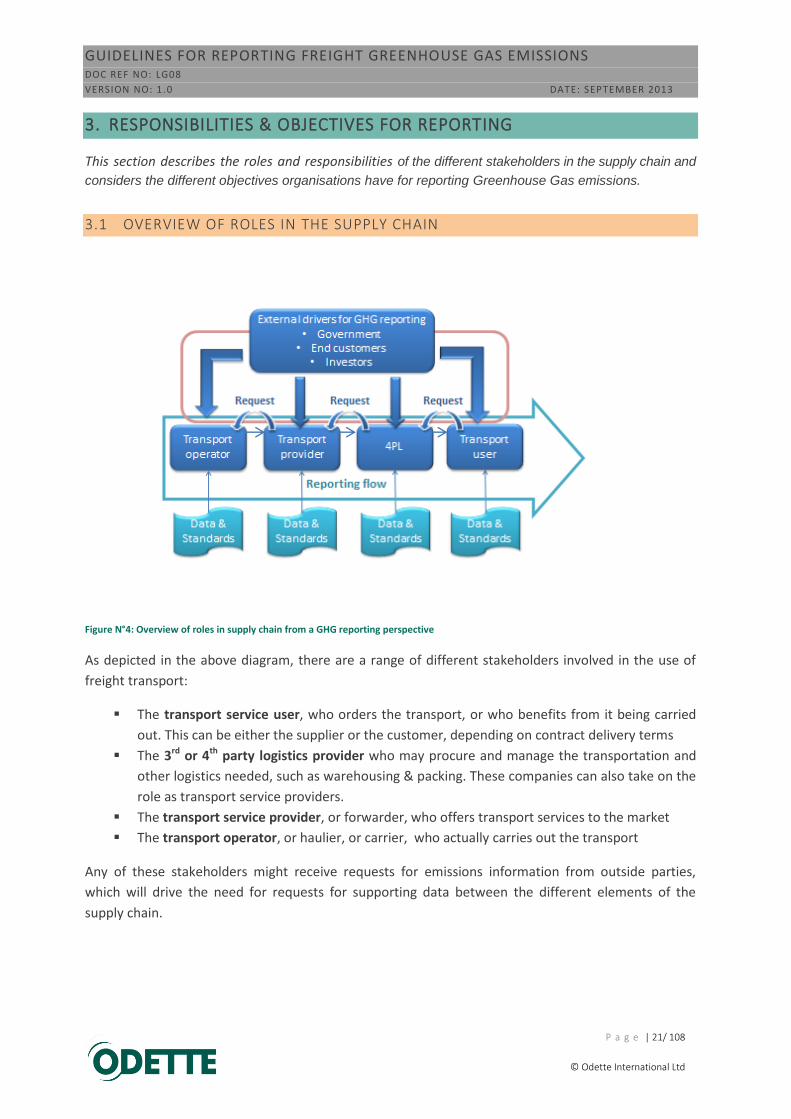
Figure N°4: Overview of roles in supply chain from a GHG reporting perspective
As depicted in the above diagram, there are a range of different stakeholders involved in the use of
freight transport:
The transport service user, who orders the transport, or who benefits from it being carried
out. This can be either the supplier or the customer, depending on contract delivery terms
The 3rd or 4th party logistics provider who may procure and manage the transportation and
other logistics needed, such as warehousing & packing. These companies can also take on the
role as transport service providers.
The transport service provider, or forwarder, who offers transport services to the market
The transport operator, or haulier, or carrier, who actually carries out the transport
Any of these stakeholders might receive requests for emissions information from outside parties,
which will drive the need for requests for supporting data between the different elements of the
supply chain.

GUIDELINES FOR REPORTING FREIGHT GREENHOUSE GAS EMISSIONS DOC REF NO: LG08
VERSION NO: 1.0 DATE: SEPTEMBER 2013
P a g e | 22/ 108
© Odette International Ltd
Examples of external parties are:
Government bodies (both local and regional)- making requests for data provision
End customers- the final recipients and users of the products
Investors and other financial stakeholders- environmental performance is of increasing
interest to investors.
The nature of any requests for data, depend on the objectives for reporting.
3.2 OBJECTIVES FOR REPORTING
As identified in the introduction, demands for Greenhouse Gas reporting can be generated from a
range of sources.
They may be divided into those that are driven by specific requests from outside parties and those
that are identified to support an organisation’s own internal strategic objectives.
External demands
Legal obligations
Customer requests
Corporate social responsibility surveys
Industry benchmarking
Internal demands
Identifying opportunities for cutting carbon and improving efficiencies
Assessing the carbon impact of logistics decisions and investments
Measuring changes in carbon emissions through time
Comparison/ evaluation of transport suppliers
3.3 EXTERNAL DEMANDS
3.3.1 LEGAL OBLIGATIONS (INCLUDING THE FRENCH DECREE)
At the time of writing, the first piece of European legislation concerning freight GHG reporting is
coming in to effect in France. Known as the “French Decree”, it requires transport service providers to
inform service users of the carbon dioxide emissions produced while conducting any contracted
transport operations.
The ”French Decree” covers all transport, both passenger and freight, that starts and/or ends on
French territory. The CO2 emissions from this transport need to be reported by the transport service
provider to the party that is contracting the transport. This requirement comes into effect on 1st
October 2013. The French Decree imposes mandatory reporting, but leaves some flexibility, initially at
least, to use other guidance for calculation than the methods described within the decree. (See
Section 11.2.2 for further details.)

GUIDELINES FOR REPORTING FREIGHT GREENHOUSE GAS EMISSIONS DOC REF NO: LG08
VERSION NO: 1.0 DATE: SEPTEMBER 2013
P a g e | 23/ 108
© Odette International Ltd
Similar legislation may be adopted elsewhere in Europe, with France being the forerunner. For this
reason, these Odette Guidelines are written to ensure alignment with the French Decree. Fuller details
of the methodology required by the French Decree and how reports should be compiled are included
in later sections of these Guidelines.
3.3.2 CUSTOMER REQUESTS
Customer requests to Manufacturers
Increasingly customers are asking questions about the environmental footprint of products that they
buy. A typical example might be a fleet customer who is wishing to demonstrate that they have a
sustainable approach to sourcing.
Questions may be specific about the emissions released from shipping vehicles from point of
manufacture to point of sale. Or more general information might be requested about the total
emissions generated in production and distribution of a car.
As with many other products and services, the concept of life-cycle assessment is receiving attention.
For a car, the life-cycle would include its manufacture, use and final recycling.
To fulfil these requests, it will be necessary to provide suitably accurate assessments of the freight
emissions involved.
ISO 14040/4 standards give great detail as to how life cycle assessments should be made. When
looking at supply chain emissions it will be necessary to include sub-suppliers to the reporting
company as well as all transport and logistics activities in between.
Some products are beginning to be labelled with information on emissions - ISO 14025 provides
guidance on this. Currently the complexities of automotive supply chains make this a daunting task,
but it may become the norm in the future.
The GHG Protocol can help to allocate the emissions between companies in the supply chain, i.e. to
define where the responsibility ends for one company and begins for another.
To meet customer requests for life-cycle assessment data, it is recommended to ask suppliers to
provide their supply chain GHG emissions, if they are not already being received from the transport
company. Suppliers should use these Guidelines and report emissions from the transport involved
when providing their own lifecycle assessments.
A complete life-cycle assessment of a product would include all transport legs e.g. all transport from
resource extraction, through refining and manufacturing of the components and materials, up to the
vehicle assembly plant and then the delivery of vehicles to the dealerships and on to the final
customer.

GUIDELINES FOR REPORTING FREIGHT GREENHOUSE GAS EMISSIONS DOC REF NO: LG08
VERSION NO: 1.0 DATE: SEPTEMBER 2013
P a g e | 24/ 108
© Odette International Ltd
Customer requests to Carriers and other Logistics Services Providers
Requests may be received for emissions data for a range of reasons. It might be to provide input
towards the shipper’s objectives to identify their overall freight emissions. It might be to help them
identify the life-cycle emissions of a particular product. Alternatively, it might be specific to just one or
two transport legs, to allow comparison of the environmental impacts of different freight options.
Whichever it is, it is important to understand the requester’s reporting methodology so that the
calculation methods chosen and assumptions made are aligned to those of the requester.
3.3.3 CORPORATE SOCIAL RESPONSIBILITY REPORTING
Corporate Social Responsibility (CSR), or Social Responsibility (SR) as it is described in ISO 26000, is the
subject that addresses the environmental and social responsibility aspects of a company’s operations.
It has increasing prominence in board rooms. The reporting of activities and performance of
organizations within this field is referred to as sustainability reporting. There are various Guidelines for
this reporting, such as the Global Reporting Initiative (GRI) and the Greenhouse Gas Protocol (GHG
Protocol). The GRI is a multi-stakeholder institution providing global standards in overall sustainability
reporting. It focuses not just on the current status, but on the need to demonstrate improvement.
The Green House Gas Protocol, as its name suggests, is focussed specifically on reporting of emissions.
It is the most widely used international standard for governments and business leaders to understand,
quantify, and manage greenhouse gas emissions. It is jointly published by the WRI (World Resource
Institute) and the WBCSD (World Business Council for Sustainable Development).
In order to assess and compare different companies’ activities, a number of external parties provide
assessments. These may be referred to by investor bodies, so many automotive companies now
complete these annually.
Examples are:
Carbon Disclosure Project
Dow Jones sustainability index
Oekom index
More details of these are to be found in Section 10.2.
It is important that the process for generating any data provided to these surveys is valid and that
records are maintained. Use of the recommended reporting methods in these Odette Guidelines
would satisfy this.
Most surveys are annual in nature. Efforts taken to provide a well-structured submission initially will
reduce the amount of work required to prepare subsequent submissions.

GUIDELINES FOR REPORTING FREIGHT GREENHOUSE GAS EMISSIONS DOC REF NO: LG08
VERSION NO: 1.0 DATE: SEPTEMBER 2013
P a g e | 25/ 108
© Odette International Ltd
3.3.4 INDUSTRY BENCHMARKING
It is to be expected that as companies look to improve the accuracy of reporting and to reduce their
GHG emissions, there will be increasing interest in carrying out benchmarking studies. It is anticipated
that these Odette Guidelines, promoting a common approach to reporting, will make these kinds of
studies easier to complete.
3.4 INTERNAL DEMANDS
Compared with typically very specific external data demands, there is much greater freedom in the
way organisations can choose to report emissions to satisfy their own internal objectives. Internal
reporting requirements are usually focussed on specific parts of the organisation or activities
undertaken, such as business regions, plants, or particular transport networks.
4 examples of internal reporting objectives are:
1. Identifying the total GHG emitted when transporting goods to different operating locations
and investigating how the emissions are improving year on year.
2. Comparing the environmental performance of different transport service providers.
3. Investigating the environmental impacts as well as the cost impacts when studying alternative
scenarios for entering new markets or citing new supplier sources or production locations.
4. Looking at the environmental improvements possible from new technologies or changes of
freight mode (such as between road and rail).
It is strongly recommended that organisations should apply the same methodologies and rigour to
internal reporting as they would to satisfy external demands. In this way data developed to answer an
internal objective can be available to answer future external requests and hence avoid duplication of
effort and auditing issues.
Data acquisition routines, measurement systems and internal databases should be standardised
wherever possible.

GUIDELINES FOR REPORTING FREIGHT GREENHOUSE GAS EMISSIONS DOC REF NO: LG08
VERSION NO: 1.0 DATE: SEPTEMBER 2013
P a g e | 26/ 108
© Odette International Ltd
4. STANDARDS FOR GHG REPORTING
This section gives an overview of various existing standards covering the subject of Greenhouse Gas
emissions reporting and identifies those that are of particular relevance to the automotive sector.
References are also made to basic information sources for GHG emissions standard values.
There are a range of standards and initiatives already written to support different aspects of GHG
reporting. These Odette Guidelines are based on those initiatives that are in most common use in
industry and offer most practical help.
They include general industry standards and those specifically targeted at the transport sector.
4.1 GENERAL STANDARDS ON GHG MEASUREMENT AND REPORTING
GHG emissions can be looked at from two major perspectives:
Organisational emissions. The GHG emissions generated directly and indirectly by the operations controlled by an organisation
Product life-cycle emissions. The total GHG emissions resulting both directly and indirectly from the manufacture and use of a company’s specific products and services including raw material production, transport and waste management
Organisational emissions
This perspective may loosely be compared with the economic term ‘corporate turnover’. It applies the
perspective that an organisation is responsible both for the emissions that occur within the
boundaries of their direct control and also, indirectly, for any emissions from any material and services
from other organisations that the business needs to operate and produce.
The Greenhouse Gas Protocol, jointly developed by the World Resources Institute (WRI) and the
World Business Council for Sustainable Development (WBCSD), is the most widely used framework for
organisational GHG emissions reporting. These Odette Guidelines have been developed to ensure that
a company’s freight emissions can easily be incorporated into any wider GHG Protocol based reports.
The relevant ISO standard for organisational GHG reporting, ISO 14064, is also generally based around
the Greenhouse Gas Protocol.
Product life-cycle emissions
This second perspective may be compared with the economic term ‘product allocated production
cost’. This type of responsibility stresses that the real cause for GHG emissions throughout the
industrial society is not driven by production or transport processes themselves, but by the demand
for the products and their use. Standards and methods relating to this approach have been formulated
with a product and service life cycle perspective. This is often referred to as generating a ‘carbon
footprint’.

GUIDELINES FOR REPORTING FREIGHT GREENHOUSE GAS EMISSIONS DOC REF NO: LG08
VERSION NO: 1.0 DATE: SEPTEMBER 2013
P a g e | 27/ 108
© Odette International Ltd
The international standard ISO 14040 addresses the principles of the LCA (Life Cycle Assessment),
while the ISO 14067 based on ISO14040, focuses on the carbon footprint in an LCA approach.
Use of the methodologies within these Odette Guidelines would give results that could readily be
incorporated within this kind of carbon foot-printing initiatives.
4.2 STANDARDS TO SUPPORT GHG DATA ACQUISITION
Recognising a lack of guidance for the acquisition of environmental data for reporting purposes, ISO
published ISO 14033: “Environmental management - Quantitative environmental information -
Guidelines and examples”. In the present context, this standard provides help in acquiring the
quantitative information needed to perform GHG emissions calculations.
The approach of these Odette Guidelines is based on this ISO standard, since it provides a very helpful
sequential approach for completing the steps between measuring data and final reporting.
4.3 THE CEN STANDARD
The CEN Standard EN 16258:2012 (hereafter abbreviated to ‘the CEN standard’) was made available
by the European Committee for Standardisation in November 2012. It has since been adopted and
published by the National Standards organisations in individual European countries in appropriate
different languages.
Its stated aim is to provide a ‘Methodology for calculation and declaration of energy consumption and
GHG emissions of transport services’’.
It is of particular relevance to these Guidelines as it is the only standard specifically published for a
European-wide audience and to be adopted by European legislative bodies. Its methodologies are
being used by the French Decree.
The intent of the Odette Guidelines is to be fully aligned to the approach of the CEN Standard. This is
seen as desirable to ensure that the Odette recommendations remain aligned to the way European
legislative requirements are likely to evolve in the near future.
4.4 ADDITIONAL INFORMATION SOURCES AND REPORTING GUIDANCE
There are a wide variety of further sources of help to support the calculation of freight GHG emissions.
General guidance includes that provided by ADEME (Methodical Guide to the French Decree) and UK
DEFRA (Guidance on measuring and reporting Greenhouse Gas (GHG) emissions from freight transport
operations).
Many publications include useful data sets, although in many cases they are limited in scope, either by
mode (e.g. only road), or region (based around conditions in specific countries). It may be unclear as to
the provenance of the data provided. It is important to use data sets that are publically recognised and
appropriate to the circumstances they are to be used in.
The Odette guidelines that follow provide a methodical approach to analysing transport emissions and
indicate where and when different standards and methodologies should be applied. Further details of
those felt by Odette to be particularly relevant are included in Sections 11.3 & 11.4.

GUIDELINES FOR REPORTING FREIGHT GREENHOUSE GAS EMISSIONS DOC REF NO: LG08
VERSION NO: 1.0 DATE: SEPTEMBER 2013
P a g e | 28/ 108
© Odette International Ltd
5. SYSTEMS APPROACH TO ANALYSING EMISSIONS
A systems approach is recommended to carry out the analysis. This will ensure quality and reliability in
the results achieved.
5.1 THE NEED FOR A SYSTEMS APPROACH
To meet the different objectives and to break down the reporting in a structured way, Odette
recommends the use of the approach within ISO standard 14033.
ISO 14033 acknowledges that the task of reporting quantitative environmental data, such as GHG
emissions, is both complicated and difficult. ISO 14033 brings a structure to the task by identifying five
distinctive and logical steps to divide the task into manageable sub-tasks.
These steps can be put in the form of questions:
1. For which transport system(s) will you report GHG emissions?
2. How should you break down your total transport system into more manageable sub-systems
in order to be able to identify the necessary data to report GHG emissions? (e.g. specific
routes, modes or geographic areas)
3. Which emissions will you consider within your total emissions calculations? (e.g. CO2, CH4,
N20)
4. Which data will you need to collect from your transport sub-system in order to calculate the
emissions for step 3 above? (e.g. distance, fuel consumption or geographic route)
5. From which data sources will you acquire the different data needed for the calculations? (e.g.
GPS data, mapping software, vehicle performance specifications, carrier invoices, on-line
environmental databases)
Applying this approach in relation to the objectives of your reporting will help you define the systems
boundaries and identify the data required. To answer the first question, it is important to understand
what the main sources of emission are.
5.2 SOURCES OF LOGISTICS EMISSIONS WITHIN THE AUTOMOTIVE INDUSTRY
Within typical automotive operations there are a number of different sources of emissions. These
might include:
Freight from parts suppliers to OEM assembly plant (Inbound Freight)
Warehousing (heating/ fork lift operation)
Packaging (emissions during manufacture of packaging)

GUIDELINES FOR REPORTING FREIGHT GREENHOUSE GAS EMISSIONS DOC REF NO: LG08
VERSION NO: 1.0 DATE: SEPTEMBER 2013
P a g e | 29/ 108
© Odette International Ltd
Return transport of empty packaging to suppliers Transport of finished vehicles to dealerships (Outbound Freight) Shipment of service parts, spares etc Transport of waste materials Office accommodation of logistics operatives (heat, light etc.)
When considering overall emissions due to logistics, all these might be included.
However by far the biggest logistics emissions for most automotive operations are the transport
operations (highlighted in bold in above list) - the inbound freight of parts and packaging, and the
outbound freight of finished vehicles and spare parts; these are the chief subject of these guidelines.
(Some information about how to approach the other elements can be found within the Greenhouse
Gas Protocol and is touched on in Section 5.4 and in Appendix 1.)
5.3 SYSTEMS BREAKDOWN OF TYPICAL TRANSPORT OPERATIONS
A very simple transport system is one by road from a given pick-up point to a given delivery point.
Several different systems can be described to constitute that road transport, all with different scopes.
One narrow system scope is to include the start and end point of the transport and to measure the
shortest distance between them, estimating that an average truck moved the goods along this
distance while combusting fuel and emitting Greenhouse Gases.
An example with a less narrow system scope may include, in addition, the production of the fuel
needed for the truck, as well as the transport distances necessary to move the truck to the pick-up
point and the distance to reposition the truck into a new pick-up position.
An even larger system scope may include also the infrastructure necessary for the handling of the
goods throughout the distance travelled, such as goods terminals, the maintenance of the truck and
even the emissions of the truck driver travelling to and from work.
More complexity arises from systems with more than one movement, such as a set of journeys moving
goods many times during a year, including perhaps multiple modes such as rail and sea in addition to
road. These systems may also be expanded by considering fuels and energy production, infrastructure
etc. It is also needed to consider that transport could be sub-contracted to one or even several levels
of providers.
The extreme case might be all transport for all goods moved for an entire organisation during a year,
considering the different systems scopes described earlier.
The choice of system scope depends on the application or objective. A general rule is that the system
scope should be chosen to give a comprehensive and unbiased view of the transport system. In short,
this means that at least all relevant transport legs should be considered, and the production of fuel
and other energy should be followed from cradle to grave.
When reporting according to a particular methodology, such as for the Greenhouse Gas Protocol, the
system scope is clearly defined in the specifications.

GUIDELINES FOR REPORTING FREIGHT GREENHOUSE GAS EMISSIONS DOC REF NO: LG08
VERSION NO: 1.0 DATE: SEPTEMBER 2013
P a g e | 30/ 108
© Odette International Ltd
5.4 USE OF THE GREENHOUSE GAS PROTOCOL TO CATEGORISE EMISSIONS
The GHG Protocol considers emissions as falling into one of three different scopes, as illustrated in
Figure No. 5 below.
Figure N°5: The three scopes of emissions defined by the Greenhouse Gas Protocol
The three scopes can be explained as follows:
Scope 1 covers emissions from activities and processes under the direct control of the
organisation that performs the reporting, described as direct emissions.
Scope 2 covers indirect emissions resulting from the generation of energy used by an
organisation’s directly controlled activities and processes.
Scope 3 covers all other indirect emissions from activities and processes that are contracted
by an organisation, or resulting from its activities, but directly controlled by others.
The same emissions may be reported as one company’s direct (Scope 1) emissions while also being a
part of someone else’s indirect (Scope 3) emissions. In the common situation where a manufacturer
contracts most of their freight transport to other parties, the carrier who provides the freight would
report the freight emissions from their equipment within their own Scope 1 emissions report while
also providing the data to the manufacturer to include within their Scope 3 emissions assessment.
Further explanation of use of the framework of the GHG Protocol can be found in Appendix 1.

GUIDELINES FOR REPORTING FREIGHT GREENHOUSE GAS EMISSIONS DOC REF NO: LG08
VERSION NO: 1.0 DATE: SEPTEMBER 2013
P a g e | 31/ 108
© Odette International Ltd
5.5 BREAKING DOWN THE SYSTEM INTO SMALLER SUB-SYSTEMS
The quality of GHG emissions calculations is dependent on how the basic data is gathered. To help
identify what data is needed, the total transport system can be broken down into more manageable
sub-systems, or system components.
Such sub-systems might include individual transport routes, different transport modes and different
categories of goods. What is important is to consider how much data already exists, or at least may be
readily gathered following an acceptable amount of work.
The CEN standard uses the term ‘leg’ to describe each section of a route where a cargo is carried by a
particular vehicle.
In the following sections, examples are given on ways of defining sub-systems for reporting for the
different types of objectives previously described in this section.
Legal obligations
Legislation for mandatory reporting should clearly define the systems to be reported on. The
French Decree requires inclusion of all transport legs starting or finishing within France.
The reporter must break down all transport into sub-flows into:
All transport legs that are solely within France.
All transport that starts outside France, but then passes through a harbour or
a border station and then travel within France.
Additionally the decree explains how to treat other aspects, such as necessary empty trailer
moves before/ after material is picked up/ delivered.
More detail of the reporting requirements within the French decree is contained within
Section 8.4.1.
Customer requests
Customer requests for emissions data may take a variety of forms. One example is where a
customer buying a vehicle (often a fleet customer) might ask for a full analysis of the
emissions involved in vehicle production as part of a life-cycle analysis. Here, all transport legs
between suppliers and end customers may need to be identified, i.e. all transport from the
beginning to the end.
The Figures 6 and 7 below illustrate an example of the level of complexity in automotive
transport chains. The first figure shows how 4 tiers of transport suppliers link together the
material flows from the raw material supplier processes to the end customer, component
manufacturers and final assembly at Original Equipment Manufacturers (OEMs) and on to the
Sales operations (including e.g. aftermarket and repairs).

GUIDELINES FOR REPORTING FREIGHT GREENHOUSE GAS EMISSIONS DOC REF NO: LG08
VERSION NO: 1.0 DATE: SEPTEMBER 2013
P a g e | 32/ 108
© Odette International Ltd
Figure N°6 Example of freight transport in the life cycle of a car
Note: The blue and the yellow arrows represent transport legs. The yellow arrow is colour
coded to show the link with the next figure, Figure 8.
Figure 7 shows how each transport element from Figure 6 may involve a variety of different
companies, each performing different roles.
The transport is ordered by the transport user who in this case is the OEM.
The OEM may contract a Logistics Services Provider (4PL) who in turn contracts Transport Operator Haulier 1, Transport Forwarder 1, and Transport Forwarder 2 to execute the transport.

GUIDELINES FOR REPORTING FREIGHT GREENHOUSE GAS EMISSIONS DOC REF NO: LG08
VERSION NO: 1.0 DATE: SEPTEMBER 2013
P a g e | 33/ 108
© Odette International Ltd
Further tiers of Transport Forwarders may sub-contract different parts of the freight.
It is finally the Transport Operators who actually own the vehicle fleets and actually perform the transportation and directly emits the Greenhouse Gases.
Figure N°7: Example of transport chains with transport legs and parties involved
When performing a detailed analysis taking all transport into consideration, this complex picture can be modelled by breaking down the simplified transport legs represented by the arrows in Figure 7 into individual system components that eventually will represent the actual transport routes, modes and distances within the different transport legs.
Decisions will need to be made as to how best to obtain emissions date from each element. Due to the practical difficulties in acquiring data from transport operators in distant tiers or buried down in complex contract structures, it may be necessary to use average or derived data rather than real and detailed data in some instances.

GUIDELINES FOR REPORTING FREIGHT GREENHOUSE GAS EMISSIONS DOC REF NO: LG08
VERSION NO: 1.0 DATE: SEPTEMBER 2013
P a g e | 34/ 108
© Odette International Ltd
Corporate Social Responsibility Surveys
Most external CSR surveys will clearly explain the kind of information they require though the
form of the answer may be quite open as the same questions are asked of many different
types of businesses. The main themes are generally:
Is there are environmental strategy in place?
Are steps taken to monitor the business’s environmental impacts?
Are the results quantified and made publicly available?
Are actions taken to create year on year improvements?
The questionnaire will generally contain different sections to cover each of a company’s areas
of activity, one of which will comprise questions on supply chain, including freight and
logistics. The Greenhouse Gas protocol is generally used to provide an overall framework. If
companies use the approaches advocated within these Guidelines, then completion of CSR
surveys should be relatively straightforward.
More information on specific CSR surveys is contained in Section 10.2.
Internal reporting objectives
For internal reporting, it is a matter of considering the question being asked and then mapping
out the operational elements that will contribute to the answer. For example, when
comparing transport emissions for different supply chain legs or locations, the system needs
to be broken down so that the relations between transport legs and location can be clearly
identified and analysed.
It is sensible to look at how your operations are structured already and choose boundaries for
different reporting systems to align with this. It may be appropriate to divide systems up
according to characteristics. A long transport routing might be divided into different modes-
road, sea and rail. North American truck and train specifications & usage differ considerably
from those used in Europe so it makes sense to consider them separately.
If considering the emissions of an entire network, it can be done by requesting emission data
or data to calculate emissions from all transport service providers that are used globally for all
goods transport to the reporting company. It would then be important to ensure either all
transport providers use the same methodology or else ask for base data, such as distance
travelled and load carried, so that a common calculation method can be applied (see Section
6).

GUIDELINES FOR REPORTING FREIGHT GREENHOUSE GAS EMISSIONS DOC REF NO: LG08
VERSION NO: 1.0 DATE: SEPTEMBER 2013
P a g e | 35/ 108
© Odette International Ltd
If data is required to support comparison of different scenarios, it generally means dividing
the whole problem of improving a transport situation into the specifics for which decisions
can be taken. For example, when comparing transport set-ups for various location scenarios
the system needs to be broken down so that the relations between transport and location can
be clearly identified and analysed.
When breaking the system down, it is important to clearly identify who will be responsible for
reporting on each element and to ensure that the methodology to be used for each is defined
and unambiguous.
5.6 WHICH GAS EMISSIONS TO CONSIDER WITHIN THE CALCULATIONS?
Which gases to consider?
When Greenhouse Gas emissions were first becoming a subject of interest, the main focus was on CO2
reporting. This was not surprising as it forms the bulk of the gas volume produced by fuel combustion
and was linked to global warming when climate change was first being investigated.
As explained in section 2.3, there are other gases considered to contribute to the greenhouse effect.
Although emissions of these may be low in volume they have greater global warming potential per
unit mass than does CO2. The method used to quantify the total global warming potential of a mixture
of emissions is to identify a CO2 equivalent (CO2e) value of the mix- i.e. the mass of pure CO2 that
would give the same global warming effect as the mix in a given time span.
Increasingly, CO2e is being reported and this approach is recommended by Odette. The French Decree
as initially published requires reporting of CO2 , but at the time of writing the authors of the French
Decree have stated that they are moving towards using CO2e factors, which is the approach used by
the CEN Standard. Fortunately for most fuels, the difference can be treated as a percentage uplift,
making it relatively easy to convert from one to the other.
How to account for emissions from fuel used
As the majority of emissions are generated from the combustion of fuel it is important to use a
recognised method for quantifying the emissions generated from use of a standard unit of energy.
The basic approach for transport would be to look at how much CO2 is produced by burning each litre
of diesel that has been used from the vehicle’s fuel tank. This result, known as ‘Tank to Wheel’
emissions (TTW) is easy to define and explain.
However this approach does not consider the environmental impacts of production of the fuel.
Besides the emissions produced by fuel combustion during the ‘use phase’, emissions are also
generated during the ‘upstream phase’ in the extraction, refining and transport of the fuel before it is
pumped into the vehicle. These total emissions results are known as ‘Well to Wheel’ emissions
(WTW).

GUIDELINES FOR REPORTING FREIGHT GREENHOUSE GAS EMISSIONS DOC REF NO: LG08
VERSION NO: 1.0 DATE: SEPTEMBER 2013
P a g e | 36/ 108
© Odette International Ltd
From a sustainability perspective, it is important to use this broader perspective to be able to compare
the overall emissions impact of the use of different types and sources of fuel. This kind of analysis (fuel
cycle analysis) helps particularly with understanding the benefits of using alternative fuel sources, such
as sugar cane, where the CO2 from combustion is compensated by the fact that the sugar cane has
absorbed CO2 from the atmosphere while it was being farmed. For electrical power, aspects to be
considered include losses during transmission as well as the production of batteries.
Examples where the WTW approach is relevant are:
Understanding benefits of using ‘green fuels’ such as biodiesel
Comparison of electric and diesel rail transport
Recognition of the different emissions from different types of electricity generation (coal/
gas/ nuclear/ hydro etc.)
Increasingly, published data sets of fuel emissions factors provide WTW figures as well as TTW factors.
The WTW approach is used by the French Decree, the CEN standard and other standards such as the
ISO 14040 product & life cycle standards.
Note the French Decree uses the phrase Upstream Phase to describe Well to Tank emissions and
Operating Phase to cover Tank to Wheel emissions.
The figure below explains diagrammatically the relationship between TTW and WTW emissions.
Figure N°8: The Well to Wheel approach to fuel life cycle analysis
5.7 CONCLUSIONS & RECOMMENDATIONS
Odette acknowledges the GHG Protocol as a tool for defining high-level system boundaries for
corporate external reporting. The GHG protocol is well known and used by major players in the field of
sustainability reports, such as government bodies and standards institutions.
For freight GHG reporting, however, additional detail is required. It is recommended to apply the
methodical approach here, which follow the methodology of ISO 14033 and which are aligned to the
CEN Standard and the French Decree.
Well to Tank Tank to Wheel
Well to Wheel
OPERATING PHASE UPSTREAM PHASE
PHASE

GUIDELINES FOR REPORTING FREIGHT GREENHOUSE GAS EMISSIONS DOC REF NO: LG08
VERSION NO: 1.0 DATE: SEPTEMBER 2013
P a g e | 37/ 108
© Odette International Ltd
The reporting objectives will generally dictate the way that transport systems should be broken down
to allow the necessary data to be collected.
It is strongly recommended that the same systems break down should be used for internal reporting
as selected for external reporting so that duplication of effort can be avoided.
After defining the system, sub-systems and the emissions to be accounted for, the next 2 steps in the
ISO 14033 can be taken: data acquisition & calculation. These are covered in the sections that follow
(6 & 7).

GUIDELINES FOR REPORTING FREIGHT GREENHOUSE GAS EMISSIONS DOC REF NO: LG08
VERSION NO: 1.0 DATE: SEPTEMBER 2013
P a g e | 38/ 108
© Odette International Ltd
6. CALCULATION METHODOLOGY
This section explains the basic principles of emissions calculation. It refers to various available
calculation methodologies, focussing particularly on the European CEN standard. The necessary steps
in emissions calculation are explained and ways of simplifying the calculation burden for large
quantities of data are discussed. Methods and strategies for acquiring the different data needed for
the calculations are provided in Section 7.
GHG or CO2 emissions cannot be directly measured easily as this requires special equipment that can
sample a vehicle’s exhaust gases. Hence GHG emissions values are usually derived by calculation using
data from other parameters that can be measured. In this section we describe how such calculations
are made.
6.1 PRINCIPLE OF CALCULATION
Calculation is needed to convert data about fuel consumption and other physical entities (such as
distance travelled, loads carried) into GHG emissions data. There may also be a requirement for
calculation to allocate total amounts of GHG emissions from a shared transportation, such as between
the different cargos carried or between different customers served.
The principle of emissions calculation is the conversion of fuel consumption into GHG emissions using
emission factors relative to the fuel consumed. Hence, the calculation formula is:
G = F x g
G is the GHG emissions, F the fuel consumption, and g
an appropriate emission factor.
Each calculation of GHG emissions (or energy consumption) of a transport service should be carried
out by using the steps described in the next section (6.2).
Choice of emissions factor
The results will depend on various considerations including transport modes, vehicle specifications
and choices of systems boundaries. Different emissions factors will be required in different situations.
The selection of the most appropriate emissions factor is covered in Section 7.3.
CO2 or CO2-equivalent?
As discussed in section 5.6 most new standards, including the CEN standard, require emissions data to
include all relevant GHG emissions and not just CO2 emissions. Therefore it is recommended that CO2e
emissions factors should be used where possible.

GUIDELINES FOR REPORTING FREIGHT GREENHOUSE GAS EMISSIONS DOC REF NO: LG08
VERSION NO: 1.0 DATE: SEPTEMBER 2013
P a g e | 39/ 108
© Odette International Ltd
6.2 CALCULATION METHODOLOGY ACCORDING TO THE CEN STANDARD
As explained in Section 4.3, the CEN Standard EN 16258:2012 sets out methodology and requirements
for calculating and reporting GHG emissions in transport services.
It is likely to be taken as a foundation for other European initiatives and so for this reason its
calculation terminology and stepped approach is followed in these Guidelines.
CEN advocates the following steps:
Step 1: Describe the different legs of the transport service
Step 2: Calculate the energy consumption and GHG emissions of each leg
Step 3: Summing of all legs to determine total corresponding value of energy consumption
and GHG emissions
Note the CEN standard looks at energy consumption as well as GHG emissions. As can be seen below,
the calculation methodology is basically the same for both of them.
Different values are calculated according to the set of fuel emissions factors used, whether Tank To
Wheel, or the increasingly common Well To Wheel approach (See section 4.4.4).
CEN defines the following nomenclature for the different results that might be calculated:
Et Energy usage based on Tank To Wheel approach
Ew Energy usage based on Well To Wheel approach
Gt GHG emissions based on Tank To Wheel approach
Gw GHG emissions based on Well To Wheel approach
6.2.1 STEP 1: DESCRIBE THE LEGS
In order to carry out detailed calculations it is necessary to break the transport service down into
individual legs. Each section of a route that utilises a different vehicle is considered a different leg. So
for example, an automotive component that is collected from a supplier by truck and then shipped by
train until finally being delivered by truck to the vehicle assembly plant will have utilised 3 transport
legs.
The minimum information needed to define a leg would be the start and finish points, the mode of
transport and a description of the load carried.
6.2.2 STEP 2: DEFINE THE VOS AND PERFORM THE CALCULATIONS
The next step is to describe how the transportation is carried out so that any data is used in the
correct manner. The way that vehicles operate to execute a transport leg is referred to in the CEN
Standard as the Vehicle Operation System, or VOS.

GUIDELINES FOR REPORTING FREIGHT GREENHOUSE GAS EMISSIONS DOC REF NO: LG08
VERSION NO: 1.0 DATE: SEPTEMBER 2013
P a g e | 40/ 108
© Odette International Ltd
The VOS definition should include the type of vehicles operating the transport leg, the period of time
of activity of these vehicles and assumptions about how they are operated. For example, are parts
being collected from suppliers via multiple trips and then consolidated, or are they being collected on
a single collection route (‘milk-run collection’)?
The CEN Standard states that the VOS should include all repositioning/ empty trips that are related to
the vehicle operations. This means if this approach is used, any distances that the transport vehicle
has had to move without any goods in order to provide the transport service should be included in the
total transport distance. Note that empty trip distances can be hard to measure and assign. The
French Decree adopts the pragmatic approach that the transport service provider shall determine the
procedure for integrating repositioning legs, empty legs, and emissions while stopped with the engine
running.
The CEN Standard excludes some transport related elements from the VOS including loading &
unloading of freight, and processes at the administrative level such as office work. More information
can be found in the section 4.3 “Processes not included” of the CEN Standard.
Once the VOS is defined, the characteristics needed for calculation can be listed out for each leg.
These might include: fuel consumption, distance, weight of load, load factor and empty distance. The
appropriate emissions factors can then be selected according to the available data and the calculation
can be completed, as shown in Section 6.2.5.
6.2.3 ALLOCATION
The term ‘allocate’ here refers to the activity of sharing the responsibility for the total energy use and
emissions amongst those products, actions, services or customers that have the responsibility for
them.
Where transport is performing an exclusive service to a specific customer, there is no need to allocate
- all fuel and energy use and emissions are related to that specific service and customer. But for
Vehicle Operation Systems performing more than one different service, perhaps also for more than
one customer, it is important to allocate emissions in a fair way to the service and customers involved.
This is not an exact science and there are a number of different parameters that might be chosen on
which to base the allocation process, such as weight of goods carried, volume of goods as well as the
distance travelled for each individual transport service and user of the transport service.
(a) Allocation based on cargo
If a VOS involves transport of more than one cargo, the fuel, energy and emissions can be allocated
using a relevant cargo allocation ratio. Commonly this might be agreed to be done on the basis of
either weight or volume of goods carried.

GUIDELINES FOR REPORTING FREIGHT GREENHOUSE GAS EMISSIONS DOC REF NO: LG08
VERSION NO: 1.0 DATE: SEPTEMBER 2013
P a g e | 41/ 108
© Odette International Ltd
(b) Allocation to different transport service users
If different transport service users use precisely the same VOS over the same distance, such as rail
freight carrying a variety of loads to the same destination, then allocation to the different transport
service users can be done on a weight or volume basis as per the cargo example above.
However, if a VOS involves different user’s freight being picked up at and delivery to different
locations, then it is necessary to further investigate how to allocate the responsibilities for distances,
empty vehicles etc. to the different transport users. This may often be complicated, and there are
additional considerations such as relative distances covered and the number of collection/ drop-off
points relating to each user. Further details on allocation can be found in the CEN standard, which has
several examples of how these rules can be applied in different scenarios.
6.2.4 STEP 3: SUMMING OF ALL LEGS
The final step is to total the GHG emissions (and any energy consumption data) for the whole
transport system by summing the individual values for all individual legs.
At this stage it is good practice if possible to give an indication of the precision of the results by giving
some kind of tolerance bands. For example, if estimates of distances travelled are assumed to have a
precision of +/- 10% then the accuracy of the final emissions data will be no better than this.
Many companies use spreadsheet software for tabulating and summing up all of the data (See Section
6.4).
6.2.5 CALCULATION EXAMPLE
The figure below gives an example of the emissions calculation according to the French Decree. (Note
the French Decree uses the methodology of the CEN Standard for calculation processes.)

GUIDELINES FOR REPORTING FREIGHT GREENHOUSE GAS EMISSIONS DOC REF NO: LG08
VERSION NO: 1.0 DATE: SEPTEMBER 2013
P a g e | 42/ 108
© Odette International Ltd
Figure N°9: Example of emissions calculation (Level 1)
To calculate the amount of GHG emissions, we multiply the data for the distance travelled by each
truck, by the diesel emissions factor, and by the diesel consumption rate corresponding to each truck
category. For example, if a 40 tonne diesel articulated truck, driving 200 km, consumed 61 litres of
fuel, the GHG emissions can be calculated as follows: (the diesel emission factors used in the
calculation are the French Decree values: 3.07kgCO2/L in WTW and 2.49kgCO2/L in TTW.)
(1) For Well to Wheel calculations
Gw = gw x Ct = 3.07 x 61 = 187.27 kg CO2
(2) For Tank to Wheel calculations
Gt = gt x Ct = 2.49 x 61 = 151.89 kg CO2
Key:
Ct: Number of litres of diesel
Gw: Well To Wheel (WTW) GHG emissions
Gt: Tank To Wheel (TTW) GHG emissions
gw: WTW Diesel emission factor
gt: TTW Diesel emission factor

GUIDELINES FOR REPORTING FREIGHT GREENHOUSE GAS EMISSIONS DOC REF NO: LG08
VERSION NO: 1.0 DATE: SEPTEMBER 2013
P a g e | 43/ 108
© Odette International Ltd
Note that the accuracy of the calculated result depends on the accuracy of the data and precision of
the emissions factors used for the calculation. In this case there is no specific fuel consumption data
available so a default value is used from the French Decree table making the accuracy ‘Level 1’ (See
Section 7.1 for more on accuracy levels).
For examples of calculations in line with the French Decree for other modes (railway and air
transportation) see Appendix 2.
6.3 METHODS TO USE WHEN COMPARING DIFFERENT SCENARIOS
6.3.1 COMPARISON OF TOTAL EMISSIONS
When comparing different scenarios, the most obvious approach is to consider the total emissions
impact of each by simply summing the individual emissions from each leg, as in Step 3 above.
This would help answer needs such as:
Comparing different routes
Comparing freight emissions from shipments from different supplier locations
Estimating emissions connected with entering a new market or changing production sites
Sometimes the results can seem counter-intuitive. Proper evaluation of emissions of multi-modal
routings can reveal that the road leg from start point to port may produce more emissions than a
subsequent 10,000 km ocean leg.
6.3.2 CALCULATION OF RELATIVE EMISSIONS IMPACT
In many cases there is a need to compare the relative environmental impact of different transport
methods. Questions to be answered might include how to:
Compare the effectiveness of different transport modes
Compare the efficiency of different service providers
Compare the benefits of different types of trailer and equipment improvements etc
In these cases it is necessary to have a standard metric that can be comparable. This is known as
normalisation. There are various ways of normalising emissions data. The most common is to use the
parameter gram CO2e per tonne km. This gives an average of how much CO2 emissions a transport
service provider emits per transported tonne and per transported km. The benefits of using this value
is that it takes both the distance and transported weight into consideration, as well as how energy
efficient the vehicles are that are used for the transport.
CO2e/tonne km = (Fuel consumption x Emission values for that fuel)
Transported tonnes x distance travelled in km

GUIDELINES FOR REPORTING FREIGHT GREENHOUSE GAS EMISSIONS DOC REF NO: LG08
VERSION NO: 1.0 DATE: SEPTEMBER 2013
P a g e | 44/ 108
© Odette International Ltd
This figure might be worked out for a specific type of transport equipment or for a whole transport
fleet or as an average for an operator in a particular network. The average value can be calculated per
operator and for each mode that the operator is offering. Also these values can be different
depending on country and region.
For transport of finished vehicles, there is an obvious benefit to considering emissions per vehicle
transported, as this would allow easy comparison of the different impacts of trailer units with different
carrying capacities. A typical metric might then be:
CO2e/vehicle km = (Fuel consumption x Emission values for that fuel)
Vehicles carried x distance travelled in km
6.4 AUTOMATING THE CALCULATION PROCESS
If a lot of data is to be processed, there are various options to make things easier.
A wide range of database services offer on-line CO2 calculators to help estimate emissions from
transport operations. These may be useful for one-off or quick estimates, however, care should be
taken before using them before adopting them for large scale use:
It can be unclear as to calculation methods and assumptions being used
Dependency on the particular emissions factor that has been selected by the site. It may be difficult to obtain repeatable results over time if the data base service emissions factors and or calculation processes are changed
If you wish to use an on-line calculator, it is recommended to use one from a reputable authority such
as one of the organisations referred to in these guidelines.
If you want to create a systems solution tailored to your own requirements, a common starting point
is to develop a spreadsheet, using standard office software on a desktop computer. This will allow you
easily to add appropriate emissions factors into the calculations and to import large amounts of
operational data on which the calculations can be performed.
An important advantage with spreadsheets is that they are easily updatable as newer and more
refined emissions factors are published or if additional data becomes available to make the
calculations more comprehensive.
Once experience has been gained using simplified spreadsheets then decisions can be made as to
whether more sophisticated software solutions should be developed/ procured.

GUIDELINES FOR REPORTING FREIGHT GREENHOUSE GAS EMISSIONS DOC REF NO: LG08
VERSION NO: 1.0 DATE: SEPTEMBER 2013
P a g e | 45/ 108
© Odette International Ltd
Figure N°10: Example of spreadsheet to support emissions calculations from shipments of finished vehicles by road

GUIDELINES FOR REPORTING FREIGHT GREENHOUSE GAS EMISSIONS DOC REF NO: LG08
VERSION NO: 1.0 DATE: SEPTEMBER 2013
P a g e | 46/ 108
© Odette International Ltd
7. DATA ACQUISITION
This section gives methods and strategies for acquiring the different data required for GHG calculations
and describes how the choice of data affects the accuracy of the calculation results. Help is provided in
selecting emissions factors from the different sources available.
7.1 ACCURACY LEVELS
The quality of calculations will be affected by the level of accuracy of the acquired data and the
applied emissions factors. The accuracy of the data depends on data availability, recording accuracy
and resources available for processing the data.
The best data that a transport service user can obtain to determine fuel consumption would be the
exact consumption by the equipment used for the specific transport legs being reported on: to use
CEN terminology, the specific measured values.
However, given that this exact data may not be available, the concept of accuracy levels is used to
define alternative approaches that allow calculations to be made based on averaged or estimated
data. As these other approaches will involve various assumptions being made there will thus be a
lowering in the level of accuracy of the results obtained.
Using higher levels of accuracy not only produces better quality results, but also allows a greater
ability to quantify improvements made by making changes to equipment used, load utilisation, driving
styles etc.
7.1.1 ACCURACY LEVELS WITHIN THE CEN STANDARD
CEN has defined 4 accuracy levels, as described below.
Default Values (= Level 1 in French decree)
Generic emissions factors are used that are average fuel consumptions or GHG emissions for a
particular mode and type of transport. They should be obtained from a published source and
not determined by the transport service operator.
Note that while useful in providing quick and repeatable results, this approach does not allow
differentiation of performance between different operators use of the same equipment. The
accuracy of the results is dependent of the granularity of the generic factors.
Transport Operator Fleet Values (= Level 2 in French decree)
Here the Transport Operator uses fuel consumption figures based on their own average fuel
usage across their whole fleet. This is a figure that the operator should be able to readily
provide and it means that the results given are constant whichever particular vehicle or
equipment is used for the transport being reported on.

GUIDELINES FOR REPORTING FREIGHT GREENHOUSE GAS EMISSIONS DOC REF NO: LG08
VERSION NO: 1.0 DATE: SEPTEMBER 2013
P a g e | 47/ 108
© Odette International Ltd
Transport Operator Specific Values (= Level 3 in French decree)
Here the Transport Operator analyses the fuel consumption of different elements of their
operations and uses an average fuel consumption for the most relevant type of equipment
and usage for the transport being reported on. The operator might consider breaking down
their operations by logistics organisation, type of route, type of means of transport, vehicle
type, client or any other appropriate complete breakdown.
Specific Measured Values (= Level 4 in French decree)
This is the most accurate approach where the Transport Operator uses exact values of fuel
usage measured on the specific Vehicle Operation System (VOS) for the transport being
reported on.
In summary:
Level 1: Emissions = distance travelled x emissions factor (using default values)
Levels 2 & 3: Emissions= average fuel/ km x distance travelled x emissions factor
(For 2, average fuel/km is across whole fleet, for 3 it is more specific)
Level 4: Emissions = exact quantity of fuel used x emissions factor
See Section 7.3 for more on emissions factor selection.
7.1.2 ACCURACY LEVELS ACCORDING TO THE FRENCH DECREE
The levels of accuracy for emissions reporting defined in the French Decree (and its Guidelines) follow
the CEN Standard. (For this reason the French numeration is used as a reference in order to
standardise reporting in the above section.)
The French Decree stresses the principle that you should aim to use the best accuracy level that you
are able to. If a lack of detailed data forces you to use the lowest level of accuracy (level 1) then you
are encouraged to use the default values for average vehicle fuel consumption published by the
French environment organisation ADEME. These values consider an average fuel efficiency for each
type of vehicle, taking into account empty running. If justified, then alternative default values may be
used.
All transport companies can use those values until July 2016. After that date, only those with less than
50 employees, and those who do not obtain their subcontractors’ values on time and are not
necessarily correct, can continue using them. All others are expected to have started measuring their
own fuel economy.

GUIDELINES FOR REPORTING FREIGHT GREENHOUSE GAS EMISSIONS DOC REF NO: LG08
VERSION NO: 1.0 DATE: SEPTEMBER 2013
P a g e | 48/ 108
© Odette International Ltd
7.1.3 ACCURACY LEVELS CONSIDERED BY DEFRA/ GHG PROTOCOL
The UK Department of Environment, Food and Rural Affairs (DEFRA), in its freight CO2 reporting
guidance, follows the Greenhouse Gas Protocol in considering ways of tackling situations where
detailed data on transport equipment and/ or routes travelled is not available.
DEFRA defines four levels of estimation that encompass a wider range of scenarios vs the 4 levels of
the CEN standard.
Based on the quality/ availability of data available, DEFRA provide the following classifications:
Primary data
Data obtained by directly measuring the transport being reported on e.g. by use of vehicle
data loggers of individual fuel receipts. This approach requires availability of measured fuel
usage data and is equivalent to Level 4 of the French Decree.
Secondary data
Generic, or average data, relevant to the transport being reported on. This approach requires
sufficient operational data to be available to apply average or default factors and corresponds
to Levels 1-3 of the French Decree.
Extrapolated data
Data calculated by estimating a trend from existing data, to fill a gap or project forward. This
approach allows emissions data from a known sample of transport operations to be used to
estimate emissions from a larger sample.
Examples of how this approach may be used:
1. If detailed study is carried out for 3 months of operations, an estimate of a year’s
worth of emissions could be made by pro-rating. (Note that some adjustment may
need to be made for level of activity: in this example a year’s emissions may be less
than 4x the emissions of the first quarter due to seasonal fluctuations).
2. If data is known for specific networks or customers, then estimates could be made for
other transport by pro-rating by activity level. For example, if the annual inbound
freight CO2e for a 300,000/yr car assembly plant in Germany has been calculated as
36,000 tonnes then the annual figure for a nearby 200,000/yr assembly plant could be
estimated at 24,000 tonnes CO2e. (A better approximation could be made by taking
account of any differences between average supplier-to-plant distances or in
combined component weights of different car models).

GUIDELINES FOR REPORTING FREIGHT GREENHOUSE GAS EMISSIONS DOC REF NO: LG08
VERSION NO: 1.0 DATE: SEPTEMBER 2013
P a g e | 49/ 108
© Odette International Ltd
Proxy data
This involves the use of something similar where no direct data is available, (i.e. in its proxy).
An example of this would be to derive an emissions estimate from transport cost when full
details of the transport system are not known. GHG emissions come from fuel usage, which in
turn forms a significant proportion of the total freight cost (typically 25-30%). This fuel cost
burden is likely to be directly discussed during transport cost negotiations, so whoever is
buying the transport services will likely know approximate %. An order of magnitude on
freight emissions can be generated by requesting the transportation buyer to confirm total
freight cost and give a best guess of fuel cost %.
Emissions = Fuel cost / (fuel price/ litre) X emissions factor
While not that accurate, this approach is nevertheless very useful to gain an understanding of
relative emissions levels between different networks, regions and customers and to allow
prioritisation for more detailed reporting and for emissions reduction actions (See Section
9.1).
Note that any use of extrapolated or proxy data should be accompanied by a justification
explaining why the approach being used is valid. Ideally, some indication of accuracy levels
should be provided based on the assumptions used. For example, if it is considered that the
accuracy level of the estimate of total fuel used is +/- 20%, then the resulting CO2 emissions
data will be no more than +/- 20 % accurate.
The techniques of using extrapolated and proxy data can be very helpful in filling in any gaps
encountered while producing a high level estimate of total corporate emissions, as advocated
by the GHG Protocol (See also ‘First steps in reporting- Section 8.3).
7.1.4 SELECTING THE CALCULATION METHOD TO SUIT DATA AVAILABILITY
The decision tree below in Figure No.11 illustrates how to select the best calculation methods to use
according to the available data. It consists of five questions and the answer “YES” or “NO” will help to
make the best choice. The grey blocks present the primary data and calculations and the yellow blocks
indicate the final calculations for obtaining GHG emissions.

GUIDELINES FOR REPORTING FREIGHT GREENHOUSE GAS EMISSIONS DOC REF NO: LG08
VERSION NO: 1.0 DATE: SEPTEMBER 2013
P a g e | 50/ 108
© Odette International Ltd
Figure N°11: DEFRA Calculation Diagram
Source: “Guidance on measuring and reporting Greenhouse Gas (GHG) emissions from freight transport operations” From DEFRA UK
As there is some considerable variation between these methods it is important for the Transport
Service User and Transport Operator to be aligned on which methodology they should use. (See
Section 8.5.2 for more guidance on making agreements on reporting methods between parties).
7.2 COLLECTING OPERATIONAL DATA
7.2.1 SOURCES OF OPERATIONAL DATA
There are many alternative methods available for gathering data and examples of how to collect the
various necessary data elements are described below. How the data is collected depends on the actual
case, who is doing the calculation and for what purpose.
GUIDELINES FOR REPORTING FREIGHT GREENHOUSE GAS EMISSIONS DOC REF NO: LG08
VERSION NO: 1.0 DATE: SEPTEMBER 2013
P a g e | 51/ 108
© Odette International Ltd
The ease of gathering data will depend on who is carrying out the reporting. This might commonly be:
1. The transport operator or carrier
2. The forwarder or transport service provider who is directly controlling the transport
3. The transport service user - the customer of the transport
The main data that may be needed is:
Pick-up and delivery point location
Transport mode or vehicle
Amount of goods moved
Route and distance
Transport Load Factor (how heavily loaded is the truck)
Fuel consumption or energy use
There are two main sources for the data: the transport management systems used for directly
controlling the freight and the transport service user’s planning systems used for specifying and paying
for the freight. The reporter may be able to obtain additional data from other external sources such as
those involved in specific transport activities.
In most cases, if data from the transport management system is used, the calculations will be made by
the transport service provider and the transport service user will be given summary results about
emissions (though there may be cases when the transport service user will be interested in receiving
more detailed data for various reasons).
Alternatively, the transport service user may use their own systems for calculating GHG emissions.
These two alternatives are considered in the sections below.
Data from the transport system
Information about goods moved is of course vital in transport management and we can expect
any forwarder to have information readily available on the key parameters- pick-up and
delivery points, transport mode, amount of goods moved and in most cases, routings and
distances covered.
Much of this information will normally also be available to the transport service user via
freight invoices and other transport documents. When there is no direct fuel consumption
data, another source of information can be the purchased fuel invoices.
The ability to provide the data will depend on the size and resources of the companies
involved. There may be those who are only able to give the information after some kind of
investigation while others will be able to give the data easily from their internal ERP systems.
It is expected that due to the increasing needs for GHG reporting, transport service providers

GUIDELINES FOR REPORTING FREIGHT GREENHOUSE GAS EMISSIONS DOC REF NO: LG08
VERSION NO: 1.0 DATE: SEPTEMBER 2013
P a g e | 52/ 108
© Odette International Ltd
will develop continuously their systems in order to improve the quality of their information.
Such developments could include linking their on-board Data Terminals and Fleet
Management Systems (for GPS-based routing information, real fuel consumption etc.) closer
to their ERP systems and to information about goods and customers.
Transport Load Factor
Information on transport load factor (how heavily loaded the vehicle is) enables use of more
accurate emissions factors and also allows emissions efficiency metrics (emissions per tonne
carried) to be calculated. However this data will not always be easily available from the
transport system. To collect such information the forwarder must be able to identify the
various goods transported and relate them to individual shipments and/or transport service
users. In order to provide such data, the forwarder must also calculate how to allocate
emissions to specific shipments. This is something which could be quite complex if there are
several transport legs, reloading is involved and empty transport etc. is to be included.
Fuel consumption or energy use
As per the direction of the French Decree, the aim is to obtain the best available data on fuel
usage to drive the calculation processes. As it is such a major element of cost, carriers
generally have a good understanding of fuel efficiencies of their fleets, though they may
consider this as commercially sensitive information.
Data from the transport service user system
Many transport service users in the automotive industry are quite well equipped with their
own data that could be used for calculation of emissions. Collecting your own data would be
an alternative for certain information needs, such as if you want to verify received data, if you
want to do bench marking, or compare various options for locations, routes etc. Production
planning, sourcing, logistics etc. handled by the automotive industry’s internal systems contain
information about:
Amount of goods moved (through delivery schedules, packaging instructions, transport bookings….)
Pick-up and delivery point (at least for the first and last location, maybe not always intermediate locations for complex transport chains)
Route and distance (at least the average distance, maybe not the route)
Transport mode or vehicle (at least transport mode for actual transport legs, normally not vehicles)
Transport load factor may be possible to derive from other data. For finished vehicle transportation it is relatively straightforward to assign numbers of vehicles carried to equipment used.

GUIDELINES FOR REPORTING FREIGHT GREENHOUSE GAS EMISSIONS DOC REF NO: LG08
VERSION NO: 1.0 DATE: SEPTEMBER 2013
P a g e | 53/ 108
© Odette International Ltd
Fuel consumption data – this information is normally not available in the internal systems of transport service users. Whilst fuel efficiencies can be obtained from public sources (see Section 7.3.2), various other approaches could be taken to obtain more accurate factors, e.g. by talking to equipment manufacturers, asking carriers for average figures, or, if available, using data from closely monitored transport operations and then applying the results to general operations.
7.2.2 CHOICES FOR COLLECTION OF DATA
A transport service user, such as an automotive OEM, has a choice to make as to whether to request
their individual service providers to provide emissions data or whether they calculate the emissions
themselves, as indicated in the below chart.
Transport Service Provider or Transport Operator
Transport Service User (e.g. OEM)
1. Calculates full emissions Receives full emissions data
2. Provides operating data (distances, loads etc.)
Calculates emissions from operating data
3. Provides basic reference data within invoices
Obtains necessary operating data from planning system and/ or invoices & calculates emissions
Table N°1: Strategies for data collection/ calculation
Each of these approaches has pros and cons.
The first approach, where an OEM is provided with emissions data by the carrier, is the method
promoted by the French Decree and is likely to be the future long-term method once all transport
service providers and operators are fully experienced and skilled in Greenhouse Gas reporting.
However, from an OEM’s perspective, a comprehensive set of emissions data will only be possible if all
carriers are able to calculate themselves. An OEM may consider that in the short-term they will only
gain a full picture by obtaining the basic route and load information from the operators and then
performing the calculations themselves.
7.2.3 TEMPLATES FOR GATHERING DATA
As explained in Section 6.4, spreadsheets provide a practical way of gathering and calculating
emissions data. Examples of templates of GHG calculation is also provided in Appendix 3.
The exact layout used is best tailored to the particular requirements e.g. timespan, format of available
data, breakdown of transport legs etc.

GUIDELINES FOR REPORTING FREIGHT GREENHOUSE GAS EMISSIONS DOC REF NO: LG08
VERSION NO: 1.0 DATE: SEPTEMBER 2013
P a g e | 54/ 108
© Odette International Ltd
7.2.4 DATA FOR RAIL FREIGHT
Rail freight is frequently used within Europe for transport of both automotive component parts and
finished vehicles. Its use is encouraged by governments both as a means of reducing emissions and to
keep traffic off the road.
Emissions from rail freight vary considerably according to the type of locomotive power. Diesel trains
produce most of their emissions by direct fuel combustion. With electric trains, the majority of
emissions are upstream emissions produced during the generation of electricity. Different methods of
generation produce very different levels of emissions, with nuclear and hydro-electric producing
significantly less CO2 compared with oil and gas.
Different route infrastructures and economic considerations will influence choice of power sources by
the rail operators. Trains vary in size and efficiency and emissions will depend also on speeds and
operating cycles. Rail use by automotive companies is generally repetitive, with the same routes being
used on a regular basis. The best approach for emissions reporting is to list out all the different rail
legs used, to establish the standard emissions for each and then to multiply by the number of trips
taken.
Because of the wide variation of emissions produced on different routes and with different
configurations of train, it is recommended not to use a generic emissions factor for all rail freight.
Instead, a first step would be to approach the specific rail operators providing the transport and ask
for emissions data direct. An alternative is to use the EcoTransIT tool which has been established with
the input of major European rail operators and takes account of different routings, power sources and
equipment configurations.
7.2.5 DATA FOR SEA FREIGHT
The main types of sea freight used within the automotive industry are:
Container shipping - for long distance shipping of parts and, in some cases, vehicles
Roll-on/ Roll-off ferries – for road trailers of parts and for finished vehicles
Dedicated car transporters
Relative emissions from sea freight are low - in fact the biggest element of emissions for a door to
door route can be road freight to and from the ports of exit and entry.
As with rail freight, most routes will be run on a regular basis so it is recommended to list out all the
legs and then establish the standard emission for each.
Many shipping lines can provide emissions data to cover specific routes taken.

GUIDELINES FOR REPORTING FREIGHT GREENHOUSE GAS EMISSIONS DOC REF NO: LG08
VERSION NO: 1.0 DATE: SEPTEMBER 2013
P a g e | 55/ 108
© Odette International Ltd
Where a variety of carriers or vessels may be used or if specific carrier information is not available, it is
recommended to use a data set such as that provided by the Clean Cargo Working Group (CCWG) for
international container freight. The CCWG database has been established through the direct input of
data by shipping lines.
There are different ways of allocating ocean emissions. For practical reasons, for container shipping
many look at emissions per container. The CCWG use this approach. Other shipping lines look at
emissions per tonne carried. Dedicated car transporters may be able to provide data on emissions per
car carried.
7.2.6 DATA FOR AIR FREIGHT
Within the automotive industry air freight tends to be used only in emergencies, or for shipment of
prototype parts and vehicles. As much for cost reasons as any other, volumes flown tend to be low.
Due to the high fuel usage of aviation, GHG emissions per tonne of freight carried are very high
compared to terrestrial transport modes. However due to the low volumes shipped, automotive
companies may find that the total air emissions is low compared with their total freight emissions.
For detailed analysis, many airlines can provide emissions data for freight carried, normally as a factor
related to weight of cargo.
7.3 SELECTING EMISSIONS FACTORS
There are two types of factors:
1. Fuel emissions factor - literally how much GHG is generated by burning a litre of fuel
2. Parameter based factor - how much GHG results from transporting units of material set
distances on particular types of transport…e.g. CO2 per tonne km for different trucks.
These two types are discussed in the next two sections, followed by a section discussing how to
choose which emissions factors to use from the wide range of sources available.
7.3.1 FUEL FACTORS
A fuel factor is needed to convert fuel usage into emissions. The factor is normally expressed in terms
of kilograms of CO2 or CO2e per litre of fuel.
Emissions factors can be obtained from the data sources listed in Section 11.3.

GUIDELINES FOR REPORTING FREIGHT GREENHOUSE GAS EMISSIONS DOC REF NO: LG08
VERSION NO: 1.0 DATE: SEPTEMBER 2013
P a g e | 56/ 108
© Odette International Ltd
The Greenhouse Gases in exhaust emissions generally all come from the burning of carbon contained
in the hydrocarbons within the fuel. Working out the fuel factor is not straightforward as the chemical
make-up of most fuels such as petrol and diesel is variable, depending upon the quality of the crude oil
and decisions made during the refining process. Different markets have different blends of fuel.
Assumptions also have to be made as to how efficiently the fuel is being combusted when used, i.e.
how much of the carbon actually is turned into CO2. The result is that different authorities may quote
different fuel factors for similar fuels. However the differences are slight and should not be a major
concern so long as the factor being used is clearly stated.
As explained in Section 5.5 there are two other considerations:
1) Many data sets now include factors giving total ‘CO2 equivalent’ (CO2e) emissions, to take
account of emissions of other Greenhouse Gases besides Carbon Dioxide.
2) In order to account for emissions created during fuel production, then ‘Well to Wheel’
emissions factors can be used rather than simple ‘Tank to Wheel’ factors.
Note that when GHG reporting began, the emphasis was on CO2 only and on Tank to Wheel emissions,
so emissions factors were published on this basis. Increasingly, however, data sets are also providing
factors to support reporting on the CO2e impact of all Greenhouse Gases and on Well to Wheel fuel
emissions. (See Section 5.5 for explanation of these differences).
At the time of writing, the authors of the French Decree have stated that they are moving towards
using CO2e factors.
A useful set of CO2e Fuel Factors that should be generally applicable in Europe is provided in the Annex
of the CEN 16258 Standard.
For automotive diesel, CEN provide the following factors:
CO2e emissions from Tank to Wheel: 2.67 kg/ litre
CO2e emissions from Well to Wheel: 3.24 kg/ litre
7.3.2 PARAMETER-BASED EMISSION FACTORS
Emission factors are required to allow the calculation of emissions where exact fuel usage is not
known. Emission factors for specific vehicles may be available from specification data sheets provided
by the vehicle manufacturer.
More generally, emissions factors for different transport modes and categories of vehicles are
available from a variety of authorities and web sites.
Basic databases may just give generic data for types of transport, e.g. ‘Heavy Goods Vehicle’. Better
databases will sub-divide transport into different types, e.g. ‘40 tonne truck Euro 5 emission level’.

GUIDELINES FOR REPORTING FREIGHT GREENHOUSE GAS EMISSIONS DOC REF NO: LG08
VERSION NO: 1.0 DATE: SEPTEMBER 2013
P a g e | 57/ 108
© Odette International Ltd
Increasingly, databases are being updated to include data relating to different operating parameters
such as trailer loading and short vs. long-haul running. This might allow categorisation such as ‘road
transport, 40 tonne truck, long haul, 65% utilisation level’.
While choosing the conversion factors, the user must understand whether they are relative to CO2,
GHG, TTW, WTT, etc… and should be careful not to mix many references without proper reasoning.
For instance, the French diesel is not the same as the British one and it is not relevant to obtain TTW
emission factors from a British database and WTT emission factors from the French one.
According to the CEN Standard, any GHG emission factors used for implementing this standard shall
be:
The values specified by the fuel supplier
If unavailable, the values established by CEN (In Annex A of the standard)
Values from other guidance if their relevancy can be proven.
Odette recommends companies avoid using numerous references in their calculation sheets and
should, where possible, select a single source for emission factors that is appropriate for their use. It is
recognised however that as full data sets are not yet readily available, it may be necessary to use
different ones to cover, for example, different modes or different geographical regions. Each source
used should be fully referenced within the report.
Different references give different results, but they are generally close. To illustrate this, the following
example shows results emissions calculation using 4 different standards: CEN, French decree, UK
Guidelines and NTM.
The examples consider an articulated 40 tonne diesel Truck travelling a distance of 100 km, 50%
loaded with automotive parts.
CEN Standard
The CEN Standard does not provide values by truck type but recommends looking for them
from trusted references. The French Decree provides such values for average loading. While
posing the hypothesis of an articulated 40t Truck for various freight types, a first table gives us
0.338 L/km of fuel consumption (the filling rate is not important since it is an average value
taking into account empty running). The truck consumed 33.8 L of HGV Diesel.
The CEN Standard recommends taking values from the fuel supplier. However, we will take
values that CEN proposes: 2.67 kg CO2e/L of diesel in TTW emissions and 3.24 kg CO2e/L of
diesel in TTW emissions.
Hence, the results would be 90kg CO2e in TTW emissions and 110 kg CO2e in WTW emissions.

GUIDELINES FOR REPORTING FREIGHT GREENHOUSE GAS EMISSIONS DOC REF NO: LG08
VERSION NO: 1.0 DATE: SEPTEMBER 2013
P a g e | 58/ 108
© Odette International Ltd
French Decree
The truck consumed 33.8 litres of HGV diesel.
The French Decree states it is mandatory to report CO2 emissions, but the French guidance for
application gives emission factors for CO2e emissions also for optional reporting. TTW
emissions would be 2.49 kg CO2/L diesel and WTW emissions of 3.07 kg CO2/ L of diesel.
Hence the total emissions, according to the French decree, would be 84 kg CO2e in TTW
emissions and 104 kg CO2e in WTW emissions.
UK DEFRA Guidelines
The DEFRA guide provides a simple to use tool where if you enter into the data sheet 100 km
for a 50% filled diesel HGV >33t articulated truck. The result gives directly the GHG emissions:
94 kg CO2e in TTW emissions and 114 kg CO2e in WTW emissions.
NTM
NTM also provides a tool where in addition to weight, distance and truck type it is also
possible to add parameters for road type, Euro emissions class, how hilly the road is etc. The
result when calculating a trip of 100 km for a 34t truck carrying 20 tonnes gives the following
GHG emissions: 82kg CO2e in TTW emissions and 88 kg CO2e in WTW emissions.
This is based on a fuel consumption of 31.8 litres for the whole trip, 2.57 kg CO2e/L in TTW
emissions and 2.77 kg CO2e/L in WTW emissions.
This example demonstrates that there can be variation between results using different factors and so
shows that caution must be taken when comparing results from different sources.
The low WTW emission value in NTM is because the NTM calculation is based on Swedish fuel data.
The difference between Swedish average diesel fuel and European average fuel can be explained by
Swedish refineries having higher refining energy efficiency and having lower usage of fossil fuel based
electricity. This highlights the importance of comparing similar systems and basing them on
comparable assumptions.
Nevertheless, the range of variation is generally small and probably within the level of variation of
other aspects of the process and should not be of major concern. It is certainly clear there is no one
correct result. It should not be interpreted as if one process is necessarily better than the other but
instead that there are different views on the emission values and that there are quite some
uncertainties in these values.
Once again, to allow meaningful statements about improvements it can be seen that whichever
methodology you use you should follow it consistently.

GUIDELINES FOR REPORTING FREIGHT GREENHOUSE GAS EMISSIONS DOC REF NO: LG08
VERSION NO: 1.0 DATE: SEPTEMBER 2013
P a g e | 59/ 108
© Odette International Ltd
A final point to stress is that emissions factors are regularly being updated. There is therefore great
advantage in keeping the raw data used in calculations so that at a future point it is possible to
recalculate prior results using new factors, thereby allowing better quality comparison of data from
different years. See also comments about automating the calculation process in Section 6.4.
7.3.3 WHICH EMISSIONS FACTORS TO USE
At the time of writing, no one data source provides a fully comprehensive set of factors, though they
are improving on an annual basis.
They have the same general purpose but vary in terms of:
Coverage - are all required modes & type of freight covered?
Regional - are factors applicable to just one country or can they be used regionally?
Detail - how specific are they to particular vehicle types, trailer loadings, road conditions etc?
It is important to use values from recognised sources. The CEN Standard provides a list of sources; the
French Decree provides values for average loading to be used though does allow use of other sources
where justified.
Faced with the choices available, the following considerations may be used to help decide which
factors to use:
Is the use of a specific data set required by the reporting standard you are following or by the customer of your data?
Is there a data set already in use by your company or customer that it would be sensible to use for consistency?
Is there a particular data set that is linked to guidance relevant to your main country of operation? (e.g. DEFRA for UK, NTM for Sweden or ADEME for France)
Is there a data set particularly aligned to your main mode of operation? (e.g. EcoTransIT for European rail or CCWG for ocean freight)
Is there a data set that takes into account specific areas of interest, such as use of vehicles complying with different emissions standards? (e.g. HBEFA)
Emissions factors can be obtained from the data sources listed in Section 11.3.

GUIDELINES FOR REPORTING FREIGHT GREENHOUSE GAS EMISSIONS DOC REF NO: LG08
VERSION NO: 1.0 DATE: SEPTEMBER 2013
P a g e | 60/ 108
© Odette International Ltd
8. REPORTING GUIDANCE
This section is intended to give practical guidance on contractual aspects of GHG reporting. Potential
content in legal agreements (in most cases as part of transport agreements) is listed with references to
reporting scope and requirements. Examples are given for GHG reporting as part of legal obligations or
as part of business activities respectively. Detailed recommendations are given for how to agree
administrative and technical details of the reporting.
8.1 DIFFERENT TYPES OF REPORTING
Up till now there has been considerable variety in how GHG reporting has been carried out, in terms of
accuracy levels, data sources and administrative tools used. Over time we can expect a development
towards more mature solutions as illustrated in Figure N°12 below. In the future, many of these
communications are likely to be performed electronically by using EDI or similar methods.
Figure N°12: Basic model for communicating and fulfilling GHG reporting demands
The model in Figure N°13 represents a high level of ambition, but could also be applied without using
all of the components.

GUIDELINES FOR REPORTING FREIGHT GREENHOUSE GAS EMISSIONS DOC REF NO: LG08
VERSION NO: 1.0 DATE: SEPTEMBER 2013
P a g e | 61/ 108
© Odette International Ltd
When looking in detail at this example, the following may be noted:
The model defines the basic structure of the transport chain with transport legs and parties
involved
In this case the reporting requirements are defined by the Transport user
Reporting requirements are forwarded step by step from one Tier to the next Tier in the
transport chain, thus covering all related transport legs
Reporting is made from lower Tiers to higher Tiers according to what has been agreed and/or
stipulated
8.2 REPORTING PRINCIPLES
The Greenhouse Gas Protocol provides a helpful list of key principles to follow:
RELEVANCE –
Ensure emissions reports appropriately address the questions being asked
COMPLETENESS –
Account for and report on all emissions within the chosen scope.
Identify and justify any exclusions.
CONSISTENCY –
Use consistent methodologies to enable meaningful comparisons to be made.
TRANSPARENCY –
Make clear all assumptions made and methodologies used and include references
to sources to provide a clear audit trail.
ACCURACY –
Aim to provide data that is as accurate as is practical.
Where possible give an estimate of tolerance band within which results lie.
8.3 FIRST STEPS IN REPORTING
When starting reporting it is unlikely that you will be able to fully report from day 1.
It is suggested that the first step should be to lay out all the different operations you might consider to
include and then develop a phased plan.
The GHG Protocol recommends that you should make at least a high level estimate of all the different
elements of your operations so you can then focus your resources on reporting the most significant
ones.

GUIDELINES FOR REPORTING FREIGHT GREENHOUSE GAS EMISSIONS DOC REF NO: LG08
VERSION NO: 1.0 DATE: SEPTEMBER 2013
P a g e | 62/ 108
© Odette International Ltd
For logistics, because so much of CO2 emission is related to fuel used, a high level estimate could be
made simply by estimating the total fuel bills of each element of operation and then applying a simple
fuel factor to convert litres of fuel into CO2 emitted.
Total fuel bills can be estimated by considering the % that fuel costs from the overall freight costs.
If you have your own transport you should have all the fuel data available and therefore an estimate
should not be needed.
8.4 INTERNAL REPORTING
Any internal analysis of Greenhouse Gas emissions should be backed up with all necessary information
so that the provenance and accuracy can be readily checked at a future date.
Reasons for good reporting integrity include:
Potential need to support company auditing
Ability to re-use data to answer additional reporting requests
Help simplify the task of updating data to reflect any future changes in reporting practice, such as the use of updated emissions factors
As a minimum any report should include the following:
Clear definition of scope
Roles & responsibilities of those people involved
Explanation of calculation methodology & assumptions made
Identification of data sources
List of all assumptions
List of emissions factors being used (and sources)
Confirmation of any recognised standards that are being adhered to
Validation procedures and sign offs required
Distribution list
8.5 REPORTING BETWEEN DIFFERENT PARTIES
Where emissions data is requested from one party to another, some form of agreement will be
needed as to what to report.
Sometimes reporting practices may be defined by legislation. More commonly the requestor will have
more of a free hand in defining what they would like to receive.
Initially, information may be requested in an ad hoc manner, but sooner or later the provision of data
is likely to become more formalised and may be incorporated within the commercial agreements
between the parties. If this is the case, then care should be taken to provide a proper specification for
the reports needed.

GUIDELINES FOR REPORTING FREIGHT GREENHOUSE GAS EMISSIONS DOC REF NO: LG08
VERSION NO: 1.0 DATE: SEPTEMBER 2013
P a g e | 63/ 108
© Odette International Ltd
8.5.1 LEGAL REQUIREMENTS (INCLUDING THE FRENCH DECREE)
Any legislative reporting requirements will likely give very clear guidance on how reports should be
presented. As an example, the French Decree is again used. It clearly defines reporting responsibilities
(to the service provider) and there are clear rules regarding the scope of the operations to be assessed
and the calculation processes to be used. There are also rules about submission deadlines and
reporting frequency as well as what additional reference information may be required on demand.
Reporting requirements within the French Decree
The French Decree comes into force from 1st October 2013. A summary of main aspects is presented
below. (For further help the French Ministry has published a Methodological Guide written by ADEME:
“CO2 information for Transport services: Application of Article L. 1431-3 of the French transport code”).
The French Decree stipulates:
The service provider shall identify the different segments (segment refers to any part of the
route taken or to be taken by a transport service over which the person or goods is/are
carried by the same means of transport) for the transport service, assess the quantity of
carbon dioxide for each segment and calculate the total of the values obtained in this way to
prepare information on the quantity of carbon dioxide emitted in a transport service. (The
French guidance for application gives emission factors for CO2e emissions also for optional
reporting)
The service provider shall provide the beneficiary (Transport Buyer) with sincere, clear and
unambiguous information, by any means considered appropriate.
The service provider may provide the beneficiary with information explaining the calculation
method and sources of energy used by any means considered appropriate”.
The basic principle of the French Decree is that Transport Service Providers are obliged to
report on GHG emissions for transport services to their Transport Buyers. This should be done
as agreed, or at the latest 2 months after execution of a transport service. The decree does
not put any obligation on the Transport Buyer other than receiving the information. The
Transport Buyer has the right to ask for complementary information explaining how
calculations were made. It is common that reporting is made more frequently/faster in long
term relations.
The French Decree refers to CEN Standard EN 16258:2012 for calculation processes. However
during the first period of implementation of the Decree, until 2016, transport providers are
free to use other calculation processes if preferred.
For empty transport, the service provider shall determine the procedure for integrating
emissions produced while equipment is running empty, e.g. during repositioning legs, empty
legs, and emissions while stopped with the engine running.
The information provided by any sub-contractor of a service provider and prepared in
accordance with the provisions of the decree and its enforcement orders shall be included in
the calculation method of the service provider without modification.

GUIDELINES FOR REPORTING FREIGHT GREENHOUSE GAS EMISSIONS DOC REF NO: LG08
VERSION NO: 1.0 DATE: SEPTEMBER 2013
P a g e | 64/ 108
© Odette International Ltd
8.5.2 COMMERCIAL AGREEMENTS ON REPORTING REQUIREMENTS
Greenhouse gas reporting has already become a part of some commercial relationships between
parties ordering or executing transport services. A demand for GHG reporting would normally mean
that the party buying the service, the Transport Buyer, would ask the Transport Service Provider for
information about emissions related to a specific transport.
The level of detail such reporting would require depends on factors such as:
The reason behind the request, such as legal requirements, CSR aspects, business
improvement
The complexity of the actual transport chain
The reporting capabilities of parties concerned
Basic requirements for an agreement for reporting are as presented in the chart below:
Requirements to be included Explanation
State the scope of reporting Provide full details of required scope:
Network/ Shipments to be covered
Time span to be covered
Activities to be included (the Vehicle Operation
System)
Type of emissions data needed - e.g. CO2 vs.
CO2e/ WTW vs. TTW
State timing requirements for reporting If the Transport Buyer wants to state frequency/ timing
when the Transport Service Provider is expected to
provide report
State how information on calculation
principles used should be given
If the Transport Buyer wants a standardised way of
receiving information from the Transport Service Provider
on calculation principles used.
If the Transport Buyer wants to clarify what calculation
principles should be used by the Transport Service
Provider
State accuracy levels using the 4 levels
defined by CEN, applied for each
transport activity
Accuracy levels could be different according to different
scopes. If the transport buyer wants to know the accuracy
levels used by transport service provider, including sub-
contractors involved, carriers should state at least the
percentage of activity covered by different accuracy level.
State accepted data format(s) and data
exchange method(s)
If the Transport Buyer wants to process information
received in a more efficient way he should ask for specific
formats and data exchange methods
Table N°2: Basic requirements for a reporting agreement

GUIDELINES FOR REPORTING FREIGHT GREENHOUSE GAS EMISSIONS DOC REF NO: LG08
VERSION NO: 1.0 DATE: SEPTEMBER 2013
P a g e | 65/ 108
© Odette International Ltd
Complexity of the transport chain
GHG reporting may often become a complex issue. This is because in many transport situations:
There are more than two parties involved. There might be one buyer of the service and
another party acting in between as a transport user. There might also be several parties
executing various parts of the service, for example in the case of using 4PL services.
There are several transport modes involved and the actual goods might go through
consolidation and deconsolidation during the transport.
Each leg of a journey might be carried out by a different transport operator.
Transport might carry material for more than one customer so allocation of emissions will be
required.
For these reasons it may be necessary to engage other parties in discussions on commercial
agreements to ensure that it is clear how various emissions will be allocated amongst all those involve
and there will be neither omissions nor double-counting.
Technical capabilities of different players
Reporting capabilities will vary among providers of transport services due to various reasons:
Availability of data is of vital importance. There are some providers able to use real data from
the transport equipment (ship or truck…) while most of the others will rely on average or
calculated data from their own sources and/or external sources. Some are not in a position to
carry out GHG reporting at all.
Reporting capability is also dependant on whether the service provider is able to link their
emissions data to specific shipments.
Technical capabilities are also important - does the service provider possess the necessary
resources for GHG reporting? Most GHG reporting at present is based on ad hoc procedures
on a mainly manual basis. In the future, automated IT solutions with electronic data
interchange may be more readily available which might reduce the workload involved.
Where resources are limited it is recommended to prioritise:
Focus on obvious needs due to legal and/or commercial requirements
Focus on the transport cases with the highest impact for the transport user
Use best available data
Follow a strategy for continuous improvement in quality and scope of reporting
Suggested content for reporting agreements between transport user and transport provider
While GHG reporting is now becoming a part of commercial relationships, there are negligible
standard procedures available for specifying GHG reporting requests. A transport buyer who wants
their transport providers to provide environmental information should lay their requirements out in a
specification to support negotiations and contractual agreements. These requirements could be
considered as either quantitative and/or qualitative.

GUIDELINES FOR REPORTING FREIGHT GREENHOUSE GAS EMISSIONS DOC REF NO: LG08
VERSION NO: 1.0 DATE: SEPTEMBER 2013
P a g e | 66/ 108
© Odette International Ltd
Quantitative requirements
This is where the transport buyer would specify a need for numerical data. The data required
will depend on the requestor’s own approach to gathering the data.
At one extreme, the requestor may want the transport provider to calculate the emissions
themselves and simply provide the resultant quantities.
In this case, the provider should supply:
The value of calculated emissions
A reference to the actual transport service for which the calculations apply (in its
simplest form a unique Shipment/Consignment ID)
The calculation method & assumptions, the source of emissions factors used and the
accuracy level applied.
Alternatively, the requestor may want to carry out the calculations themselves, perhaps to
achieve consistent results across multiple carriers and transport modes. In this case the
requestor would just want the raw data required for the calculation, such as:
Transport mode
Distance covered
Load carried
Type of fuel
If available the type of equipment used and any available fuel economy (litres/ 100 km) data
might also be requested.
If reporting is required over the long term, then the most efficient approach is to establish a
regular routine. Linking GHG reporting to established business procedures, such as ordering
and invoicing of transport, will prove to be the easiest and most precise solution. For the
moment, there are various obstacles that need to be removed to facilitate a development in
this direction, such as:
Current in-house applications, like ERP systems, do not support handling of GHG
reporting
There are no standards for exchanging GHG related information, in invoices or
otherwise
The level of business integration in general in transport management is not mature
enough

GUIDELINES FOR REPORTING FREIGHT GREENHOUSE GAS EMISSIONS DOC REF NO: LG08
VERSION NO: 1.0 DATE: SEPTEMBER 2013
P a g e | 67/ 108
© Odette International Ltd
Qualitative requirements
At the same time as defining reporting requirements, it may also be relevant to add other
requests within the same commercial agreement. These may refer to steps that the service
provider should take to ensure steps are taken to ensure that the most environmentally
efficient equipment is used and that continuous improvement methods are adopted.
See Section 9.4 for more discussion on this.
8.6 ELECTRONIC EXCHANGE OF EMISSIONS DATA
It is likely that, as with other key business information, electronic data exchange will increasingly be
used for emissions data communication between different parties. There are a number of data
formats that could be used, or are already in use. To review the options we need to consider different
information exchange scenarios, such as the following:
Information is given by the transport service provider to the transport buyer in a dedicated
report
Information is given by the transport service provider to the transport buyer in combination
with other business information, such as invoices
Information is made available by the transport service provider for downloading by the
transport buyer
The table below discusses the applicability of different exchange formats for each of these scenarios.
Information exchange
scenario Comments on data formats
Information is given by
the transport service
provider to the
transport buyer in a
dedicated report
The simplest formats to be used would be spreadsheets or statistical
reports/diagrams/tables. The advantage would be simplicity; no
advanced IT solution is needed. The disadvantage is that much of the
input as well as usage of data will require manual intervention.
A somewhat more advanced solution would be that the transport buyer
will ask the transport service to give reports over a web portal. The
advantage with this solution is that it allows for automation of
information handling by the transport buyer. The transport service
provider will still depend on keying in data manually.
A more advanced solution would mean that standardised messages are
exchanged automatically. This would allow for automated information
handling at both parties. This solution is not available today, but could be
made available in a few years provided that there are standardised
messages developed by organisations such as Odette International and

GUIDELINES FOR REPORTING FREIGHT GREENHOUSE GAS EMISSIONS DOC REF NO: LG08
VERSION NO: 1.0 DATE: SEPTEMBER 2013
P a g e | 68/ 108
© Odette International Ltd
Information exchange
scenario Comments on data formats
that ERP systems at transport service providers, as well as at transport
buyers are developed to incorporate support for handling of GHG
reporting information. The most likely technical format for GHG reporting
messages will be Web Services.
Information is given by
the transport service
provider to the
transport buyer as part
of other business
information, such as
invoice
This might be a good solution, at least for the basic reporting (GHG
emission value plus reference to the actual transport service). This
information could quite easily be added into any type of invoice,
irrespective of whether it is paper based or in an electronic format. It
simply requires some additional reference information in the invoice.
However, this solution would be less appropriate if the aim is to give
more details as listed above (Qualitative environmental data,
Quantitative environmental data etc.)
Information is made
available by the
transport service
provider for
downloading by the
transport buyer
In this case the transport service provider will give a link (URL address) to
the transport buyer where GHG report information could be downloaded.
This address could be added to the invoice. The format could be anything
from simple “office program” type information to more integrated
solutions (Web Services). The data content could be either just basic data
or more advanced reporting (Qualitative environmental data,
Quantitative environmental data…)
Table N°3: Examples of technical data formats
8.7 ENERGY USAGE REPORTING
Many bodies interested in monitoring CO2 are also interested in energy usage, from a sustainability
perspective. In addition, many financial departments may focus more on energy due to it being a more
direct cost driver than are GHG emissions. An example is the CEN organisation, which has included the
requirement for energy reporting within their transport GHG reporting Standard. The good news is
that for freight transport, similar processes can be used to calculate both, as they are both directly
linked to fuel usage. All that is generally needed is to obtain an appropriate factor to convert fuel
usage to energy consumption (in mega joules, MJ).
Many sources of Greenhouse Gas emissions also provide energy factors.
For automotive diesel, CEN 16258 provides the following factors:
Energy usage from Tank to Wheel: 35.9 MJ/ litre
Energy usage from Well to Wheel: 42.7 MJ/ litre

GUIDELINES FOR REPORTING FREIGHT GREENHOUSE GAS EMISSIONS DOC REF NO: LG08
VERSION NO: 1.0 DATE: SEPTEMBER 2013
P a g e | 69/ 108
© Odette International Ltd
9. STRATEGIES FOR REDUCING EMISSIONS
An overview of how GHG reporting can help in achieving reductions in emissions
All initiatives in GHG reporting have a central purpose- to encourage people to reduce their overall
emissions. While these Guidelines are not aimed at providing detailed information on methods to
reduce emissions, the following sections outline some steps that will help make any emissions
reductions easier to achieve.
9.1 ESTABLISHING A BASELINE
To track progress it is essential to have a baseline. Typically, for GHG reporting, this might be done by
calculating all transport GHG emissions for a particular year. Emissions in future years can be
compared to the emissions in this baseline year in order to review changes.
The exercise of establishing baseline data has added benefits.
It will help you understand the process issues and resources required to carry out reporting.
Analysing the results will enable you to understand relative emission levels of different elements of your operations and thereby allow you to prioritise improvement actions for maximum impact.
Key steps to take to develop a set of baseline results are:
1. Agree scope and time period to be covered by a baseline report and publicise within the
organisation
2. Document processes to be used and ensure all involved are trained in advance
3. Consider carrying out trial reporting prior to the actual baseline report to prove out data
gathering processes
4. Retain all data used for the report so that adjustments can be made to suit any future changes
in calculation methods
9.2 USE OF METRICS
Analysing total GHG emissions in total may not be the most effective way of managing performance.
Total emissions are directly related to the scale of operations, so an expanding business may have year
on year major increases in emissions.
The answer is to normalise the data by measuring emissions relative to business intensity.
The choice of metrics would depend on the nature of the business and the perspective being taken.

GUIDELINES FOR REPORTING FREIGHT GREENHOUSE GAS EMISSIONS DOC REF NO: LG08
VERSION NO: 1.0 DATE: SEPTEMBER 2013
P a g e | 70/ 108
© Odette International Ltd
For general transport a useful metric for comparing equipment efficiency is ‘emissions per kilometre per ton of freight carried’. This approach allows comparison of carriers and equipment whatever the goods being carried. (See 6.3.2 for more on this approach).
For a carrier specialising in car transport, an appropriate metric would be ‘emissions per kilometre per car carried’.
For a component supplier interested in the footprint of their product, a useful metric might be ‘emissions per part produced’.
Within the automotive sector, an obvious measure for OEMs to consider would be ‘emissions per car produced/sold’.
An automotive OEM might consider two perspectives. For inbound freight they could look to improve
their supply chain emissions by minimising total inbound transport emissions per car produced. For
outbound transport, they could look to improve the emissions from their distribution network by
minimising outbound freight emissions per car sold.
9.3 OPPORTUNITIES FOR IMPROVEMENT
There are a wide range of elements within the supply chain that impact freight emissions. It is not the
intention of these guidelines to investigate these in detail, however the chart below illustrates the key
parameters that can be looked at to generate improvements.
Figure N°13: Keys parameters for improvements
It is recommended that companies use CO2 reporting techniques to support the analysis of the
business benefits of any changes to these parameters.

GUIDELINES FOR REPORTING FREIGHT GREENHOUSE GAS EMISSIONS DOC REF NO: LG08
VERSION NO: 1.0 DATE: SEPTEMBER 2013
P a g e | 71/ 108
© Odette International Ltd
9.4 ENGAGEMENT OF CARRIERS IN REDUCING EMISSIONS
OEMs are increasingly requesting specific commitments as part of service level specifications.
Examples of requirements that may be included are:
The service provider should have in place an environmental policy with continuous
improvement objectives
The transport service provider should only use trucks powered by engines above a certain
Euro emissions class.
The transport buyer requires all drivers to have undertaken training in eco-driving.
The transport buyer requires that Transport Services used should have undergone a certain
certification, for example, Green Freight Europe, Clean Shipping Index or ADEME charter
Objective CO2.
9.5 BENEFITS OF A STRATEGIC APPROACH
Companies should adopt strategic plans to reduce their freight emissions. Having the support of senior
management in setting emissions targets will help drive improvements; having a structured approach
will help ensure that momentum is maintained.
This approach should align with the need for an Environmental Management System required for
compliance with ISO 14001. It will also help in responding to the expectations of Corporate
Sustainability surveys (as covered in Section 3.3.3).
It should always be remembered that as emissions are so intimately related to fuel usage, most
emissions reduction actions will also achieve financial savings in terms of reduced fuel bills - a win-win
situation in which all stakeholders can benefit.

GUIDELINES FOR REPORTING FREIGHT GREENHOUSE GAS EMISSIONS DOC REF NO: LG08
VERSION NO: 1.0 DATE: SEPTEMBER 2013
P a g e | 72/ 108
© Odette International Ltd
10. FUTURE TRENDS
This section gives an overview of trends related to governmental actions and forthcoming legislation
for reporting or taxation purposes. It also links GHG reporting to general developments in demands for
sustainability reports.
10.1 GOVERNMENT ACTIONS
10.1.1 CO2 REDUCTION COMMITMENTS
As discussed in section 2.7, governments have made commitments on significant reductions in CO2
emissions. Across all sectors, the European Union has committed to reducing its 1990 level of CO2
emissions by 20% by 2020 and is looking to reduce by much higher percentages by 2050.
As previously mentioned, the EU 2050 target for transport emissions reduction is 60% vs. 1990 levels.
Much work has been going on to identify how best this can be achieved. The 2011 White Paper on
transport highlights goals in three areas:
Developing and deploying new and sustainable fuels and propulsion systems
Optimising the performance of multimodal logistics chains and making greater use of more energy-efficient modes
Increasing the efficiency of transport and of infrastructure use with information systems and market-based incentives
Of particular relevance to freight is the goal that “thirty per cent of road freight over 300km should
shift to other modes such as rail or waterborne transport by 2030, and more than 50% by 2050,
facilitated by efficient and green corridors. To meet this goal will also require appropriate
infrastructure to be developed.” 1
10.1.2 FREIGHT CO2 REPORTING
Recognising a need to understand the CO2 emissions of the freight sector, the EU has co-funded the
COFRET (Carbon Footprint of Freight Transport) project. The objective is to identify and test a
harmonized methodology for freight CO2 reporting. The project has not yet concluded, but it is
reviewing the impact of the CEN standard and many of the other initiatives covered within these
Odette Guidelines and would be expected to draw on the common themes covered.
No doubt the new French Decree making freight CO2 reporting mandatory is being looked on with
interest by other National Governments.
Within the UK, the Freight Transport Association is running a voluntary scheme to capture freight
emissions data with the objective of being able to monitor any improvements being made.
1 http://ec.europa.eu/transport/themes/strategies/2011_white_paper_en.htm

GUIDELINES FOR REPORTING FREIGHT GREENHOUSE GAS EMISSIONS DOC REF NO: LG08
VERSION NO: 1.0 DATE: SEPTEMBER 2013
P a g e | 73/ 108
© Odette International Ltd
10.1.3 CARBON TAXATION
Various different approaches in direct and indirect taxation are gradually being introduced in an effort
to curb emissions. In many cases the actions are being targeted on reducing energy use as energy
usage is often easier to quantify and regulate and the effect can be the same.
Examples include:
Tax levies on fuel prices
Reduced road tax for lower-emitting vehicles
Incentives for use of bio-fuels
Vehicle tax incentives for alternative propulsion systems (electric/ hybrid)
Road usage charging
The EU follows the principle of ‘Polluter Pays’, as enshrined in the European Treaty, so it is expected
that where possible, taxation regimes will be targeted to make the biggest demands on those
operators that are generating the most emissions.
10.1.4 CARBON TRADING
Emission trading is a tool of the environment policy. It is an approach to control emissions, by
providing economic incentives.2The idea is that a country that is able to generate savings in emissions
can transfer that saving, at a price, to others who are finding it more difficult
There are different trading systems:
The bilateral trade between countries
The trade between companies
The trade for private households
In Europe, the European Union Emission Trading System (EU ETS) is the basis of the European Union's
policy to combat climate change and is a key tool for reducing industrial greenhouse gas emissions
cost-effectively. Being the first and largest international scheme for the trading of GHG emission
allowances, the EU ETS covers some 11,000 power stations and industrial plants in 30 countries.
2 http://unfccc.int/kyoto_protocol/mechanisms/emissions_trading/items/2731.php

GUIDELINES FOR REPORTING FREIGHT GREENHOUSE GAS EMISSIONS DOC REF NO: LG08
VERSION NO: 1.0 DATE: SEPTEMBER 2013
P a g e | 74/ 108
© Odette International Ltd
The EU ETS was launched in 2005 and works on the "cap and trade" principle. This means there is a
limit on the total amount of certain greenhouse gases that can be emitted by the factories, power
plants and other installations in the system. Within this limit, companies receive emission allowances
that they can sell to or buy from one another as needed. The limit on the total number of allowances
available ensures that they have a value. At the end of each year each company must surrender
enough allowances to cover all its emissions, otherwise heavy fines are imposed. If a company reduces
its emissions, it can keep the spare allowances to cover its future needs, or else sell them to another
company that is short of allowances.
The number of allowances is reduced over time so that total emissions fall. In 2020 emissions will be
21% lower than in 2005.
At the beginning of the third quarter 2012, Airlines joined the scheme, as the first part of transport
sector to be factored in the trading system.
Maritime transport is also in discussion, but it will not be included in the emissions trade before the
start of the fourth trading period in 2020.3
10.1.5 VEHICLE EMISSIONS STANDARDS
The EU is implementing increasingly stringent emissions standards for new vehicles sold in the EU with
the aim of reducing air pollution and the associated environmental and health risks.
These standards were first introduced in 1992 and are known as European Emissions Standards (Euro
standards). They target a range of pollutants, covering oxides of nitrogen (NOX), hydrocarbons (HC),
carbon monoxide (CO) and particulate matter (PM) emissions. The limits are set at different levels for
different vehicle types and compliance is determined by running a vehicle’s engine over a standard
test cycle.
While they are not directly focussed on Greenhouse Gases, the actions that vehicle manufacturers
have taken to comply with these standards over the last two decades have generally had the effect of
improving fuel efficiency and thereby reducing GHG emissions.
The latest standards applicable to Heavy Goods Vehicles, Euro VI, include requirements for engines to
have on board diagnostics to detect if the emissions prevention systems are malfunctioning. Some of
the technologies required to satisfy Euro VI may slightly reduce fuel efficiency but to the benefit of
overall levels of pollution.
3 http://ec.europa.eu/clima/policies/ets/index_en.htm
GUIDELINES FOR REPORTING FREIGHT GREENHOUSE GAS EMISSIONS DOC REF NO: LG08
VERSION NO: 1.0 DATE: SEPTEMBER 2013
P a g e | 75/ 108
© Odette International Ltd
10.1.6 CLEAN AIR ZONES
Concerned at the impact of high levels of traffic pollution on their citizens, many European cities have
been taking actions to reduce pollution levels within their areas of jurisdiction. One of the first to be
introduced was London’s Low Emission Zone. The associated legislation requires those operating
transport within a specified area of London to either comply with stated emissions standards or else
pay a daily charge.
Other cities that have introduced Low Emissions Zones include Berlin, Stockholm and Rome, while
Paris is introducing a pilot scheme. Generally, the emissions requirements are linked to Euro standards
compliance (see 10.1.5 above).
10.1.7 INFRASTRUCTURE IMPROVEMENTS
As highlighted in the 2011 White paper, the EU is actively working to improve transport infrastructure
within Europe, particularly looking to improve the move of freight from roads to rail and sea. The EU
TEN-T (Tran-European Network for Transport) initiative includes thirty priority projects planned for
completion in 2020, comprising 18 railway projects, 3 mixed rail-road projects, 2 inland waterway
transport projects and one referring to ‘Motorways of the Sea’.
The Motorways of the Sea concept aims at introducing new intermodal maritime-based logistics
chains in Europe, making it easier to integrate port to port moves within a transport network.
Increasingly, more use is being made of short sea shipping for moving finished vehicles around Europe.
10.2 SHAREHOLDER INTERESTS
Increasing attention is being focussed on the subject of sustainability: all three aspects need to be
considered - economic, environmental and social. With Corporate Sustainability initiatives, a company
can create long-term shareholder value by taking advantage of opportunities for improvement and
managing risks deriving from economic, environmental and social developments.
A growing number of investors see sustainability as a catalyst for enlightened and disciplined
management, and a crucial success factor. As a result, investors are increasingly diversifying their
portfolios by investing in companies that consider sustainability in their strategy and action.4 In this
context, there are several indices that verify a company’s attempts in terms of sustainability.
The next table shows a range of indices that are in use at the time of writing.
4 http://www.pwc.de/de_DE/de/nachhaltigkeit/assets/CDP-G500-2011-Report.pdf, S.9
5 http://www.environmentalleader.com/2012/07/11/carbon-footprinting-for-products-what-companies-should-know/
4 http://www.sustainability-indexes.com/images/djsi-world-guidebook_tcm1071-337244.pdf, S. 9

GUIDELINES FOR REPORTING FREIGHT GREENHOUSE GAS EMISSIONS DOC REF NO: LG08
VERSION NO: 1.0 DATE: SEPTEMBER 2013
P a g e | 76/ 108
© Odette International Ltd
SUSTAINABILITY REPORTING INITIATIVES
SUPPLIERS INDICES OR INDEX CLASSES
Calvert The Calvert Social Index
CDP Carbon Disclosure Leadership Index, Carbon Performance Leadership Index
CRD Analytics Global Sustainability Index, Cleantech 100, Life Sciences
Domini Domini 400 Social Index
Dow Jones Dow Jones Sustainability Index
ECPI ECPI Indices
EIRIS FTSE4Good Index Series
EthiFinance Gaia Index
Maplecroft Climate Innovation Indexes
MSCI MSCI ESG Indices
Oekom Global Challenges Index
OWW Responsibility Malaysia SRI Index, Responsibility Singapore SRI Index
SAM Dow Jones Sustainability Index
Sustainalytics Jantzi Social Index, STOXX Global ESG Leaders Indices
Vigeo ASPI Eurozone, Ethibel Sustainability Index
Table N°4: Frequently encountered sustainability reporting initiatives
Three that are commonly encountered by automotive OEMs are the Carbon Disclosure Project, the
Dow Jones Sustainability Index and the oekom Global Challenges Index. These indices investigate a
company’s levels of activity and performance in the field of sustainability.

GUIDELINES FOR REPORTING FREIGHT GREENHOUSE GAS EMISSIONS DOC REF NO: LG08
VERSION NO: 1.0 DATE: SEPTEMBER 2013
P a g e | 77/ 108
© Odette International Ltd
Carbon Disclosure Project Indices
The Carbon Disclosure Project (CDP) is an international, not-for-profit organization providing a
global system for companies and cities to measure, disclose, manage and share vital
environmental information. Various programs are run including:
CDP Investor Program to provide information on company activities and performance for the use of investor bodies
CDP Supply Chain Program to assist organisations in implementing successful supplier engagement strategies and reduce supply chain environmental impacts, including particularly GHG emissions.
Dow Jones Sustainability Index
Following a rigorous approach, this index aims to measure the performance of the world's
sustainability leaders.
Companies are selected for the indices based on a comprehensive assessment of long-term
economic, environmental and social criteria that account for general as well as industry-
specific sustainability trends.
Only firms that lead their industries based on this assessment and that continually intensify
their sustainability initiatives are included in the indices.5
The indices are created and maintained according to a systematic methodology, allowing
investors to appropriately benchmark sustainability-driven funds and providing an effective
engagement platform for companies who want to adopt sustainable best practices. This
approach will benefit all stakeholders: investors, employees, customers and, ultimately,
society and the environment.
The Dow Jones Sustainability Indexes comprise global and regional benchmarks including
European, Eurozone, Nordic, North American, US, Asia Pacific, and Korean indexes.6
oekom – Global Challenges Index
This rating is based on a comprehensive set of criteria for ethical assessment of companies. It
assesses companies' responsibility towards:
Persons affected by corporate activities (social sustainability)
Society and culture (cultural sustainability)
The natural environment (environmental sustainability)
5 http://www.djindexes.com/sustainability/
6 http://www.sustainability-indexes.com/dow-jones-sustainability-indexes/index.jsp

GUIDELINES FOR REPORTING FREIGHT GREENHOUSE GAS EMISSIONS DOC REF NO: LG08
VERSION NO: 1.0 DATE: SEPTEMBER 2013
P a g e | 78/ 108
© Odette International Ltd
In order to be able to analyse comprehensively the diverse environmental and social
challenges relating to the activities of companies, oekom research AG has developed a pool of
indicators. These currently number approximately 500. For each company, an average of 100
indicators is selected from this pool on an industry-specific basis so that a targeted evaluation
of the problems specific to that company can be carried out.7
10.3 CUSTOMER INFORMATION DEMANDS
It is to be expected that the increasing public debate on climate issues and introduction of the topics
into educational syllabuses will create increased interest from the public. The greater availability of
information leads to wider awareness of actions and effects. Therefore consumers are more aware of
their contribution to environmental pollution. As a result, they may wish to minimise their ecological
footprint and contribution to global warming made by their purchases and ask for sustainable
products.
This will all add to pressure on companies to apply significant environmental action plans, with targets
such as: reducing energy consumption, reducing GHG emissions and offering customers eco-friendly
products and services that help them control their own energy consumption.
10.4 TECHNOLOGICAL TRENDS
Companies have been increasingly working to reduce energy usage due to its high cost but now it is
being done also for environmental reasons. Companies are going beyond simply improving energy
procurement activities- companies are now investing in enterprise energy managers and increasing
awareness of energy use across locations. Organisational interest in the greenhouse gas emissions of
their operations and supply chain is increasing due to factors such as reputation, customer
expectation and efficiency goals – not just reducing consumption, but also adding a competitive
advantage.
As a result of the growing customer expectations for sustainable products, the investments in
sustainable technologies increase and companies which work together with carriers expect them to
use equipment that provides environmental improvements on emissions and fuel efficiency. The
reduction of fuel consumption has been a focus in the automotive and transport sectors especially.
There are different approaches. The UK Low Carbon Vehicle Project listed ways to improve fuel
economy8:
Euro standard engines (complying with latest standards) Automatic/ semi-automatic transmissions GPS and telemetry Fuel additives
7 http://www.oekom-research.com/index_en.php
8 Low Carbon Vehicle Partnership’s recommendations for accelerating the market for low carbon HGVs http://www.lowcvp.org.uk/

GUIDELINES FOR REPORTING FREIGHT GREENHOUSE GAS EMISSIONS DOC REF NO: LG08
VERSION NO: 1.0 DATE: SEPTEMBER 2013
P a g e | 79/ 108
© Odette International Ltd
Biofuels Stop-start technology Fleet monitoring & diagnostic equipment Active route planning software Lubricants Tyres Cleaner burning engines
The following paragraphs discuss some of the principal approaches:
10.4.1 SPEED REDUCTION, ECO-DRIVING
In the transport sector a low cost way of saving fuel is through more efficient driving techniques.
Speed limiters can be used to control the maximum speed that a truck can be driven. Slow-steaming of
ocean shipping can save significant quantities of fuel though there can be an adverse effect on transit
times.
Due to high energy wastage from excessive braking and running the engine while idle, training in
efficient driving techniques can significantly reduce fuel use. Some carriers have already implemented
an Eco-driving training programme in their operations to improve driver behaviour and fuel
consumption. Truck manufacturers often offer this type of training to their customers. On-board fleet
management systems have also evolved to help monitor driver performance.
10.4.2 EQUIPMENT IMPROVEMENTS
Two technologies being introduced widely to improve fuel consumption are aerodynamic design and
tyre improvement.
Aerodynamically designed tractor units can yield a further fuel reduction potential of 4 to 5 per cent. Deflectors fitted to tractor roofs can direct airflows smoothly over the top of the trailer unit. Improvements to trailers can include making the back edge curved (“teardrop” design) and fitting skirts along the bottom edge.
Tyre manufacturers have developed low rolling resistance tyres that can be fitted to reduce energy losses caused by the compression of the tyres as they roll along the road surface supporting the weight of the truck.
Other traditional possibilities to decrease the consumption are lightweight construction, optimised
tyres and engines.
10.4.3 SYSTEMS DEVELOPMENTS
Increasingly, high tech systems technology is being used to fuel efficiency. An example is the linking of route-planning systems with real-life location information. Speed control that uses GPS data is a new technology which provides an advantage in fuel consumption of 1 to 4 per cent. In maritime transport, voyage management can be linked to an emission reduction tool. Data can be sent to a vessel when there is a delay at the destination port. Knowing this, the speed of the vessel can be reduced to meet a revised arrival time.

GUIDELINES FOR REPORTING FREIGHT GREENHOUSE GAS EMISSIONS DOC REF NO: LG08
VERSION NO: 1.0 DATE: SEPTEMBER 2013
P a g e | 80/ 108
© Odette International Ltd
10.4.4 CLEANER POWERTRAINS
Research is underway in a variety of directions regarding improving engine technology to reduce
emissions. The widespread use of electric power is still some way off freight transport as the heavy
loads carried and long distances travelled by freight vehicles mean would require excessive battery
storage and a comprehensive charging infrastructure would need to be deployed.
In the meantime, different technologies are being developed to improve engine efficiency and reduce
total emissions. Improvements in automatic transmissions and regenerative breaking will reduce
energy wastage. Various companies are experimenting with hybrid power (use of combined electric
and diesel power supply).
Amongst fuel developments, bio fuels are now in common use, at least as a percentage of fuel make-
up in many regions. Although they may make little difference to emissions from the vehicle itself, they
can improve the total (‘well to wheel’) emissions as plant matter removes CO2 from the atmosphere
while it is growing. There are now several generations of technology: from 1st generation - traditional
of crops, 2nd generation - special crops and biomass and now 3rd generation - experimentation with
the use of algae.
Marine fuel oil creates impacts besides GHG emissions. High sulphur emissions are seen as a problem
and reduced sulphur fuels are being introduced. These are likely to increase costs so shipping
companies are experimenting with use of natural gas and wind turbines installed on the bow. One
shipping line has an objective to develop a “Super Eco Ship” by 2030. This ship will emit only 30% of
the emissions of ships today. It is planned to use fuel cells that are energised with liquefied natural gas
and solar panels will deliver additional power. Furthermore, the outside of the ship will be coated with
special “sharkskin” that reduces the frictional resistance. Using the wind energy as well, sails are also
part of the concept.
10.5 SECTOR INITIATIVES
North American EPA SmartWay
Launched in 2004, SmartWay® is a North American program run by the US Environmental
Protection Agency (EPA). Its main objective is to reduce transportation-related emissions by
creating incentives to improve supply chain fuel efficiency.
It is targeted at both carriers and shippers and comprises five main initiatives:
SmartWay Transport Partnership - in which freight carriers and shippers commit to benchmark operations, track fuel consumption and improve performance annually.
SmartWay Technology Program - a testing, verification, and designation program to help freight companies identify equipment, technologies and strategies that save fuel and lower emissions.

GUIDELINES FOR REPORTING FREIGHT GREENHOUSE GAS EMISSIONS DOC REF NO: LG08
VERSION NO: 1.0 DATE: SEPTEMBER 2013
P a g e | 81/ 108
© Odette International Ltd
SmartWay Finance Program - a competitive grant program that makes investing in fuel-saving equipment easier for freight carriers.
SmartWay Vehicles - a program that ranks light-duty cars and small trucks and identifies superior environmental performers with the SmartWay logo.
SmartWay International Interests - guidance and resources for countries seeking to develop freight sustainability programs modelled after SmartWay.
Green Freight Europe
Green Freight Europe is a European based initiative inspired by the US SmartWay program.
The program fosters reductions of carbon emissions by:
Establishing a Platform for companies to monitor and report their carbon emissions in a standard format, aiding comparability of results with those of others to assist in sustainable procurement decisions on the right transportation services to choose from
Promoting collaboration between carriers and shippers which itself drives improvements and monitors progress made
Establishing a certification system to reward shippers and carriers who fully participate in the program
Validating technologies for what they can actually provide by way of CO2
reductions, providing a virtual shop window on the different technologies and, for example, presenting opportunities for obtaining cheaper finance to encourage investments in emission-reducing technologies and practices
It is also the platform for companies to share best practices, promote innovations and
communicate sustainability improvements on European road freight.
The programme is recognised by and fosters cooperation with other related initiatives,
programmes and working groups globally, such as the US SmartWay programme and Green
Freight Asia Network.

GUIDELINES FOR REPORTING FREIGHT GREENHOUSE GAS EMISSIONS DOC REF NO: LG08
VERSION NO: 1.0 DATE: SEPTEMBER 2013
P a g e | 82/ 108
© Odette International Ltd
1
11. REFERENCE INFORMATION
This section contains further details of standards and initiatives relevant to these Guidelines including
contact web addresses.
Contents:
1. General standards for GHG measurement and reporting
ISO Standards
Global Reporting Initiative
Greenhouse Gas Protocol
2. Standards specific for freight GHG reporting
CEN Standard
French Decree
UK DEFRA Guidance
3. Datasets for use in GHG calculations
4. Other relevant freight GHG initiatives
Note: all information is provided as available in July 2013. Many of these standards and initiatives are
under continual development and so it is recommended to refer to the relevant websites to obtain the
latest status.
11.1 GENERAL STANDARDS FOR GHG MEASUREMENT AND REPORTING
11.1.1 ISO STANDARDS
The International Standards Organisation has published a range of standards to assist an organisation
wanting to report the GHG emissions of its operations:
ISO 14064- General GHG Reporting
The ISO 14064 standards are divided into three parts and relate to GHG emissions from the
organisational perspective.
Part 1 - Specification with guidance at the organisation level for quantification and reporting
of greenhouse gas emissions and removals.

GUIDELINES FOR REPORTING FREIGHT GREENHOUSE GAS EMISSIONS DOC REF NO: LG08
VERSION NO: 1.0 DATE: SEPTEMBER 2013
P a g e | 83/ 108
© Odette International Ltd
This is the standard that is most relevant for GHG reporting for an organisation’s overall
operations. It has been based on the GHG Protocol’s definitions of reporting scopes and to
which these Odette Guidelines are also aligned.
Part 2 - Specification with guidance at the project level for quantification, monitoring and
reporting of greenhouse gas emission reductions, or removal enhancements.
This is really for use when studying the GHG impact of a specific project, rather than regular
operations.
Part 3 - Specifies principles and requirements and provides guidance for those conducting or
managing the validation and/or verification of greenhouse gas (GHG) assertions.
This is about making sure that reporting is carried out with integrity and discusses how to
validate/ verify results. Again the approaches in these Odette Guidelines should ensure
compliance.
ISO 14040/14044/ 14067- Life cycle/ Carbon footprint reporting
The life cycle assessment standards, ISO 14040 and 14044 describe respectively the principles
and the methodology for performing life cycle assessments of environmental impacts.
The newer ISO 14067 focuses specifically on the carbon footprint of products and provides
guidelines for how to utilise the life cycle assessment methodology when only considering the
GHG emissions.
These Odette Guidelines support the calculation of freight emissions in a way that will enable
them to be easily included within any of the kind of life cycle analysis that these standards
cover.
The image below depicts a typical life cycle of a car. The freight elements would fall within the
raw material supply, manufacturing and distribution elements.
Figure N°14: Life cycle of a vehicle

GUIDELINES FOR REPORTING FREIGHT GREENHOUSE GAS EMISSIONS DOC REF NO: LG08
VERSION NO: 1.0 DATE: SEPTEMBER 2013
P a g e | 84/ 108
© Odette International Ltd
ISO 14033- Acquisition of environmental data
ISO 14033 provides support in acquiring and reporting environmental information in a robust
manner.
Its approach is used as the basis for the information gathering elements of these Odette
Guidelines.
11.1.2 GLOBAL REPORTING INITIATIVE
The Global Reporting Initiative (GRI) is a non-profit organisation that was established in late
1997 with the mission to develop globally applicable guidelines for sustainable development
and to support the reporting of the economic, environmental, and social performance, initially
for companies and thereafter for any governmental or non-governmental organization.
It is in widespread use and covers the reporting a range of different environmental impacts.
For reporting on Greenhouse Gas emissions, reference to the GHG Protocol is made.
[ https://www.globalreporting.org ]
11.1.3 GREENHOUSE GAS PROTOCOL
The Greenhouse Gas Protocol (GHG Protocol) is the most widely used international
accounting tool for government and business leaders to understand, quantify, and manage
greenhouse gas emissions. The GHG Protocol is published jointly by the World Resource
Institute (WRI) and the World Business Council of Sustainable Development (WBCSD).
The protocol comprises 4 standards:
Corporate Accounting & Reporting Standards
Project Accounting Protocol & Guidelines
Corporate Value Chain (Scope 3) Accounting & Reporting Standard
Product Life Cycle Accounting & Reporting Standard
These Odette Guidelines are aligned to the Greenhouse Gas Protocol Methodology
[ http://www.ghgprotocol.org/ ]

GUIDELINES FOR REPORTING FREIGHT GREENHOUSE GAS EMISSIONS DOC REF NO: LG08
VERSION NO: 1.0 DATE: SEPTEMBER 2013
P a g e | 85/ 108
© Odette International Ltd
11.2 STANDARDS SPECIFIC FOR FREIGHT GHG REPORTING
11.2.1 CEN STANDARD
The CEN Standard EN 16258:2012 - Methodology for calculation and declaration of energy
consumption and GHG emissions of transport services specifies general principles, definitions, system
boundaries, calculation methods, apportionment rules (allocation) and data recommendations, with
the objective to promote standardised, accurate, credible and verifiable declarations, regarding
energy consumption and GHG emissions related to any transport service quantified.
11.2.2 FRENCH DECREE
Article L1431-3 created by the Decree N° 2011-1336 of 24th October 2011 in the French Transport
Code (formerly Article 228-II of Act no. 2010-788 of 12 July 2010, the ‘Grenelle 2 Act’ on the national
commitment to the environment), known more simply as “the French Decree”, is the first legislation
published in Europe requiring the reporting of CO2 for transport operations.
It is mandatory as from October 2013 for all transport providers loading or unloading in France to
report to the transport service beneficiary (can be the client or the supplier) the emissions resulting
from kilometres travelled on French territory.
The French Decree has to be read as a specific national initiative which has legal implications and is
accompanied by official guidance from ADEME (Methodical Guide to the French Decree), which
includes sets of relevant emissions factors.
More details on the requirements within the French Decree are included in Sections 3.3.1 and 8.5.1.
[ http://www.developpement-durable.gouv.fr/IMG/pdf/Information_CO2_ENG_Web.pdf ]
11.2.3 UK DEFRA GUIDANCE
In its Guidance on measuring and reporting Greenhouse Gas (GHG) emissions from freight transport
operations, the UK Department of Environment, Food and Rural Affairs (DEFRA), uses the GHG
Protocol as a framework for all its reporting Guidelines.
The Department for Environment, Food and Rural Affairs (Department for Environment, Food and
Rural Affairs, or DEFRA) is an executive department of the British Government responsible for the
environment and agriculture.
Guidance on measuring and reporting Greenhouse Gas (GHG) emissions from freight transport
operations. http://archive.defra.gov.uk/environment/business/reporting/pdf/ghg-freight-guide.pdf
[ http://www.defra.gov.uk/ ]

GUIDELINES FOR REPORTING FREIGHT GREENHOUSE GAS EMISSIONS DOC REF NO: LG08
VERSION NO: 1.0 DATE: SEPTEMBER 2013
P a g e | 86/ 108
© Odette International Ltd
11.3 DATASETS FOR USE IN GHG CALCULATIONS
The following is a list of sources for emissions and energy related data. It is not comprehensive- there are many other published data sets available- however those listed below are widely recognised and in common usage.
Note that these data sets are generally subject to continual revision in terms of detail and breadth of coverage. For this reason, it is important when selecting emissions factors to note the exact source and date of retrieval for future reference.
The order of the list is alphabetical and not of significance. Help in choosing the most appropriate factors is included in Section 7.3.3.
Base Carbone® (Database published by ADEME)
http://www.basecarbone.fr/
CCWG (Clean Cargo Working Group)
http://www.bsr.org/en/our-work/working-groups/clean-cargo
COPERT http://www.emisia.com/copert/General.html
DEFRA (UK Government) - GHG Conversion Factors for Company Reporting
http://naei.defra.gov.uk/data/emission-factors
EcoTransIT http://www.ecotransit.org/index.en.html
French Decree The emissions factors intended for use with the French Decree are published in the associated Order of April 10th, 2012. Relevant data is also included in the official Methodical Guide to the French Decree written by ADEME
www.developpement-durable.gouv.fr/IMG/pdf/Information_CO2_ENG_Web.pdf
HBEFA (Handbook Emissions Factors Road Transport)
http://www.hbefa.net/e/index.html
IEA (International Energy Agency)
http://www.iea.org/statistics/
NTM (Network for Transport and Environment)
http://www.ntmcalc.org
VDA (Verband der Automobilindustrie)
http://www.vda.de/de/publikationen/publikationen_downloads/detail.php?id=1135
WPCI (World Ports Climate Initiative)
http://esi.wpci.nl/Public/Home

GUIDELINES FOR REPORTING FREIGHT GREENHOUSE GAS EMISSIONS DOC REF NO: LG08
VERSION NO: 1.0 DATE: SEPTEMBER 2013
P a g e | 87/ 108
© Odette International Ltd
11.4 OTHER RELEVANT FREIGHT GHG INITIATIVES
ADEME
ADEME (French Environment and Energy Management Agency), is a French public agency
under the joint authority of the Ministry for Ecology, Sustainable Development and Energy
and the Ministry for Higher Education and Research. Its mission is to encourage, supervise,
coordinate, facilitate and undertake operations with the aim of protecting the environment
and managing energy.
Working on behalf of the French government, ADEME have published the official guidance to
the French Decree.
http://www.developpement-durable.gouv.fr/IMG/pdf/Information_CO2_ENG_Web.pdf
[ http://www2.ademe.fr ]
Clean Cargo Working Group
The Clean Cargo Working Group (CCWG) is a global, business-to-business initiative dedicated
to improving the environmental performance improvement through measurement, evaluation
and reporting in maritime transportation management.
[ http://www.bsr.org/en/our-work/working-groups/clean-cargo ]
Clean Shipping Index
The Clean Shipping Index is a non-profit association that today consists of a network of cargo owners around the globe. The shipping companies log their ships and answer a set of questions which describe their environmental performance. The cargo owners can then compare ships and shipping companies to make sound decisions on which company to use and the environmental impact when using a specific vessel.
[ www.cleanshippingindex.com ]
COFRET
COFRET (Carbon Footprint of Road Freight) is a collaborative research and demonstration project, part-funded by the European Commission, which is working to provide industry, shippers, receivers and logistics providers with the opportunity to remove the current uncertainty over calculating the carbon footprint of freight transport. COFRET is working with existing initiatives already being developed by various stakeholders in the supply chain so that it is aligned with the needs of those responsible for shipping and transporting goods by whatever means. COFRET is using this approach to help in the standardisation of a carbon foot printing approach for supply chains and their individual elements.
[ http://www.cofret-project.eu/ ]

GUIDELINES FOR REPORTING FREIGHT GREENHOUSE GAS EMISSIONS DOC REF NO: LG08
VERSION NO: 1.0 DATE: SEPTEMBER 2013
P a g e | 88/ 108
© Odette International Ltd
DSLV& CLECAT
DSLV (Deutsche Speditions- und Logistikverband e.V.) is the German freight forwarding and
logistics association (DSLV) formed in 2003 from the combination of the Federal Association of
Forwarding and Logistics and the Association of German Car Carriers. Based on research work
contracted by the German Government, DSLV has produced a guide to application of the CEN
16258 standard.
CLECAT (the European Association for Forwarding, Transport, Logistics and Customs Services)
has published an English language version titled “Calculating GHG emissions for freight
forwarding and logistics services in accordance with EN 16258 – Terms, Methods, Examples”.
EcoTransIT
EcoTransIT is a project to quantify the emissions of freight transport and to make results
available through a free on-line tool, EcoTransIT World.
It was developed by the Institute for Energy and Environmental Research (ifeu), the Öko-
Institut and the Rail Management Consultants GmbH (RMCon). Work began with the support
of five European railway companies and new partners have subsequently joined. All project
partners provide information for the database and constantly update the tool according to
national policies and state-of-the-art information.
It provides a valuable source on European rail freight emissions, taking into account different
operational aspects of different routings, including source of locomotive power. The tool has
been extended to cover other modes (such a road and sea) and beyond the confines of
Europe. Its objective is to be fully comprehensive in its coverage on a world scale.
The result of each calculation is presented in the form of diagrams. They compare the energy
consumptions and emissions of different environmental pollutants and differentiate between
selected modes of transports. Thus, the user can easily select the routes and transportation
mode with the lowest environmental impact.
[ http://www.ecotransit.org/index.en.html ]
ECG
Established in 1997, ECG is the Association of European Vehicle Logistics and represents around 100 leading vehicle logistics companies from 25 countries across Europe, including the Russian Federation, Ukraine and Turkey.
[ http://www.ecgassociation.eu/ ]
The ECG Carbon Calculator is a programme that allows logistics service providers to automate the calculation of CO2 produced specifically by the transportation of vehicles in Europe by sea, road and rail transport modes.
http://www.eurocartrans.org/Activities/ECGWorkingGroups/CarbonCalculatorEnvironmental/Whatisit.aspx

GUIDELINES FOR REPORTING FREIGHT GREENHOUSE GAS EMISSIONS DOC REF NO: LG08
VERSION NO: 1.0 DATE: SEPTEMBER 2013
P a g e | 89/ 108
© Odette International Ltd
Green Freight Europe
The programme, which was originally developed under the working title SmartWay Europe,
was officially launched on 27 March 2012 under the name Green Freight Europe. It aims to be
recognized as the leading independent voluntary program for improving environmental
performance of road freight transport across Europe.
[ http://www.greenfreighteurope.eu/ ]
The objectives of Green Freight Europe are discussed in Section 10.5
NTM
The Network for Transport and Environment, NTM
The Network for Transport and Environment, NTM is a non-profit Swedish organisation aiming
at establishing a common base of values on how to assess and improve the environmental
performance of transport services.
NTM provides a web-based calculator known as NTMCalc.
[ http://www.ntmcalc.org ]

GUIDELINES FOR REPORTING FREIGHT GREENHOUSE GAS EMISSIONS DOC REF NO: LG08
VERSION NO: 1.0 DATE: SEPTEMBER 2013
P a g e | 90/ 108
© Odette International Ltd
APPENDIX 1: REPORTING LOGISTICS EMISSIONS WITHIN THE FRAMEWORK
OF THE GHG PROTOCOL
The GHG Protocol provides a framework for reporting all different elements of emissions produced as
a result of a company’s activities and operations.
The approach is based on considering three principal categories of emissions, described as scopes, as
depicted in the chart below:
Definition of the scopes and examples
Scope Definition Example of emissions sources
SCOPE 1
Direct Emissions
Are released directly by activities you
own or control
Fuel Oil; Chemical Production; Materials
processing; Paint shop; foundry;
Owned transport
SCOPE 2
Energy Indirect Emissions
Are typically from the generation of
purchased electricity you use. The
emissions physically occur off-site where
the electricity is generated
Power station; Purchased electricity
(defined as electricity that is purchased or
otherwise brought into the organizational
boundary of the company)
SCOPE 3
Other Indirect Emissions
Are a consequence of the activities of the
company, but occur from sources not
directly owned or controlled by the
company
Extraction and production of purchased
materials; Contracted Transport; Use of
sold products and services; Waste disposal
Table N°5: Examples of the three emission scopes
For most component suppliers and automotive manufacturers that sub-contract their freight, it can be
seen that the majority of freight emissions lie within Scope 3.
In 2011, the Greenhouse Gas Protocol published a better definition of how to report the different
types of emissions with Scope 3, subdividing the scope into 15 categories as you can see in Table N°6
below.
These are intended to cover the whole spectrum of a company’s activities and the relevant
significance of each category will depend on the nature of the business that the company conducts. An
accountancy firm would need to consider office emissions and employee commuting and business
travel. Within the Automotive Industry, the biggest source of emissions is the parc of vehicles on the
road. This may amount to 80% or more of the overall total.
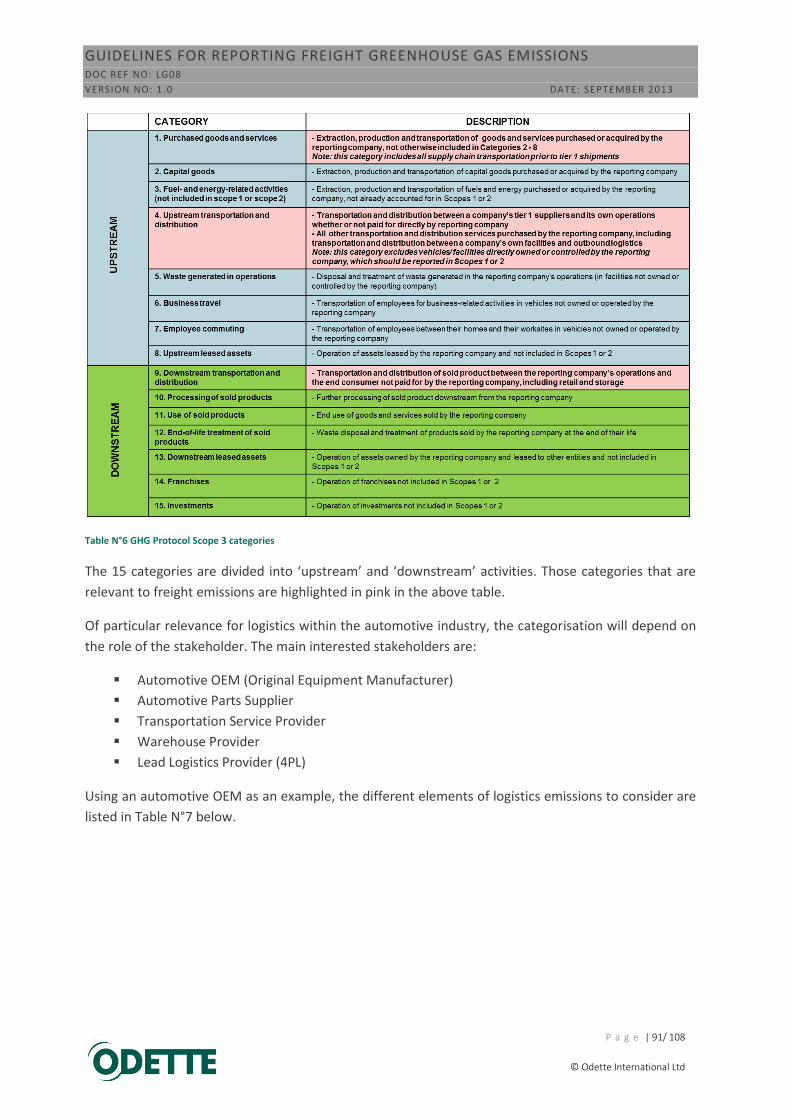
GUIDELINES FOR REPORTING FREIGHT GREENHOUSE GAS EMISSIONS DOC REF NO: LG08
VERSION NO: 1.0 DATE: SEPTEMBER 2013
P a g e | 91/ 108
© Odette International Ltd
Table N°6 GHG Protocol Scope 3 categories
The 15 categories are divided into ‘upstream’ and ‘downstream’ activities. Those categories that are
relevant to freight emissions are highlighted in pink in the above table.
Of particular relevance for logistics within the automotive industry, the categorisation will depend on
the role of the stakeholder. The main interested stakeholders are:
Automotive OEM (Original Equipment Manufacturer)
Automotive Parts Supplier
Transportation Service Provider
Warehouse Provider
Lead Logistics Provider (4PL)
Using an automotive OEM as an example, the different elements of logistics emissions to consider are
listed in Table N°7 below.

GUIDELINES FOR REPORTING FREIGHT GREENHOUSE GAS EMISSIONS DOC REF NO: LG08
VERSION NO: 1.0 DATE: SEPTEMBER 2013
P a g e | 92/ 108
© Odette International Ltd
Table N°7: Examples of different sources of logistics related emissions
Item Direct responsibility Scope & Reporting Category
Any freight using own or
leased transport fleet OEM
Operational emissions: Scope 1
Manufacture of transport equipment:
Scope 3 cat 2
Inbound freight, inter-
plant & outbound freight
using contracted
transport operations
Contracted by OEM but
operated by other Operational emissions: Scope 3 cat 4
Warehousing (owned) OEM Operational emissions: Scopes 1,2
Warehousing (sub-
contracted)
Contracted by OEM but
operated by other Operational emissions: Scope 3 cat 4
Logistics Provider’s office-
based work LLP
Office emissions, employee travel
etc.: Scope 3 cat 1
Parts packaging (owned) OEM Manufacture of packaging:
Scope 3 cat 2
Parts packaging (leased) Contracted by OEM but
owned by packaging supplier
Manufacture of packaging:
Scope 3 cat 1

GUIDELINES FOR REPORTING FREIGHT GREENHOUSE GAS EMISSIONS DOC REF NO: LG08
VERSION NO: 1.0 DATE: SEPTEMBER 2013
P a g e | 93/ 108
© Odette International Ltd
APPENDIX 2: FURTHER EXAMPLES OF CALCULATIONS IN LINE WITH THE
FRENCH DECREE
1 RAILWAY TRANSPORT
LEVEL 1- DEFAULT VALUES
Table N°8: Default values for railway transportation
Source: The French guidance published to help Decree implementation
If all data about the weight and the volume of the freight is available then it is possible to calculate the
freight’s density, which would allow the Transport Operator to locate himself in the table provided by
the French government.
Then, according to the energy used by the railway wagon, and given the distance between the two
points of departure and arrival, the Transport Operator can deduce the energy consumption that will
be converted to GHG emissions with the emission factors provided by CEN.
Here is an example of an electric train in France carrying 250 tonnes of freight, whose volume
amounts to 700 m3, for 350 km.
Since the train runs on a French electricity supply, those emission factors values should be applied.

GUIDELINES FOR REPORTING FREIGHT GREENHOUSE GAS EMISSIONS DOC REF NO: LG08
VERSION NO: 1.0 DATE: SEPTEMBER 2013
P a g e | 94/ 108
© Odette International Ltd
Source: The French guidance published to help Decree implementation
Table N°9: Energy source emission factors
The freight density is then 357 kg/m3 hence the train consumes 16.74 kWh/km and its average loading
is 530 tonnes.
Because it is electricity, GHG Tank to Wheel emissions are zero. However, there are emissions from
the generation of electricity (these are shown in the chart above under upstream phase). Hence, we
can calculate Well To Wheel emissions.
CO2 emissions WTW = 250(t) × 350(km) × 16.74(kWh/km) × 0.053(g CO2/kWh) / 530(t)
= 149 kg CO2
LEVEL 3 -TRANSPORT OPERATOR’S AVERAGE VALUES
From a representative sample of operational data, the transport operator can achieve average energy consumption by type of activity. The calculation of CO2 emissions is then carried out on the distance travelled and the amount of goods corresponding to the given service.
For instance, let us suppose a train travelling back and forth on the same itinerary in France is driven 550 km by an electric locomotive and 120 km by a diesel locomotive. The average value is established with the train carrying 1200 tonnes of freight the whole distance and returning to the initial point completely empty. The empty train weight 570 tons.
Hence, the average energy consumption was established over 4 segments.
Segment 1: Electric traction, wagons loaded: 1770 tonnes on 550 km: 11318 KWh;
Segment 2: Electric traction, wagons empty: 570 tonnes on 550 km: 7358 KWh;
Segment 3: Diesel traction, wagons loaded: 1770 tonnes on 120 km: 672 litre;
Segment 4: Diesel traction, wagons empty: 570 tonnes on 120 km: 437 litre.
CO2 emissions were then calculated, diesel emission factors and electric emissions factors being extracted from the French Decree.
CO2 emissions WTW = ((672 + 437) × 3.63) + ((11318 + 7358) × 0.053) = 5015 kg CO2
CO2 emissions TTW = ((672 + 437) × 2.95) + ((11318 + 7358) × 0) = 3272 kg CO2

GUIDELINES FOR REPORTING FREIGHT GREENHOUSE GAS EMISSIONS DOC REF NO: LG08
VERSION NO: 1.0 DATE: SEPTEMBER 2013
P a g e | 95/ 108
© Odette International Ltd
If the same train is loaded with 800 tonnes of goods, the emissions resulting from the whole transport
operation, with empty running on the return is:
CO2 emissions WTW = (800 / 1200) × 5015 = 3343 kg CO2
CO2 emissions TTW = (800 / 1200) × 3272 = 2181 kg CO2
2 AIR TRANSPORT
LEVEL 1-DEFAULT VALUES
The Level 1 value is the distance linking the two airports of departure and destination (extracted from
various references such as www.world-airport-codes.com) and the Maximum Take-off Mass (MTM) of
the aircraft (extracted from aircraft manuals).
A Boeing 767F aircraft is loaded with 2.5 tonnes of freight between Paris-CDG and Tangiers (Morocco).
The distance between the two airports is 1600 km and the aircraft has a maximum take-off mass
(MTM) of 150 tonnes.
The table below, given by the French government, suggests a consumption of 57.5 litre of Kerosene by
100 km per tonne.
Consumption in litres of fuel per
100km/tonne
MTM < 100
tonnes
MTM from 100 to 250
tonnes
MTM > 250
tonnes
0 to 1000 km 105,7 71,9 *
1000 to 4000 km 89,9 57,5 *
4000 to 7000 km * * 22,4
Over 7000 km * * 22,3
Source: The French guidance published to help Decree implementation
Table N°10: Fuel consumption for different sized aircraft over different distances
CEN suggests 3.10 kg of GHG per litre of Kerosene in WTW emissions and 2.54 kg of GHG per litre of
Kerosene in TTW emissions.
Hence, we can deduce the GHG emissions of the B767F for the 2.5 tonnes carried over the whole
distance.
GHG emissions WTW = 2018(km) × 2.5(tonne) × 0.575(L×km/tonne) × 3.10(kg/L) =8992 kg
GHG emissions TTW = 2018(km) × 2.5(tonne) × 0.575(L×km/tonne) × 2.54(kg/L) =7368 kg

GUIDELINES FOR REPORTING FREIGHT GREENHOUSE GAS EMISSIONS DOC REF NO: LG08
VERSION NO: 1.0 DATE: SEPTEMBER 2013
P a g e | 96/ 108
© Odette International Ltd
LEVEL 3 TRANSPORT OPERATOR’S AVERAGE VALUES
An air transport company wishes to prepare an inventory of its whole operation’s GHG emissions at
level 3 accuracy. It divided those operations based on: airport of departure and of destination and
made calculations for each segment as shown in the following example:
On the leg from Paris CDG to Zaragoza ZAZ (Spain), 45 journeys were made carrying 810 tonnes of
freight (passengers were converted to tonnes of freight on the basis of each passenger weighing
100kg) and the aircraft consuming 727,200 litres of kerosene. Hence, it was deduced that each plane
consumed 16,160 litres of kerosene per flight and carried 18 tonnes of freight.
These values can be then used to calculate emissions of each operation the company made between
Paris CDG and Saragossa ZAZ.
For instance, 3 tonnes of freight were carried on that precise flight. Hence;
GHG emissions WTW = 16160 (L) × 3 (tonne) / 18 (tonne) × 3.10 (kg/L) = 8349 kg
GHG emissions TTW = 16160 (L) × 3 (tonne) / 18 (tonne) × 2.54 (kg/L) = 6841 kg

GUIDELINES FOR REPORTING FREIGHT GREENHOUSE GAS EMISSIONS DOC REF NO: LG08
VERSION NO: 1.0 DATE: SEPTEMBER 2013
P a g e | 97/ 108
© Odette International Ltd
APPENDIX 3: EXAMPLES OF GHG REPORTING FORMATS
The following examples show ways that emissions reports might be developed. The terms ‘Level 1
Compliant’ and ‘Level 2 Compliant’ refer to the accuracy levels of emissions data calculated, based on
the CEN standard definitions- see Section 7.1.
GENERIC INFORMATION REQUIRED TO SUPPORT REPORTS:
It is useful to include any information that helps understand the basis of the report:
a) How much of a business’s whole operation is covered by the report?
Definition: vehicles or tonnage carried compared with the total activity for the customer
Percentage covered: (e.g. 80 %)
Units used: (e.g. numbers of cars carried)
b) Which emissions factors are to be used if default values are needed?
Definition: what source has been selected for any default emissions values used (for Level 1
calculations)? (e.g. French Decree)
1) EXAMPLE OF REPORTING METHODOLOGY 1 (LEVEL 1 COMPLIANT)
This example is for finished vehicle transportation (e.g. from an automotive OEM to their
dealerships)
Calculation is based on OEM specific legs, both loaded and unloaded / and specific load factor
(how many vehicles per load).
Note: all information relates/ is specific to the OEM under analysis
Inputs:
A= Input ‘Average load factor’ specific to the OEM under analysis. This could be sourced by sampling
B= Input total units delivered for the OEM contract under analysis, including units delivered by
Subcontractors

GUIDELINES FOR REPORTING FREIGHT GREENHOUSE GAS EMISSIONS DOC REF NO: LG08
VERSION NO: 1.0 DATE: SEPTEMBER 2013
P a g e | 98/ 108
© Odette International Ltd
C= Input the ‘Average loaded outbound leg km’s per trip’, specifically related to the OEM contract
under analysis. This could be sourced through sampling techniques (i.e. calculate from a 10% sample
of loads delivered for the OEM)
D= Input the ‘Average unloaded or repositioning leg km’s per trip’, specifically related to the OEM
contract under analysis. This could be sourced through sampling techniques (ie calculate from a 10%
sample of loads delivered for the OEM)
E= Input the Transport Operators ‘Average Fuel Consumption’ (ie MPG or Litres per km) for entire fleet
Define what fuel consumption data you factored in for Subcontractors? (e.g. : is it assumed
the fuel consumption for Subcontractors, is the same as that for the Transport Operators
Fleet?)
Definitions: Level 1: Default value. Level 2: Transport Operator Fleet Values. Level 3:
Transport Operator Specific Values. Level 4: Specific measured value.
What are the accuracy levels for your owned fleet?
Level 1: (e.g.: 100 %) Level 2: (e.g.: 0%) Level 3: (e.g.: 0%) Level 4: (e.g.: 0%)
What are the accuracy levels for your sub-contracted fleet?
e.g.: Level 1: (100%) Level 2: (0%) Level 3: (0%) Level 4: (0%)
F = GHG factor: GHG value per unit of fuel consumed
(1) What are the sources of the emission factor? (e.g.: CEN Norm EN16258:2012) (2) What lifecycle operational phases are covered? (e.g. : Well to Wheel) (3) What is the unit used as GHG emission factor? (e.g. : CO2 equivalent)
Calculation:
G & H & I = Using above statistics, calculate number of trips, total average KM’s per trip, and total
KM’s for the OEM under analysis
J= Using the Transport Operators, ‘Average Fuel Consumption’, calculate litres of fuel that relate to the
OEM under analysis.
Outputs:
K & L = Using fuel consumed value, calculate total GHG, and GHG per unit delivered
2) EXAMPLE OF REPORTING METHODOLOGY 2 (LEVEL 2 COMPLIANT)
This example is also for finished vehicle transportation (e.g. from an automotive OEM to their
dealerships)

GUIDELINES FOR REPORTING FREIGHT GREENHOUSE GAS EMISSIONS DOC REF NO: LG08
VERSION NO: 1.0 DATE: SEPTEMBER 2013
P a g e | 99/ 108
© Odette International Ltd
Calculation based on average fuel consumption for the entire Operators fleet and not specific to the
OEM under analysis
Inputs:
A= Total kilometres (km) for the Transport Operators Fleet, plus any km’s covered by Subcontractors
Input ‘Actual’ overall km’s covered by the Transport Operators fleet, plus any KM’s relating to
subcontracted deliveries
B= Overall Average Fuel Consumption (litres per km) for the Transport Operators Fleet
Input the Transport Operators ‘Average Fuel Consumption’ (i.e. mpg or Litres per km)
Define what fuel consumption data you factored in for Subcontractors? (e.g.: is it assumed the
fuel consumption for Subcontractors, is the same as that for the Transport Operators Fleet?)
Definitions: Level 1: Default value. Level 2: Transport Operator Fleet Values. Level 3: Transport
Operator Specific Values. Level 4: Specific measured value.
What are the accuracy levels for your owned fleet?
Level 1: (e.g.: 100 %) Level 2: (e.g.: 0%) Level 3: (e.g.: 0%) Level 4: (e.g.: 0%)
What are the accuracy levels for your sub-contracted fleet?
e.g.: Level 1: (100%) Level 2: (0%) Level 3: (0%) Level 4: (0%)
C= GHG factor: GHG value per unit of fuel consumed
(1) What are the sources of the emission factor? (e.g.: CEN Norm EN16258:2012) (2) What lifecycle operational phases are covered? (e.g.: Well to Wheel) (3) What is the unit used as GHG emission factor? (e.g.: CO2 equivalent)
F G H I J
(A x B) (E / D) (F x G) (C x H) (I / E)
Month
Total
Operator
Kilometres
(inc
Subcontract)
Fuel
Consumptio
n: Litres /
Kilometre
(1)
CO2
Generated:
Kgs / Litre
(2) (3) (4)
Total Units
delivered
(inc
Subcontract)
(5)
Unit
(Vehicle /
tonne / m3)
Total Units
relating to
OEM A
Total Litres
Consumed
(8)
OEM A units
as a % of
total units
Litres
Consumed
(OEM A)
OEM A Contract
CO2 (Kg) (6)
OEM A CO2 per
Unit carried
(kg)
Jan-13 3 500 000 0,4 3,24 80 000 vehicles 4 000 1 400 000 5% 70 000 226 800 56,70
Feb-13 3 200 000 0,41 3,24 90 000 vehicles 4 500 1 312 000 5% 65 600 212 544 47,23
Mar-13 4 000 000 0,4 3,24 110 000 vehicles 5 500 1 600 000 5% 80 000 259 200 47,13
Total 10 700 000 280 000 vehicles 14 000 4 312 000 5% 215 600 698 544 50,35
698 544 Kg
50,35 Kg / Unit
Total CO2 for OEM A, January 2013 - March 2013
Average CO2 per unit for OEM A, January 2013 - March 2013
Input Calculation Output (7)
A B C D E

GUIDELINES FOR REPORTING FREIGHT GREENHOUSE GAS EMISSIONS DOC REF NO: LG08
VERSION NO: 1.0 DATE: SEPTEMBER 2013
P a g e | 100/ 108
© Odette International Ltd
D= Total units delivered, all contracts, entire business, including those delivered by Subcontractors
Please define the unit? (e.g.: Vehicles)
E= Total units delivered, for the OEM Contract that is being analysed for GHG, including those
delivered by Subcontractors
Calculation:
F= Calculate total fuel consumed in litres, relating to entire Transport Operators fleet, including
Subcontractors.
G= Identify % of business that is related to the OEM under analysis
H= Apply the OEM volume % to the total fuel consumed
Outputs:
I & J= Calculate for OEM under analysis, total GHG, and GHG per unit delivered

GUIDELINES FOR REPORTING FREIGHT GREENHOUSE GAS EMISSIONS DOC REF NO: LG08
VERSION NO: 1.0 DATE: SEPTEMBER 2013
P a g e | 101/ 108
© Odette International Ltd
APPENDIX 4: GLOSSARY OF TERMS
This Glossary contains both general transport management terms and terms more directly related to
Greenhouse Gas reporting that are relevant to these Guidelines.
Terminology used in Logistics can also be found in the Odette Glossary (for Odette Members) at:
http://www.odette.org/publications/file/glossary-of-terms
Term Definition and Main Section References
Accuracy level
Classification of different data sources for emissions based on the
quality of data available, ranging from estimated values to real data
(See Section 7.1)
ADEME
Agence de l'environnement et de la maîtrise de l'énergie. French
public agency addressing issues relating to energy usage and the
environment. (See Section 11.4)
Average data In this context, emissions data taken from generic data sources in the
absence of actual emissions /fuel usage data.
Buyer (of goods) The one who buys the goods.
Calculated data In this context, emissions data derived from other data, e.g. average
data from internal or external data bases
Carrier Party undertaking transport of goods from one location to another.
CEN / EN 16258:2012
Methodology for calculation and declaration of energy consumption
and GHG emissions of transport services (freight and passengers) /
(See Section 4.3)
CCWG Clean Cargo Working Group (See Section 11.4)
CSI Clean Shipping Index (See Section 11.4)
CO2 equivalent
A way of quantifying the emissions of other greenhouse gases in
terms of the amount of CO2 that would exhibit the same global
warming potential. (See Section 5.6)
COFRET Carbon Footprint of Freight Transport initiative. (See Section 11.4)
Collection leg The stage of transport during which the consignment of goods are
moved prior the line haul transport stage. Synonym: Pre Carriage.
Collection of goods The process of collecting goods ready for transport
Consignee The party receiving goods as stipulated in the transport instruction.
The physical receipt is not necessarily done by the consignee.
Consignment
A separately identifiable collection of packages/pieces (available to
be) transported from one consignor to one consignee via one or
more modes of transport. A consignment can consist of one or
several shipments during parts of the whole transport assignment.
Consignment ID Unique reference to a consignment.
Consignment note See waybill.

GUIDELINES FOR REPORTING FREIGHT GREENHOUSE GAS EMISSIONS DOC REF NO: LG08
VERSION NO: 1.0 DATE: SEPTEMBER 2013
P a g e | 102/ 108
© Odette International Ltd
Term Definition and Main Section References
Consignor
The party sending goods as stipulated in the transport instruction.
The physical despatch is not necessarily done by the consignor.
Synonym: Shipper
Consolidation
The grouping together of individual shipments or consignments of
goods into a combined consignment for carriage. Related to Break
Bulk
CSR Corporate Social Responsibility - the responsibility of enterprises for
their impacts on society
DEFRA The UK government Department for Environment, Food and Rural
Affairs (See Section 11.4)
Delivery The physical process of handing over goods to the consignee or to
the party acting on his behalf. Synonym: drop off.
Despatch advice The document by means of which the seller or consignor informs the
consignee or buyer about the despatch of goods.
Direct transport
The conveyance of goods directly from the consignor to the
consignee without intermediate storage or unnecessary delay in the
distribution activities.
Distribution leg The stage of transport during which the consignment of goods are
moved following the line haul transport stage. Synonym: On Carriage.
Drop off See Delivery.
Drop off location See Place of Delivery.
Eco-driving Driving in a manner that will minimise fuel usage & emissions (See
Section 10.4.1)
EDU Equivalent Delivery Unit
Emission Factor…
Measure of the average amount of a specific pollutant or material
discharged into the atmosphere by a specific process, fuel,
equipment, or source
Environmental impact
The consequence of an environmental change that is caused by an
'Environmental load', such as emission of combustion products from
a diesel engine, particles or Nitrous oxides (NOX). An environmental
impact may be positive or negative.
Environmental impact
assessment
Environmental impact assessment means to assess the
environmental consequences from a specific human activity, such as
a transport service, the life span of a vehicle, a transportation route
etc. The Environmental impact assessment identifies the potential
environmental changes, and the causes and the consequences of
these changes. The environmental impact assessment may result in a
quantitative analysis or summary statement. See also EPS.
Environmental load
Emissions or other identified causes of environmental disturbances,
such as carbon dioxide, sulphur dioxide, particles, noise and
vibrations, land use, etc.

GUIDELINES FOR REPORTING FREIGHT GREENHOUSE GAS EMISSIONS DOC REF NO: LG08
VERSION NO: 1.0 DATE: SEPTEMBER 2013
P a g e | 103/ 108
© Odette International Ltd
Term Definition and Main Section References
Environmental
performance
Quantitative statement of the environmental status in one or several
well-defined dimensions, such as amount of greenhouse gas
emissions, or a combined measure of different environmental loads
and impacts.
Environmental priorities
It is not practically possible for a business to address all
environmental matters with the full attention at all times. The
different matters need to be prioritised, depending on significance
and available resources. It may be encouraged that prioritisations
should be made consciously and transparently.
Environmental
weighting method
There is no single way of evaluating impact of environmental
changes. Depending on how important the different changes are
considered to be they may be assigned different quantitative
weights. This is particularly useful when also having calculated the
environmental changes using quantitative values.
EPA SmartWay
SmartWay is a public/private collaboration between the US EPA and
the freight transportation industry that helps freight shippers,
carriers, and logistics companies improve fuel-efficiency and save
money.
Euro Emissions
Standard
European emission standards define the acceptable limits for exhaust
emissions of new vehicles sold in EU member states. The emission
standards are defined in a series of European Union directives (Euro
4, Euro 5, ….) staging the progressive introduction of increasingly
stringent standards. See Section 10.1.5
Final consignee The party that holds the final destination of the shipping process.
Fleet Management
System
A system for collecting data on vehicle operations (route, fuel
consumption, shipments, goods,….) and links this to office systems
(ERP, accounting, …)
Fourth party logistics
services provider (4PL)
An integrator that assembles the resources, capabilities, and
technology of its own organisation and other organisations to design,
build, and run comprehensive supply chain solutions. Synonym: Lead
logistics provider and Control Tower.
Freight forwarder
The party arranging the carriage of goods including connected
services and/or associated formalities on behalf of a consignor or
consignee.
Freight invoice
A document issued by a transport service provider, specifying freight
costs and charges incurred for a transport operation and stating
conditions of payment. Synonym: Freight bill.

GUIDELINES FOR REPORTING FREIGHT GREENHOUSE GAS EMISSIONS DOC REF NO: LG08
VERSION NO: 1.0 DATE: SEPTEMBER 2013
P a g e | 104/ 108
© Odette International Ltd
Term Definition and Main Section References
Freight payer Party responsible for the payment of freight charges.
French Decree French legislation covering reporting requirements for transport
starting or ending in France (See sections 3.3.1 & 8.4.1)
GHG Protocol
Widely used international greenhouse gas reporting tool published
by World Resources Institute together with the World Business
Council for Sustainable Development. (See section 5.3)
Global Warming
Potential (gwp)
The Global Warming Potential is an attempt to provide a simple
measure of the relative radiative effects of the emissions of various
greenhouse gases.
The index is defined as the cumulative radiative forcing between the
present and some chosen time horizon caused by a unit mass of gas
emitted now, expressed relative to that for a reference gas (usually
CO2). (See Section 2.3)
Greenhouse Gas
A gas that contributes to the greenhouse effect by absorbing infrared
radiation. Carbon Dioxide and Methane are examples of greenhouse
gases. (See Section 2.2)
HGV
Heavy Goods Vehicle (typically the kind of road transport used for
transporting car parts, materials or finished vehicles). Normally refers
to vehicle/ trailer combinations more than 3.5 tonnes.
Information of
collection (IOC)
The process of receiving a consignment usually against the issue of a
status report. As and from this moment the party accepting the
consignment becomes responsible for the consignment.
Information of delivery
(IOD)
The process of receiving a consignment usually against the issue of a
status report. As and from this moment the party accepting the
consignment becomes responsible for the consignment.
Intermodal transport
Movement of goods in which the same loading unit is used in a
transport chain in an integrated manner using more than one mode
of transport without the goods being unloaded in between.
ISO 4000 Series
Standards
Family of standards relating to environmental management- see
Section 4.1 & 4.2
ITS (Intelligent
Transport System)
The term Intelligent Transport Systems (ITS) refers to information
and communication technology (applied to transport infrastructure
and vehicles) that improve transport outcomes such as transport
safety, transport productivity, travel reliability, informed travel
choices, social equity, environmental performance and network
operation resilience.
Lead Logistics Provider
An organisation that manages the planning and execution of freight
on behalf of another. Synonyms: Control Tower, Third or Fourth Party
Logistics Services Provider (3PL and 4PL)

GUIDELINES FOR REPORTING FREIGHT GREENHOUSE GAS EMISSIONS DOC REF NO: LG08
VERSION NO: 1.0 DATE: SEPTEMBER 2013
P a g e | 105/ 108
© Odette International Ltd
Term Definition and Main Section References
License Plate
A license plate is assigned to a transport unit by its issuer. The license
plate is used for globally unique identification of transport units but
could also be used in other applications. Any license plate issuer shall
be authorised by an issuing agency in accordance with the rules set
up by that agency and ISO 15459-1.
Line haul The intermediate/line hauls stage of transport in the movement of a
consignment of goods. Synonym: Main Carriage.
Load factor
A term describing the transport efficiency of a system, such as a
vehicle, a route, a logistic strategy or any other system that performs
transportation work. Possible interpretations are for example that a
load factor of 100% is a theoretical term that means that no further
goods can be added to the transport system, or that 100% means
that all vehicles within the transport system are fully loaded. Many
other interpretations may also be considered, hence suggesting that
the term needs to be defined or replaced by a more precise term to
describe transport efficiency.
Loading metres The length of that part of a vehicle for which the complete width and
height over that length can be used for goods.
Location ID/ Location
code
Unique identifier for a specific physical location of any type. There
are several identification schemes like UN location codes, GS1
location numbers or similar coding based on ISO Data Identifiers.
Logistic unit
In this context Logistic Unit is equivalent to any or all of Package, Piece and Transport Handling Unit. It describes a unit that carries/contains the goods. Can be a parcel, packaging material, pallet, box, bag, container or a trailer unit. Represents lowest packaging unit handled by the transport service provider.
Logistics label See Transport label. The wording of “Transport label” and “Logistics label” are not always used in a similar way, some strictly differentiate between the two while others see them as synonyms.
Manifest (in transport)
Listing of goods comprising the cargo carried in a means of transport
or in a transport-unit. The manifest gives the commercial particulars
of the goods.
Multimodal transport See Intermodal Transport.
NTM
(Network for Transport and Environment) A Swedish non-profit
sector based network addressing environmental management of
transport (See Section 11.4).
OEM Original Equipment Manufacturer. In the context of these Guidelines,
an automotive manufacturer .
Operating Phase Term relating to emissions produced during use of fuel (= ‘Tank to
Wheel’ emissions). See Section 5.6
Original consignor The party that initiates the shipping process.
Synonym: Original shipper .
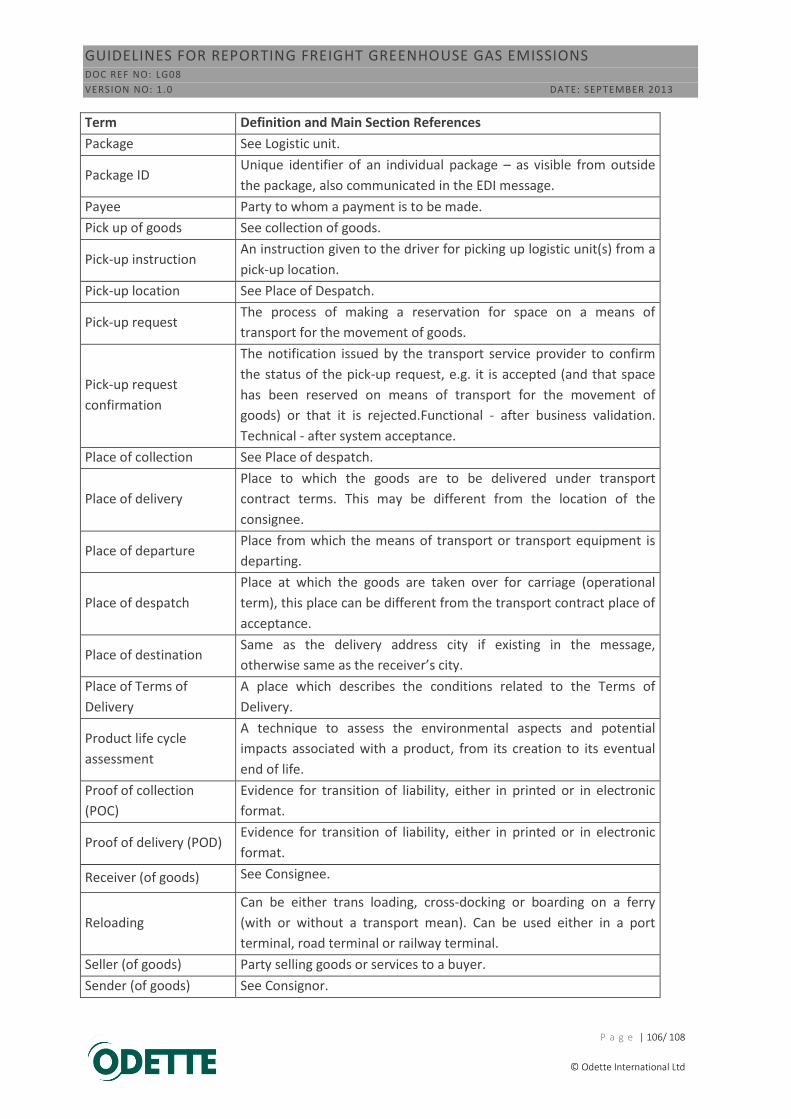
GUIDELINES FOR REPORTING FREIGHT GREENHOUSE GAS EMISSIONS DOC REF NO: LG08
VERSION NO: 1.0 DATE: SEPTEMBER 2013
P a g e | 106/ 108
© Odette International Ltd
Term Definition and Main Section References
Package See Logistic unit.
Package ID Unique identifier of an individual package – as visible from outside
the package, also communicated in the EDI message.
Payee Party to whom a payment is to be made.
Pick up of goods See collection of goods.
Pick-up instruction An instruction given to the driver for picking up logistic unit(s) from a
pick-up location.
Pick-up location See Place of Despatch.
Pick-up request The process of making a reservation for space on a means of
transport for the movement of goods.
Pick-up request
confirmation
The notification issued by the transport service provider to confirm
the status of the pick-up request, e.g. it is accepted (and that space
has been reserved on means of transport for the movement of
goods) or that it is rejected.Functional - after business validation.
Technical - after system acceptance.
Place of collection See Place of despatch.
Place of delivery
Place to which the goods are to be delivered under transport
contract terms. This may be different from the location of the
consignee.
Place of departure Place from which the means of transport or transport equipment is
departing.
Place of despatch
Place at which the goods are taken over for carriage (operational
term), this place can be different from the transport contract place of
acceptance.
Place of destination Same as the delivery address city if existing in the message,
otherwise same as the receiver’s city.
Place of Terms of
Delivery
A place which describes the conditions related to the Terms of
Delivery.
Product life cycle
assessment
A technique to assess the environmental aspects and potential
impacts associated with a product, from its creation to its eventual
end of life.
Proof of collection
(POC)
Evidence for transition of liability, either in printed or in electronic
format.
Proof of delivery (POD) Evidence for transition of liability, either in printed or in electronic
format.
Receiver (of goods) See Consignee.
Reloading
Can be either trans loading, cross-docking or boarding on a ferry
(with or without a transport mean). Can be used either in a port
terminal, road terminal or railway terminal.
Seller (of goods) Party selling goods or services to a buyer.
Sender (of goods) See Consignor.

GUIDELINES FOR REPORTING FREIGHT GREENHOUSE GAS EMISSIONS DOC REF NO: LG08
VERSION NO: 1.0 DATE: SEPTEMBER 2013
P a g e | 107/ 108
© Odette International Ltd
Term Definition and Main Section References
Ship from See Consignor.
Ship to See Consignee.
Shipment
A separately identifiable collection of packages/pieces (available to
be) transported from one original consignor to one final consignee
via one or more modes of transport. A shipment can be consolidated
to one consignment per transport leg, i.e. possibly several different
consignments during the whole transport assignment.
Shipment ID A Shipment Issuer's unique reference that is non-repeatable within a
calendar year and is assigned to a despatch.
Shipper See Consignor.
Shipping instruction Information providing all details required for the physical movement of a consignment/shipment.
Subcontractor In this context the party undertaking transport of goods from one
location to another on behalf of the carrier.
Supplier Party which provides goods and/or services to one or more customers.
Terms of Delivery All the conditions agreed upon between parties with regard to the ownership of the various responsibilities involved in the delivery of goods and/or services.
Tank to Wheel
Emissions
Term to describe emissions use of fuel. See Section 5.6.
Third Party Logistics services provider (3PL)
Supplier of outsourced logistics services that primarily uses its own assets and resources.
Track & trace In this context the function of retrieving information concerning goods, goods items, shipments, consignments or equipment in order to hold status and deviations.
Trans loading The process by which goods are transferred from one mean of transport to another.
Transport buyer The party that is commercially contracting the transport service provider.
Transport equipment A separately identifiable non powered device (e.g. a 20/40 ft. container, a trailer, a rail car, a handling equipment), but not packaging. See also Logistic unit.
Transport Handling Unit See Logistic unit.
Transport ID A unique identifier for a mode of transportation.
Transport information A generic term for all information exchanged throughout the
transport chain.
Transport instruction A generic term for the information providing the mandatory details to arrange transportation.
Transport label
A label containing barcoded and human readable information about the transport and the goods. Also containing an ID with some kind of uniqueness. The wording of “Transport label” and “Logistics label” are not always used in a similar way, some strictly differentiate between the two while others see them as synonyms. See examples: STILL, STE, GTL, OTL, and MITL.

GUIDELINES FOR REPORTING FREIGHT GREENHOUSE GAS EMISSIONS DOC REF NO: LG08
VERSION NO: 1.0 DATE: SEPTEMBER 2013
P a g e | 108/ 108
© Odette International Ltd
Term Definition and Main Section References
Transport means A separately identifiable powered transport device (e.g. truck, vessel,
plane).
Transport mode The method of transport used for the conveyance of goods or
persons, e.g. by rail, by road, by sea.
Transport request See pick-up request.
Transport Service
Provider
Any company who provides a transport service note: A transport
service provider can be a freight carrier (acting directly for shippers
or as sub-contractor for another freight carrier or for a freight
forwarder), a freight forwarder, and a logistics service provider which
provides transport services.
Transport status
The status of goods during a transport service. For example, in
transit, damaged, delayed, or diverted. Used to collect information
for track & trace.
Transport user
User (often buyer) of transport services offered or performed by
transport service providers. Can include transport buyer, consignor
and consignee.
UCR (Unique
Consignment
Reference)
A globally unique identification of consignment for customs
declarations (WCO framework).
UK Guidance
Within these guidelines, this phrase refers to the guidance on
measuring and reporting Greenhouse Gas (GHG) emissions from
freight transport operations in the UK published by DEFRA (Section
11.2.3).
Ultimate consignee See Final consignee.
UNFCCC United Nations Framework Convention on Climate Change.
Upstream Phase Term relating to emissions produced during generation/ delivery of
fuel (= ‘Well to Tank’ emissions) See Section 5.6.
Well to Tank Emissions Term to describe emissions from generation and delivery of fuel. See
Section 5.6.
Well to Wheel
Emissions
Term to describe emissions from generation, delivery and use of fuel.
See Section 5.6.
VOS
Vehicle Operation System – term used in CEN standard to describe
the activities carried out by one or more vehicles to execute a specific
transport leg (See Section 6.2.2).