automotive m&a insights: mid year review 2013
TRANSCRIPT
Automotive M&A Insights:Mid-year 2013
September 2013
www.pwc.com/auto
Welcome
We are pleased to present Automotive M&A Insights: Mid-Year 2013, PwC’s quarterly review of mergers and acquisition (M&A) activity and key trends impacting the global automotive industry.1 In this edition, we look at:
• The status of global automotive deal activity among vehicle manufacturers, suppliers, fi nanciers, and other related sectors (including; retail, aftermarket, rental/leasing, wholesale, etc.)
• Key trends that impacted the deal market in the fi rst half of 2013
• Transaction activity by sector and region
• Our perspective on the road ahead
This latest edition of Automotive M&A Insights: Mid-Year 2013 is meant to serve only as a preface to the insights and observations that we can provide to drive successful transactions. M&A leaders in the automotive and fi nancial sectors frequently turn to us for advice on potential transactions and the strategies underpinning those deals. Your feedback is important to us, and we welcome the opportunity to provide you with a deeper look into any of these topics that may be of benefi t to your organization.
1 Data sourced from Thomson Reuters as well as analysis performed by PwC’s Autofacts
Paul G. ElieU.S. Automotive Transaction Services Leader+1 (313) 394 [email protected]
2013 Automotive insights 1
The big picture: Globally, cross-sector M&A volume dropped by 14% compared to the fi rst half of 2012—marking the slowest fi rst-half activity since 2003. Consistent with cross-sector activity, automotive deal volume has also slowed; however, deal value has risen by 24% and the fi rst half of 2013 saw the average deal size accelerate, generating a 72% increase over the fi rst half of 2012.
A snapshot of industry sectors and regions: In the fi rst half of 2013, Vehicle Manufacturers suffered a steep drop in both deal value (75%) and volume (29%) compared to the fi rst half of 2012. In contrast, deal value in the Component sector suppliers and businesses in the Others category, which includes: retail, aftermarket, rental/leasing and wholesale, etc., soared by a remarkable 84% and 121% respectively. With regard to Assembly volumes, moderate growth in some regions was offset by the woes in Europe, but European recovery is expected to begin in early 2014. While North America and Developing Asia Pacifi c have both fueled Assembly growth (+793K and +689K units, respectively), we expect to see ongoing declines in the Developed Asia Pacifi c region. We attribute this primarily to ongoing localization of vehicle production abroad by foreign and European OEMs, coupled with the lingering economic pain that is thwarting growth in Europe. Globally, PwC’s Autofacts team expects Light Vehicle Assembly to reach 81 million units in 2013—a 2.3% year-over-year increase.
Executive summary
Who’s buying? During the fi rst half of 2013, both fi nancial and trade buyers continued to put the brakes on deal volume. That being said, fi nancial buyers made signifi cant investments in the automotive sector, with $6.8 billion in deals closing during that period—the highest share of deal value injected by fi nancial buyers in the last fi ve years. They are now focusing their efforts on the Components and Others categories, targeting candidates in Europe rather than in Asia. Trade buyers are following suit. Their share of deals in Europe has reached new heights, while their demand for Asian assets has plunged to depths not seen in fi ve years. Trade buyers’ investments in the Others category has driven four consecutive years of growth in that sector—close to pre-recessionary share levels.
The road ahead: Overall, given the underlying optimistic view of global automotive sales, PwC continues to maintain a positive outlook for Automotive M&A. To meet this growing demand, Assembly is expected to add nearly 24 million units between now and 2019—a compounded growth rate of 4.35%. Long-term, M&A activity will play an important role in the continued efforts to develop and integrate new technology into vehicles to improve safety, fuel effi ciency and connectivity. We anticipate a steady rollout of innovative new technologies over the next several years. With that being said, the timing and degree of growth in the global automotive M&A markets will of course depend on the future state of the economic climate around the world.
2 PwC
Cross-sector M&A
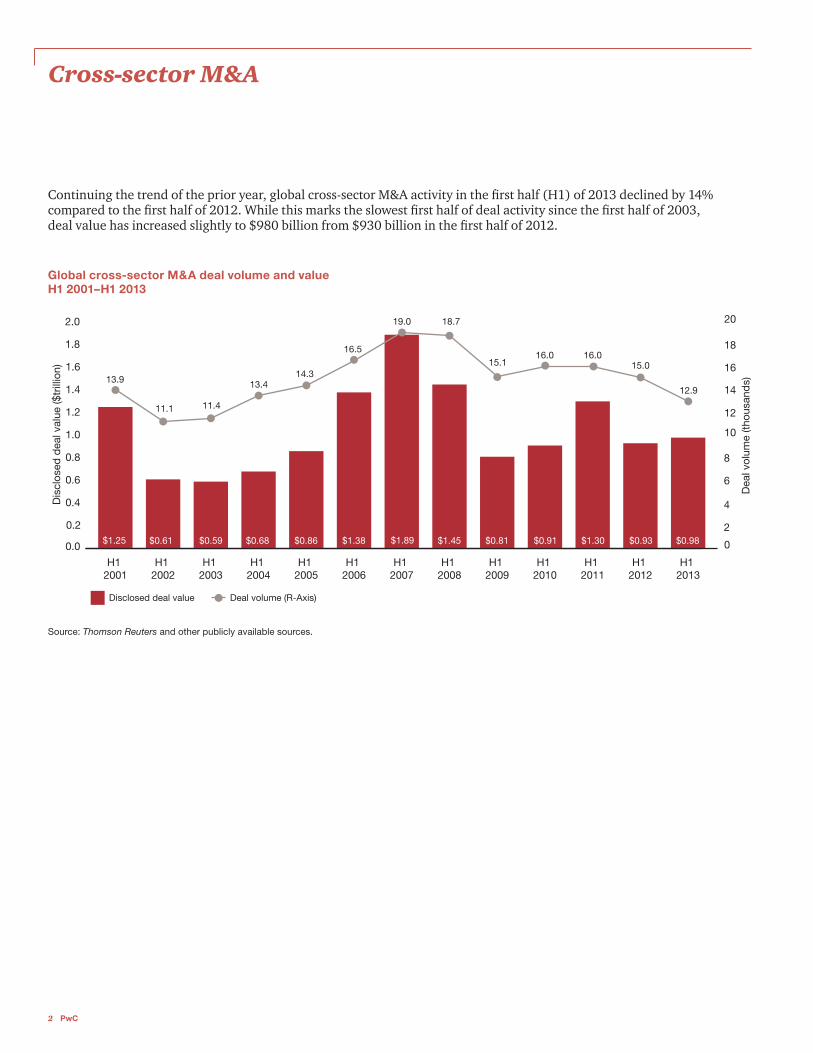
Global cross-sector M&A deal volume and valueH1 2001–H1 2013
Continuing the trend of the prior year, global cross-sector M&A activity in the fi rst half (H1) of 2013 declined by 14% compared to the fi rst half of 2012. While this marks the slowest fi rst half of deal activity since the fi rst half of 2003, deal value has increased slightly to $980 billion from $930 billion in the fi rst half of 2012.
Disclosed deal value
0.0
0.2
0.4
0.6
0.8
1.0
1.2
1.4
1.6
1.8
2.0
H1 2013
H1 2012
H1 2011
H1 2010
H1 2009
H1 2008
H1 2007
H1 2006
H1 2005
H1 2004
H1 2003
H1 2002
H1 2001
Deal volume (R-Axis)
Dis
clos
ed d
eal v
alue
($tr
illio
n)
Dea
l vol
ume
(thou
sand
s)
0
2
4
6
8
10
12
14
16
18
20
15.1
18.7
16.0 16.015.0
12.9
19.0
16.5
14.313.4
11.411.1
13.9
$1.25 $0.61 $0.59 $0.68 $0.86 $1.38 $1.89 $1.45 $0.91$0.81 $1.30 $0.93 $0.98
Source: Thomson Reuters and other publicly available sources.
2013 Automotive insights 3
Automotive M&A
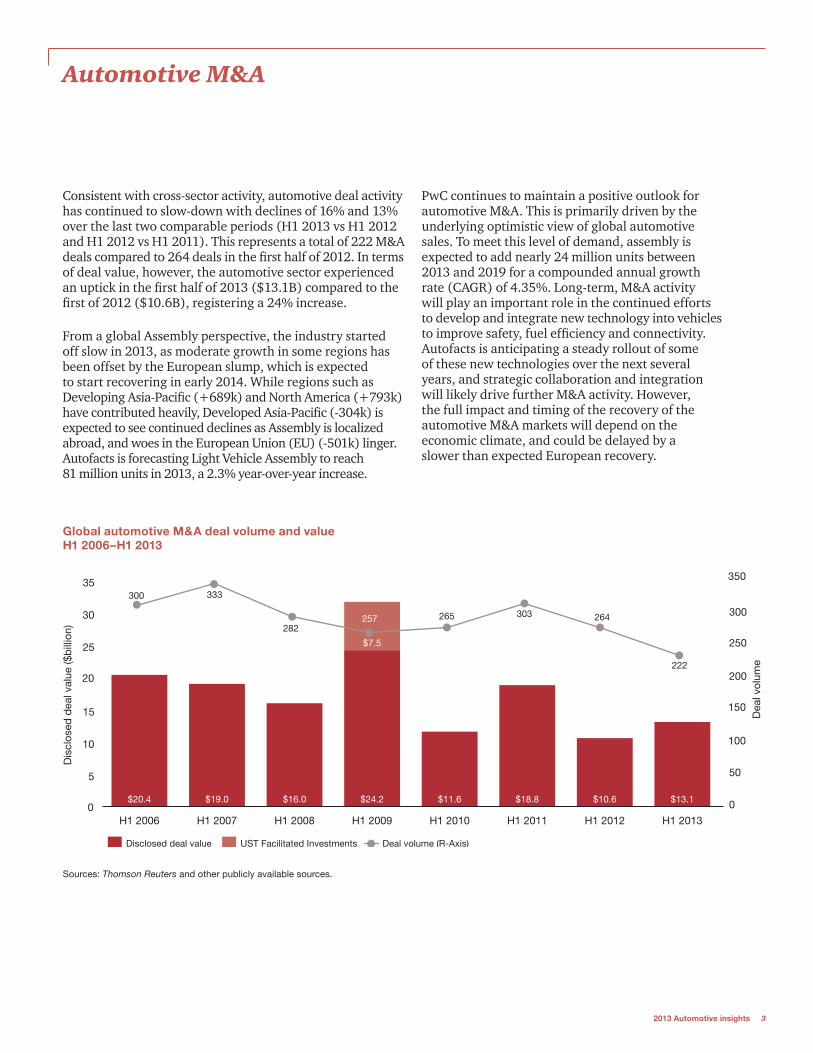
Consistent with cross-sector activity, automotive deal activity has continued to slow-down with declines of 16% and 13% over the last two comparable periods (H1 2013 vs H1 2012 and H1 2012 vs H1 2011). This represents a total of 222 M&A deals compared to 264 deals in the fi rst half of 2012. In terms of deal value, however, the automotive sector experienced an uptick in the fi rst half of 2013 ($13.1B) compared to the fi rst of 2012 ($10.6B), registering a 24% increase.
From a global Assembly perspective, the industry started off slow in 2013, as moderate growth in some regions has been offset by the European slump, which is expected to start recovering in early 2014. While regions such as Developing Asia-Pacifi c (+689k) and North America (+793k) have contributed heavily, Developed Asia-Pacifi c (-304k) is expected to see continued declines as Assembly is localized abroad, and woes in the European Union (EU) (-501k) linger. Autofacts is forecasting Light Vehicle Assembly to reach 81 million units in 2013, a 2.3% year-over-year increase.
PwC continues to maintain a positive outlook for automotive M&A. This is primarily driven by the underlying optimistic view of global automotive sales. To meet this level of demand, assembly is expected to add nearly 24 million units between 2013 and 2019 for a compounded annual growth rate (CAGR) of 4.35%. Long-term, M&A activity will play an important role in the continued efforts to develop and integrate new technology into vehicles to improve safety, fuel effi ciency and connectivity. Autofacts is anticipating a steady rollout of some of these new technologies over the next several years, and strategic collaboration and integration will likely drive further M&A activity. However, the full impact and timing of the recovery of the automotive M&A markets will depend on the economic climate, and could be delayed by a slower than expected European recovery.
Global automotive M&A deal volume and valueH1 2006–H1 2013
Sources: Thomson Reuters and other publicly available sources.
Disclosed deal value UST Facilitated Investments Deal volume (R-Axis)
0
5
10
15
20
25
30
35
H1 2013H1 2012H1 2011H1 2010H1 2009H1 2008H1 2007H1 2006
Dis
clos
ed d
eal v
alue
($b
illio
n)
Dea
l vol
ume
0
50
100
150
200
250
300
350
333
282257 265 303 264
$13.1$10.6$18.8$11.6$16.0$19.0 $24.2
$7.5
$20.4
222
300
4 PwC
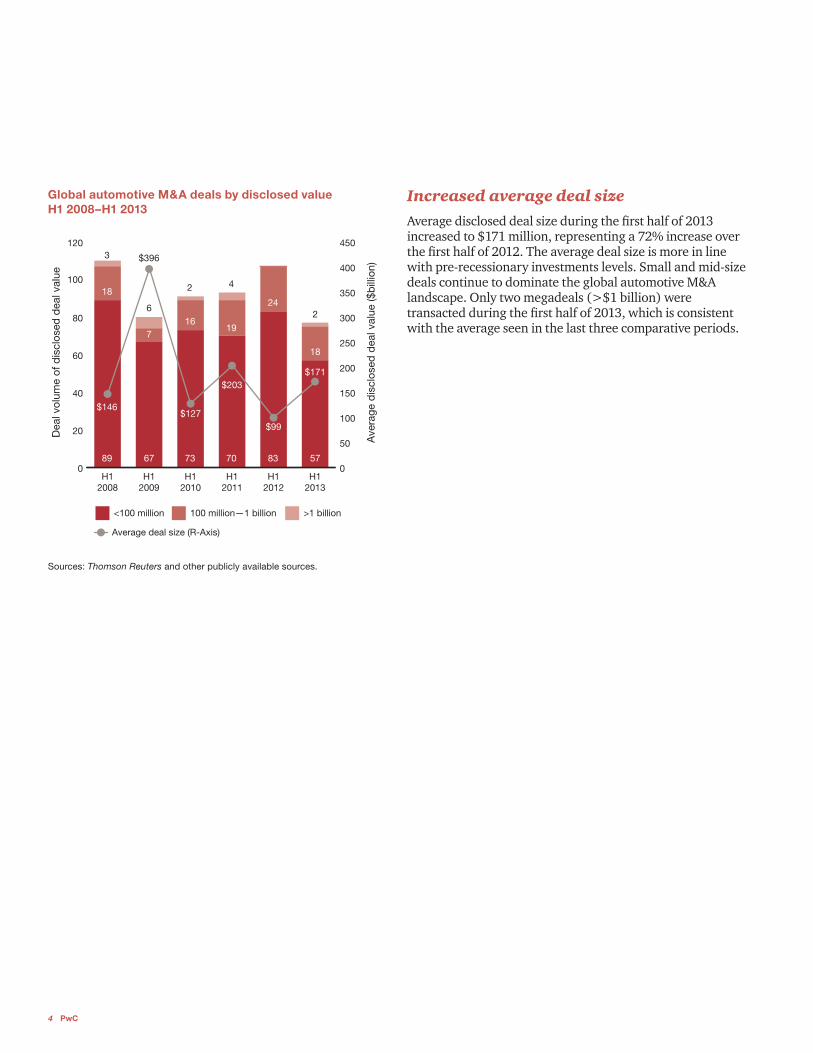
Increased average deal size
Average disclosed deal size during the fi rst half of 2013 increased to $171 million, representing a 72% increase over the fi rst half of 2012. The average deal size is more in line with pre-recessionary investments levels. Small and mid-size deals continue to dominate the global automotive M&A landscape. Only two megadeals (>$1 billion) were transacted during the fi rst half of 2013, which is consistent with the average seen in the last three comparative periods.
Global automotive M&A deals by disclosed valueH1 2008–H1 2013
Sources: Thomson Reuters and other publicly available sources.
100 million—1 billion >1 billion
0
20
40
60
80
100
120
H12013
H12012
H12011
H12010
H12009
H12008
89
18
$146
$396
$127
$203
$99
$171
3
67
7
6
73
16
2
70
19
4
83
24
57
18
2
0
50
100
150
200
250
300
350
400
450
Dea
l vol
ume
of d
iscl
osed
dea
l val
ue
Ave
rage
dis
clos
ed d
eal v
alue
($b
illio
n)
<100 million
Average deal size (R-Axis)
2013 Automotive insights 5
Europe
The automotive industry continues to search for the bottoming out point in the EU as light vehicle sales enter the sixth consecutive year of contraction in the region. Autofacts predicts that 2013 will mark the low point of the sovereign debt crisis and related economic downturn, with a 4% decline in full-year light vehicle sales. Slight growth is expected late in the year, beginning a slow recovery in the region over the mid- to long-term range. Despite this reversal, an ongoing recovery will be linked to the loosening of the credit markets, which will play an important role in driving sales growth.
With the abundance of distressed suppliers in the region, consolidation and M&A activity increased in the fi rst half of the year marking the reversal of Europe’s declining M&A activity over the past three periods.
European assets maintained their position as the largest share of targets; however, European acquirors played the smallest role in cross-border activity, transacting only seven deals in the fi rst half of 2013.
North America
The North American market, bolstered by the continued resurgence of US sales, continues to recover from its recessionary lows, with light vehicle assembly forecast to reach 16.2 million units in 2013. This will mark the fi rst time since 2007 that Assembly numbers will eclipse the 15 million unit mark.
From an M&A perspective, North America was the second-largest target region during the fi rst half of 2013. The region transacted 50% more deals with cross-border acquirors in the fi rst half of 2013 compared to the fi rst half of 2012. Localization of vehicle assembly within
North America is a trend that is likely to drive an increase in activity. The exportation of vehicle production is primarily being driven by foreign OEMs who are looking to reduce the risk of currency volatility and European manufacturers who are seeking a more stable and growing environment.
Asia
Asia transacted the largest volume and value of outbound deals in the fi rst half of 2013, with approximately 70% being in European assets. However, Asia experienced the largest drop in its share of volume during the fi rst half of 2013. The decrease in its share of target deal volume—which fell from 32% in 2012 to 23% in the fi rst half of 2013—is primarily being driven by slowed activity in transactions with Asian vehicle manufacturers.
Though the decline in deal volume and slowed activity may seem to contradict the continued growth of light vehicle sales and assembly, bifurcating the region into Developed and Developing countries results in a clearer perspective on the downward trend. The developed markets of Japan, South Korea and Australia are losing production to former export markets such as the US and EU as OEMs continue to localize Assembly. These mature and stable markets are less apt to engage in M&A activity.
Meanwhile, developing AP markets—including China, India and Association of Southeast Asian Nations (ASEAN)—have seen signifi cant investment in capacity and capital in recent years. Joint ventures and recent market entries are now beginning to search for effective and effi cient use of the newly installed capacity and resources, lending to less activity in these markets overall. This slow-down is expected to be a near-term trend, but overall, developing AP countries will still be the foundation of growth for the global automotive market as a whole.
Regional analysis
6 PwC
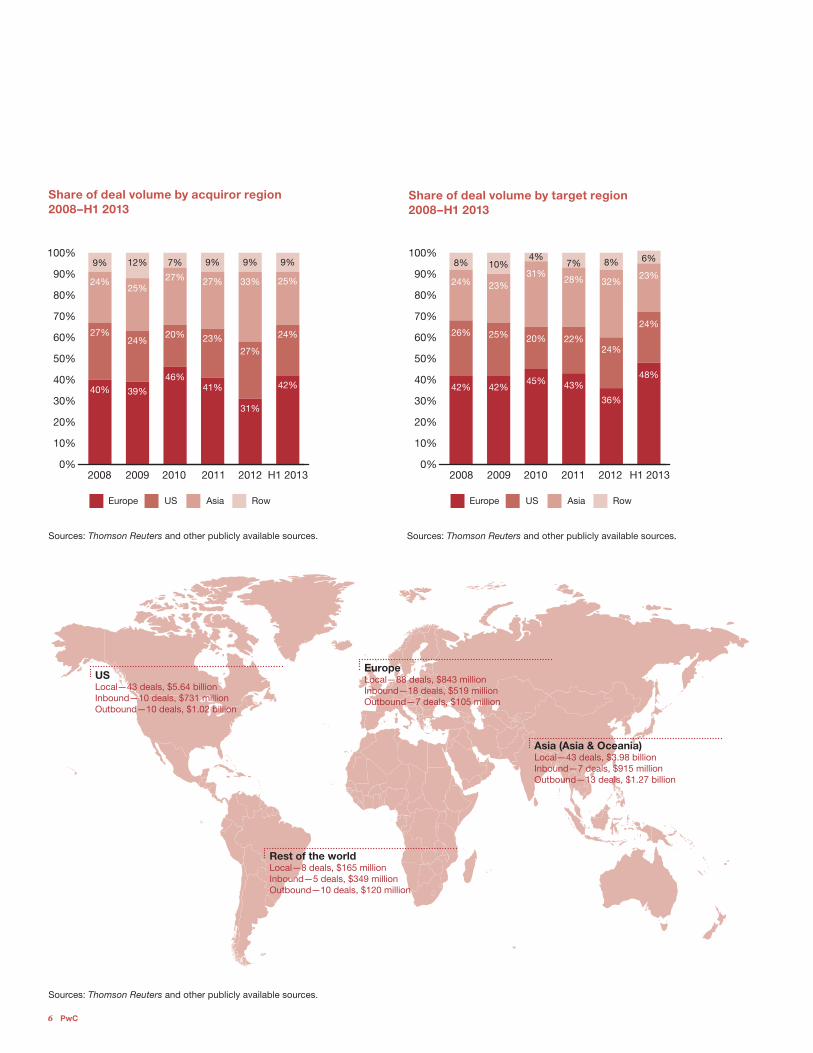
Share of deal volume by acquiror region2008–H1 2013
Share of deal volume by target region2008–H1 2013
Sources: Thomson Reuters and other publicly available sources.
Sources: Thomson Reuters and other publicly available sources. Sources: Thomson Reuters and other publicly available sources.
USLocal—43 deals, $5.64 billionInbound—10 deals, $731 millionOutbound—10 deals, $1.02 billion
Asia (Asia & Oceania)Local—43 deals, $3.98 billionInbound—7 deals, $915 millionOutbound—13 deals, $1.27 billion
Rest of the worldLocal—8 deals, $165 millionInbound—5 deals, $349 millionOutbound—10 deals, $120 million
EuropeLocal—88 deals, $843 millionInbound—18 deals, $519 millionOutbound—7 deals, $105 million
USEurope Asia Row
0%
10%
20%
30%
40%
50%
60%
70%
80%
90%
100%
H1 201320122011201020092008
9%9% 12% 7% 9%
41%39%40%
31%
46%42%
9%
23%24%27% 20%
27%
24%
27%25%
24% 27% 33% 25%
USEurope Asia Row
0%
10%
20%
30%
40%
50%
60%
70%
80%
90%
100%
H1 201320122011201020092008
8%8% 10%4%
7%
43%42%42%36%
45%48%
6%
22%25%26%20%
24%
24%
28%23%24%
31%32%
23%
2013 Automotive insights 7
Segment analysis
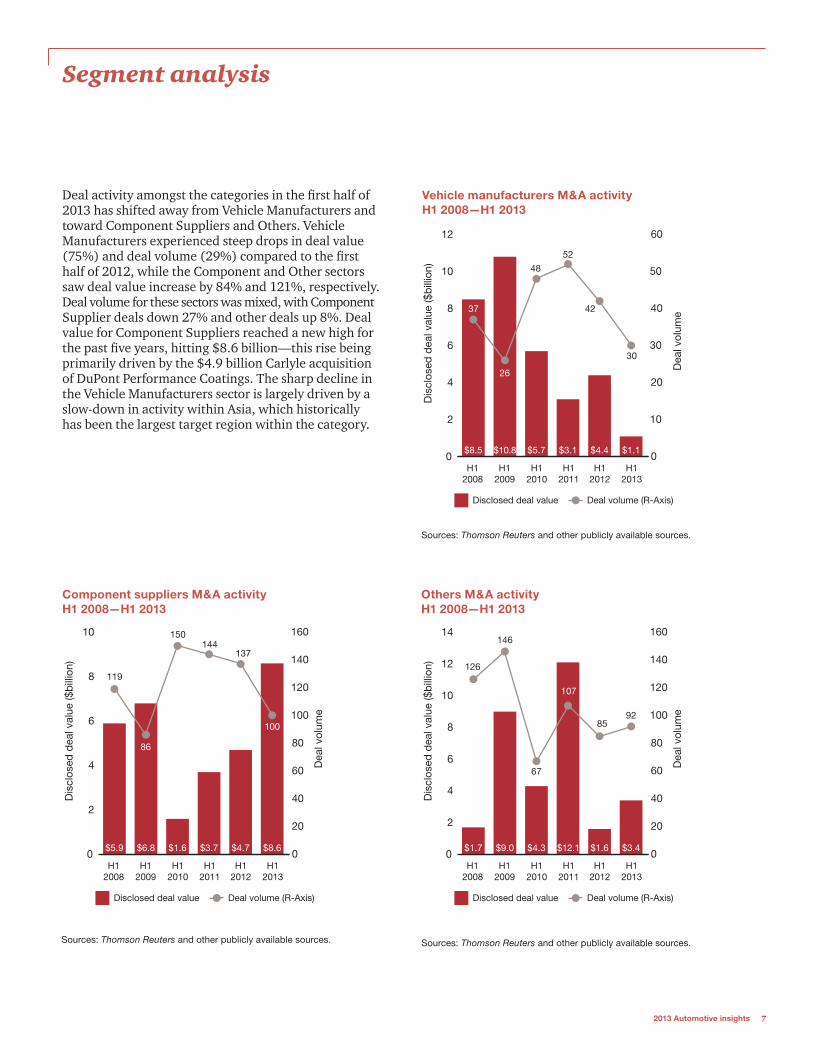
Deal activity amongst the categories in the fi rst half of 2013 has shifted away from Vehicle Manufacturers and toward Component Suppliers and Others. Vehicle Manufacturers experienced steep drops in deal value (75%) and deal volume (29%) compared to the fi rst half of 2012, while the Component and Other sectors saw deal value increase by 84% and 121%, respectively. Deal volume for these sectors was mixed, with Component Supplier deals down 27% and other deals up 8%. Deal value for Component Suppliers reached a new high for the past fi ve years, hitting $8.6 billion—this rise being primarily driven by the $4.9 billion Carlyle acquisition of DuPont Performance Coatings. The sharp decline in the Vehicle Manufacturers sector is largely driven by a slow-down in activity within Asia, which historically has been the largest target region within the category.
Sources: Thomson Reuters and other publicly available sources.
Sources: Thomson Reuters and other publicly available sources.Sources: Thomson Reuters and other publicly available sources.
Vehicle manufacturers M&A activityH1 2008—H1 2013
Others M&A activityH1 2008—H1 2013
Component suppliers M&A activityH1 2008—H1 2013
Dis
clos
ed d
eal v
alue
($b
illio
n)
Dea
l vol
ume
Disclosed deal value Deal volume (R-Axis)
H12013
H12008
H12009
H12010
H12011
H12012
0
2
4
6
8
10
0
20
40
60
80
100
120
140
160
$5.9 $6.8 $1.6 $3.7 $4.7 $8.6
119
86
150144
137
100
Dis
clos
ed d
eal v
alue
($b
illio
n)
Dea
l vol
ume
Disclosed deal value Deal volume (R-Axis)
H12013
H12008
H12009
H12010
H12011
H12012
0
2
4
6
8
10
12
14
0
20
40
60
80
100
120
140
160
$1.7 $9.0 $4.3 $12.1 $1.6 $3.4
126
67
146
107
8592
Dis
clos
ed d
eal v
alue
($b
illio
n)
Dea
l vol
ume
Disclosed deal value Deal volume (R-Axis)
H12013
H12008
H12009
H12010
H12011
H12012
0
2
4
6
8
10
12
0
10
20
30
40
50
60
$8.5 $10.8 $5.7 $3.1 $4.4 $1.1
37
26
48
52
42
30
8 PwC
Trade buyers M&A activityH1 2008—H1 2013
Financial buyers M&A activityH1 2008—H1 2013
Financial buyers share of M&A activityH1 2008—H1 2013
Sources: Thomson Reuters and other publicly available sources.
Sources: Thomson Reuters and other publicly available sources. Sources: Thomson Reuters and other publicly available sources.
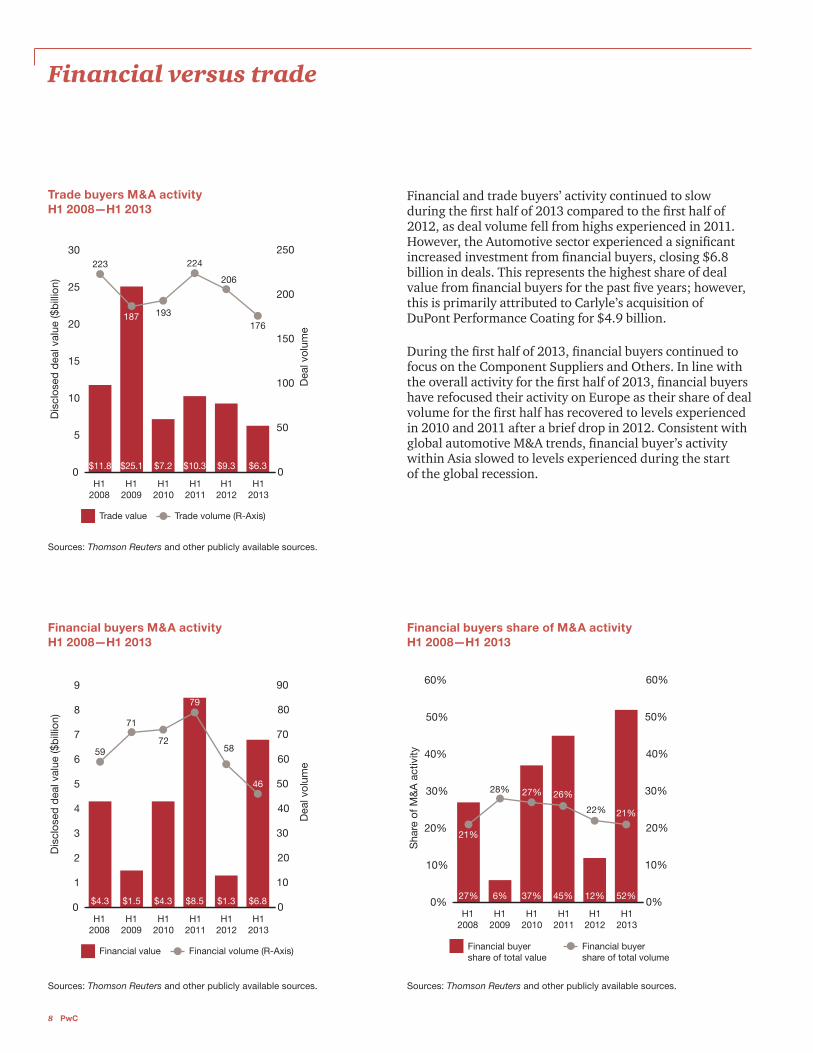
Financial and trade buyers’ activity continued to slow during the fi rst half of 2013 compared to the fi rst half of 2012, as deal volume fell from highs experienced in 2011. However, the Automotive sector experienced a signifi cant increased investment from fi nancial buyers, closing $6.8 billion in deals. This represents the highest share of deal value from fi nancial buyers for the past fi ve years; however, this is primarily attributed to Carlyle’s acquisition of DuPont Performance Coating for $4.9 billion.
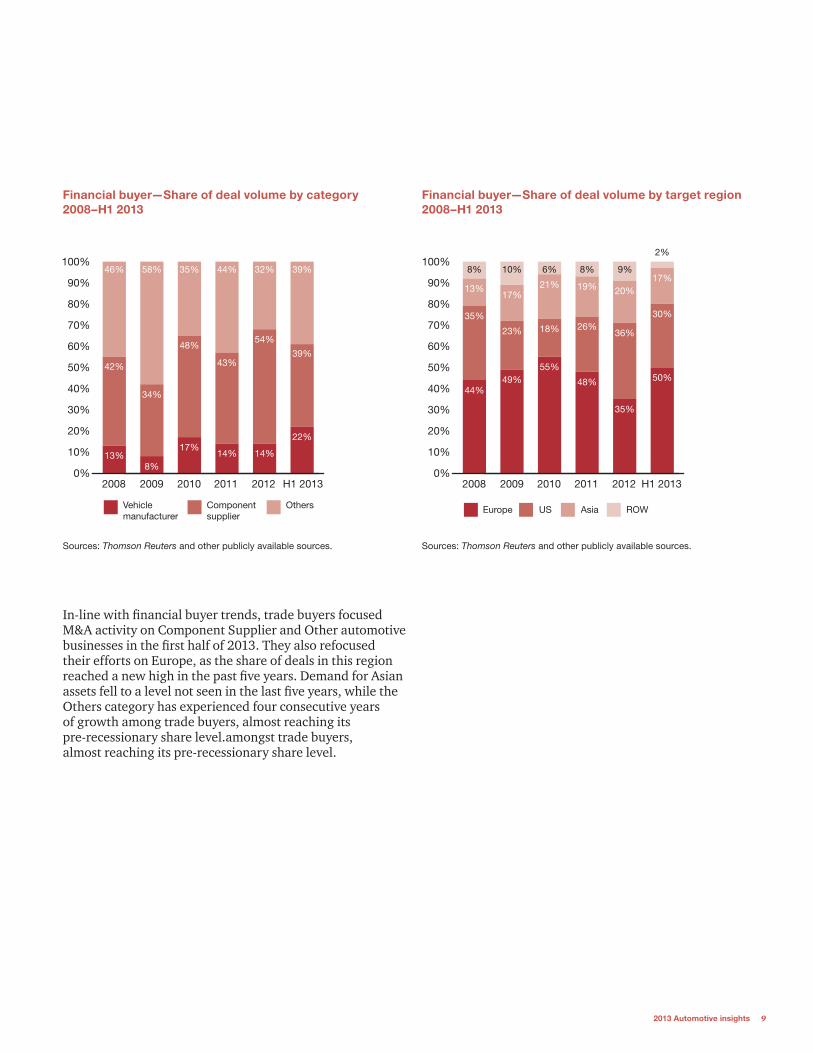
During the fi rst half of 2013, fi nancial buyers continued to focus on the Component Suppliers and Others. In line with the overall activity for the fi rst half of 2013, fi nancial buyers have refocused their activity on Europe as their share of deal volume for the fi rst half has recovered to levels experienced in 2010 and 2011 after a brief drop in 2012. Consistent with global automotive M&A trends, fi nancial buyer’s activity within Asia slowed to levels experienced during the start of the global recession.
Financial versus trade
Sha
re o
f M&
A a
ctiv
ity
Financial buyershare of total value
Financial buyershare of total volume
H12013
H12008
H12009
H12010
H12011
H12012
0%
10%
20%
30%
40%
50%
60%
0%
10%
20%
30%
40%
50%
60%
27% 6% 37% 45% 12% 52%
21%
28% 27% 26%
22% 21%
Dis
clos
ed d
eal v
alue
($b
illio
n)
Dea
l vol
ume
Financial value Financial volume (R-Axis)
H12013
H12008
H12009
H12010
H12011
H12012
0
1
2
3
4
5
6
7
8
9
0
10
20
30
40
50
60
70
80
90
$4.3 $1.5 $4.3 $8.5 $1.3 $6.8
59
71
72
79
58
46
Dis
clos
ed d
eal v
alue
($b
illio
n)
Dea
l vol
ume
Trade value Trade volume (R-Axis)
H12013
H12008
H12009
H12010
H12011
H12012
0
5
10
15
20
25
30
0
50
100
150
200
250
$11.8 $25.1 $7.2 $10.3 $9.3 $6.3
223
187 193
224
206
176
2013 Automotive insights 9
Sources: Thomson Reuters and other publicly available sources.
Financial buyer—Share of deal volume by target region2008–H1 2013
Financial buyer—Share of deal volume by category2008–H1 2013
Sources: Thomson Reuters and other publicly available sources.
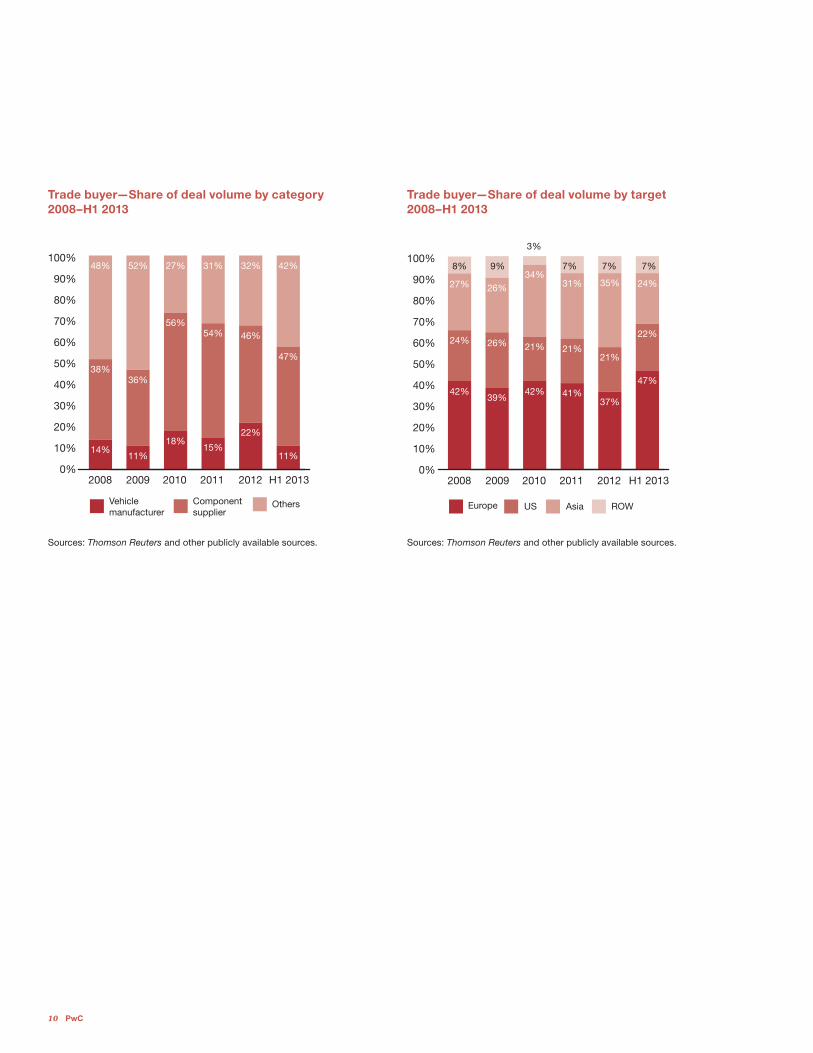
In-line with fi nancial buyer trends, trade buyers focused M&A activity on Component Supplier and Other automotive businesses in the fi rst half of 2013. They also refocused their efforts on Europe, as the share of deals in this region reached a new high in the past fi ve years. Demand for Asian assets fell to a level not seen in the last fi ve years, while the Others category has experienced four consecutive years of growth among trade buyers, almost reaching its pre-recessionary share level.amongst trade buyers, almost reaching its pre-recessionary share level.
USEurope Asia ROW
0%
10%
20%
30%
40%
50%
60%
70%
80%
90%
100%
H1 201320122011201020092008
9%8% 10% 6% 8%
48%49%44%
35%
55%50%
2%
26%23%
35%18% 36%
30%
19%17%
13% 21%20%
17%
Component supplier
Vehicle manufacturer
Others
0%
10%
20%
30%
40%
50%
60%
70%
80%
90%
100%
H1 201320122011201020092008
14%8%
13%17%
22%
43%
34%
42%
48%54%
39%
44%58%46% 35% 32% 39%
14%
10 PwC
Trade buyer—Share of deal volume by target2008–H1 2013
Trade buyer—Share of deal volume by category2008–H1 2013
Sources: Thomson Reuters and other publicly available sources. Sources: Thomson Reuters and other publicly available sources.
Component supplier
Vehicle manufacturer
Others
0%
10%
20%
30%
40%
50%
60%
70%
80%
90%
100%
H1 201320122011201020092008
15%11%
14%
22%18%
11%
54%
36%38%
56%46%
47%
31%52%48% 27% 32% 42%
USEurope Asia ROW
0%
10%
20%
30%
40%
50%
60%
70%
80%
90%
100%
H1 201320122011201020092008
41%39%42%
37%42%
47%
21%26%24%
27%
21%21%
22%
7%
31%26%
8% 9%
3%
34%7% 7%
35% 24%
2013 Automotive insights 11
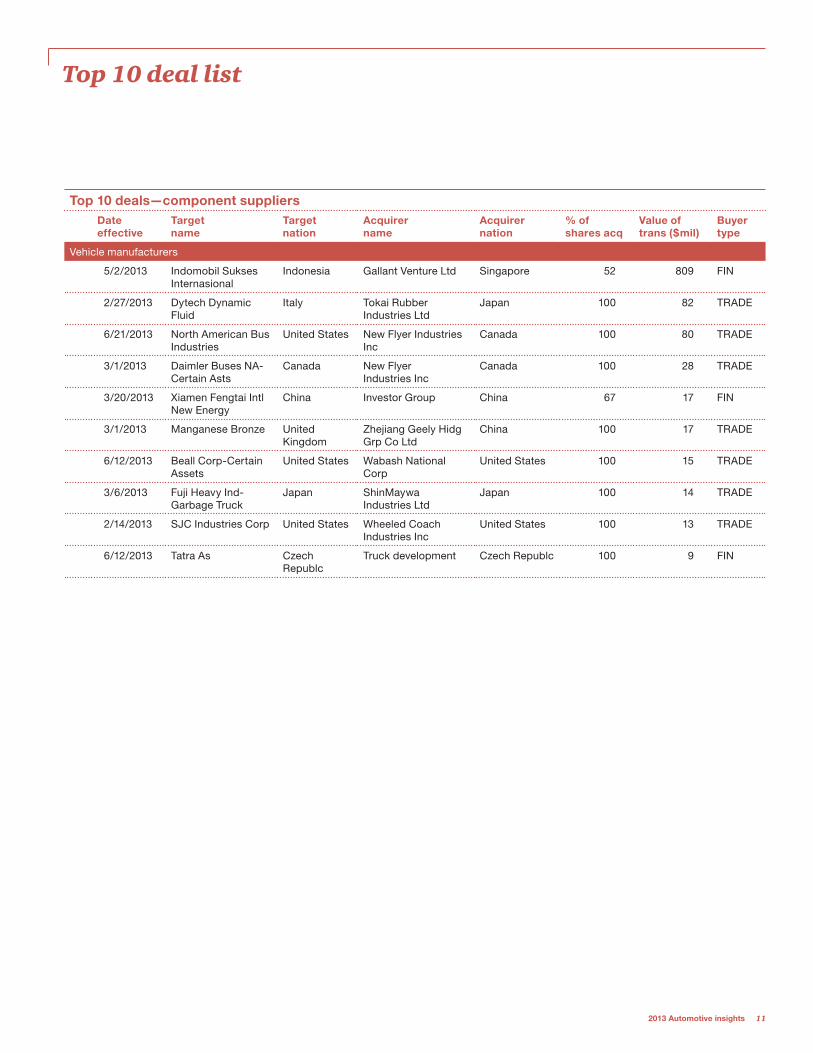
Top 10 deal list
Top 10 deals—component suppliersDate effective
Target name
Target nation
Acquirer name
Acquirer nation
% of shares acq
Value of trans ($mil)
Buyer type
Vehicle manufacturers
5/2/2013 Indomobil Sukses Internasional
Indonesia Gallant Venture Ltd Singapore 52 809 FIN
2/27/2013 Dytech Dynamic Fluid
Italy Tokai Rubber Industries Ltd
Japan 100 82 TRADE
6/21/2013 North American Bus Industries
United States New Flyer Industries Inc
Canada 100 80 TRADE
3/1/2013 Daimler Buses NA-Certain Asts
Canada New Flyer Industries Inc
Canada 100 28 TRADE
3/20/2013 Xiamen Fengtai Intl New Energy
China Investor Group China 67 17 FIN
3/1/2013 Manganese Bronze United Kingdom
Zhejiang Geely Hidg Grp Co Ltd
China 100 17 TRADE
6/12/2013 Beall Corp-Certain Assets
United States Wabash National Corp
United States 100 15 TRADE
3/6/2013 Fuji Heavy Ind-Garbage Truck
Japan ShinMaywa Industries Ltd
Japan 100 14 TRADE
2/14/2013 SJC Industries Corp United States Wheeled Coach Industries Inc
United States 100 13 TRADE
6/12/2013 Tatra As Czech Republc
Truck development Czech Republc 100 9 FIN
12 PwC
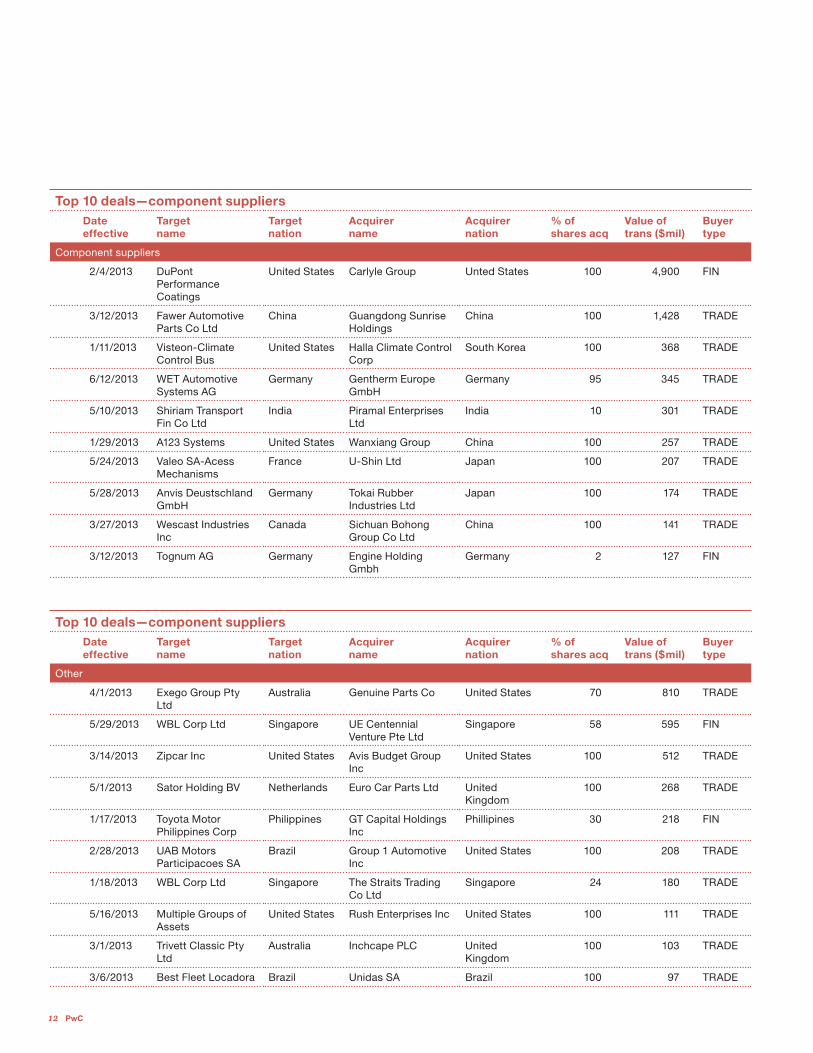
Top 10 deals—component suppliersDate effective
Target name
Target nation
Acquirer name
Acquirer nation
% of shares acq
Value of trans ($mil)
Buyer type
Component suppliers
2/4/2013 DuPont Performance Coatings
United States Carlyle Group Unted States 100 4,900 FIN
3/12/2013 Fawer Automotive Parts Co Ltd
China Guangdong Sunrise Holdings
China 100 1,428 TRADE
1/11/2013 Visteon-Climate Control Bus
United States Halla Climate Control Corp
South Korea 100 368 TRADE
6/12/2013 WET Automotive Systems AG
Germany Gentherm Europe GmbH
Germany 95 345 TRADE
5/10/2013 Shiriam Transport Fin Co Ltd
India Piramal Enterprises Ltd
India 10 301 TRADE
1/29/2013 A123 Systems United States Wanxiang Group China 100 257 TRADE
5/24/2013 Valeo SA-Acess Mechanisms
France U-Shin Ltd Japan 100 207 TRADE
5/28/2013 Anvis Deustschland GmbH
Germany Tokai Rubber Industries Ltd
Japan 100 174 TRADE
3/27/2013 Wescast Industries Inc
Canada Sichuan Bohong Group Co Ltd
China 100 141 TRADE
3/12/2013 Tognum AG Germany Engine Holding Gmbh
Germany 2 127 FIN
Top 10 deals—component suppliersDate effective
Target name
Target nation
Acquirer name
Acquirer nation
% of shares acq
Value of trans ($mil)
Buyer type
Other
4/1/2013 Exego Group Pty Ltd
Australia Genuine Parts Co United States 70 810 TRADE
5/29/2013 WBL Corp Ltd Singapore UE Centennial Venture Pte Ltd
Singapore 58 595 FIN
3/14/2013 Zipcar Inc United States Avis Budget Group Inc
United States 100 512 TRADE
5/1/2013 Sator Holding BV Netherlands Euro Car Parts Ltd United Kingdom
100 268 TRADE
1/17/2013 Toyota Motor Philippines Corp
Philippines GT Capital Holdings Inc
Phillipines 30 218 FIN
2/28/2013 UAB Motors Participacoes SA
Brazil Group 1 Automotive Inc
United States 100 208 TRADE
1/18/2013 WBL Corp Ltd Singapore The Straits Trading Co Ltd
Singapore 24 180 TRADE
5/16/2013 Multiple Groups of Assets
United States Rush Enterprises Inc United States 100 111 TRADE
3/1/2013 Trivett Classic Pty Ltd
Australia Inchcape PLC United Kingdom
100 103 TRADE
3/6/2013 Best Fleet Locadora Brazil Unidas SA Brazil 100 97 TRADE
2013 Automotive insights 13
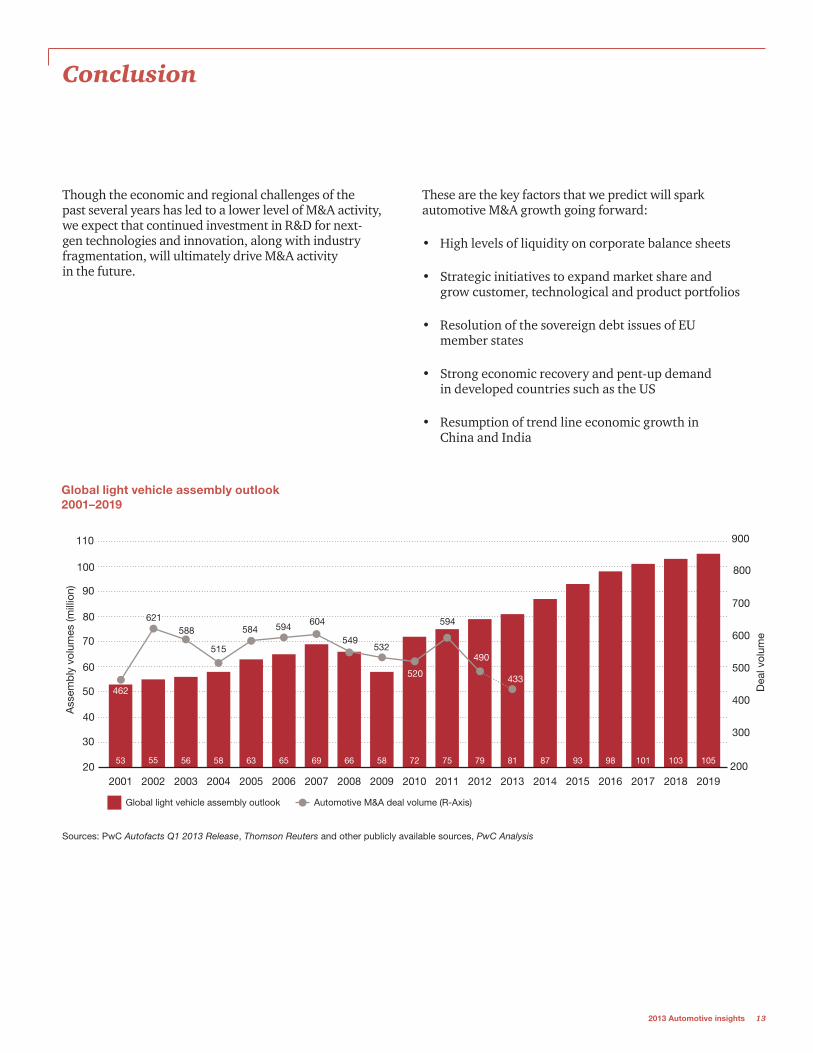
Conclusion
Though the economic and regional challenges of the past several years has led to a lower level of M&A activity, we expect that continued investment in R&D for next-gen technologies and innovation, along with industry fragmentation, will ultimately drive M&A activity in the future.
These are the key factors that we predict will spark automotive M&A growth going forward:
• High levels of liquidity on corporate balance sheets
• Strategic initiatives to expand market share and grow customer, technological and product portfolios
• Resolution of the sovereign debt issues of EU member states
• Strong economic recovery and pent-up demand in developed countries such as the US
• Resumption of trend line economic growth in China and India
Global light vehicle assembly outlook
20
30
40
50
60
70
80
90
100
110
2019201820172016201520142013201220112010200920082007200620052004200320022001
Automotive M&A deal volume (R-Axis)
Ass
emb
ly v
olum
es (m
illio
n)
Dea
l vol
ume
200
300
400
500
600
700
800
900
53 55 56 58 63 65 69 66 58 72 75 79 81 87 93 98 101 103 105
584
462
588
515
594 604 594
490
433
549532
520
621
Global light vehicle assembly outlook 2001–2019
Sources: PwC Autofacts Q1 2013 Release, Thomson Reuters and other publicly available sources, PwC Analysis
14 PwC
Contacts
To have a deeper discussion about our point of view on automotive M&A, please contact:
Authors
US Automotive Transaction Services LeaderPaul Elie—+1 (313) 394 [email protected]
Director, Automotive Transaction ServicesHarry Gruits—+1 (313) 394 [email protected]
Experienced Associate, Automotive Transaction ServicesChristopher Becker—+1 (313) 394 [email protected]
Automotive transaction services
BrazilHumberto Tognelli—+55 (11) 3674 [email protected]
CanadaDamiano Peluso—+1 (416) 814 [email protected]
China Leon Qian—+86 (10) 6533 [email protected]
Tang Xun—+86 (21) 2323 [email protected]
France Philippe Couderc—+33 (1) 5657 [email protected]
GermanyMartin Schwarzer—+49 (0) 69 9585 [email protected]
India Sanjeev Krishan—+91 (12) 4330 [email protected]
ItalyFrancesco Giordano—+39 348 [email protected]
JapanTaizo Iwashima—+81 (3) 6266 [email protected]
UK Jason Wakelam—+44 (0) 77 1471 [email protected]
USPaul Elie—+1 (313) 394 [email protected]
Automotive leadership
Global Automotive LeaderRichard Hanna—+1 (313) 394 [email protected]
European Automotive LeaderFelix Kuhnert—+49 (711) 25034 [email protected]
U.S. Automotive Advisory Leader Brian Decker—+1 (313) 394 [email protected]
Global Automotive Advisory LeaderDietmar Ostermann—+1 (313) 394 [email protected]
Global Automotive Tax LeaderAlexander Unfried—+49 (711) 25034 [email protected]
2013 Automotive insights 15
Corporate fi nance
CanadaDamian Peluso—+1 (416) 814 [email protected]
GermanyMartin Schwarzer—+49 (69) 9585 [email protected]
ItalyMarco Tanzi Marlotti—+39 (02) [email protected]
JapanTaizol Iwashima—+81 (3) 6266 [email protected]
UKDarren Jukes—+44 (20) 7804 [email protected]
USMike Milani†—+1 (312) 298 [email protected]
Automotive marketing and media relations inquiries
Global and U.S. Automotive Marketing LeaderKristin McCallum Ritter—+1 (313) 394 [email protected]
Automotive Marketing ManagerMeghan Bested—+1 (313) 394 [email protected]
†Corporate Finance services in the US are performed by PricewaterhouseCoopers Corporate Finance LLC (“PwC CF”), a registered broker dealer. PwC CF is owned by PricewaterhouseCoopers LLP, a member fi rm of the PricewaterhouseCoopers Network, and is a member of FINRA and SIPC.
16 PwC
Global reach
About Autofacts®
Autofacts, PwC’s automotive forecasting service, is a provider of automotive market analysis, strategy development, and competitive intelligence to the world’s leading vehicle manufacturers, automotive suppliers, and support organizations. Autofacts service offerings are available on-demand, for one-time purchase and through an annual subscription basis to access the on-line portal with Autofacts’ proprietary data query tool. For more information regarding Autofacts, please visit their website at www.autofacts.com.
About the Transaction Services Practice
The PwC’s Transaction Services practice provides due diligence on both the buy and sell side of a deal, along with advice on M&A strategy, valuation, accounting, fi nancial reporting, and capital raising. For companies in distressed situations, we advise on crisis avoidance, fi nancial and operational restructuring and bankruptcy. With approximately 1,000 deal professionals in 16 cities in the US and over 6,000 deal professionals in over 90 countries, experienced teams are deployed with deep industry and local market knowledge, and technical experience tailored to each client’s situation. Our fi eld-proven, globally consistent, controlled deal process helps clients minimize their risks, progress with the right deals, and capture value both at the deal table and after the deal closes.
“PwC was recognized as having the largest Transaction Advisory Services Practice by revenue. PwC was also named a “Vanguard” fi rm and recognized by Kennedy as having the highest breadth and depth of service capabilities”.
Source: Kennedy; “Transaction Advisory Consulting Marketplace Report 2009–2012”; © BNA Subsidiaries, LLC. Reproduced under license.


Visit our automotive industry website at www.pwc.com/auto
© 2013 PricewaterhouseCoopers LLP. All rights reserved. “PricewaterhouseCoopers” and “PwC” refer to PricewaterhouseCoopers LLP, a Delaware limited liability partnership, or, as the context requires, the PricewaterhouseCoopers global network or other member fi rms of the network, each of which is a separate legal entity. This document is for general information purposes only, and should not be used as a substitute for consultation with professional advisors. MW-14-0077
PricewaterhouseCoopers has taken all reasonable steps to ensure that information contained herein has been obtained from reliable sources and that this publication is accurate and authoritative in all respects. However, it is not intended to give legal, tax, accounting, or other professional advice. If such advice or other expert assistance is required, the services of a competent professional should be sought.