automotive light vehicle production global highlights - … · automotive light vehicle production...
TRANSCRIPT
www.lmc-auto.com © 2016 LMC Automotive Limited, All Rights Reserved.
Automotive Light Vehicle Production Global highlights
July 1st 2016 Justin Cox, Head of European Production, LMC Automotive
www.lmc-auto.com © 2016 LMC Automotive Limited, All Rights Reserved. 2
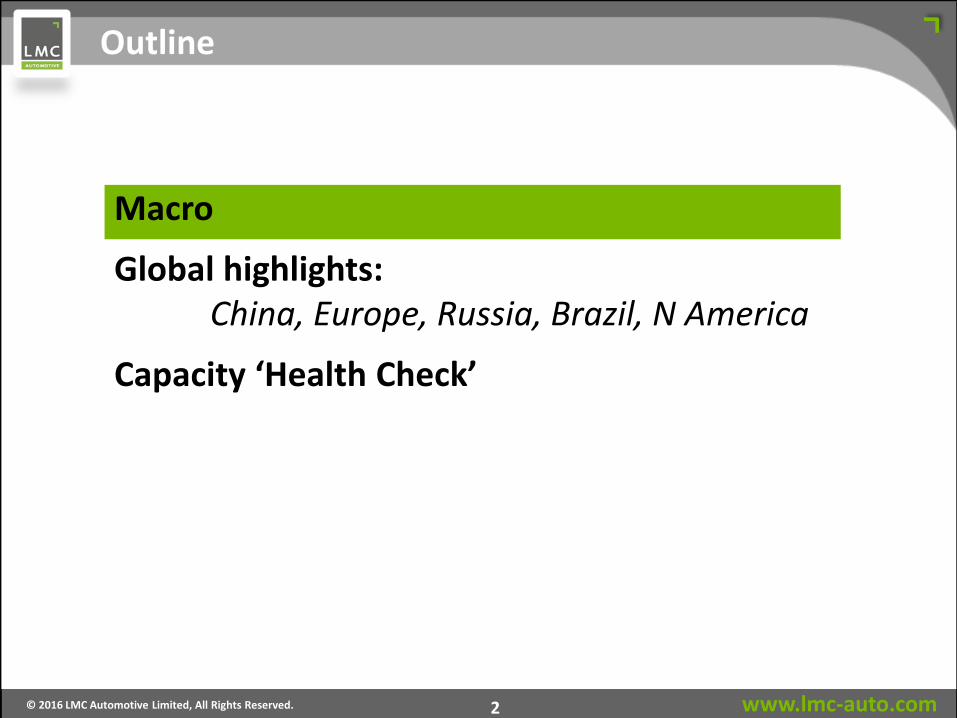
Outline
Macro
Global highlights: China, Europe, Russia, Brazil, N America
Capacity ‘Health Check’
www.lmc-auto.com © 2016 LMC Automotive Limited, All Rights Reserved. 3
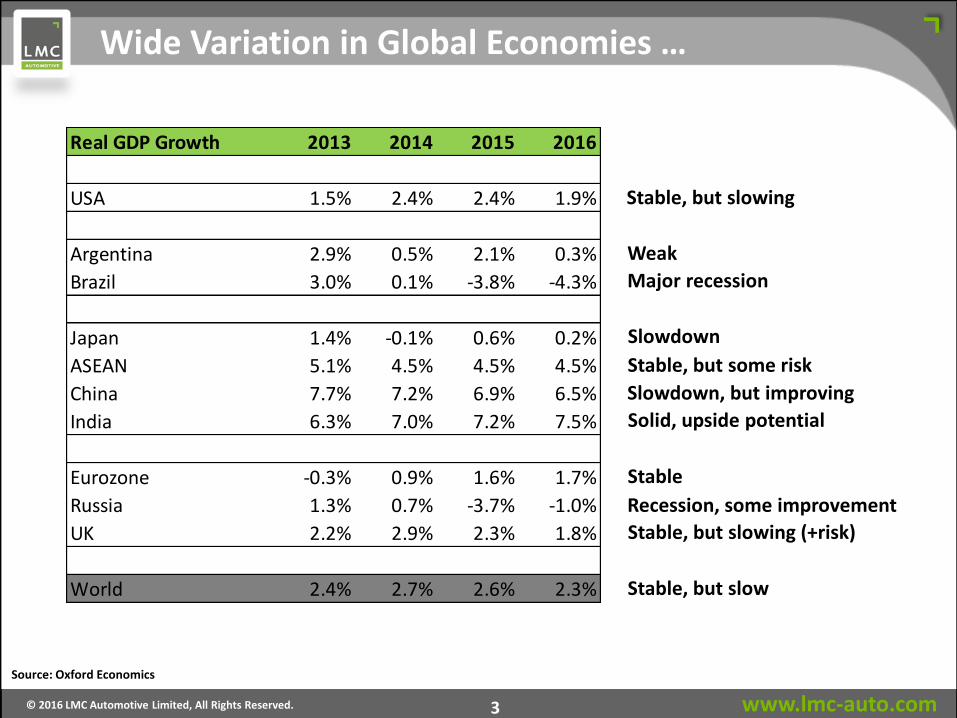
Wide Variation in Global Economies …
Real GDP Growth 2013 2014 2015 2016
USA 1.5% 2.4% 2.4% 1.9%
Argentina 2.9% 0.5% 2.1% 0.3%
Brazil 3.0% 0.1% -3.8% -4.3%
Japan 1.4% -0.1% 0.6% 0.2%
ASEAN 5.1% 4.5% 4.5% 4.5%
China 7.7% 7.2% 6.9% 6.5%
India 6.3% 7.0% 7.2% 7.5%
Eurozone -0.3% 0.9% 1.6% 1.7%
Russia 1.3% 0.7% -3.7% -1.0%
UK 2.2% 2.9% 2.3% 1.8%
World 2.4% 2.7% 2.6% 2.3%
Stable, but slowing
Major recession
Slowdown
Stable, but some risk
Slowdown, but improving
Solid, upside potential
Stable
Recession, some improvement
Stable, but slowing (+risk)
Stable, but slow
Source: Oxford Economics
Weak
www.lmc-auto.com © 2016 LMC Automotive Limited, All Rights Reserved. 4
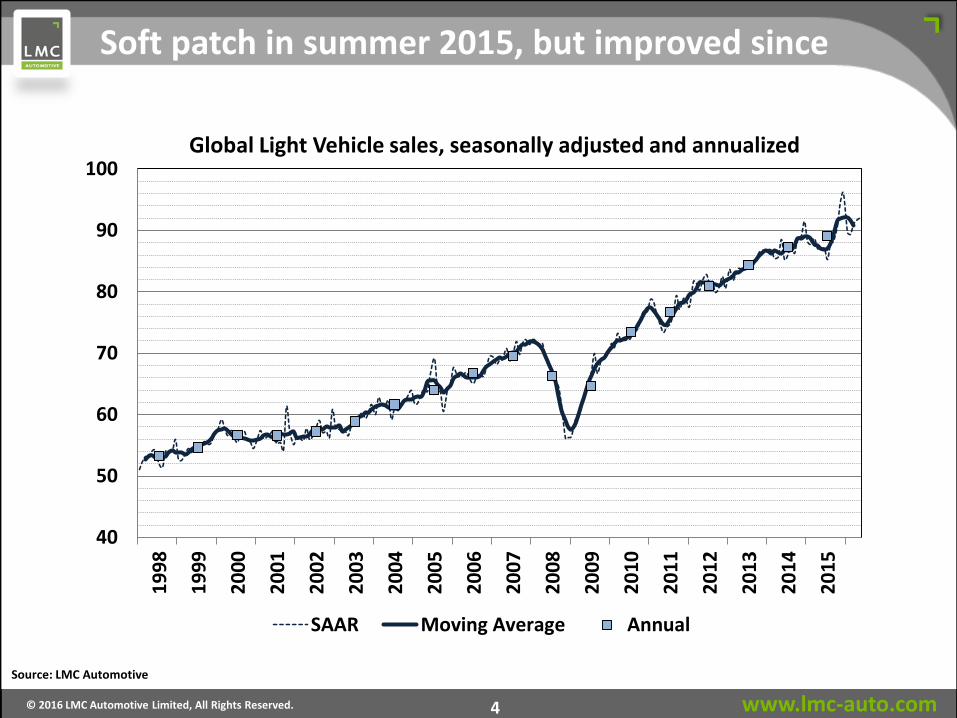
Global Light Vehicle sales, seasonally adjusted and annualized
Source: LMC Automotive
Soft patch in summer 2015, but improved since
40
50
60
70
80
90
1001
99
8
19
99
20
00
20
01
20
02
20
03
20
04
20
05
20
06
20
07
20
08
20
09
20
10
20
11
20
12
20
13
20
14
20
15
SAAR Moving Average Annual
www.lmc-auto.com © 2016 LMC Automotive Limited, All Rights Reserved. 5
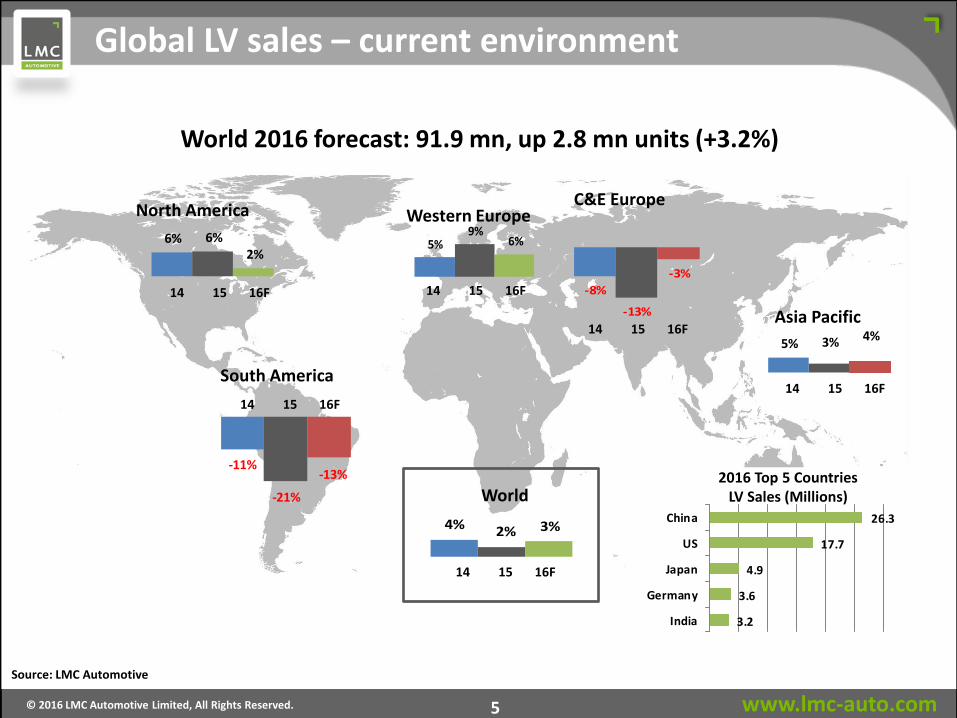
26.3
17.7
4.9
3.6
3.2
China
US
Japan
Germany
India
World 2016 forecast: 91.9 mn, up 2.8 mn units (+3.2%)
6% 6%2%
5%9%
6%
-8%
-13%
-3%
-11%
-21%
-13%
5% 3% 4%
North America
Asia Pacific
C&E Europe Western Europe
South America
14 15 16F
4% 2% 3%
World
Global LV sales – current environment
2016 Top 5 Countries LV Sales (Millions)
14 15 16F
14 15 16F
14 15 16F
14 15 16F
14 15 16F
Source: LMC Automotive
www.lmc-auto.com © 2016 LMC Automotive Limited, All Rights Reserved. 6
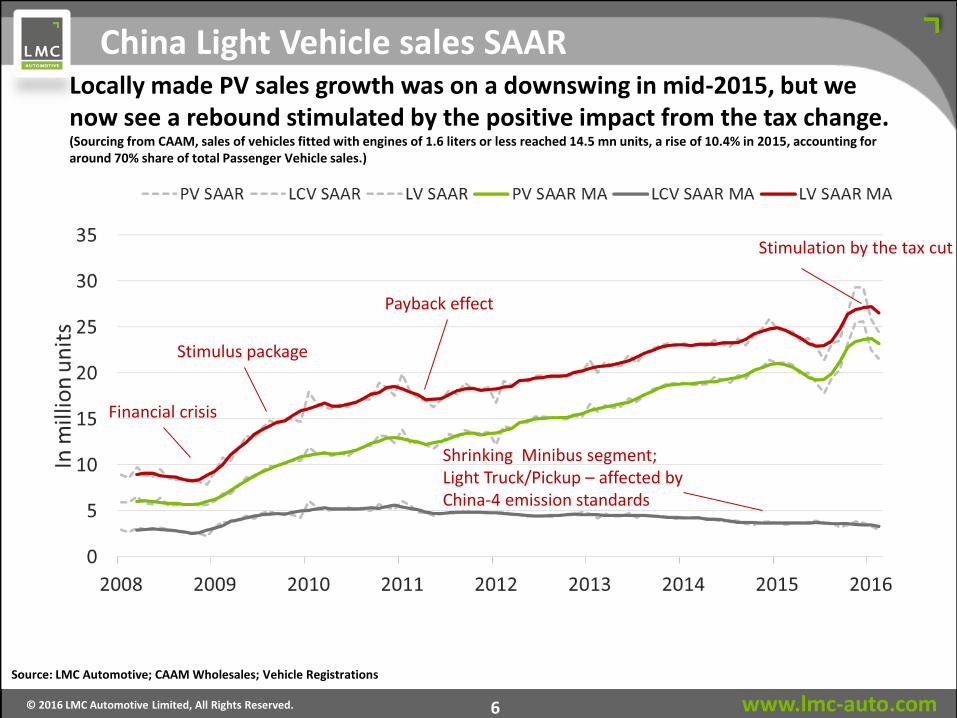
Source: LMC Automotive; CAAM Wholesales; Vehicle Registrations
Financial crisis
Stimulus package
Payback effect
China Light Vehicle sales SAAR
Shrinking Minibus segment; Light Truck/Pickup – affected by China-4 emission standards
Stimulation by the tax cut
Locally made PV sales growth was on a downswing in mid-2015, but we now see a rebound stimulated by the positive impact from the tax change. (Sourcing from CAAM, sales of vehicles fitted with engines of 1.6 liters or less reached 14.5 mn units, a rise of 10.4% in 2015, accounting for around 70% share of total Passenger Vehicle sales.)
www.lmc-auto.com © 2016 LMC Automotive Limited, All Rights Reserved. 7
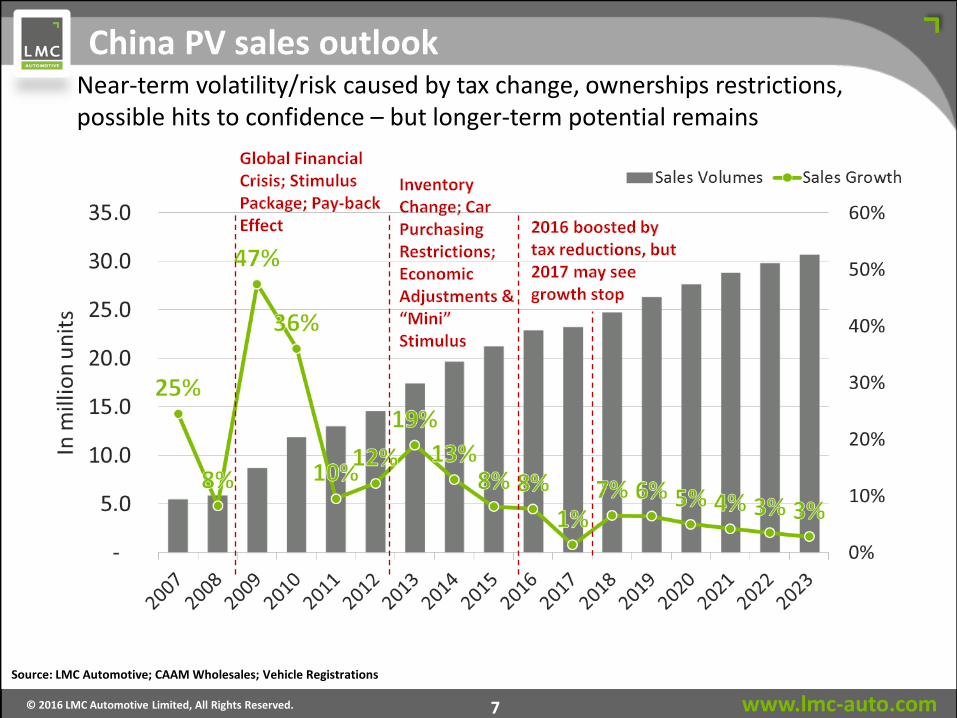
China PV sales outlook Near-term volatility/risk caused by tax change, ownerships restrictions, possible hits to confidence – but longer-term potential remains
Source: LMC Automotive; CAAM Wholesales; Vehicle Registrations
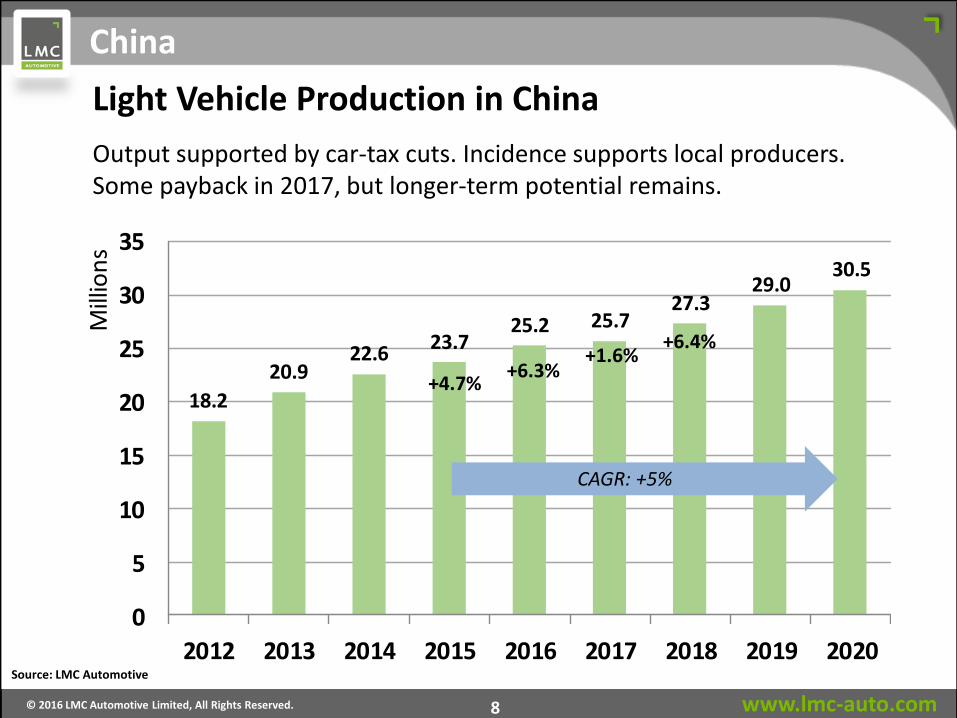
www.lmc-auto.com © 2016 LMC Automotive Limited, All Rights Reserved. 8
Light Vehicle Production in China
18.2
20.922.6
23.725.2 25.7
27.329.0
30.5
0
5
10
15
20
25
30
35
2012 2013 2014 2015 2016 2017 2018 2019 2020
Mill
ion
s
+4.7%
Output supported by car-tax cuts. Incidence supports local producers. Some payback in 2017, but longer-term potential remains.
Source: LMC Automotive
+6.3% +1.6%
China
CAGR: +5%
+6.4%
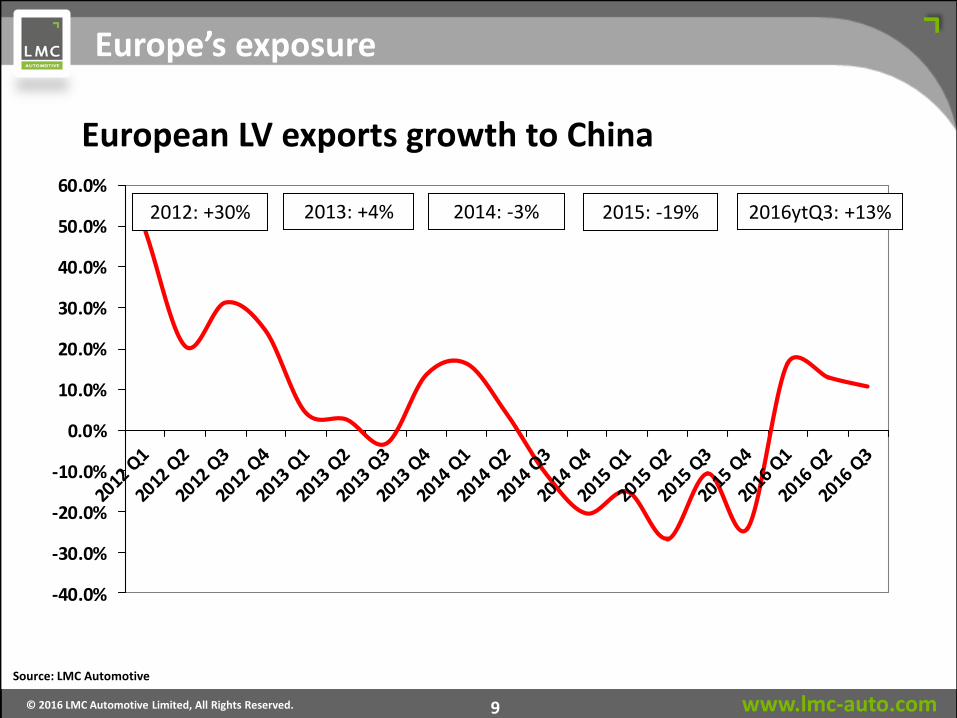
www.lmc-auto.com © 2016 LMC Automotive Limited, All Rights Reserved. 9
European LV exports growth to China
-40.0%
-30.0%
-20.0%
-10.0%
0.0%
10.0%
20.0%
30.0%
40.0%
50.0%
60.0%
2013: +4% 2014: -3% 2015: -19% 2012: +30%
Source: LMC Automotive
2016ytQ3: +13%
Europe’s exposure
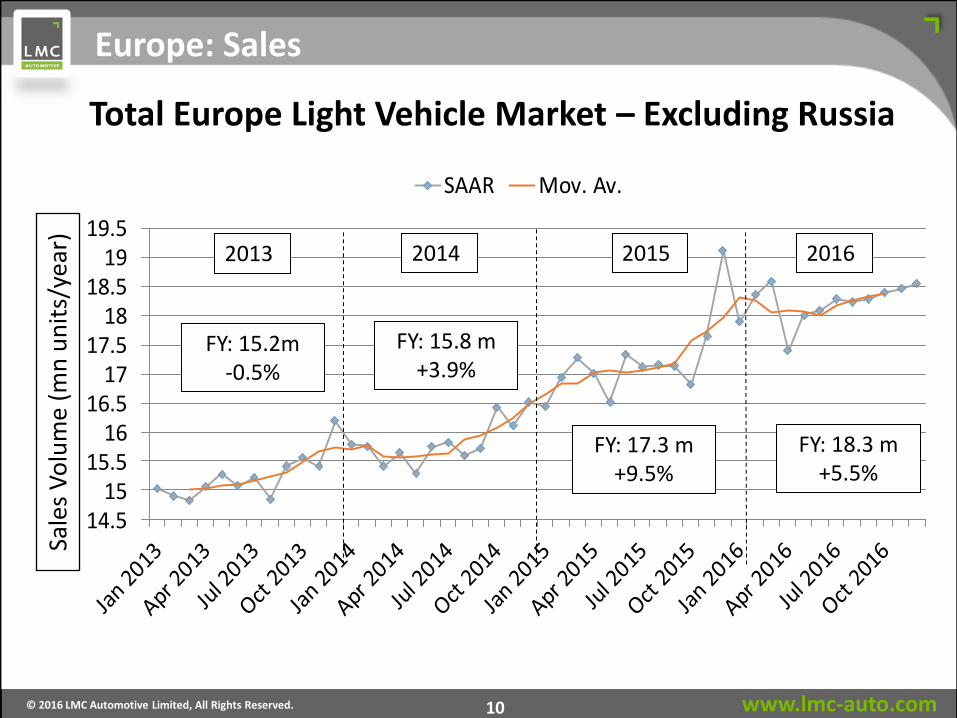
www.lmc-auto.com © 2016 LMC Automotive Limited, All Rights Reserved. 10
14.515
15.516
16.517
17.518
18.519
19.5
SAAR Mov. Av.
Sale
s V
olu
me
(mn
un
its/
year
)
2013 2014 2015
Europe: Sales
2016
FY: 15.2m -0.5%
FY: 15.8 m +3.9%
FY: 17.3 m +9.5%
FY: 18.3 m +5.5%
Total Europe Light Vehicle Market – Excluding Russia
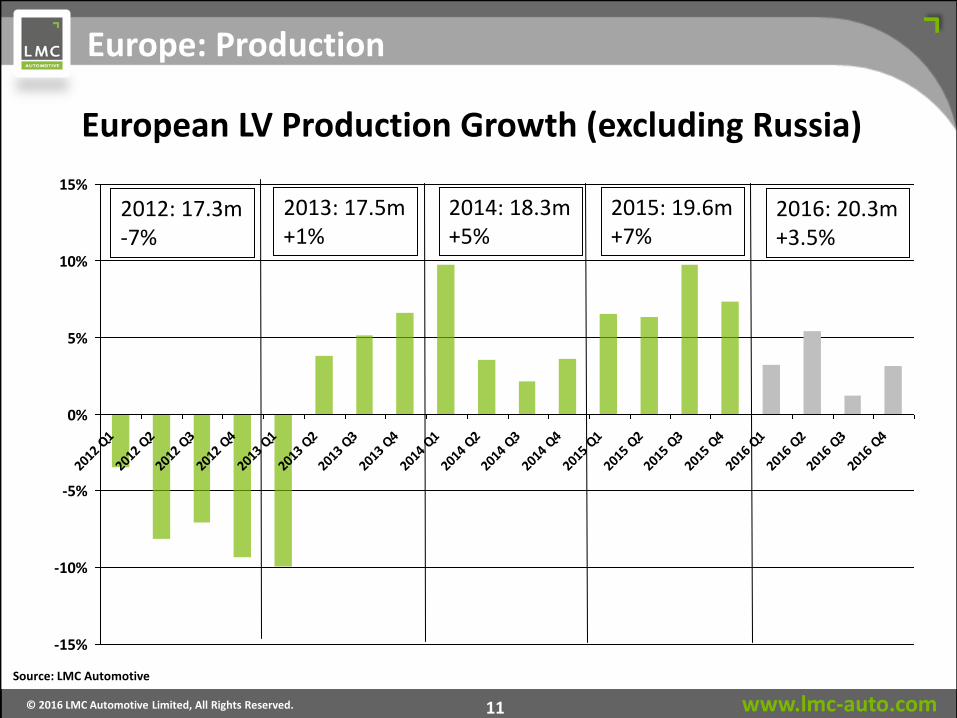
www.lmc-auto.com © 2016 LMC Automotive Limited, All Rights Reserved. 11
-15%
-10%
-5%
0%
5%
10%
15%
2012 Q1
2012 Q2
2012 Q3
2012 Q4
2013 Q1
2013 Q2
2013 Q3
2013 Q4
2014 Q1
2014 Q2
2014 Q3
2014 Q4
2015 Q1
2015 Q2
2015 Q3
2015 Q4
2016 Q1
2016 Q2
2016 Q3
2016 Q4
European LV Production Growth (excluding Russia)
2013: 17.5m +1%
2014: 18.3m +5%
2015: 19.6m +7%
2012: 17.3m -7%
Source: LMC Automotive
2016: 20.3m +3.5%
Europe: Production
www.lmc-auto.com © 2016 LMC Automotive Limited, All Rights Reserved. 12
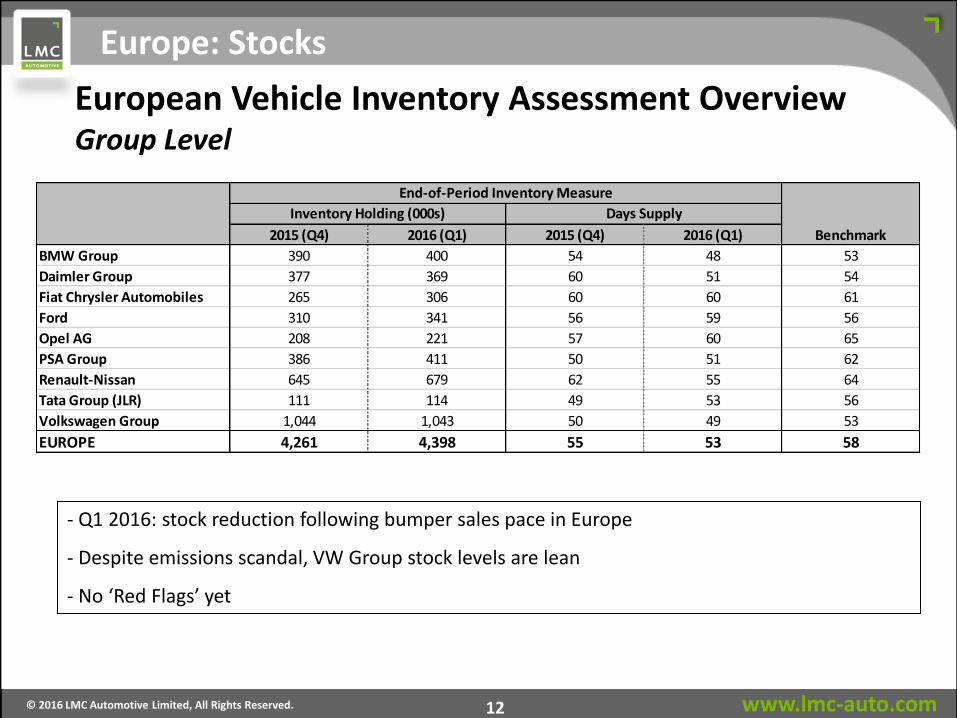
- Q1 2016: stock reduction following bumper sales pace in Europe
- Despite emissions scandal, VW Group stock levels are lean
- No ‘Red Flags’ yet
European Vehicle Inventory Assessment Overview Group Level
2015 (Q4) 2016 (Q1) 2015 (Q4) 2016 (Q1) Benchmark
BMW Group 390 400 54 48 53
Daimler Group 377 369 60 51 54
Fiat Chrysler Automobiles 265 306 60 60 61
Ford 310 341 56 59 56
Opel AG 208 221 57 60 65
PSA Group 386 411 50 51 62
Renault-Nissan 645 679 62 55 64
Tata Group (JLR) 111 114 49 53 56
Volkswagen Group 1,044 1,043 50 49 53
EUROPE 4,261 4,398 55 53 58
Days SupplyInventory Holding (000s)
End-of-Period Inventory Measure
Europe: Stocks
www.lmc-auto.com © 2016 LMC Automotive Limited, All Rights Reserved. 13
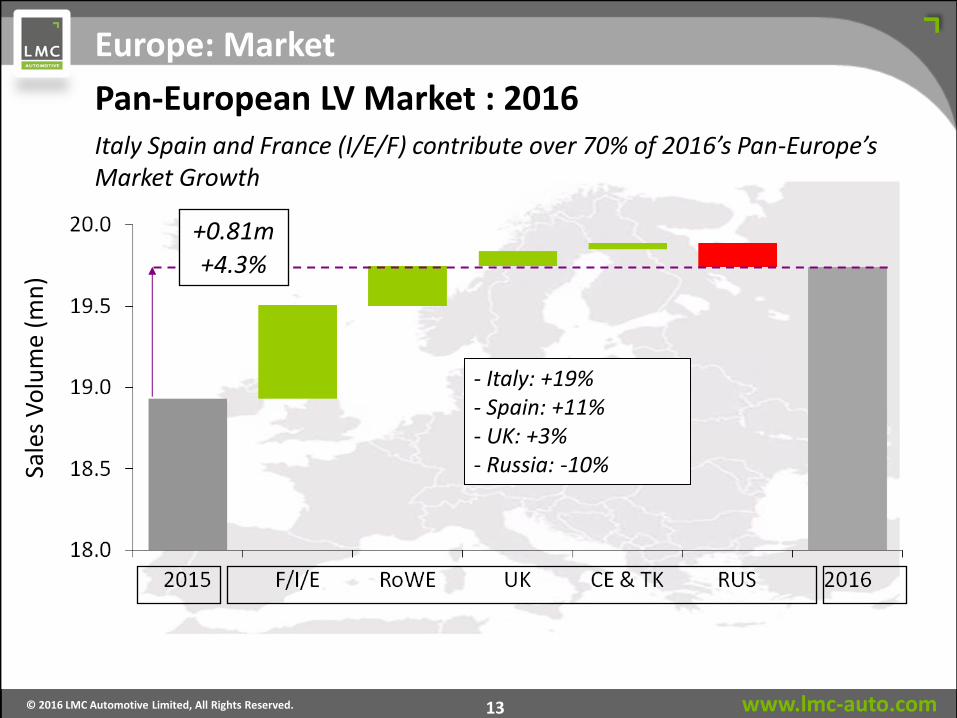
Italy Spain and France (I/E/F) contribute over 70% of 2016’s Pan-Europe’s Market Growth
Sale
s V
olu
me
(mn
)
+0.81m
+4.3%
- Italy: +19% - Spain: +11% - UK: +3% - Russia: -10%
Pan-European LV Market : 2016
Europe: Market
www.lmc-auto.com © 2016 LMC Automotive Limited, All Rights Reserved. 14
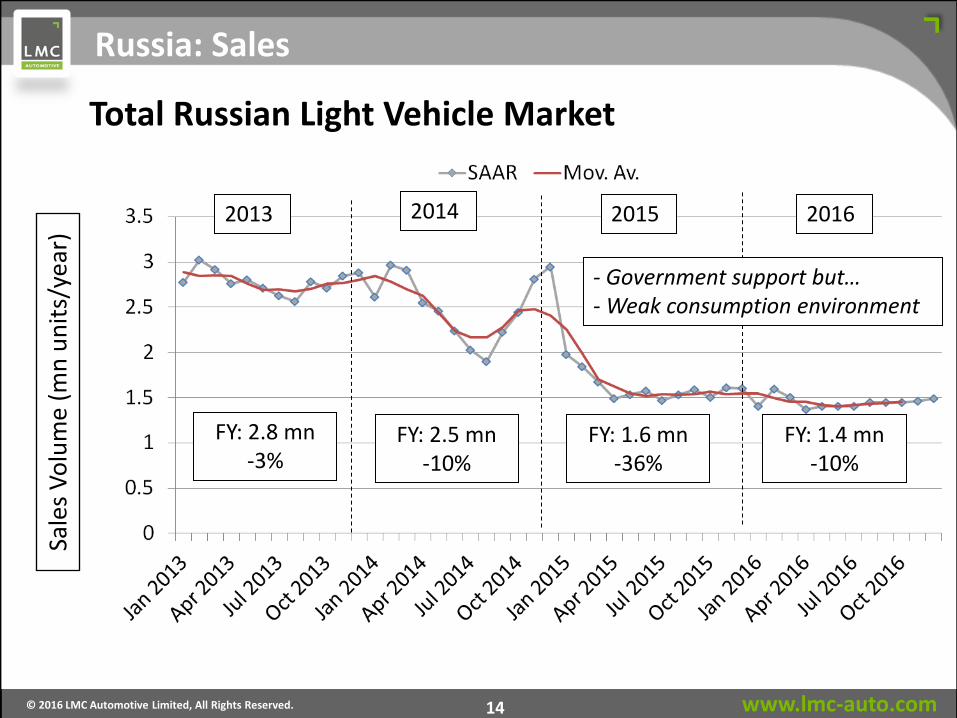
FY: 2.5 mn -10%
FY: 2.8 mn -3%
Sale
s V
olu
me
(mn
un
its/
year
)
2013 2014 2015
Total Russian Light Vehicle Market
- Government support but… - Weak consumption environment
FY: 1.6 mn -36%
2016
FY: 1.4 mn -10%
Russia: Sales
www.lmc-auto.com © 2016 LMC Automotive Limited, All Rights Reserved. 15
-40%
-30%
-20%
-10%
0%
10%
20%
30%
2012 Q1
2012 Q2
2012 Q3
2012 Q4
2013 Q1
2013 Q2
2013 Q3
2013 Q4
2014 Q1
2014 Q2
2014 Q3
2014 Q4
2015 Q1
2015 Q2
2015 Q3
2015 Q4
2016 Q1
2016 Q2
2016 Q3
2016 Q4
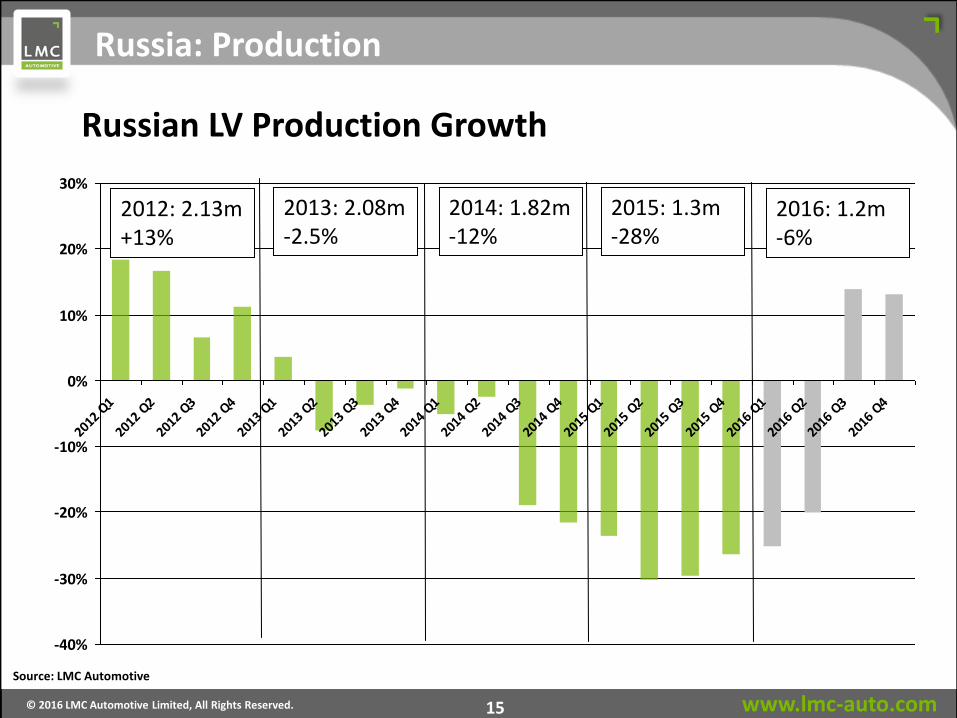
Russian LV Production Growth
2013: 2.08m -2.5%
2014: 1.82m -12%
2015: 1.3m -28%
2012: 2.13m +13%
Source: LMC Automotive
2016: 1.2m -6%
Russia: Production
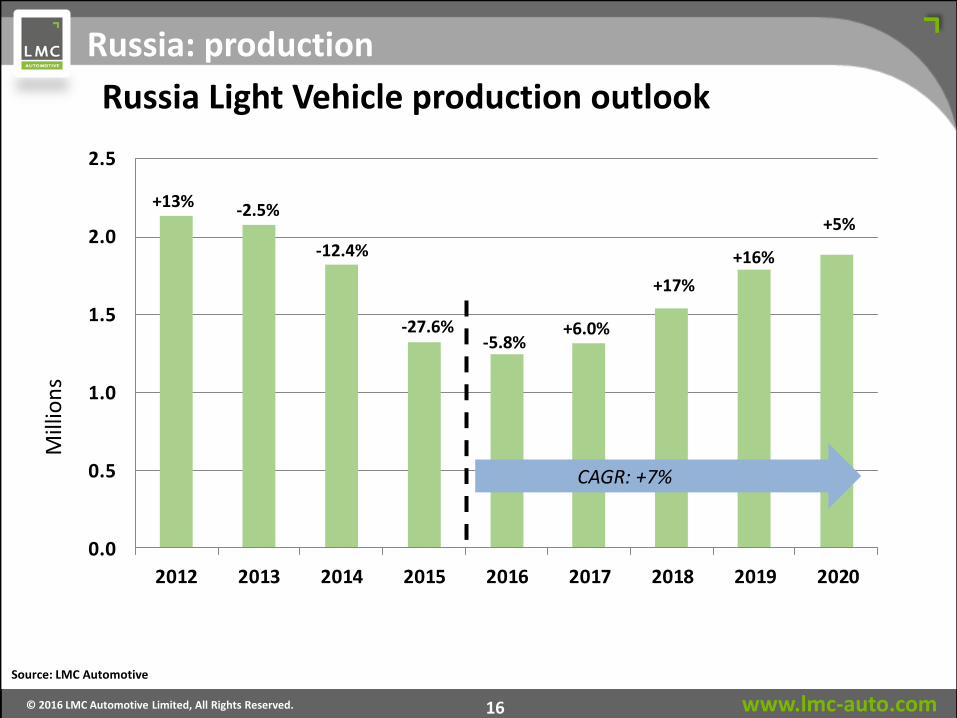
www.lmc-auto.com © 2016 LMC Automotive Limited, All Rights Reserved. 16
0.0
0.5
1.0
1.5
2.0
2.5
2012 2013 2014 2015 2016 2017 2018 2019 2020
Mill
ion
s
+13% -2.5%
-12.4%
-27.6% -5.8%
+6.0%
+17%
+16%
+5%
Russia Light Vehicle production outlook
CAGR: +7%
Source: LMC Automotive
Russia: production
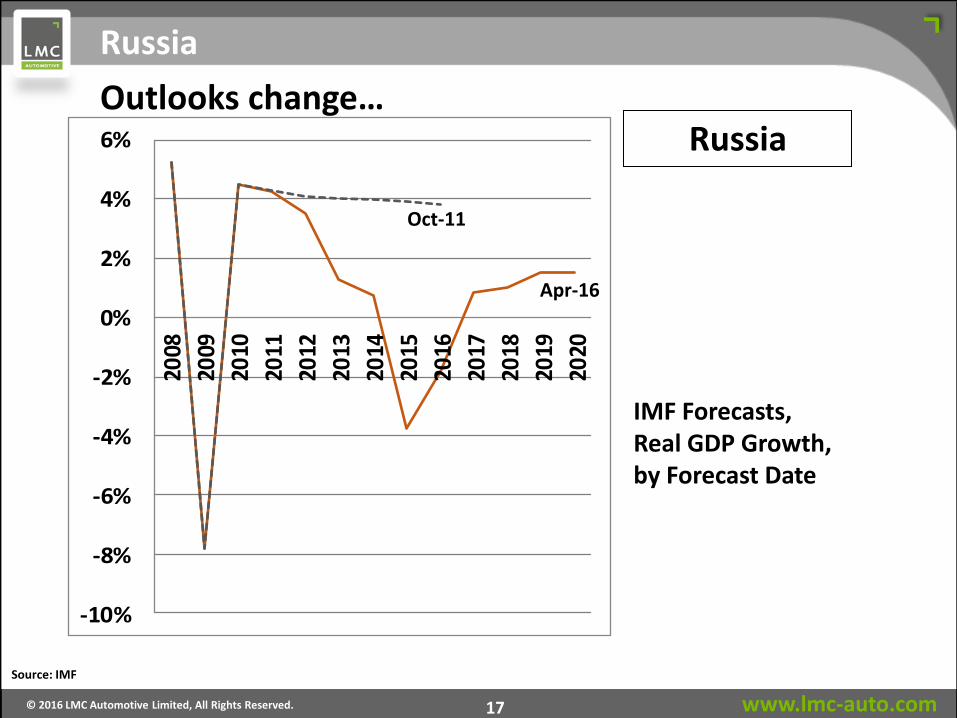
www.lmc-auto.com © 2016 LMC Automotive Limited, All Rights Reserved. 17
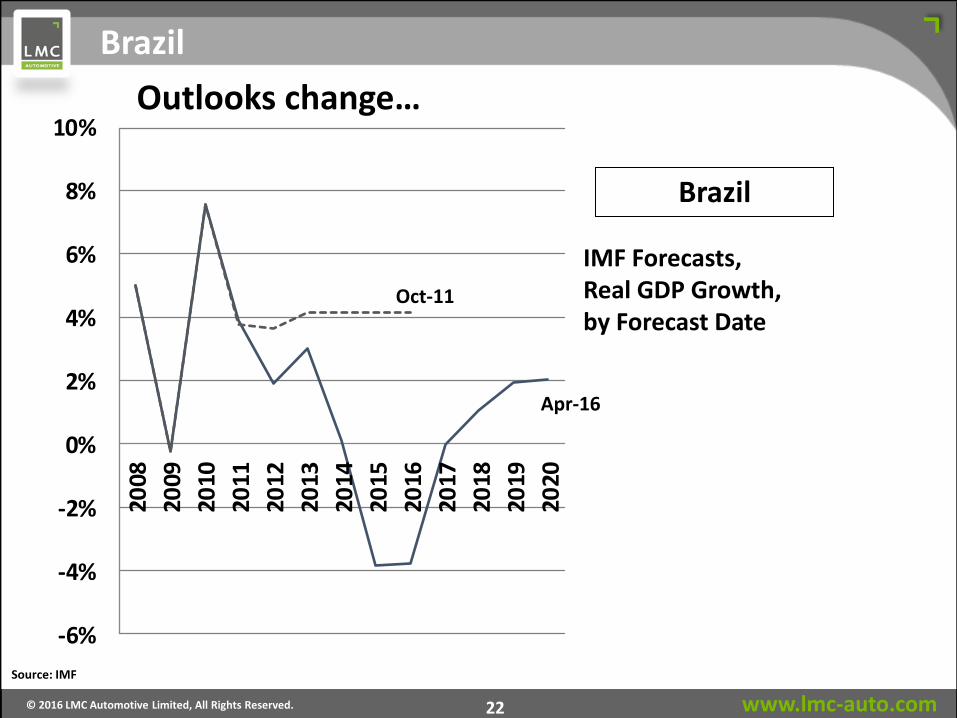
Russia
Source: IMF
IMF Forecasts, Real GDP Growth, by Forecast Date
-10%
-8%
-6%
-4%
-2%
0%
2%
4%
6%
2008
2009
2010
2011
2012
2013
2014
2015
2016
2017
2018
2019
2020
Russia
Oct-11
Apr-16
Outlooks change…
www.lmc-auto.com © 2016 LMC Automotive Limited, All Rights Reserved. 18
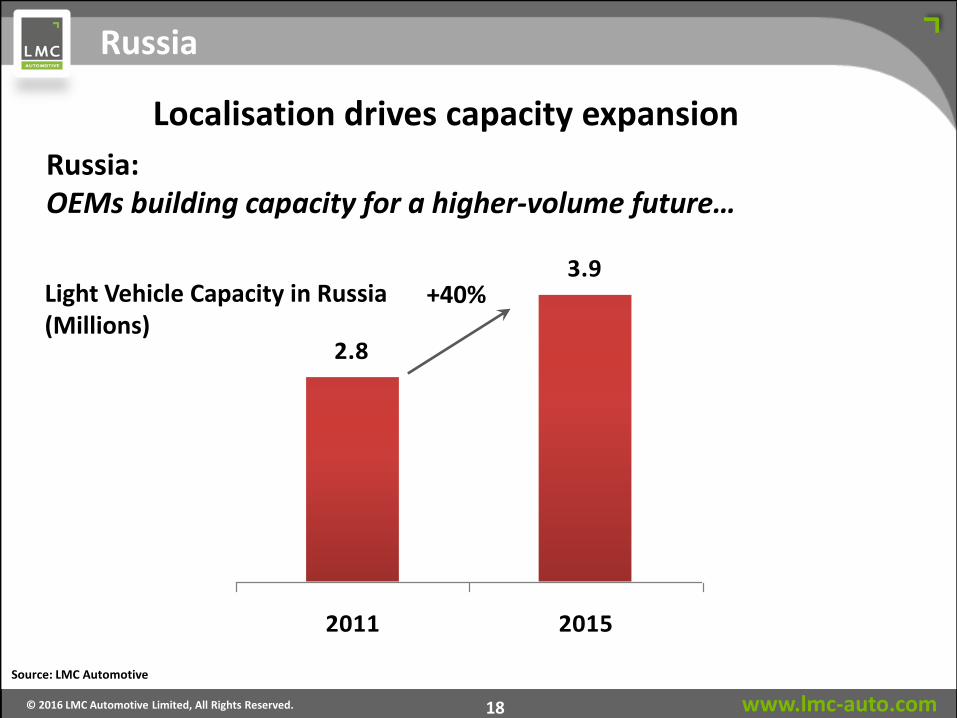
2.8
3.9
2011 2015
Russia
Source: LMC Automotive
Light Vehicle Capacity in Russia (Millions)
+40%
Russia: OEMs building capacity for a higher-volume future…
Russia Localisation drives capacity expansion
www.lmc-auto.com © 2016 LMC Automotive Limited, All Rights Reserved. 19
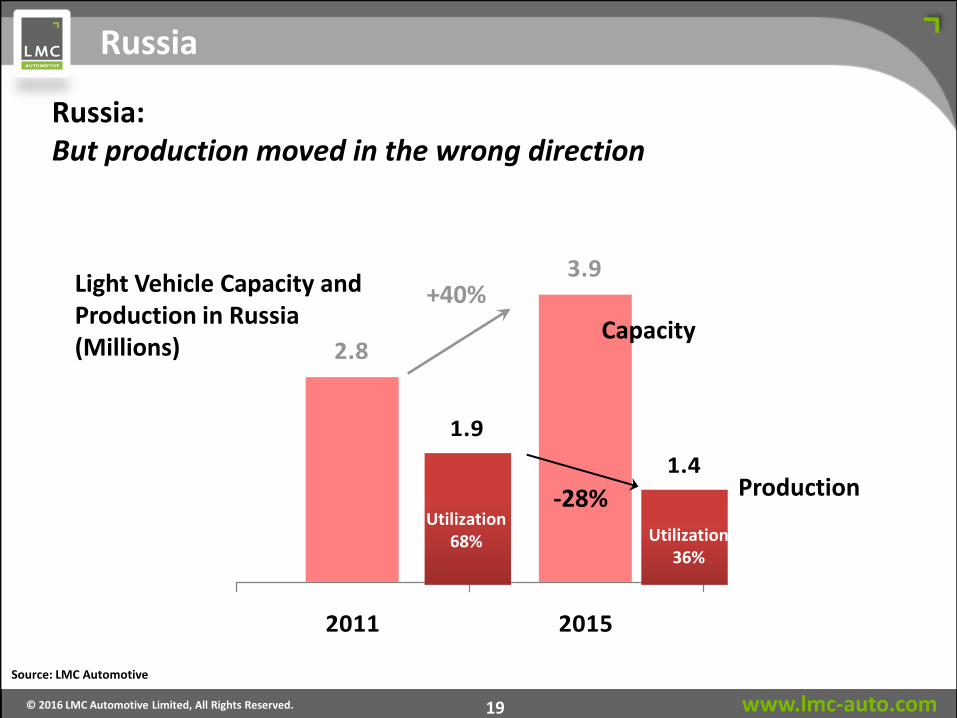
2.8
3.9
2011 2015
1.9
1.4
2011 2015
Source: LMC Automotive
Light Vehicle Capacity and Production in Russia (Millions)
+40%
-28% Utilization
68% Utilization 36%
Capacity
Production
Russia: But production moved in the wrong direction
Russia
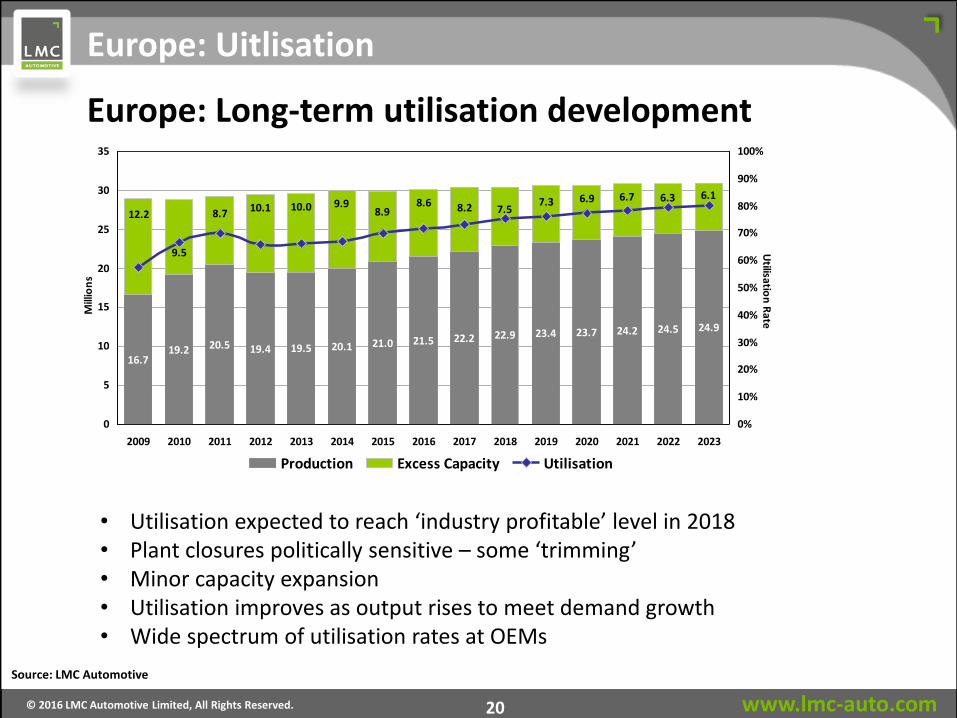
www.lmc-auto.com © 2016 LMC Automotive Limited, All Rights Reserved. 20
Europe: Long-term utilisation development
Source: LMC Automotive
Europe: Uitlisation
16.719.2 20.5 19.4 19.5 20.1 21.0 21.5 22.2 22.9 23.4 23.7 24.2 24.5 24.9
10.1 10.0 9.96.7 6.16.36.97.3
7.58.9 8.28.68.7
9.5
12.2
0
5
10
15
20
25
30
35
2009 2010 2011 2012 2013 2014 2015 2016 2017 2018 2019 2020 2021 2022 2023
Mill
ion
s
0%
10%
20%
30%
40%
50%
60%
70%
80%
90%
100%
Utilisatio
n R
ate
Production Excess Capacity Utilisation
• Utilisation expected to reach ‘industry profitable’ level in 2018 • Plant closures politically sensitive – some ‘trimming’ • Minor capacity expansion • Utilisation improves as output rises to meet demand growth • Wide spectrum of utilisation rates at OEMs
www.lmc-auto.com © 2016 LMC Automotive Limited, All Rights Reserved. 21
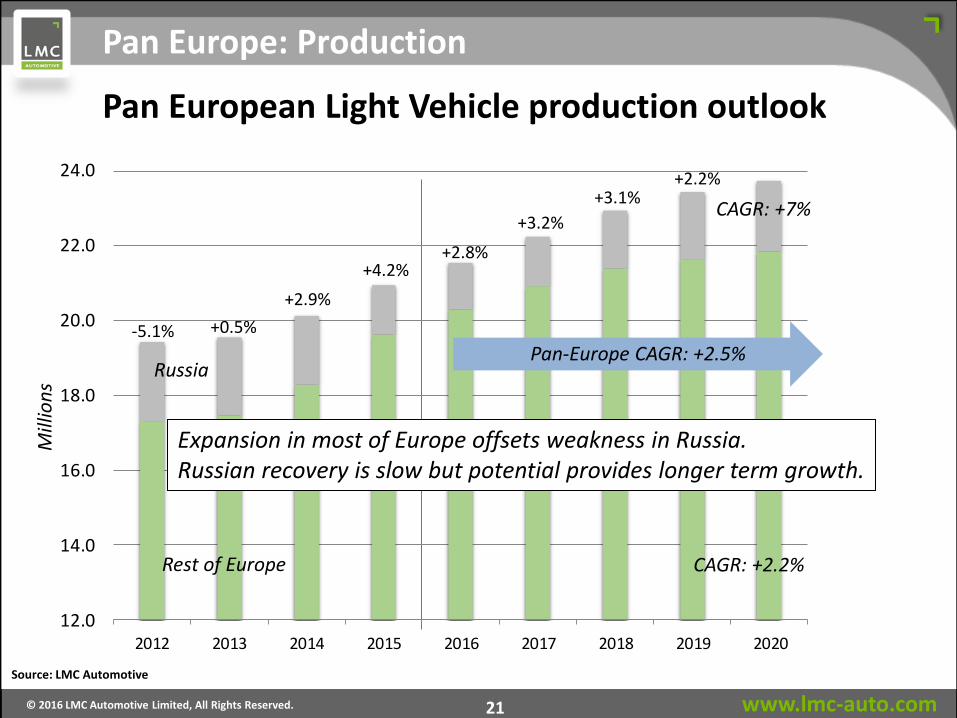
12.0
14.0
16.0
18.0
20.0
22.0
24.0
2012 2013 2014 2015 2016 2017 2018 2019 2020
Mill
ion
sM
illio
ns
-5.1% +0.5%
+2.9%
+4.2% +2.8%
+3.2%
+3.1%
Pan European Light Vehicle production outlook
Pan-Europe CAGR: +2.5%
Expansion in most of Europe offsets weakness in Russia. Russian recovery is slow but potential provides longer term growth.
Source: LMC Automotive
+2.2%
CAGR: +7%
Russia
Rest of Europe CAGR: +2.2%
Pan Europe: Production
www.lmc-auto.com © 2016 LMC Automotive Limited, All Rights Reserved. 22
Brazil
Source: IMF
-6%
-4%
-2%
0%
2%
4%
6%
8%
10%20
08
2009
2010
2011
2012
2013
2014
2015
2016
2017
2018
2019
2020
IMF Forecasts, Real GDP Growth, by Forecast Date
Brazil
Oct-11
Apr-16
Outlooks change…
www.lmc-auto.com © 2016 LMC Automotive Limited, All Rights Reserved. 23
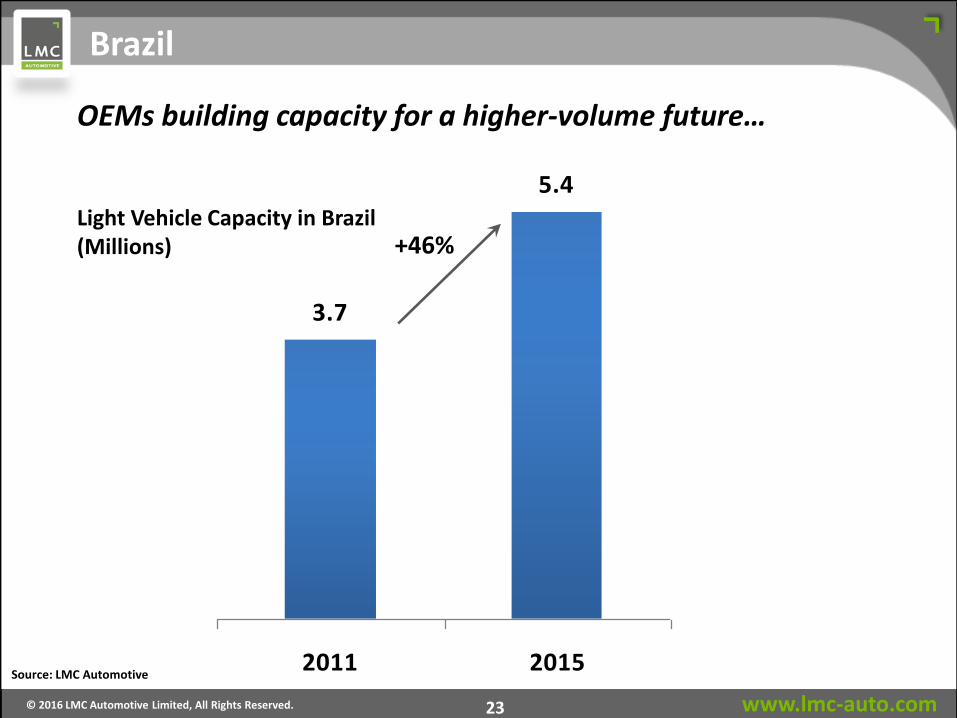
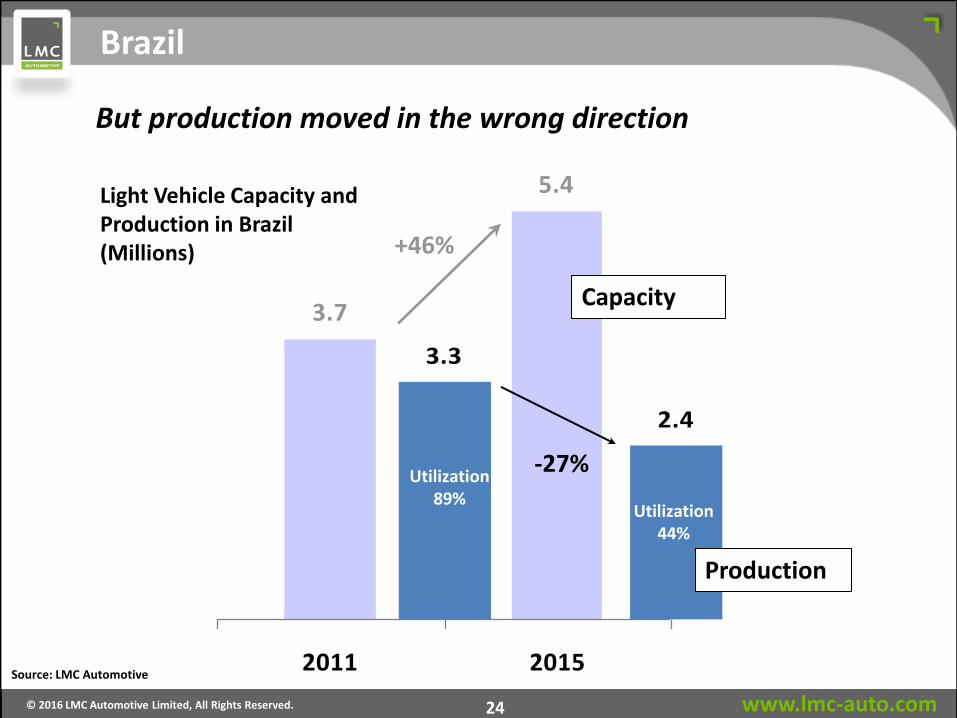
3.7
5.4
2011 2015
Brazil
Source: LMC Automotive
Light Vehicle Capacity in Brazil (Millions) +46%
OEMs building capacity for a higher-volume future…
www.lmc-auto.com © 2016 LMC Automotive Limited, All Rights Reserved. 24
3.7
5.4
2011 2015
3.3
2.4
2011 2015
Brazil
Source: LMC Automotive
Light Vehicle Capacity and Production in Brazil (Millions) +46%
Utilization 89%
Utilization 44%
-27%
But production moved in the wrong direction
Capacity
Production

www.lmc-auto.com © 2016 LMC Automotive Limited, All Rights Reserved. 25
Investment curtailed but not stopped
2015 2016 2017
Daimler Iracemápolis, Q1 2016 $600 million
Land Rover Itatiaia, Q3 2016 $375 million
Volkswagen & Audi São José dos Pinhais, Q3 2015 $470 million
Fiat Goiana, Q3 2015 $1.8 billion
Fiat Cordoba, Q3 2017 $500 million
JAC Motors Camaçari, Q2 2017 $400 million
Volare Sao Mateus, Q2 2016 $180 million
Honda Itirapina, Q2 2017 $450 million
Chery Jacareí, Q3 2016 $400 million
On track to be
completed in 2016
JAC is facing several difficulties,
future of the plant is uncertain,
date is speculative.
Recently announced
investment to the plant.
Plant opening has been delayed
due to bleak economic
environment in Brazil.
Toyota Sorocaba, Q3 2016 $100 million – expansion for new Etios
Source: LMC Automotive
www.lmc-auto.com © 2016 LMC Automotive Limited, All Rights Reserved. 26
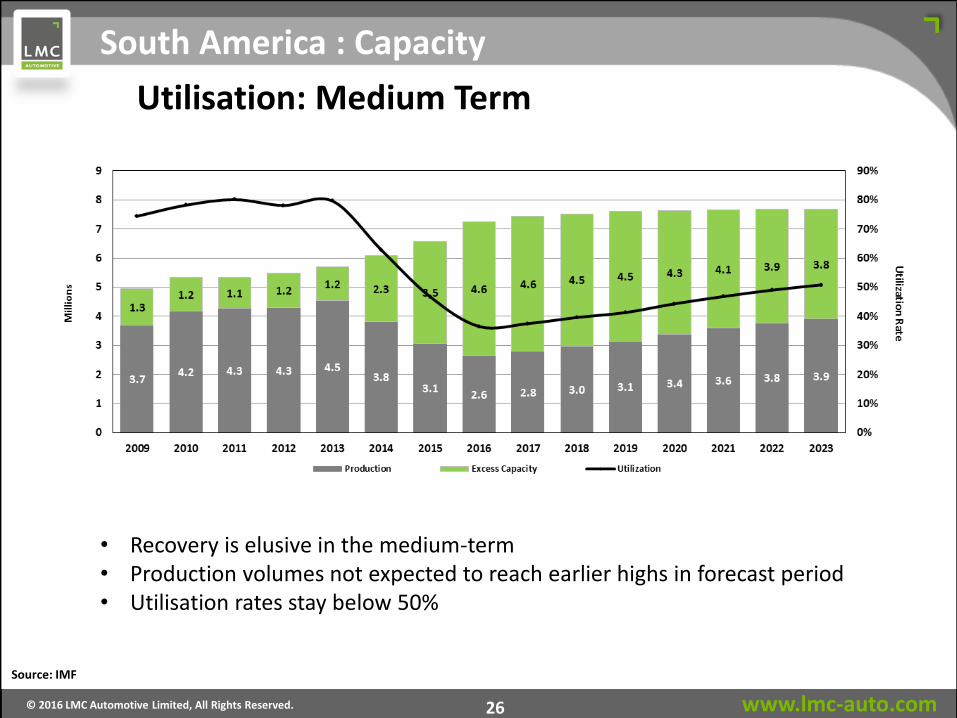
South America : Capacity
Source: IMF
Utilisation: Medium Term
• Recovery is elusive in the medium-term • Production volumes not expected to reach earlier highs in forecast period • Utilisation rates stay below 50%
www.lmc-auto.com © 2016 LMC Automotive Limited, All Rights Reserved. 27
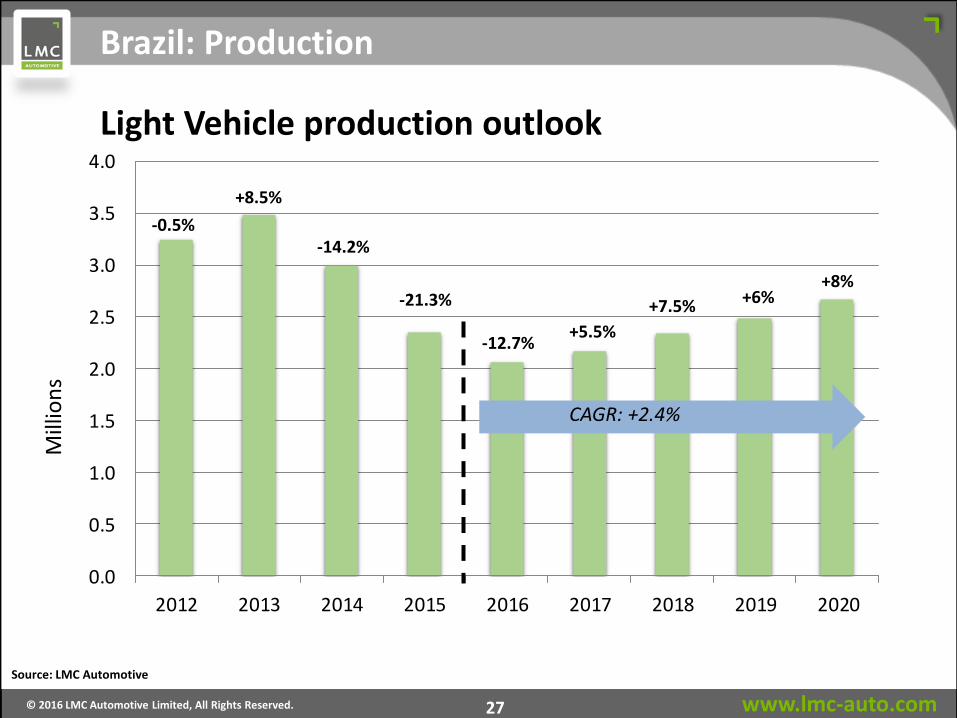
0.0
0.5
1.0
1.5
2.0
2.5
3.0
3.5
4.0
2012 2013 2014 2015 2016 2017 2018 2019 2020
Mill
ion
s
-0.5%
+8.5%
-14.2%
-21.3%
-12.7% +5.5%
+7.5% +6% +8%
Brazil: Production
CAGR: +2.4%
Source: LMC Automotive
Light Vehicle production outlook
www.lmc-auto.com © 2016 LMC Automotive Limited, All Rights Reserved. 28
17.4
12.0
13.0
14.0
15.0
16.0
17.0
18.0
19.0
Mil
lio
ns
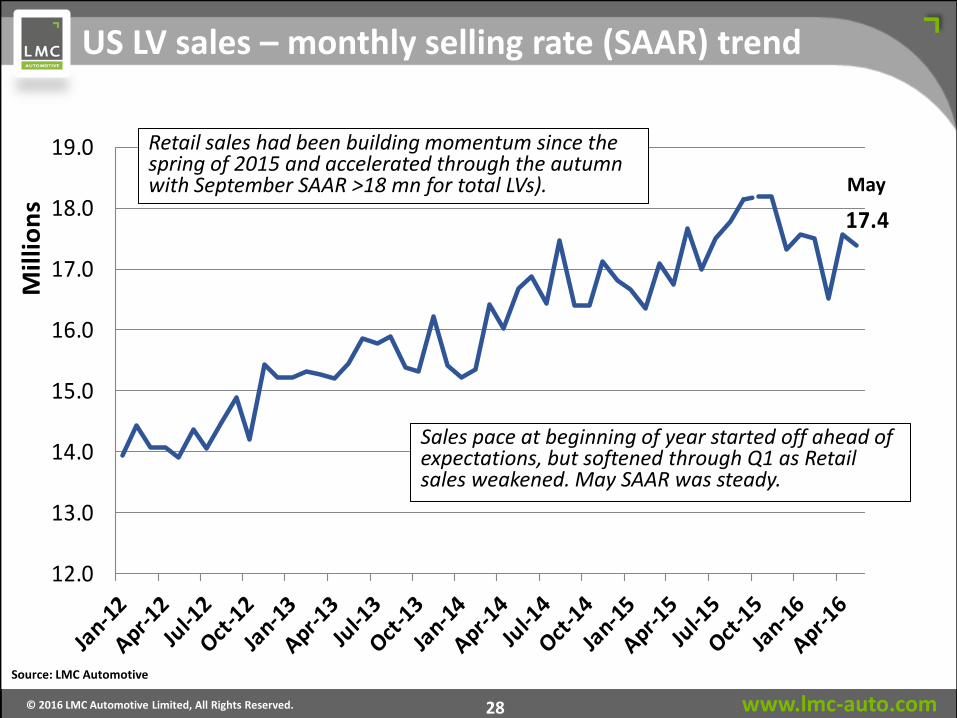
US LV sales – monthly selling rate (SAAR) trend
May
Sales pace at beginning of year started off ahead of expectations, but softened through Q1 as Retail sales weakened. May SAAR was steady.
Source: LMC Automotive
Retail sales had been building momentum since the spring of 2015 and accelerated through the autumn with September SAAR >18 mn for total LVs).
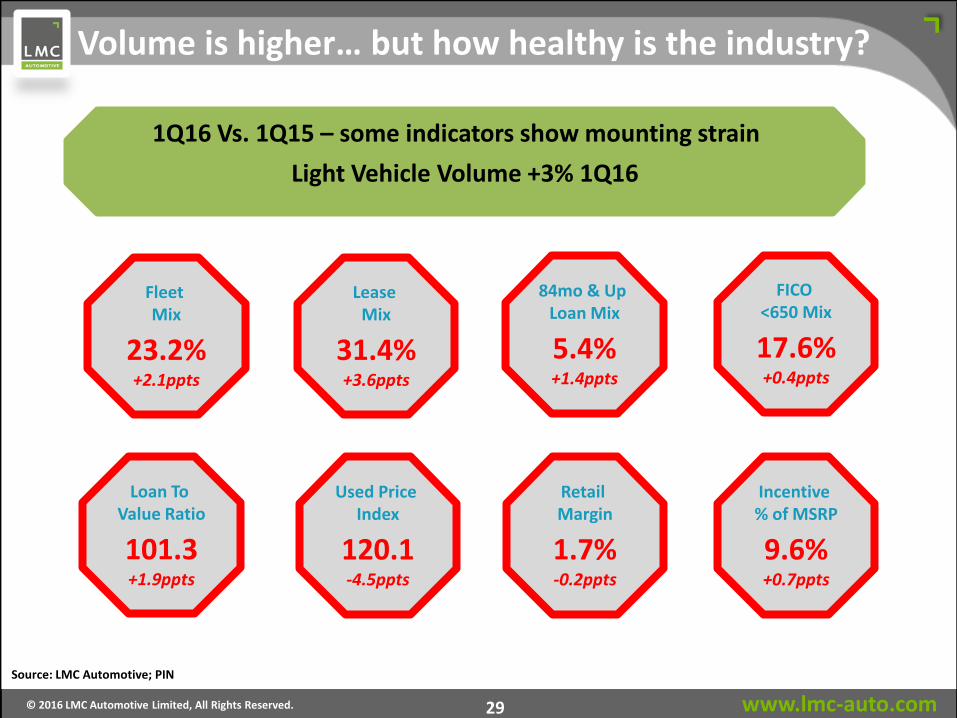
www.lmc-auto.com © 2016 LMC Automotive Limited, All Rights Reserved. 29
FICO <650 Mix
17.6% +0.4ppts
84mo & Up Loan Mix
5.4% +1.4ppts
Incentive % of MSRP
9.6% +0.7ppts
Retail Margin
1.7% -0.2ppts
Used Price Index
120.1 -4.5ppts
Loan To Value Ratio
101.3 +1.9ppts
Light Vehicle Volume +3% 1Q16
Fleet Mix
23.2% +2.1ppts
Volume is higher… but how healthy is the industry?
1Q16 Vs. 1Q15 – some indicators show mounting strain
Lease Mix
31.4% +3.6ppts
Source: LMC Automotive; PIN
www.lmc-auto.com © 2016 LMC Automotive Limited, All Rights Reserved. 30
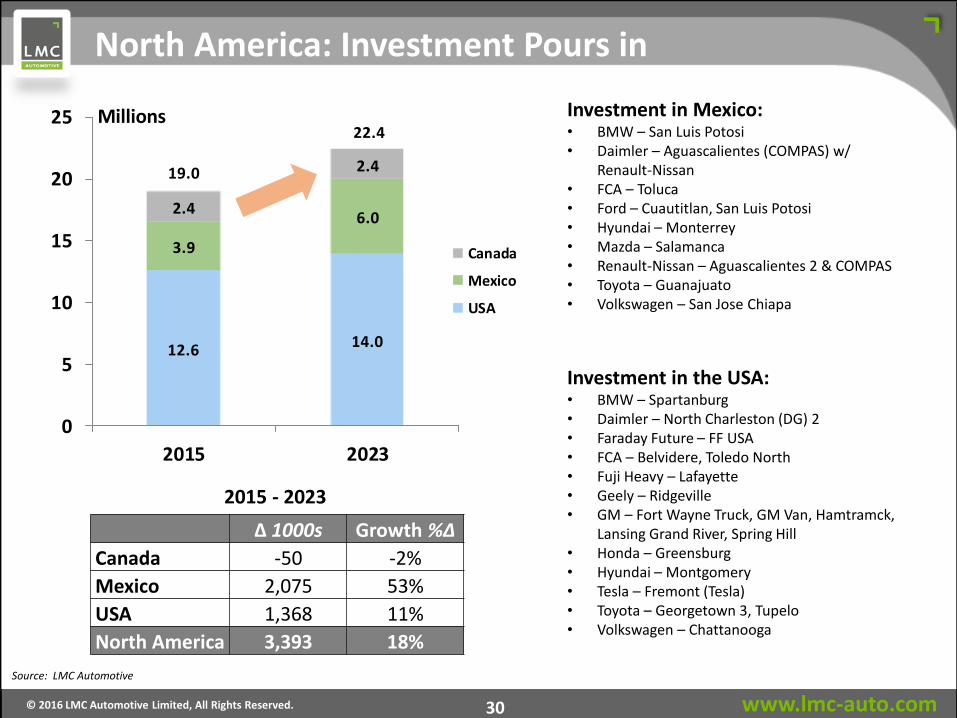
North America: Investment Pours in
2015 - 2023
Investment in Mexico: • BMW – San Luis Potosi • Daimler – Aguascalientes (COMPAS) w/
Renault-Nissan • FCA – Toluca • Ford – Cuautitlan, San Luis Potosi • Hyundai – Monterrey • Mazda – Salamanca • Renault-Nissan – Aguascalientes 2 & COMPAS • Toyota – Guanajuato • Volkswagen – San Jose Chiapa
Investment in the USA: • BMW – Spartanburg • Daimler – North Charleston (DG) 2 • Faraday Future – FF USA • FCA – Belvidere, Toledo North • Fuji Heavy – Lafayette • Geely – Ridgeville • GM – Fort Wayne Truck, GM Van, Hamtramck,
Lansing Grand River, Spring Hill • Honda – Greensburg • Hyundai – Montgomery • Tesla – Fremont (Tesla) • Toyota – Georgetown 3, Tupelo • Volkswagen – Chattanooga
Source: LMC Automotive
12.6 14.0
3.9
6.02.4
2.419.0
22.4
0
5
10
15
20
25
2015 2023
Canada
Mexico
USA
Millions
Δ 1000s Growth %Δ
Canada -50 -2%
Mexico 2,075 53%
USA 1,368 11%
North America 3,393 18%
www.lmc-auto.com © 2016 LMC Automotive Limited, All Rights Reserved. 31
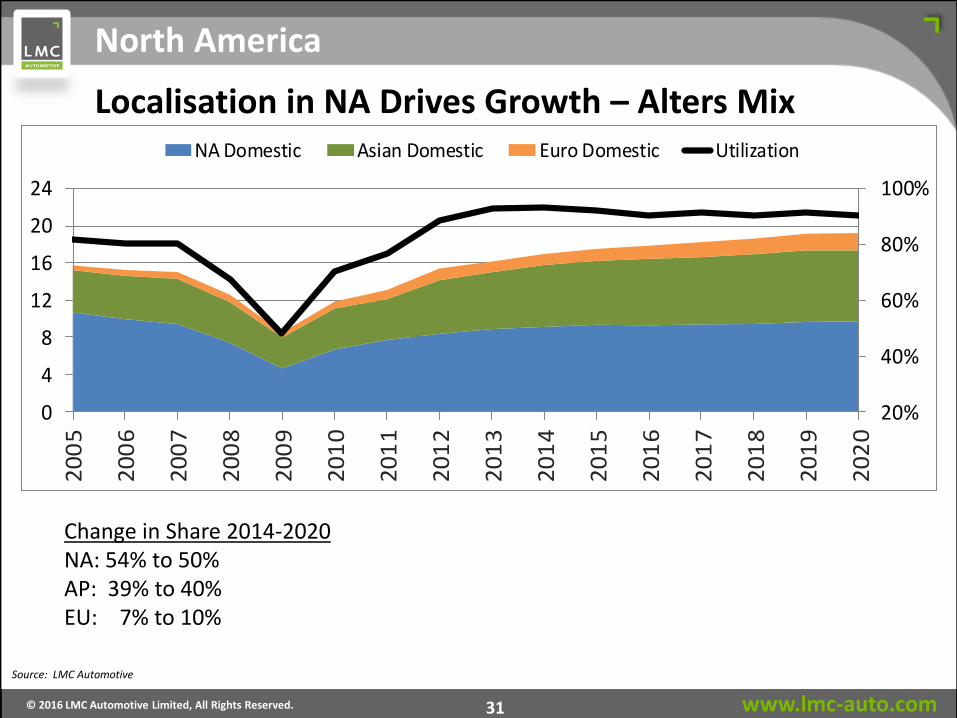
20%
40%
60%
80%
100%
0
4
8
12
16
20
24
20
05
20
06
20
07
20
08
20
09
20
10
20
11
20
12
20
13
20
14
20
15
20
16
20
17
20
18
20
19
20
20
NA Domestic Asian Domestic Euro Domestic Utilization
North America
Source: LMC Automotive
Change in Share 2014-2020 NA: 54% to 50% AP: 39% to 40% EU: 7% to 10%
Localisation in NA Drives Growth – Alters Mix
www.lmc-auto.com © 2016 LMC Automotive Limited, All Rights Reserved. 32
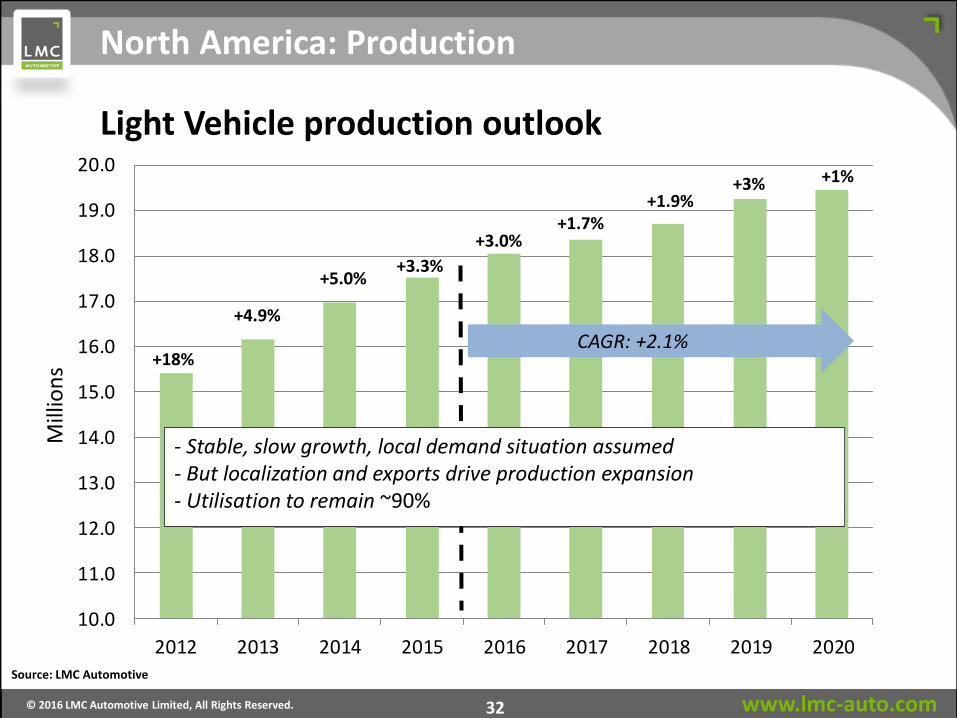
10.0
11.0
12.0
13.0
14.0
15.0
16.0
17.0
18.0
19.0
20.0
2012 2013 2014 2015 2016 2017 2018 2019 2020
Mill
ion
s +18%
+4.9%
+5.0% +3.3%
+3.0% +1.7%
+1.9% +3% +1%
North America: Production
CAGR: +2.1%
Source: LMC Automotive
Light Vehicle production outlook
- Stable, slow growth, local demand situation assumed - But localization and exports drive production expansion - Utilisation to remain ~90%
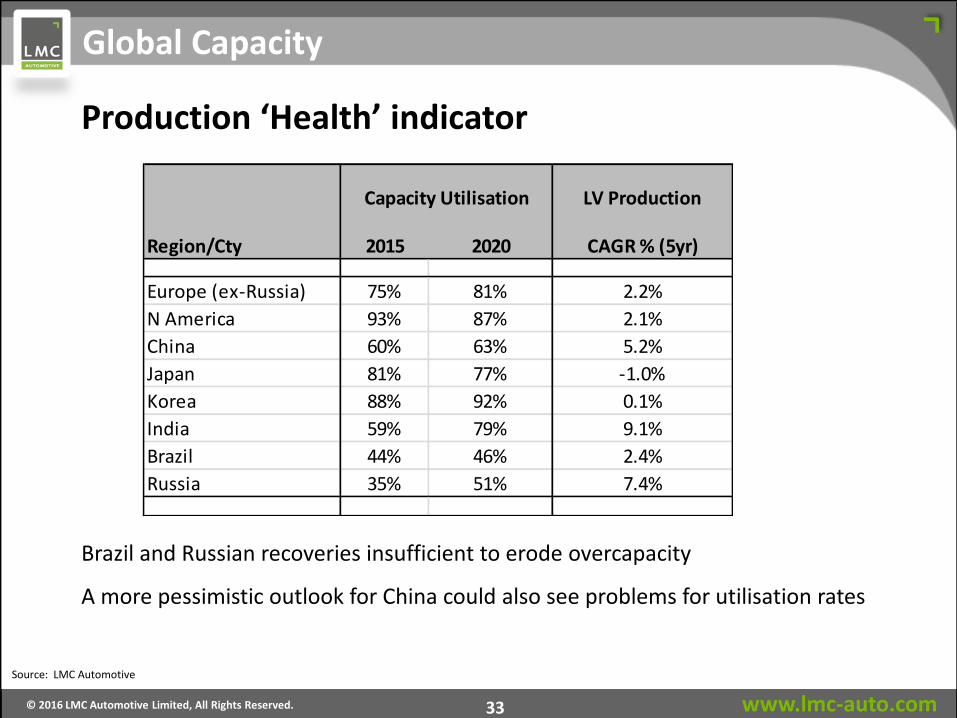
www.lmc-auto.com © 2016 LMC Automotive Limited, All Rights Reserved. 33
Production ‘Health’ indicator
Global Capacity
Brazil and Russian recoveries insufficient to erode overcapacity
A more pessimistic outlook for China could also see problems for utilisation rates
Source: LMC Automotive
LV Production
Region/Cty 2015 2020 CAGR % (5yr)
Europe (ex-Russia) 75% 81% 2.2%
N America 93% 87% 2.1%
China 60% 63% 5.2%
Japan 81% 77% -1.0%
Korea 88% 92% 0.1%
India 59% 79% 9.1%
Brazil 44% 46% 2.4%
Russia 35% 51% 7.4%
Capacity Utilisation
www.lmc-auto.com © 2016 LMC Automotive Limited, All Rights Reserved. 34
Concluding remarks
• Simultaneous Regional growth remains elusive
• Emerging market stumble, leaving unfulfilled ‘promises’
• Mature markets provide some balance
• Utilisation still remains a problem for some and a potential risk ‘amber’ flag for others
• Global production growth outlook to lean on China. Again.