automation of the best practices used to evaluate 802.11
TRANSCRIPT

© 2017 SCTE-ISBE and NCTA. All rights reserved.
Automation of the Best Practices used to Evaluate 802.11 Access Network
A Technical Paper prepared for SCTE/ISBE by
David Brownell, Shaw Communications
Salman Naqvi, Shaw Communications
© 2017 SCTE-ISBE and NCTA. All rights reserved. 2
Table of Contents Title Page Number Introduction ________________________________________________________________________ 4
Content ___________________________________________________________________________ 5 1. SHAW COMMUNICATIONS ______________________________________________________ 5
1.1. SHAW WiFi Network ______________________________________________________ 5 1.2. WiFi Technology Roadmap _________________________________________________ 6
2. Benefit to Shaw for Test Automation ________________________________________________ 6 3. WiFi Network Requirements ______________________________________________________ 7 4. Network Test Philosophy _________________________________________________________ 8 5. Test Automation Architecture _____________________________________________________ 11
5.1. Test Setup _____________________________________________________________ 11 5.1.1. 802.3 Client/Server PC ___________________________________________ 12 5.1.2. 802.11 Clients 4x Antenna ________________________________________ 12 5.1.3. IXIA IxVeriWave Chassis _________________________________________ 13 5.1.4. OTA Sniffer ____________________________________________________ 13 5.1.5. RF Interconnection and Channel Simulator ___________________________ 13 5.1.6. 802.11 Signal Generator __________________________________________ 14 5.1.7. 802.11 Signal Analyzer ___________________________________________ 15 5.1.8. Test Automation PC _____________________________________________ 15
5.2. RF Interconnection and Channel Simulator Block Diagram _______________________ 15 5.2.1. Example Test Setup for WLC AP ___________________________________ 16 5.2.2. Example Setup for Cloud Managed AP ______________________________ 17
5.3. Automation SW Architecture _______________________________________________ 19 5.4. RobotFramework________________________________________________________ 20 5.5. Python Keywords Definition _______________________________________________ 23 5.6. Test Data Record _______________________________________________________ 23 5.7. Test Data Results and Analysis ____________________________________________ 25
6. Test Measurements ____________________________________________________________ 26 6.1. RF Characterization vs Order Power vs MCS Rate _____________________________ 26 6.2. Conducted Emissions ____________________________________________________ 32 6.3. Receiver Sensitivity ______________________________________________________ 33 6.4. UDP Throughput ________________________________________________________ 34 6.5. Rate vs Range _________________________________________________________ 36 6.6. Traffic Stress Test _______________________________________________________ 40
Conclusion ________________________________________________________________________ 43
Abbreviations ______________________________________________________________________ 44
Bibliography & References ___________________________________________________________ 45
List of Figures
Title Page Number Figure 1 - WiFi Automation Hardware Setup 12
Figure 2 - IXVeriwave Chassis 13
Figure 3 - RF Interconnection Views 14
Figure 4 Signal Generator R&S SMBV100A 14
© 2017 SCTE-ISBE and NCTA. All rights reserved. 3
Figure 5 - Keysight Oscilloscope 15
Figure 6 - RF Interconnection Block Diagram 16
Figure 7 - Automation Example Test Setup for WLC AP 17
Figure 8 - Automation Example Test Setup for Cloud Based Management AP 18
Figure 9 - Automation SW Block Diagram 19
Figure 10 - RobotFramework Sequence 20
Figure 11 - RobotFramework Measurement Configuration 21
Figure 12 - RobotFramework Measurement Engine Function Call 22
Figure 13 - Python Keywords View 23
Figure 14 - Test Data Record Example 24
Figure 15 - SQL Database Example 25
Figure 16 - PHP Script and Result CSV File Example 26
Figure 17 - WaveAnalyze RF Measurement Example 27
Figure 18 - AP EVM Comparison 802.11ac MCS 9 30
Figure 19 - RF Power vs MCS Examples 31
Figure 20 - Average C/N applied to Invoke 11ac MCS Rate 31
Figure 21 - Conducted Emissions Test Result Example 33
Figure 22 - Receiver Sensitivity Example 34
Figure 23 - UDP Throughput Result Example 35
Figure 24 - Rate vs Range Hardware Test Setup 36
Figure 25 - Rate vs Range Result Example for Different Firmware 37
Figure 26 - Rate vs Range Candidate AP Comparison 39
Figure 27 - Soak Test Throughput 40
Figure 28 - Client Associations vs Time 41
Figure 29 - Soak Test Algorithm 42
List of Tables Title Page Number Table 1 - Network Performance Test Tools Used by Shaw 9
Table 2 - WiFi Transmit Test Requirements 10
Table 3 - WiFi Receive Test Coverage 10
Table 4 - WiFi Link Layer Test Coverage 11
Table 5 - MCS vs SNR Estimate 29
Table 6 - Estimation of TCP Throughput vs AMPDU 38
© 2017 SCTE-ISBE and NCTA. All rights reserved. 4
Introduction As the breadth of 802.11 standards increases to meet market demands and convergence with other technologies, the amount of capabilities provided by Customer Premise Equipment and Access Point (AP) devices is increasing dramatically. This coupled with introduction of interpretations by vendors for new and evolving standards places extreme pressure on service providers who endeavor to ensure the highest quality metrics for their network are maintained and enhanced by the new product introduction.
Typically, service providers will rely on the expertise of their engineering teams to vet the new products against the network requirements. The level of test coverage required and the turn-around time to deploy in the market bring in its challenges. Hence, automation of test coverage methodology is necessary to meet these demands.
This paper will address the implementation of the process and methodology applied in identifying the Key Performance Indicators to evaluate the 802.11 Access Network. There will be a brief account describing the test cases used and their importance to 802.11 service provider like Shaw Communications. The paper will also describe the challenges and benefits that automation brings to this subject. The test coverage will include the SW/HW tools used to test the full functionality of the network from layer 1 through 7. Based on these results the Quality Assurance (Q) engineering team at Shaw Wireless Lab can provide a set of guidelines to the deployment engineering team, for better deployment of the 802.11 Network.
© 2017 SCTE-ISBE and NCTA. All rights reserved. 5
Content
SHAW COMMUNICATIONS
1.1. SHAW WiFi Network
Shaw Communications Inc. is an enhanced connectivity provider. Our Consumer division serves consumers with broadband Internet, Shaw Go WiFi, video and digital phone. Our Wireless division provides wireless voice and data services through an expanding and improving mobile wireless network infrastructure. The Business Network Services division provides business customers with Internet, data, WiFi, telephony and video.
Shaw is traded on the Toronto and New York stock exchanges and is included in the S&P/TSX 60 Index (Symbol: TSX - SJR.B, SJR.PR.A, SJR.PR.B, NYSE – SJR, and TSXV – SJR.A). For more information, please visit www.shaw.ca. The Shaw network has a more than 80 thousand Shaw Go WiFi Hotspots across Canada. Shaw offers the following products that utilize WiFi technology:
• Shaw GO WiFi - Launched in 2012 for Shaw Cable and Internet subscribers. • Managed WiFi - Launched in 2014; Targeting Hospitality • Smart WiFi - Launched in 2016; Targeting SMB customers and part of Shaw SMART services
including Smart Voice and Smart Security. • Shaw also has a strong presence in Home WiFi products.
© 2017 SCTE-ISBE and NCTA. All rights reserved. 6
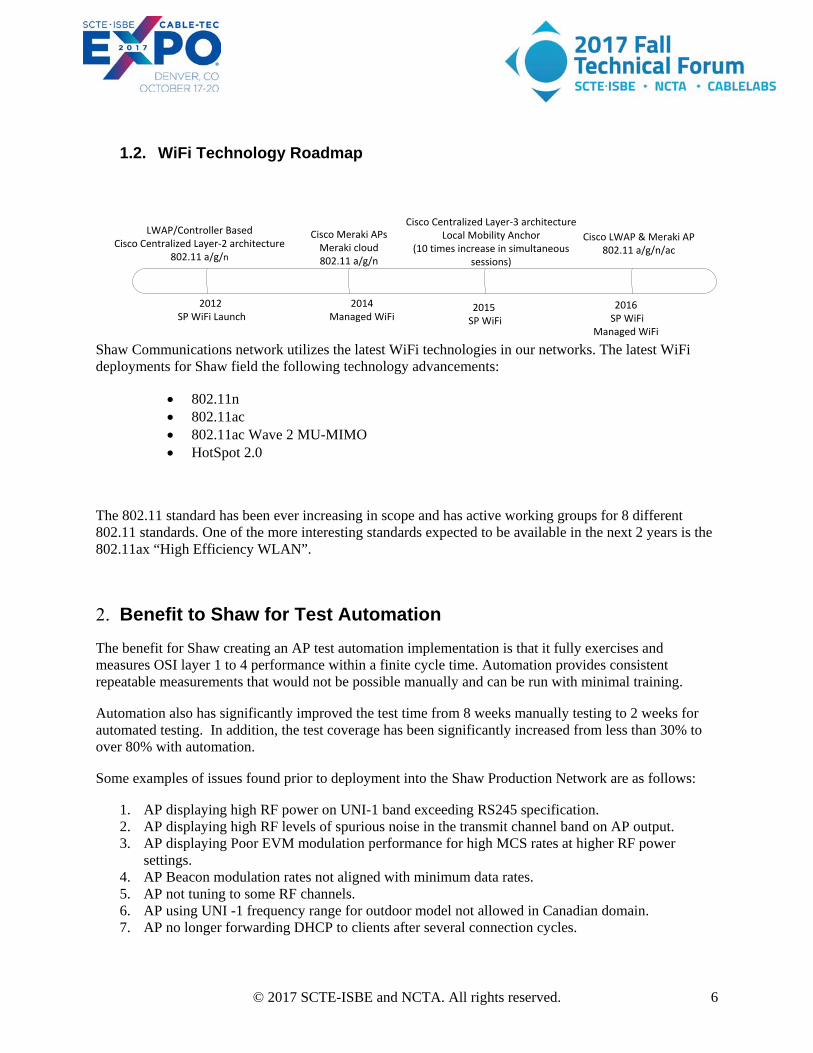
1.2. WiFi Technology Roadmap
Shaw Communications network utilizes the latest WiFi technologies in our networks. The latest WiFi deployments for Shaw field the following technology advancements:
• 802.11n • 802.11ac • 802.11ac Wave 2 MU-MIMO • HotSpot 2.0
The 802.11 standard has been ever increasing in scope and has active working groups for 8 different 802.11 standards. One of the more interesting standards expected to be available in the next 2 years is the 802.11ax “High Efficiency WLAN”.
Benefit to Shaw for Test Automation The benefit for Shaw creating an AP test automation implementation is that it fully exercises and measures OSI layer 1 to 4 performance within a finite cycle time. Automation provides consistent repeatable measurements that would not be possible manually and can be run with minimal training.
Automation also has significantly improved the test time from 8 weeks manually testing to 2 weeks for automated testing. In addition, the test coverage has been significantly increased from less than 30% to over 80% with automation.
Some examples of issues found prior to deployment into the Shaw Production Network are as follows:
1. AP displaying high RF power on UNI-1 band exceeding RS245 specification. 2. AP displaying high RF levels of spurious noise in the transmit channel band on AP output. 3. AP displaying Poor EVM modulation performance for high MCS rates at higher RF power
settings. 4. AP Beacon modulation rates not aligned with minimum data rates. 5. AP not tuning to some RF channels. 6. AP using UNI -1 frequency range for outdoor model not allowed in Canadian domain. 7. AP no longer forwarding DHCP to clients after several connection cycles.
2012 SP WiFi Launch
LWAP/Controller BasedCisco Centralized Layer-2 architecture
802.11 a/g/n
2014Managed WiFi
Cisco Meraki APsMeraki cloud802.11 a/g/n
Cisco Centralized Layer-3 architectureLocal Mobility Anchor
(10 times increase in simultaneous sessions)
2015 SP WiFi
2016 SP WiFi
Managed WiFi
Cisco LWAP & Meraki AP802.11 a/g/n/ac

© 2017 SCTE-ISBE and NCTA. All rights reserved. 7
8. AP candidate firmware revision reducing throughput performance compared to baseline firmware load.
In the case of most issues found with AP performance, we provided detailed feedback and results to the vendor who could address and resolve the issues with firmware releases.
Without the automation capability, these issues may of not been found until the AP was deployed in our production environment and the containment and resolution of the issues would obviously be costlier, time consuming and detrimental to the customer experience.
WiFi Network Requirements The WiFi network requirements are derived from several sources and ultimately place criteria on the technical performance of the AP under test. The test requirements originate from three sources:
• Interpretation of Customer needs into technical requirements • Best in class vendor performance specifications • System design implementation guidelines
1. Interpretation of customer needs:
a. Easy access b. High speeds c. Reliability d. Competitive price
2. Best in class vendor performance:
a. High reliability b. Feature set options c. Latest speeds/spatial streams/performance d. Ease of support/maintainability/fielding configuration
3. System Design Implementation:
a. Overall network design b. 802.11 specifications – ensuring latest technology available c. Access point placement/deployment for optimal coverage/service
Deployment requirements In addition to 802.11 technical specs, deployment guidelines also provide test requirements:
• Desired throughput – distance selected to 17-18 m between AP and user and expect MCS 5-7 downlink in good conditions based on our link analysis for typical client device performance. The perimeter also defines the typical AP power level settings, as we do not use auto power setting in some network deployments. The question we want to answer is what is the AP RF output power at the downlink MCS rate?
• AP antenna coverage – AP model antenna pattern should support deployment guidelines in directivity, and maximum angle of power. Note that the TRP and TIS measurements provided by
© 2017 SCTE-ISBE and NCTA. All rights reserved. 8
external labs such as CableLabs® quantify performance for TIS (receive uplink) at MCS 7, and TRP (transmit downlink) at MCS 0 only for 802.11n in accordance with the CTIA specification (ref 1). To validate deployment guidelines, we measure RF power at higher MCS for downlink for 11n and 11ac. We also measure AP beacon power as compared to higher MCS power. Beacon power is typically the power measured during site surveys and it helps knowing higher MCS power vs. beacon power to confirm our deployment design intent. The question we want to answer is what is the TRP at our target downlink MCS rate?
• AP Placement/Capacity Planning- the relative spacing deployment numbers of APs for a coverage area. We want to ensure spacing still supports adjacent channel operation between the APs. The question we want to answer is will the transmit RF performance of the AP in adjacent Channels support our AP placement for coverage?
Network Test Philosophy The overall test coverage applied by Shaw in validating a network spans the entire OSI network layers and can be summarized as follows:
1. Component Level Verification of key technical performance metrics (i.e. maximum data rates, standards compliance).
2. Subsystem Level Verification for CPE network performance, example of AP with security appliance and DOCSIS modem.
3. System Level verification through use cases, and mixed traffic tests. 4. System Level verification and soak in pre-production networks. (Where preproduction is an exact
copy of the Shaw production network). 5. BETA test trials with customers on the production network.
Overall network performance metrics are validated at higher system integration levels, but we find by measuring the components comprising the network with test results being directly traceable to vendor or industry specifications. This allows Shaw to engage directly with the vendors when non-conformances are found. Verification of the lower layer specifications lays a good foundation for network performance. Given the coverage, and complexity of the standards, Shaw’s approach is to use specialized test equipment and automation to realize the test coverage required. Test coverage is used to perform the first evaluation of equipment, as well as screen changes (firmware updates) throughout the life cycle of the product in the Shaw production environment. Some of the test equipment Shaw employs for network product verification is shown in Table 1 below.
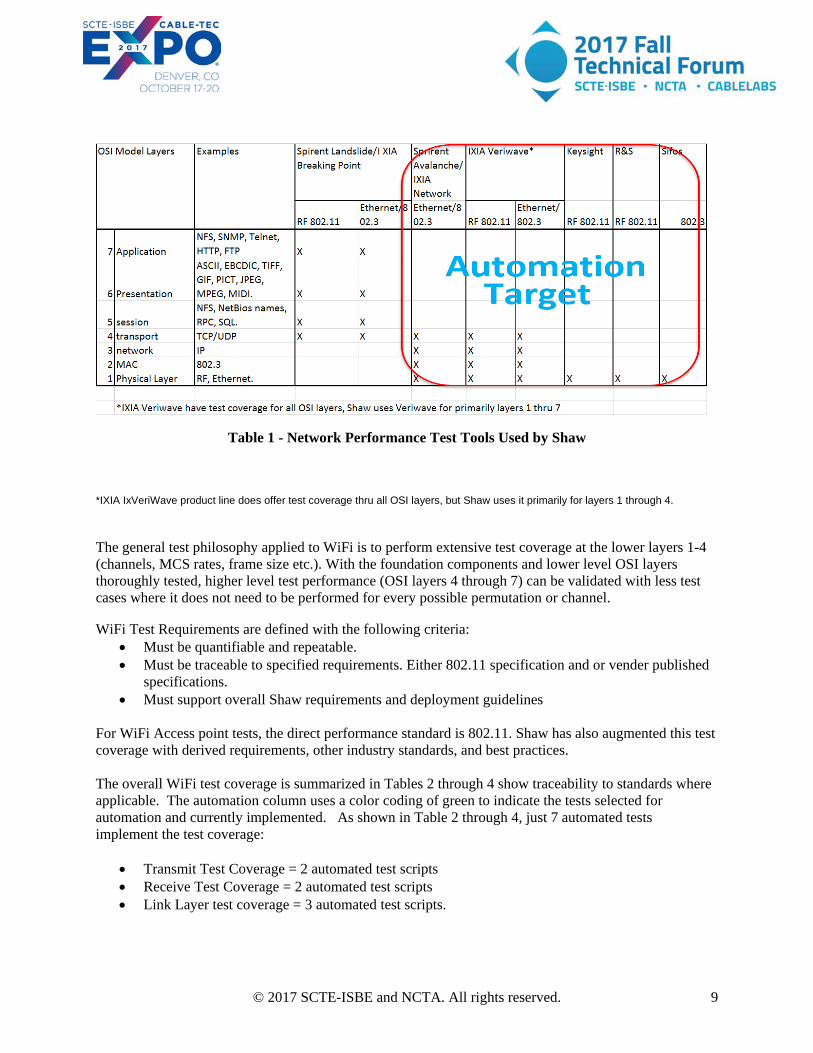
© 2017 SCTE-ISBE and NCTA. All rights reserved. 9
Table 1 - Network Performance Test Tools Used by Shaw
*IXIA IxVeriWave product line does offer test coverage thru all OSI layers, but Shaw uses it primarily for layers 1 through 4. The general test philosophy applied to WiFi is to perform extensive test coverage at the lower layers 1-4 (channels, MCS rates, frame size etc.). With the foundation components and lower level OSI layers thoroughly tested, higher level test performance (OSI layers 4 through 7) can be validated with less test cases where it does not need to be performed for every possible permutation or channel.
WiFi Test Requirements are defined with the following criteria: • Must be quantifiable and repeatable. • Must be traceable to specified requirements. Either 802.11 specification and or vender published
specifications. • Must support overall Shaw requirements and deployment guidelines
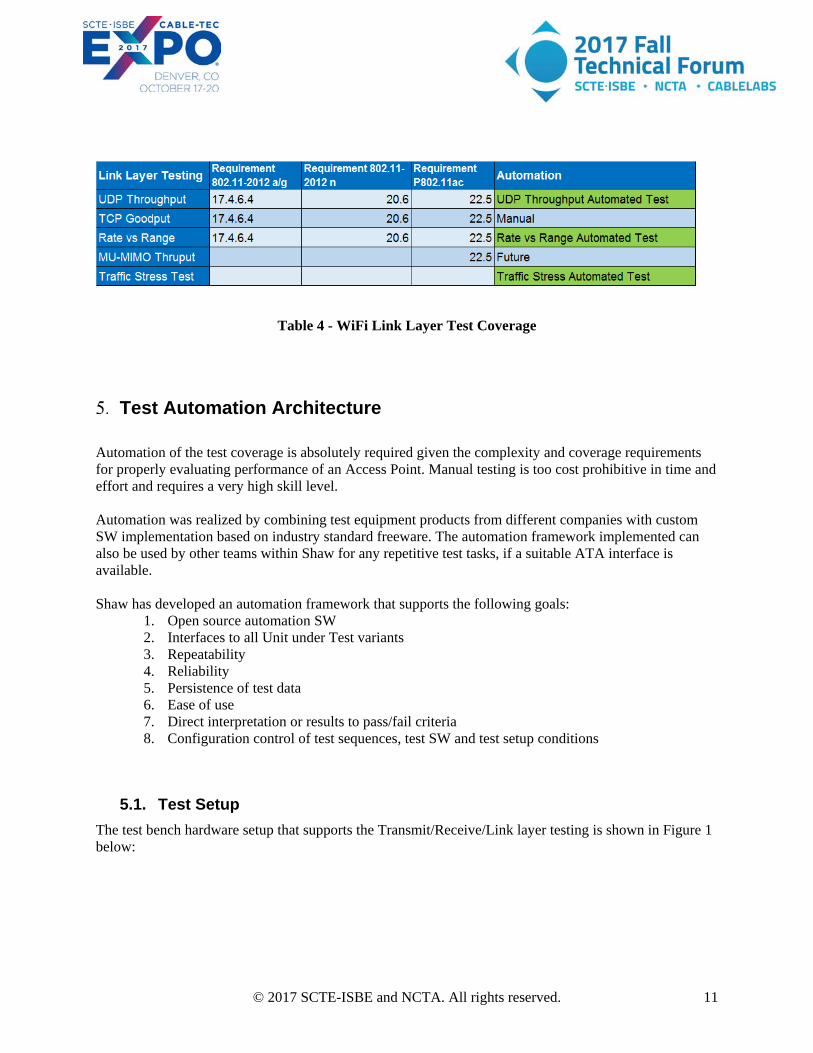
For WiFi Access point tests, the direct performance standard is 802.11. Shaw has also augmented this test coverage with derived requirements, other industry standards, and best practices. The overall WiFi test coverage is summarized in Tables 2 through 4 show traceability to standards where applicable. The automation column uses a color coding of green to indicate the tests selected for automation and currently implemented. As shown in Table 2 through 4, just 7 automated tests implement the test coverage:
• Transmit Test Coverage = 2 automated test scripts • Receive Test Coverage = 2 automated test scripts • Link Layer test coverage = 3 automated test scripts.

© 2017 SCTE-ISBE and NCTA. All rights reserved. 10
Table 2 - WiFi Transmit Test Requirements
Table 3 - WiFi Receive Test Coverage
Transmit CharacteristicRequirement 802.11-2012 a/g
Requirement 802.11-2012 n
Requirement P802.11ac Requirement, Other Automation
Transmit Power EIRP Radiated 17.3.9.1 20.3.20.3 20.3.20.3 RSS-247 NA, Radiating TIS TER performed by external lab
Transmit Channel Power -Conducted RSS-247 RF Characterization vs MCS vs Ordered Power Automated
Test
Transmit Power Accuracy Vendor specification RF Characterization vs MCS vs Ordered Power Automated Test
Transmit Power Packet to Packet Variation Characterization only Characterization only RF Characterization vs MCS vs Ordered Power Automated
Test
Transmit Adjacent Channel Power Characterize only Conducted Emissions Automated Test
Spurious Noise 17.4.6.9 20.3.16 Not specified ManualTX Center Frequency Leakage dB 20.3.20.7.2 RF Characterization vs MCS vs Ordered Power Automated
Test
TX Power Peak Excursions dB US Code of Federal Regulations Title 47, section 15. Para 407
RF Characterization vs MCS vs Ordered Power Automated Test
RF Characterization vs MCS vs Ordered Power Automated Test
SSID Beacon vs MESH Beacon Characterize Only Manual
Beacon Frame Power Characterize Only
Conducted Emissions Automated Test
Transmit Occupied Bandwidth 17.3.9.2 20.3.20.1 22.3.18.1 Conducted Emissions Automated Test
Transmit Spectrum Mask 17.3.9.2 20.3.20.1 22.3.18.1
Transmit center frequency Accuracy 17.3.9.4 20.3.20.4 22.3.18.3 RF Characterization vs MCS vs Ordered Power Automated
Test
Transmit Spectral Flatness 17.3.9.6.2 22.3.18.2 Manual
RF Characterization vs MCS vs Ordered Power Automated Test
Transmit Symbol Clock Frequency Tolerance 20.3.20.6
RF Characterization vs MCS vs Ordered Power Automated Test
20.3.20.2
Modulation Accuracy – Transmit Constellation Error 17.3.9.6.3 20.3.21.7.4 22.3.18.4.3
RF Characterization vs MCS vs Ordered Power Automated Test
Preamble Frequency Error Characterized only
Receiver Characteristic Requirement 802.11-2012 a/g
Requirement 802.11-2012 n
Requirement P802.11ac Automation
Minimum Input Level Sensitivity Radiated 17.3.10.1 20.3.21.1 22.3.19.1 NA, Radiating TIS TER
performed by external lab
Minimum Input Level Sensitivity Conducted 17.3.10.1 20.3.21.1 22.3.19.1 Receive Sensitivity
Automated Test
Adjacent Channel Rejection 17.3.10.2 20.3.21.2 22.3.19.2 Receive Channel Rejection Automated Test
Nonadjacent Channel Rejection 17.3.10.3 21.3.21.3 22.3.19.3
Receive Channel Rejection Automated Test
Receiver Maximum Input Level 17.3.10.4 20.3.21.4 22.3.19.4 Receive Sensitivity
Automated Test
© 2017 SCTE-ISBE and NCTA. All rights reserved. 11
Table 4 - WiFi Link Layer Test Coverage
Test Automation Architecture Automation of the test coverage is absolutely required given the complexity and coverage requirements for properly evaluating performance of an Access Point. Manual testing is too cost prohibitive in time and effort and requires a very high skill level. Automation was realized by combining test equipment products from different companies with custom SW implementation based on industry standard freeware. The automation framework implemented can also be used by other teams within Shaw for any repetitive test tasks, if a suitable ATA interface is available. Shaw has developed an automation framework that supports the following goals:
1. Open source automation SW 2. Interfaces to all Unit under Test variants 3. Repeatability 4. Reliability 5. Persistence of test data 6. Ease of use 7. Direct interpretation or results to pass/fail criteria 8. Configuration control of test sequences, test SW and test setup conditions
5.1. Test Setup The test bench hardware setup that supports the Transmit/Receive/Link layer testing is shown in Figure 1 below:

© 2017 SCTE-ISBE and NCTA. All rights reserved. 12
Accss Point Under Test
RF INTERCONNECTION AND CHANNEL SIMULATOR
OTA SNIFFER
802.11 CLIENT 4X
ANT
R&S SMBV100A
SIGNAL GENERATOR
Keysight DSOV084A
SIGNAL ANALYER
802.3 Client/
Servers PCUUT EMI Enclosure
SHAW NETWORK
EMI Enclosure
RFx4RF
WiFi Waveform
GENERATION SW
RFx4
RF
ETH
VeriwaveWBE1601/1604Ethernet 802.3
VeriwaveRF36024 wifi
802.11a/b/g/n/ac
RF x 4
RF x 4
IXIA Veriwave Chassis
Keysight 89600 Analysis SW
Test Automation PC
VeriwaveATA 100 Interface
ETH
ETH
ETH
ETH
Figure 1 - WiFi Automation Hardware Setup
The block components description of the Automation HW setup is as follows:
5.1.1. 802.3 Client/Server PC
The PC hosts the traffic test tools such as J-perf to perform throughput and packet statistics. It also provides an interface to cloud management for accessing and configuring the AP under test. May also be used to host VOIP, generate video traffic etc.
5.1.2. 802.11 Clients 4x Antenna
The 802.11 clients provide the ability to test the APs via the 802.11 interface standard. The clients support the 802.11 b/g/n/ac to 160 MHz standards. The clients are either ASUS WiFi cards or Octoscope PAL 2.

© 2017 SCTE-ISBE and NCTA. All rights reserved. 13
5.1.3. IXIA IxVeriWave Chassis
Figure 2 - IXVeriwave Chassis
The IXIA IxVeriWave Chassis provides test client capability and test coverage for many of the 802.11 tests. The IxVeriWave RF36024 card supports 802.11a/b/g/n/ac standards for client simulation. The IxVeriWave Ethernet card WBE1601/04 provides the 802.3 client/server interface.
The IxVeriWave ATA 100 interface provides the remote command interface ATA commands via Telnet to the IXIA IxVeriWave chassis. The ATA commands allow full programming capability for configuring clients, generating data flows and running measurements and status queries.
5.1.4. OTA Sniffer
The OTA sniffer provides ability for Wireshark packet capture to analyze the traffic between client and Server.
5.1.5. RF Interconnection and Channel Simulator
The RF interconnection and channel simulator provides the physical RF interconnection of the AP UUT, client and external test equipment. It provides RF switch/coupling paths to support all RF test cases including RF transmit/receive, external interferers, and multiple APs and clients. The components are housed in an EMI chamber to minimize external interference.
© 2017 SCTE-ISBE and NCTA. All rights reserved. 14
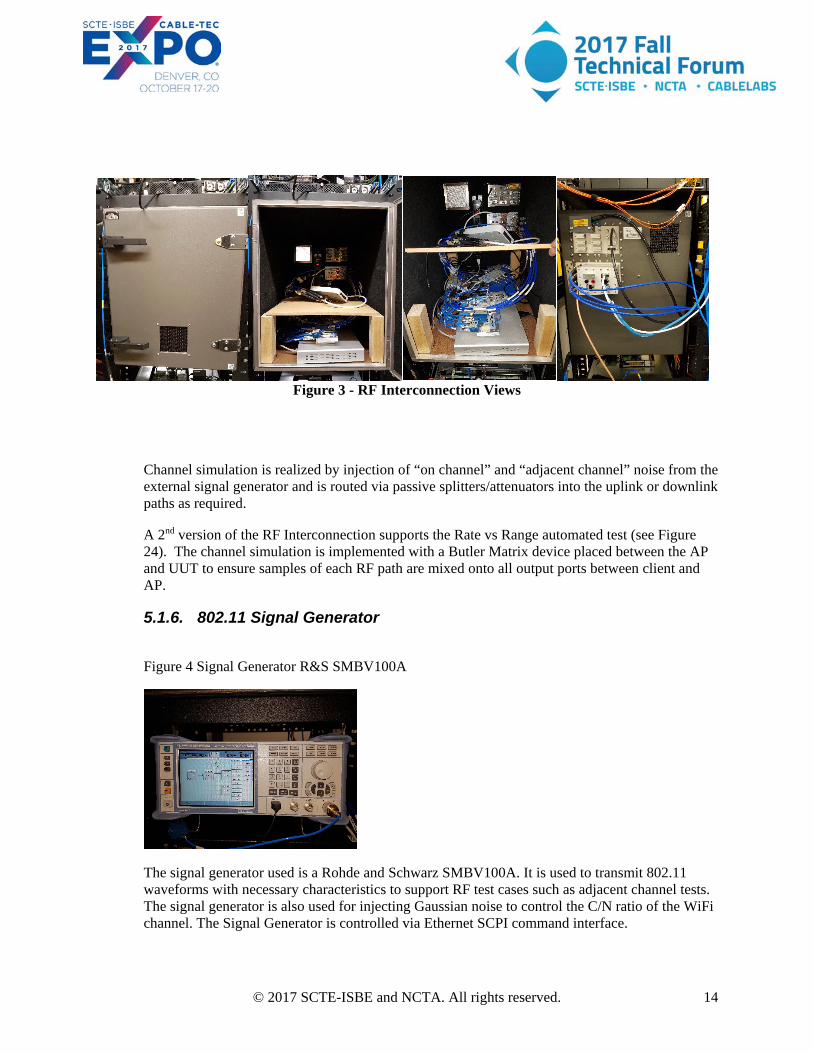
Figure 3 - RF Interconnection Views
Channel simulation is realized by injection of “on channel” and “adjacent channel” noise from the external signal generator and is routed via passive splitters/attenuators into the uplink or downlink paths as required.
A 2nd version of the RF Interconnection supports the Rate vs Range automated test (see Figure 24). The channel simulation is implemented with a Butler Matrix device placed between the AP and UUT to ensure samples of each RF path are mixed onto all output ports between client and AP.
5.1.6. 802.11 Signal Generator
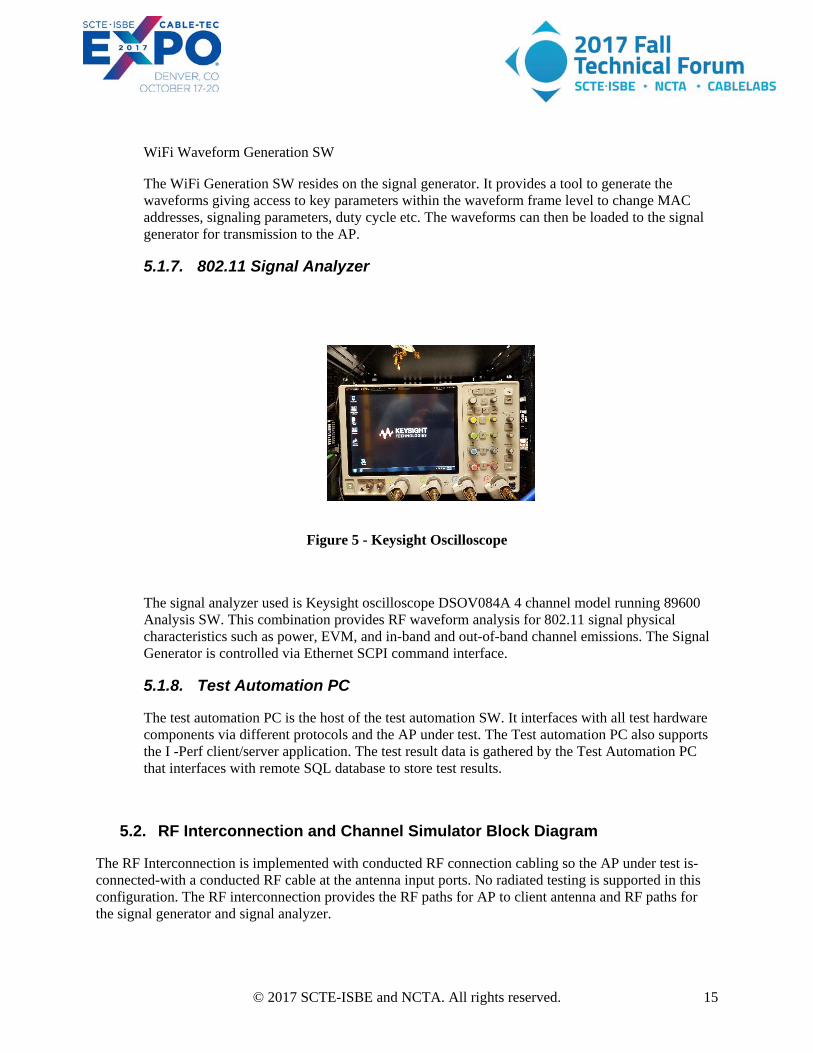
Figure 4 Signal Generator R&S SMBV100A
The signal generator used is a Rohde and Schwarz SMBV100A. It is used to transmit 802.11 waveforms with necessary characteristics to support RF test cases such as adjacent channel tests. The signal generator is also used for injecting Gaussian noise to control the C/N ratio of the WiFi channel. The Signal Generator is controlled via Ethernet SCPI command interface.
© 2017 SCTE-ISBE and NCTA. All rights reserved. 15
WiFi Waveform Generation SW
The WiFi Generation SW resides on the signal generator. It provides a tool to generate the waveforms giving access to key parameters within the waveform frame level to change MAC addresses, signaling parameters, duty cycle etc. The waveforms can then be loaded to the signal generator for transmission to the AP.
5.1.7. 802.11 Signal Analyzer
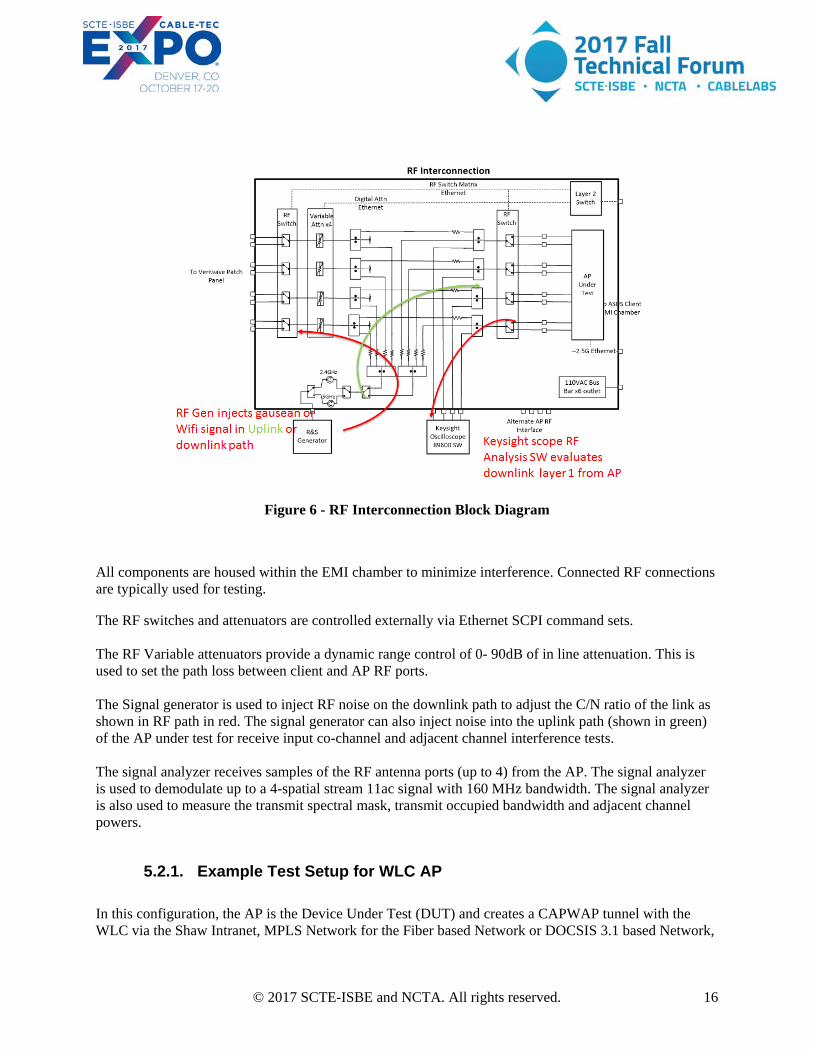
Figure 5 - Keysight Oscilloscope
The signal analyzer used is Keysight oscilloscope DSOV084A 4 channel model running 89600 Analysis SW. This combination provides RF waveform analysis for 802.11 signal physical characteristics such as power, EVM, and in-band and out-of-band channel emissions. The Signal Generator is controlled via Ethernet SCPI command interface.
5.1.8. Test Automation PC
The test automation PC is the host of the test automation SW. It interfaces with all test hardware components via different protocols and the AP under test. The Test automation PC also supports the I -Perf client/server application. The test result data is gathered by the Test Automation PC that interfaces with remote SQL database to store test results.
5.2. RF Interconnection and Channel Simulator Block Diagram
The RF Interconnection is implemented with conducted RF connection cabling so the AP under test is-connected-with a conducted RF cable at the antenna input ports. No radiated testing is supported in this configuration. The RF interconnection provides the RF paths for AP to client antenna and RF paths for the signal generator and signal analyzer.
© 2017 SCTE-ISBE and NCTA. All rights reserved. 16
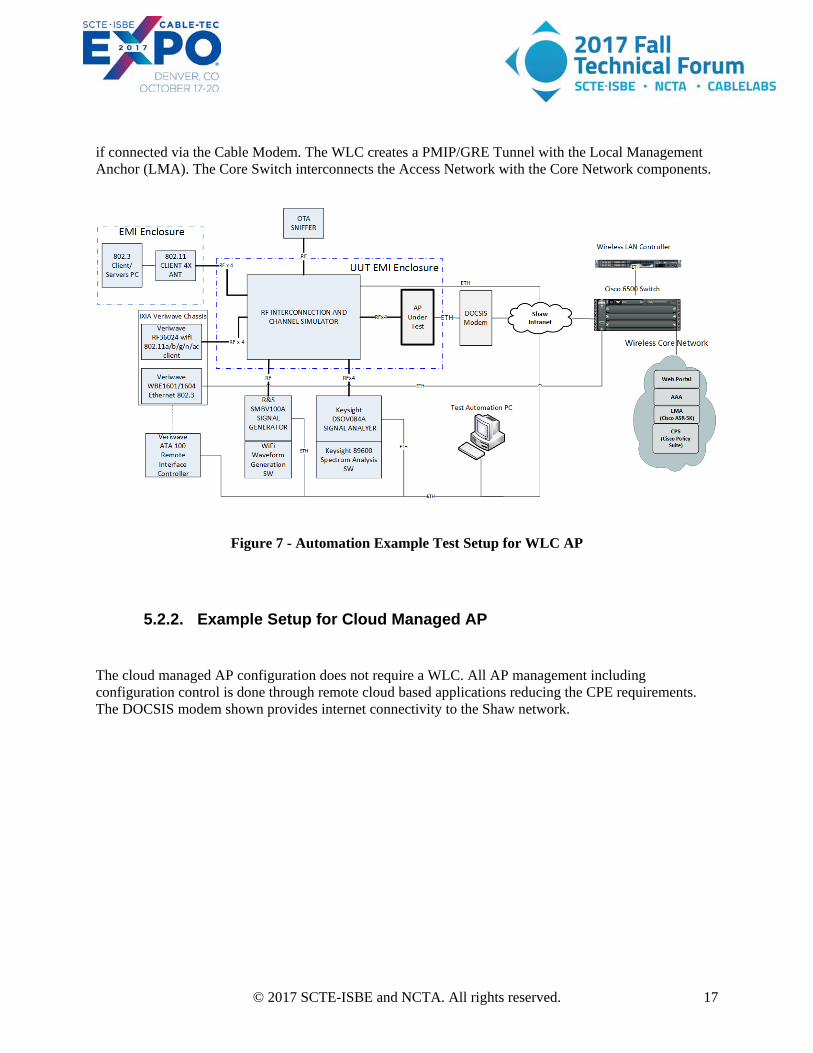
Figure 6 - RF Interconnection Block Diagram
All components are housed within the EMI chamber to minimize interference. Connected RF connections are typically used for testing.
The RF switches and attenuators are controlled externally via Ethernet SCPI command sets. The RF Variable attenuators provide a dynamic range control of 0- 90dB of in line attenuation. This is used to set the path loss between client and AP RF ports. The Signal generator is used to inject RF noise on the downlink path to adjust the C/N ratio of the link as shown in RF path in red. The signal generator can also inject noise into the uplink path (shown in green) of the AP under test for receive input co-channel and adjacent channel interference tests. The signal analyzer receives samples of the RF antenna ports (up to 4) from the AP. The signal analyzer is used to demodulate up to a 4-spatial stream 11ac signal with 160 MHz bandwidth. The signal analyzer is also used to measure the transmit spectral mask, transmit occupied bandwidth and adjacent channel powers.
5.2.1. Example Test Setup for WLC AP In this configuration, the AP is the Device Under Test (DUT) and creates a CAPWAP tunnel with the WLC via the Shaw Intranet, MPLS Network for the Fiber based Network or DOCSIS 3.1 based Network,
© 2017 SCTE-ISBE and NCTA. All rights reserved. 17
if connected via the Cable Modem. The WLC creates a PMIP/GRE Tunnel with the Local Management Anchor (LMA). The Core Switch interconnects the Access Network with the Core Network components.
Figure 7 - Automation Example Test Setup for WLC AP
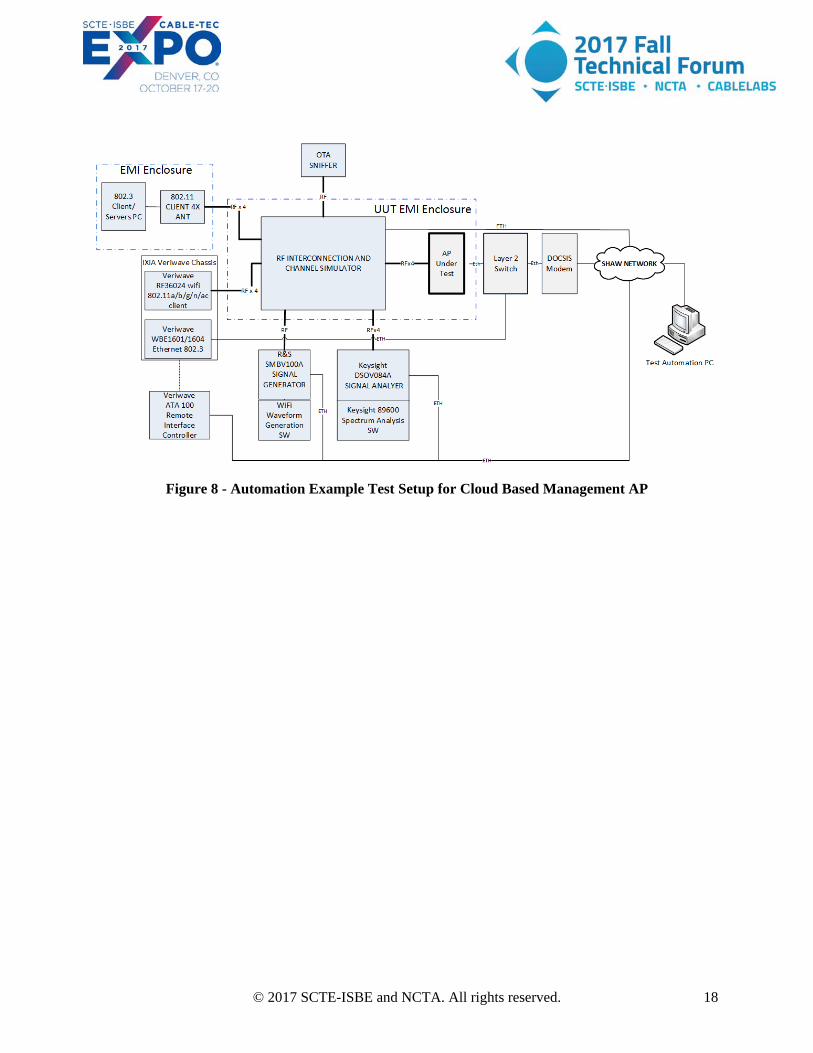
5.2.2. Example Setup for Cloud Managed AP The cloud managed AP configuration does not require a WLC. All AP management including configuration control is done through remote cloud based applications reducing the CPE requirements. The DOCSIS modem shown provides internet connectivity to the Shaw network.
© 2017 SCTE-ISBE and NCTA. All rights reserved. 18
Figure 8 - Automation Example Test Setup for Cloud Based Management AP
© 2017 SCTE-ISBE and NCTA. All rights reserved. 19
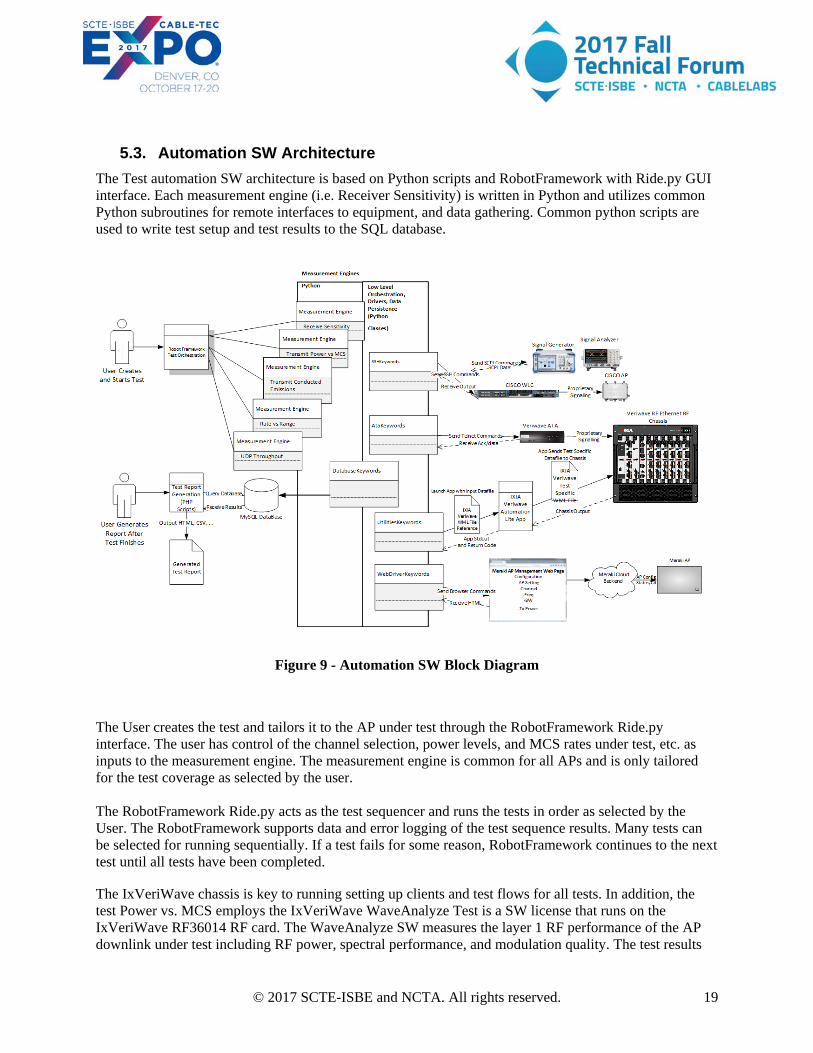
5.3. Automation SW Architecture The Test automation SW architecture is based on Python scripts and RobotFramework with Ride.py GUI interface. Each measurement engine (i.e. Receiver Sensitivity) is written in Python and utilizes common Python subroutines for remote interfaces to equipment, and data gathering. Common python scripts are used to write test setup and test results to the SQL database.
Figure 9 - Automation SW Block Diagram
The User creates the test and tailors it to the AP under test through the RobotFramework Ride.py interface. The user has control of the channel selection, power levels, and MCS rates under test, etc. as inputs to the measurement engine. The measurement engine is common for all APs and is only tailored for the test coverage as selected by the user. The RobotFramework Ride.py acts as the test sequencer and runs the tests in order as selected by the User. The RobotFramework supports data and error logging of the test sequence results. Many tests can be selected for running sequentially. If a test fails for some reason, RobotFramework continues to the next test until all tests have been completed. The IxVeriWave chassis is key to running setting up clients and test flows for all tests. In addition, the test Power vs. MCS employs the IxVeriWave WaveAnalyze Test is a SW license that runs on the IxVeriWave RF36014 RF card. The WaveAnalyze SW measures the layer 1 RF performance of the AP downlink under test including RF power, spectral performance, and modulation quality. The test results
© 2017 SCTE-ISBE and NCTA. All rights reserved. 20
from WaveAnalyze are parsed from csv files by python subroutines and the test results sent to the SQL database. The UDP throughput test uses the IxVeriWave AutoLite IXIA benchmark test SW which provides an automated method to configure and run IxVeriWave UDP throughput benchmark tests. We use this test SW feature to incorporate benchmark tests in the automation framework.
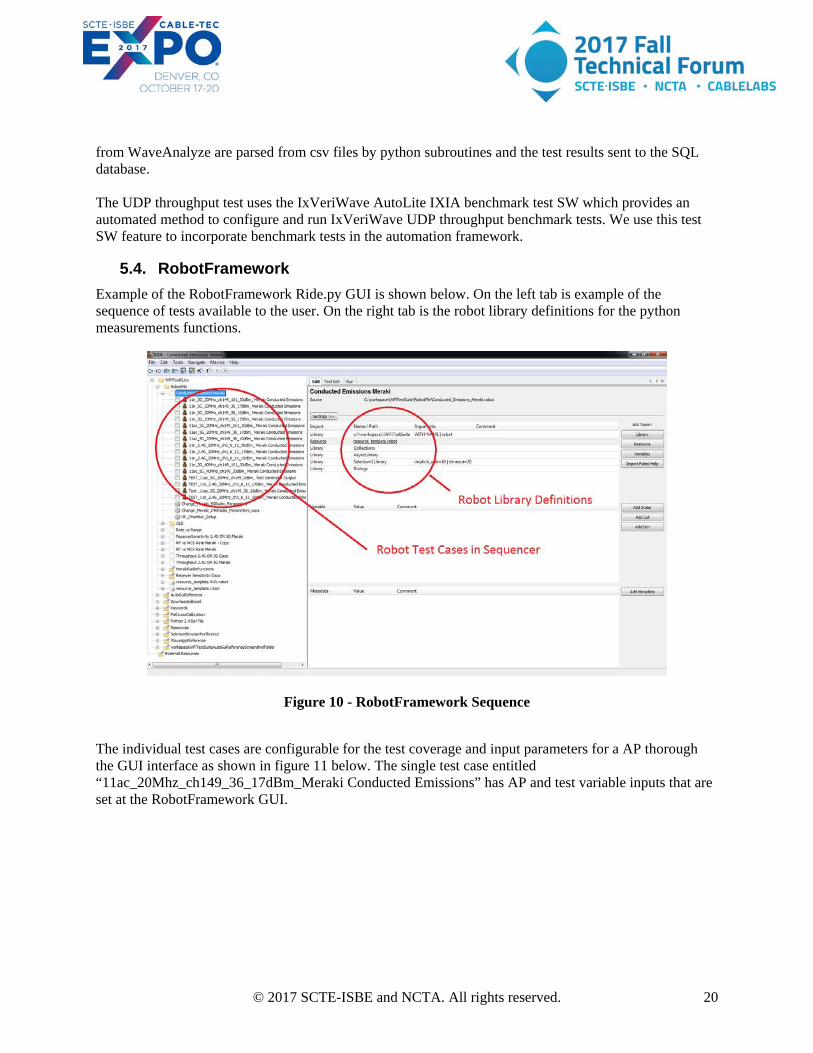
5.4. RobotFramework Example of the RobotFramework Ride.py GUI is shown below. On the left tab is example of the sequence of tests available to the user. On the right tab is the robot library definitions for the python measurements functions.
Figure 10 - RobotFramework Sequence
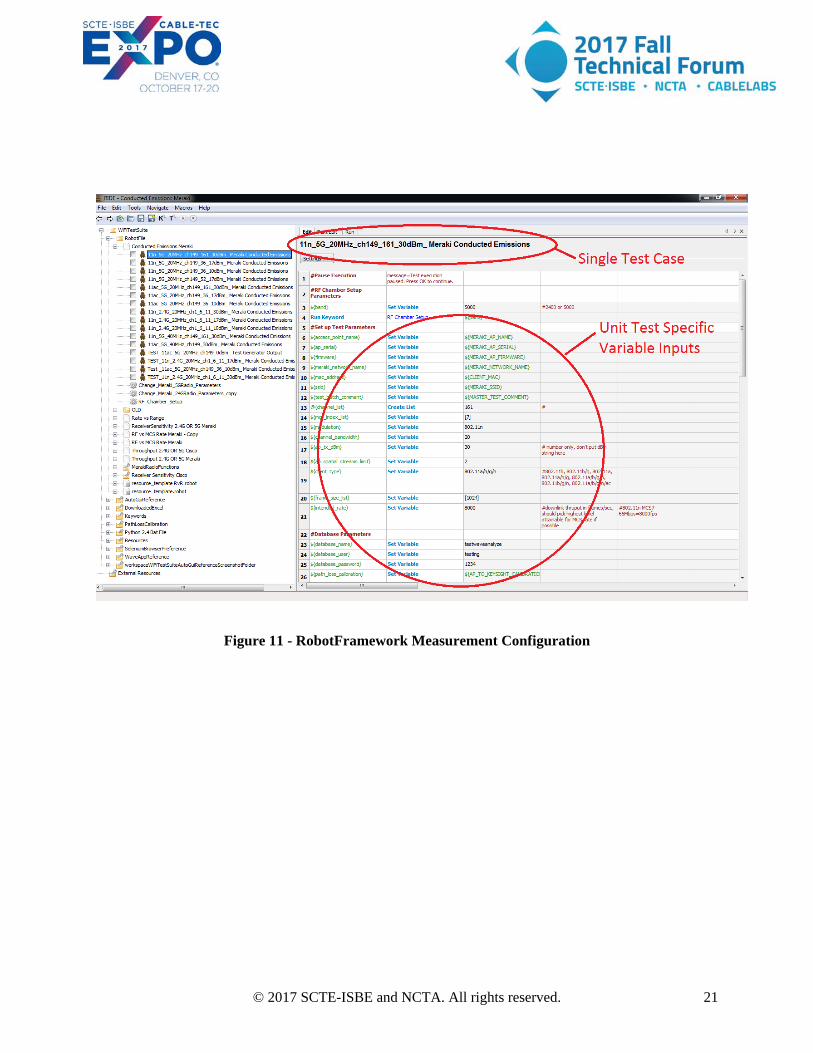
The individual test cases are configurable for the test coverage and input parameters for a AP thorough the GUI interface as shown in figure 11 below. The single test case entitled “11ac_20Mhz_ch149_36_17dBm_Meraki Conducted Emissions” has AP and test variable inputs that are set at the RobotFramework GUI.
© 2017 SCTE-ISBE and NCTA. All rights reserved. 21
Figure 11 - RobotFramework Measurement Configuration
© 2017 SCTE-ISBE and NCTA. All rights reserved. 22
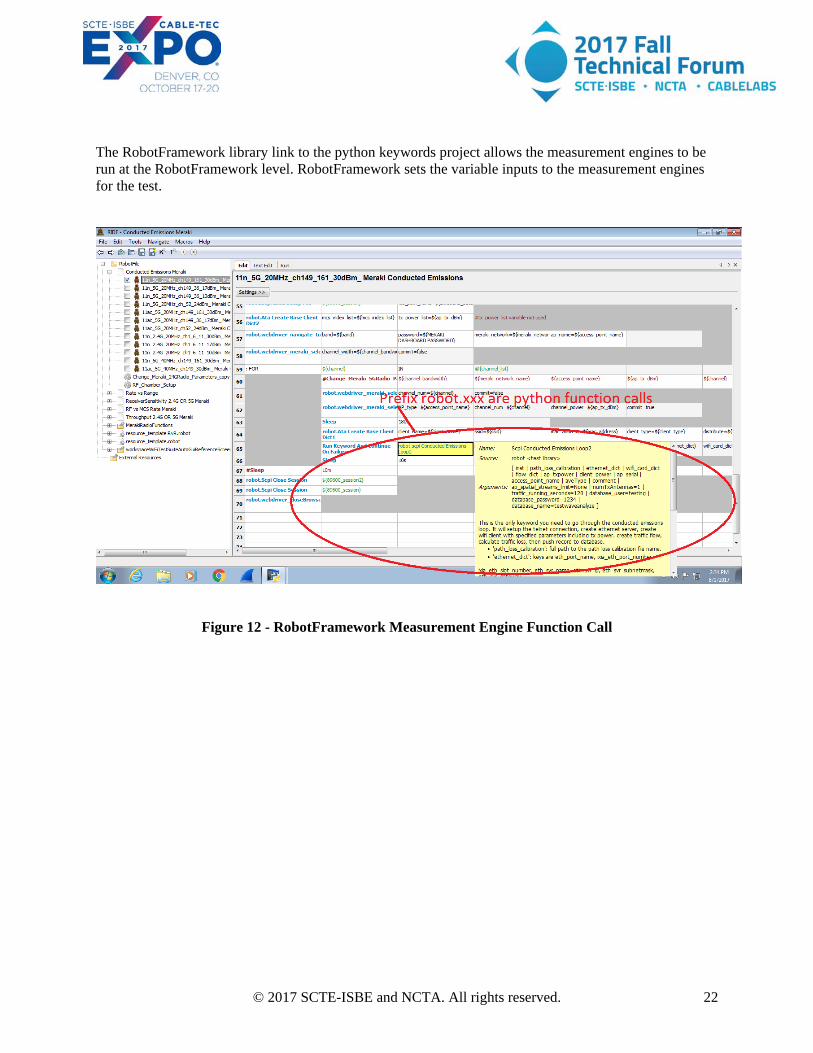
The RobotFramework library link to the python keywords project allows the measurement engines to be run at the RobotFramework level. RobotFramework sets the variable inputs to the measurement engines for the test.
Figure 12 - RobotFramework Measurement Engine Function Call
© 2017 SCTE-ISBE and NCTA. All rights reserved. 23
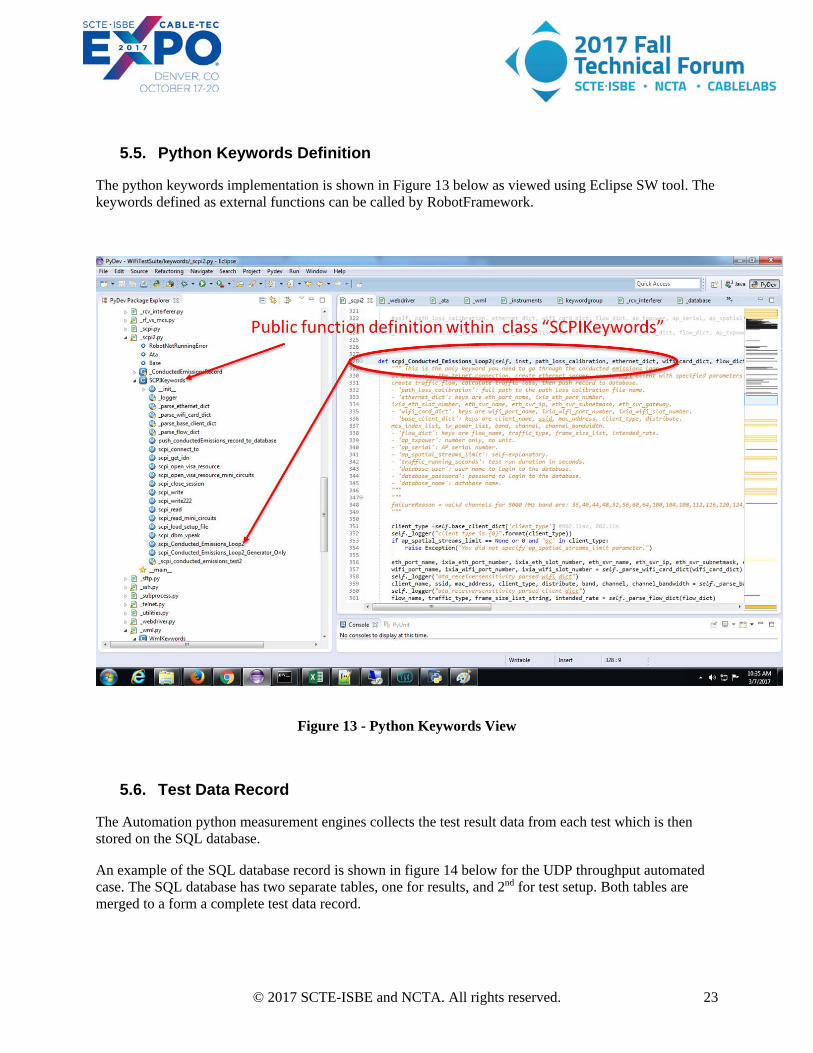
5.5. Python Keywords Definition
The python keywords implementation is shown in Figure 13 below as viewed using Eclipse SW tool. The keywords defined as external functions can be called by RobotFramework.
Figure 13 - Python Keywords View
5.6. Test Data Record
The Automation python measurement engines collects the test result data from each test which is then stored on the SQL database.
An example of the SQL database record is shown in figure 14 below for the UDP throughput automated case. The SQL database has two separate tables, one for results, and 2nd for test setup. Both tables are merged to a form a complete test data record.
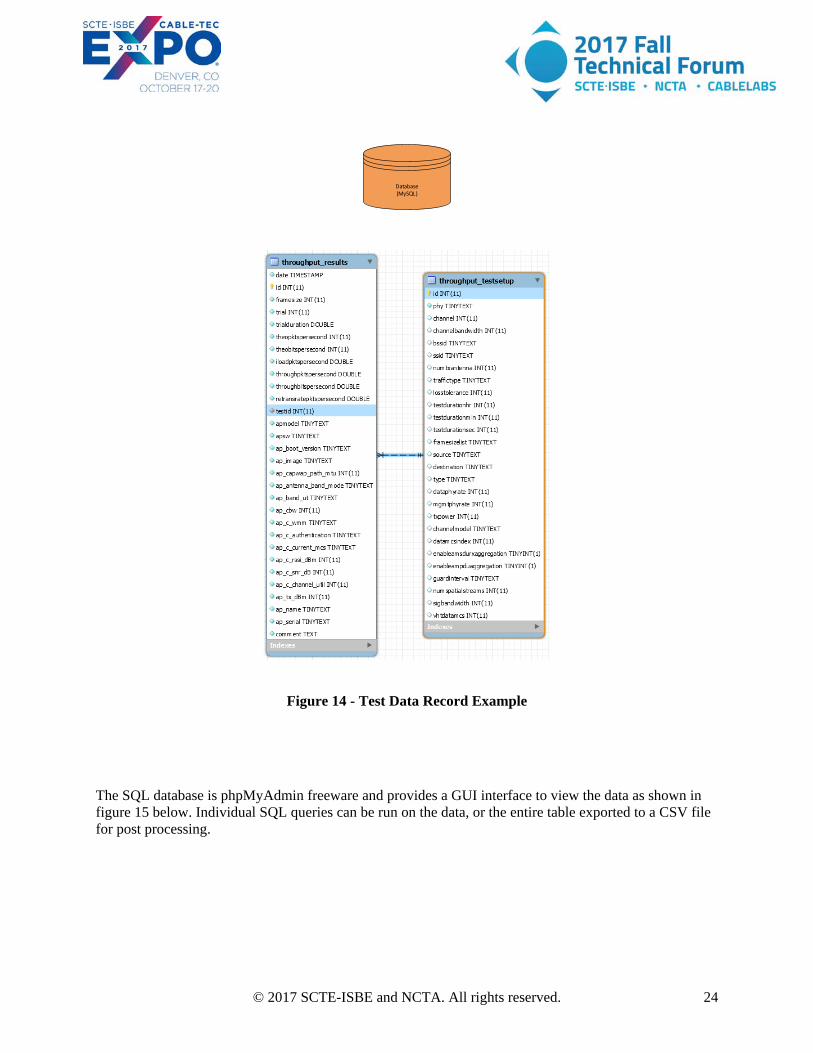
© 2017 SCTE-ISBE and NCTA. All rights reserved. 24
Figure 14 - Test Data Record Example
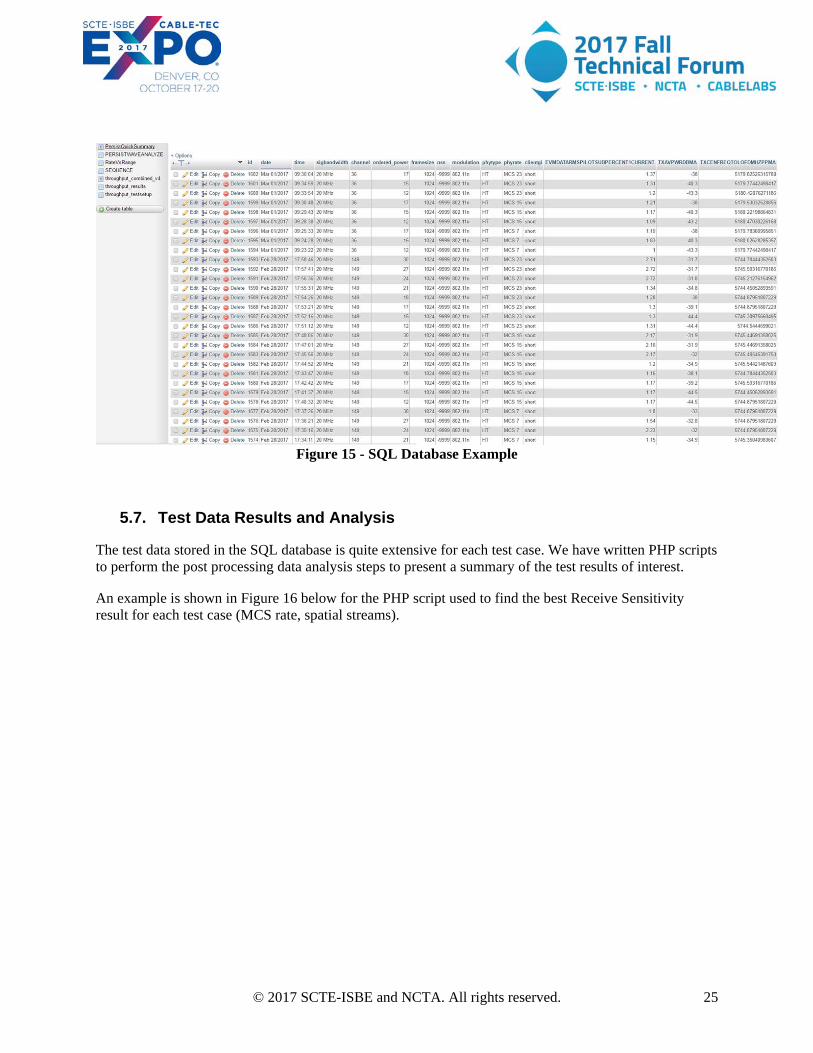
The SQL database is phpMyAdmin freeware and provides a GUI interface to view the data as shown in figure 15 below. Individual SQL queries can be run on the data, or the entire table exported to a CSV file for post processing.
Database(MySQL)
© 2017 SCTE-ISBE and NCTA. All rights reserved. 25
Figure 15 - SQL Database Example
5.7. Test Data Results and Analysis
The test data stored in the SQL database is quite extensive for each test case. We have written PHP scripts to perform the post processing data analysis steps to present a summary of the test results of interest.
An example is shown in Figure 16 below for the PHP script used to find the best Receive Sensitivity result for each test case (MCS rate, spatial streams).
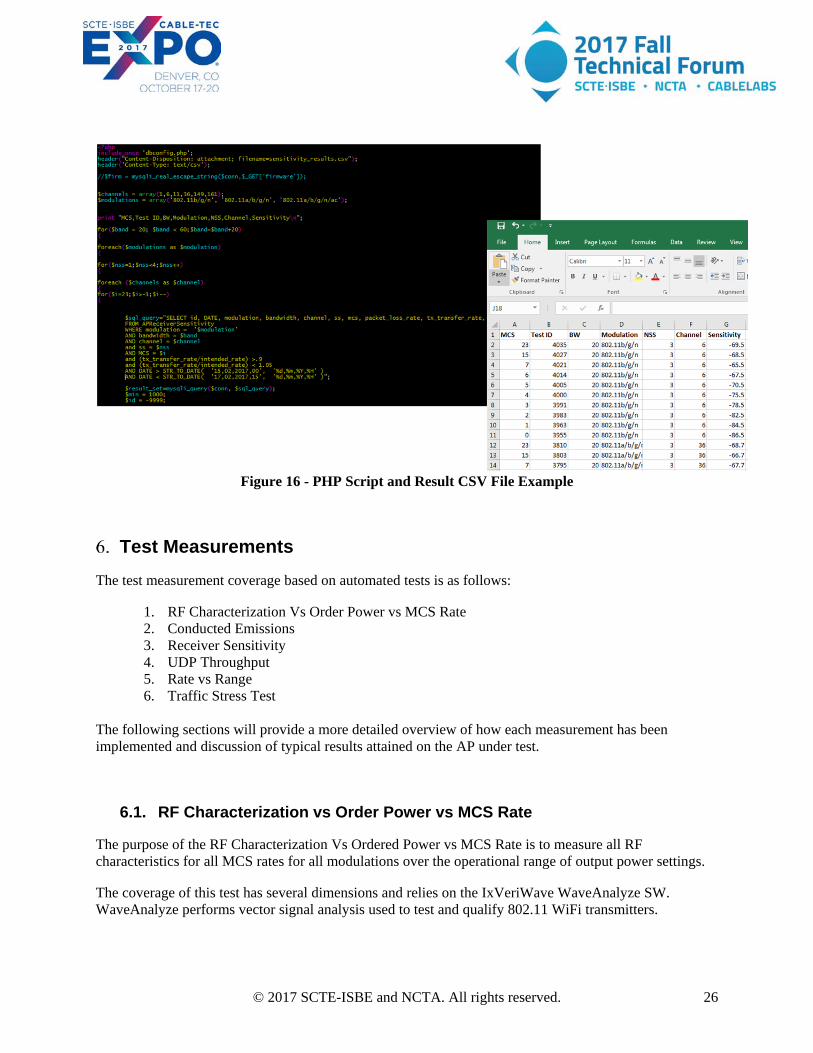
© 2017 SCTE-ISBE and NCTA. All rights reserved. 26
Figure 16 - PHP Script and Result CSV File Example
Test Measurements The test measurement coverage based on automated tests is as follows:
1. RF Characterization Vs Order Power vs MCS Rate 2. Conducted Emissions 3. Receiver Sensitivity 4. UDP Throughput 5. Rate vs Range 6. Traffic Stress Test
The following sections will provide a more detailed overview of how each measurement has been implemented and discussion of typical results attained on the AP under test.
6.1. RF Characterization vs Order Power vs MCS Rate
The purpose of the RF Characterization Vs Ordered Power vs MCS Rate is to measure all RF characteristics for all MCS rates for all modulations over the operational range of output power settings.
The coverage of this test has several dimensions and relies on the IxVeriWave WaveAnalyze SW. WaveAnalyze performs vector signal analysis used to test and qualify 802.11 WiFi transmitters.
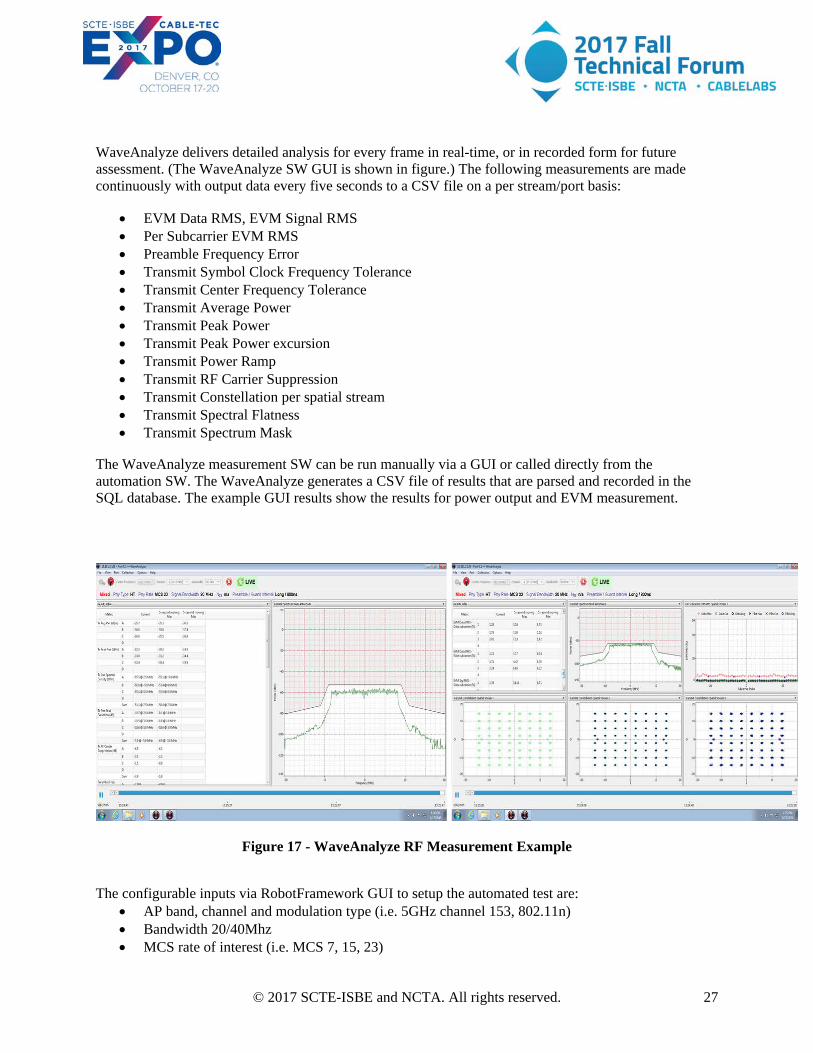
© 2017 SCTE-ISBE and NCTA. All rights reserved. 27
WaveAnalyze delivers detailed analysis for every frame in real-time, or in recorded form for future assessment. (The WaveAnalyze SW GUI is shown in figure.) The following measurements are made continuously with output data every five seconds to a CSV file on a per stream/port basis:
• EVM Data RMS, EVM Signal RMS • Per Subcarrier EVM RMS • Preamble Frequency Error • Transmit Symbol Clock Frequency Tolerance • Transmit Center Frequency Tolerance • Transmit Average Power • Transmit Peak Power • Transmit Peak Power excursion • Transmit Power Ramp • Transmit RF Carrier Suppression • Transmit Constellation per spatial stream • Transmit Spectral Flatness • Transmit Spectrum Mask
The WaveAnalyze measurement SW can be run manually via a GUI or called directly from the automation SW. The WaveAnalyze generates a CSV file of results that are parsed and recorded in the SQL database. The example GUI results show the results for power output and EVM measurement.
Figure 17 - WaveAnalyze RF Measurement Example
The configurable inputs via RobotFramework GUI to setup the automated test are:
• AP band, channel and modulation type (i.e. 5GHz channel 153, 802.11n) • Bandwidth 20/40Mhz • MCS rate of interest (i.e. MCS 7, 15, 23)

© 2017 SCTE-ISBE and NCTA. All rights reserved. 28
• Frame size, data rate (i.e. 1024bytes, 1000fps) • AP power steps to be measured. (i.e. steps from 12 to 30dBm in 3dB increments
The test automation then performs the following measurement steps:
a. Sets AP to the desired channel power level b. Sets the IxVeriWave client to advertise the selected band, channel, modulation rate c. Connects the IxVeriWave client to the AP d. Establish a downlink flow at the desired frame and data rate e. Start IxVeriWave WaveAnalyze Analysis SW f. Read CSV file to extract measurements results and confirm test results captured for the desired
MCS rate g. Records results of measurements in SQL database h. Repeats measurement at the AP desired power setting i. Test duration is approximately 2 minutes for each measurement after initial connection/setup (per
MCS under test) If the target MCS rate is not realized, the test automation will modify the C/N ratio of the test flow by injecting Gaussian noise from external generator in 3dB increments from an initial C/N point. As the C/N is reduced, the AP algorithms will select lower MCS rates to compensate. The test program continues to modify the C/N ratio until the target MCS rate is selected by the AP under test. We used guidelines (Ref 3) from Andrew Von Nagy shown in Table 5 below as a starting point to set the link SNR when targeting a specific MCS rate.
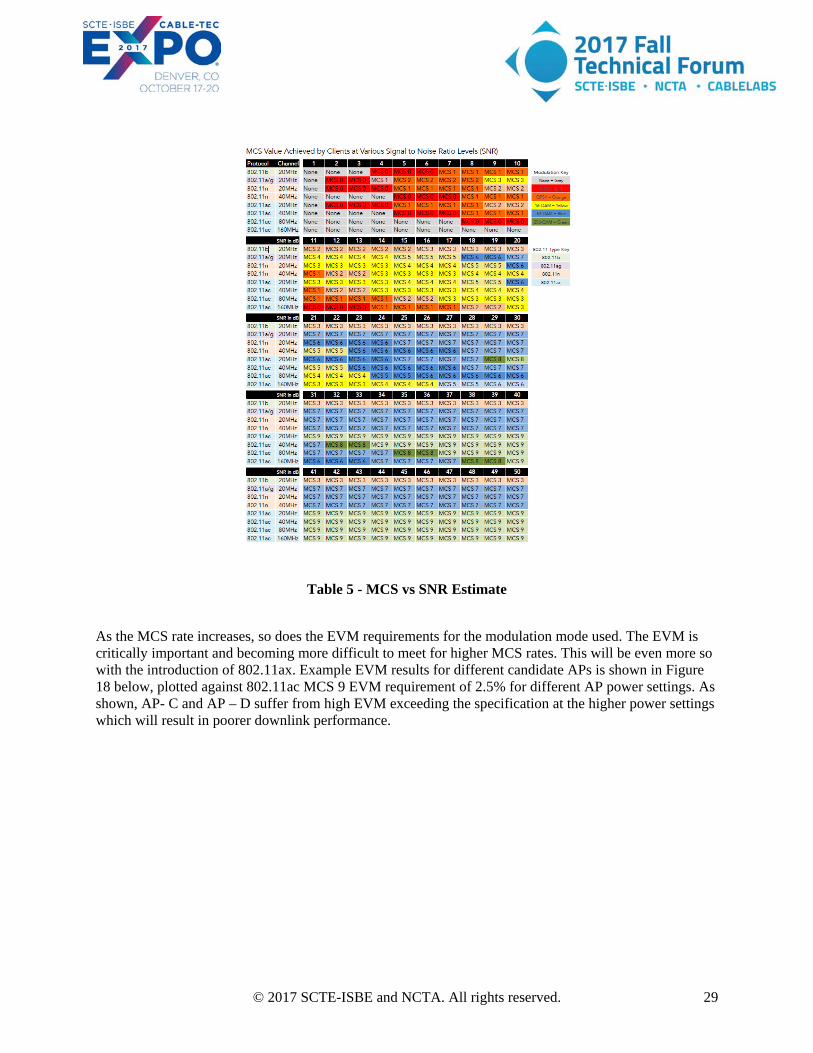
© 2017 SCTE-ISBE and NCTA. All rights reserved. 29
Table 5 - MCS vs SNR Estimate
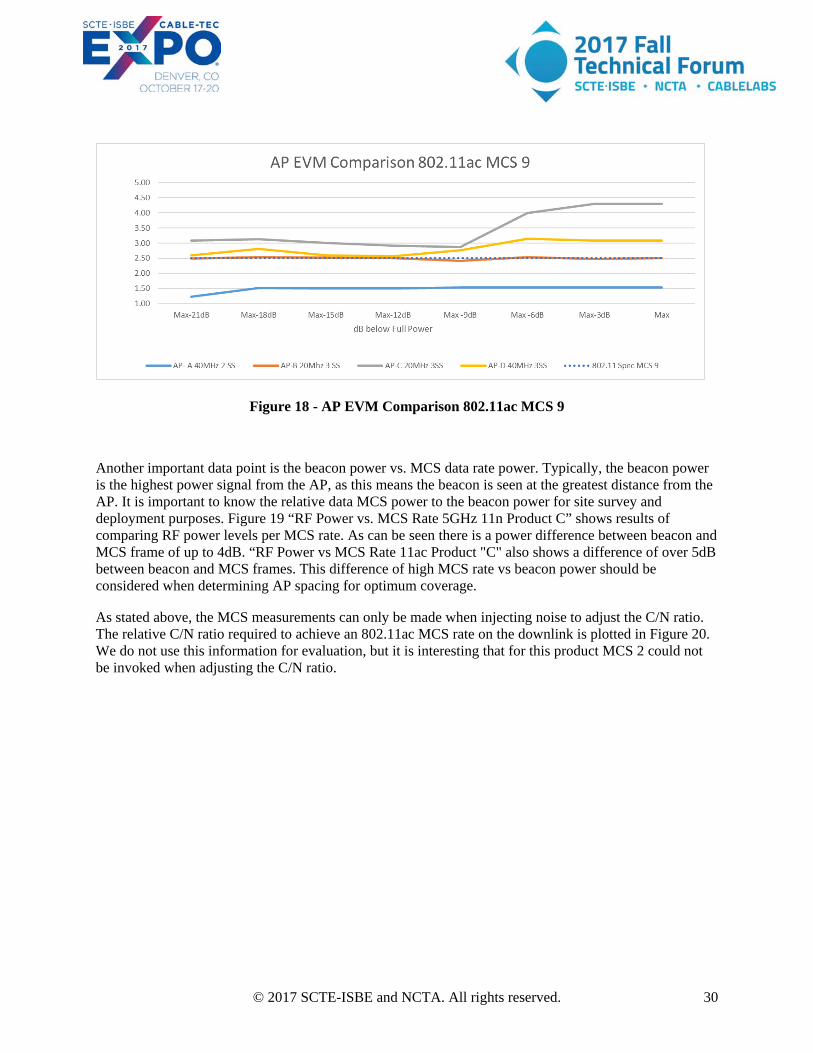
As the MCS rate increases, so does the EVM requirements for the modulation mode used. The EVM is critically important and becoming more difficult to meet for higher MCS rates. This will be even more so with the introduction of 802.11ax. Example EVM results for different candidate APs is shown in Figure 18 below, plotted against 802.11ac MCS 9 EVM requirement of 2.5% for different AP power settings. As shown, AP- C and AP – D suffer from high EVM exceeding the specification at the higher power settings which will result in poorer downlink performance.
© 2017 SCTE-ISBE and NCTA. All rights reserved. 30
Figure 18 - AP EVM Comparison 802.11ac MCS 9
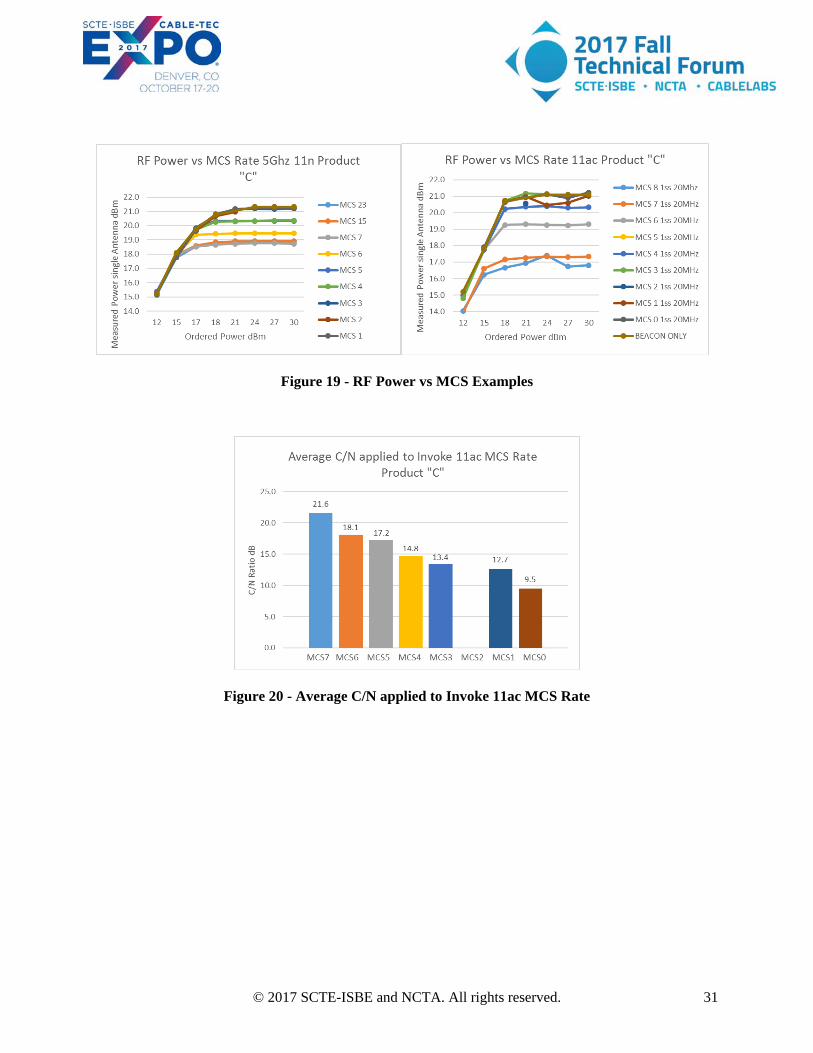
Another important data point is the beacon power vs. MCS data rate power. Typically, the beacon power is the highest power signal from the AP, as this means the beacon is seen at the greatest distance from the AP. It is important to know the relative data MCS power to the beacon power for site survey and deployment purposes. Figure 19 “RF Power vs. MCS Rate 5GHz 11n Product C” shows results of comparing RF power levels per MCS rate. As can be seen there is a power difference between beacon and MCS frame of up to 4dB. “RF Power vs MCS Rate 11ac Product "C" also shows a difference of over 5dB between beacon and MCS frames. This difference of high MCS rate vs beacon power should be considered when determining AP spacing for optimum coverage.
As stated above, the MCS measurements can only be made when injecting noise to adjust the C/N ratio. The relative C/N ratio required to achieve an 802.11ac MCS rate on the downlink is plotted in Figure 20. We do not use this information for evaluation, but it is interesting that for this product MCS 2 could not be invoked when adjusting the C/N ratio.
© 2017 SCTE-ISBE and NCTA. All rights reserved. 31
Figure 19 - RF Power vs MCS Examples
Figure 20 - Average C/N applied to Invoke 11ac MCS Rate
© 2017 SCTE-ISBE and NCTA. All rights reserved. 32
6.2. Conducted Emissions The purpose of the Conducted Emissions Automated Test is to evaluate the Transmit RF spectrum performance of the AP under test downlink. This test uses the Keysight Oscilloscope with 89600 RF Analysis SW to measure the spectrum performance for the following parameters:
• Occupied Bandwidth • Adjacent Channel Power • Spectral Mask
The configurable inputs to the automated test are summarized as follows:
• AP band, channel, and modulation type (i.e. 5GHz channel 153, 802.11n) • MCS rate of interest (i.e. MCS 7, 15, 23) • Bandwidth 20/40Mhz • Frame size, data rate (i.e. 1024bytes, 1000fps) • AP power steps to be measured
The test automation then performs the following measurement steps:
a. Sets AP to the desired channel power level via HTML website automation b. Sets the IxVeriWave client to advertise the selected band, channel, modulation rate c. Connects the IxVeriWave client to the AP d. Establish a downlink flow at the desired frame and data rate e. Configure the Keysight Analyzer to perform the measurement f. Reads back the measurement results from the Keysight analyzer and records results into SQL
database g. Repeats measurement for next configuration h. Test duration is approximately 3 minutes for each measurement after initial connection/setup (per
MCS under test) Part of the challenge with this test is avoiding averaging errors of the frames. IxVeriWave does try to control the periodicity of the downlink frames. The 89600 SW will provide average of the frame spectrum, and not average in any null times. And the test is set at the highest frame rate the downlink can support to maximize channel utilization. We choose to use “peak hold” averaging to evaluate the maximum spectrum density.

© 2017 SCTE-ISBE and NCTA. All rights reserved. 33
Figure 21 - Conducted Emissions Test Result Example
6.3. Receiver Sensitivity
The purpose of the Receiver Sensitivity Automated Test is to determine the minimum sensitivity based on 802.11 specification for conducted sensitivity frame error rate of 10%. This automated test case also tests sensitivity of receiver in adjacent channel and co-channel interference. This test uses the IxVeriWave Client to generate signals at the desired MCS rate for uplink to the AP under test.
The configurable inputs to the automated test are summarized as follows:
• AP band, channel, and modulation type (i.e. 5GHz channel 153, 802.11n) • MCS rate of interest (i.e. MCS 0-7, 15, 23) • Bandwidth 20/40Mhz • Frame size, data rate (i.e. 1024bytes, 1000fps) • AP input receiver sensitivity range that covers all MCS rates under test.
The test automation then performs the following measurement steps:
a. Sets AP to the desired channel power level b. Sets the IxVeriWave client to advertise the selected band, channel, modulation rate c. Connects the IxVeriWave client to the AP d. Establish an uplink flow at the desired frame and data rate e. Perform search algorithm to determine the nominal receiver sensitivity that still supports the
required frame error rate in minimum number of steps by adjusting the IxVeriWave Client output power

© 2017 SCTE-ISBE and NCTA. All rights reserved. 34
f. Records results into SQL database g. Repeats measurement for next configuration h. Test duration is approximately 7 minutes for each measurement after initial connection/setup (per
MCS under test) as up to 7 trials are run to determine the minimum sensitivity point.
One of the challenges for this test is finding the AP uplink receiver sensitivity in as few of steps as possible. We use a simple uniform binary search algorithm that minimizes the number of power levels settings for the data flow to find the desired receiver sensitivity that supports 10% or less frame error rate. Example results for receive sensitivity is shown in figure 22 below.
Figure 22 - Receiver Sensitivity Example
In case of the adjacent channel measurement, the external generator is used to simulate WiFi signal with 50% duty cycle to place on adjacent or co–channel location. The interferer signal is stepped up in power until the receiver sensitivity is degraded to specification limit.
6.4. UDP Throughput
The purpose of this test is to measure the UDP throughput for both Uplink and Downlink and compare results to theoretical rates. This test uses IxVeriWave Benchmark Throughput test and IxVeriWave Wave Automate SW to programmatically configure and run the benchmark test through simple TCL scripts.
The configurable inputs to the automated test are summarized as follows:
• AP band, channel, and modulation type (i.e. 5GHz channel 153, 802.11n) • MCS rate of interest (i.e. MCS 7, 15, 23) • Bandwidth 20/40Mhz • Frame size, data rate (i.e. 1024bytes, 1000fps)
© 2017 SCTE-ISBE and NCTA. All rights reserved. 35
• AP power steps to be measured.
The test automation then performs the following measurement steps: a. Modify the master configuration TCL file for the IxVeriWave Benchmark test. b. Sets AP to the desired channel power level. c. Invokes the TCL file to run IxVeriWave Benchmark Test via Wave Automate SW. d. IxVeriWave Benchmark test runs and generates results CSV file. e. Automation reads CSV file and records results in SQL database. f. Repeats measurement for next configuration. g. Test duration is approximately 5-6 minutes for each measurement after initial
connection/setup (per MCS/frame rate under test)
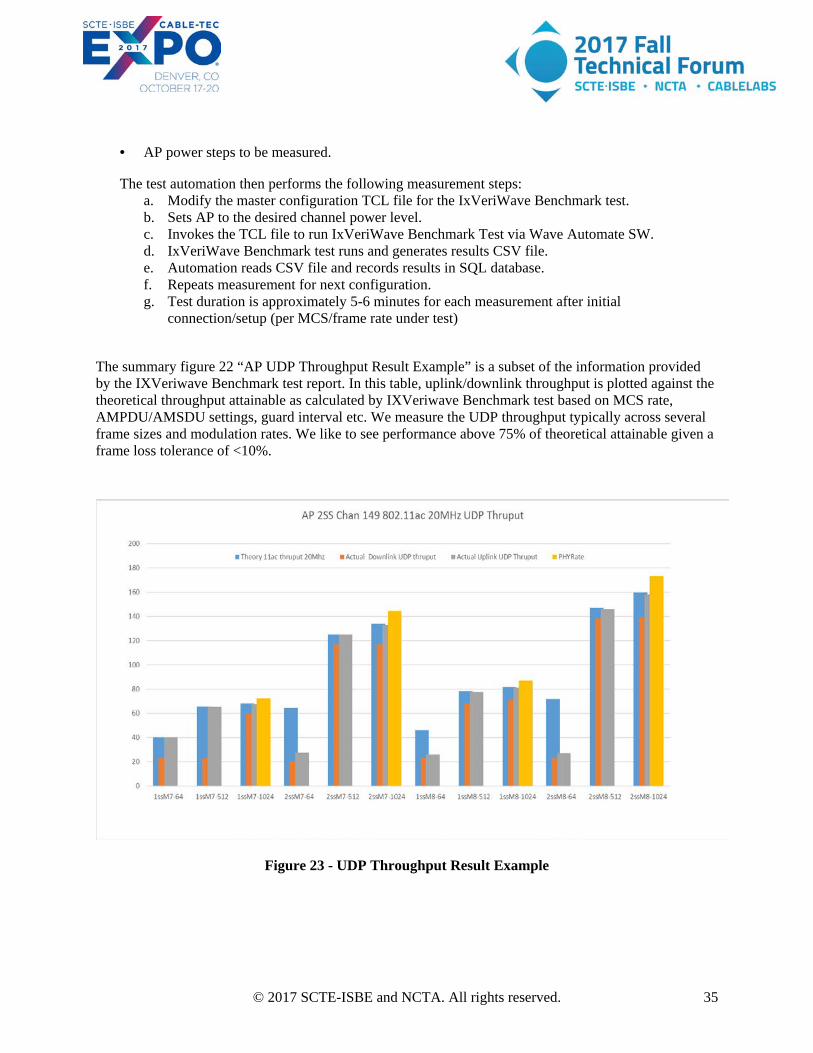
The summary figure 22 “AP UDP Throughput Result Example” is a subset of the information provided by the IXVeriwave Benchmark test report. In this table, uplink/downlink throughput is plotted against the theoretical throughput attainable as calculated by IXVeriwave Benchmark test based on MCS rate, AMPDU/AMSDU settings, guard interval etc. We measure the UDP throughput typically across several frame sizes and modulation rates. We like to see performance above 75% of theoretical attainable given a frame loss tolerance of <10%.
Figure 23 - UDP Throughput Result Example

© 2017 SCTE-ISBE and NCTA. All rights reserved. 36
6.5. Rate vs Range
The purpose of Rate vs Range test is to measure the AP downlink performance to a test client as the relative attenuation representing range is varied simulating a near client to far client.
This test is not performed with IXIA IxVeriWave products. The test is realized using an example client such as ASUS Model PCE-AC68 or Octoscope PAL2 802.11ac client. The data flow is created using I-Perf client/server and the nominal TCP throughput is measured as a function of range.
The test is fully automated within the automation framework, but the RF interconnection is modified to include a butler matrix as shown in figure 24. The butler matrix is necessary to mix samples of all radio antenna outputs from the AP to the client to support spatial stream diversity (See ref 2).
OTA SNIFFER
802.11 client
802.3 Client/
Servers PC
UUT EMI Enclosure
SHAW NETWORK
EMI Enclosure
RF
Test Automation PC
45o
45o
90o Hybrids
To
WL
CP To
DU
T
AP Under Test
Signal Analyzer
110VAC Bus Bar x6 outlet
Layer 2 Switch
RF Switch
AP RF Port 2.4Ghz
AP RF Port 5Ghz
Butler Matrix
RF
RF Attenuator x4
RF
RF
RF
Figure 24 - Rate vs Range Hardware Test Setup
The configurable inputs to the automated test are summarized as follows:
• AP band, channel, and modulation type (i.e. 5GHz channel 153, 802.11n) • Bandwidth 20/40Mhz • Frame size, data rate (i.e. 1024bytes, 1000fps) • AP power steps to be measured
The test automation then performs the following measurement steps: a. Sets AP to the desired channel power level b. Sets test client (i.e. Octoscope PAL 2) to desired configuration c. Initiates I-perf client server
© 2017 SCTE-ISBE and NCTA. All rights reserved. 37
d. Gathers client server statistics for the attenuation test step e. Repeats test for the attenuation steps desired f. Repeats measurement for the configuration g. Test duration is approximately 15 minutes for each Access Point per channel under test.
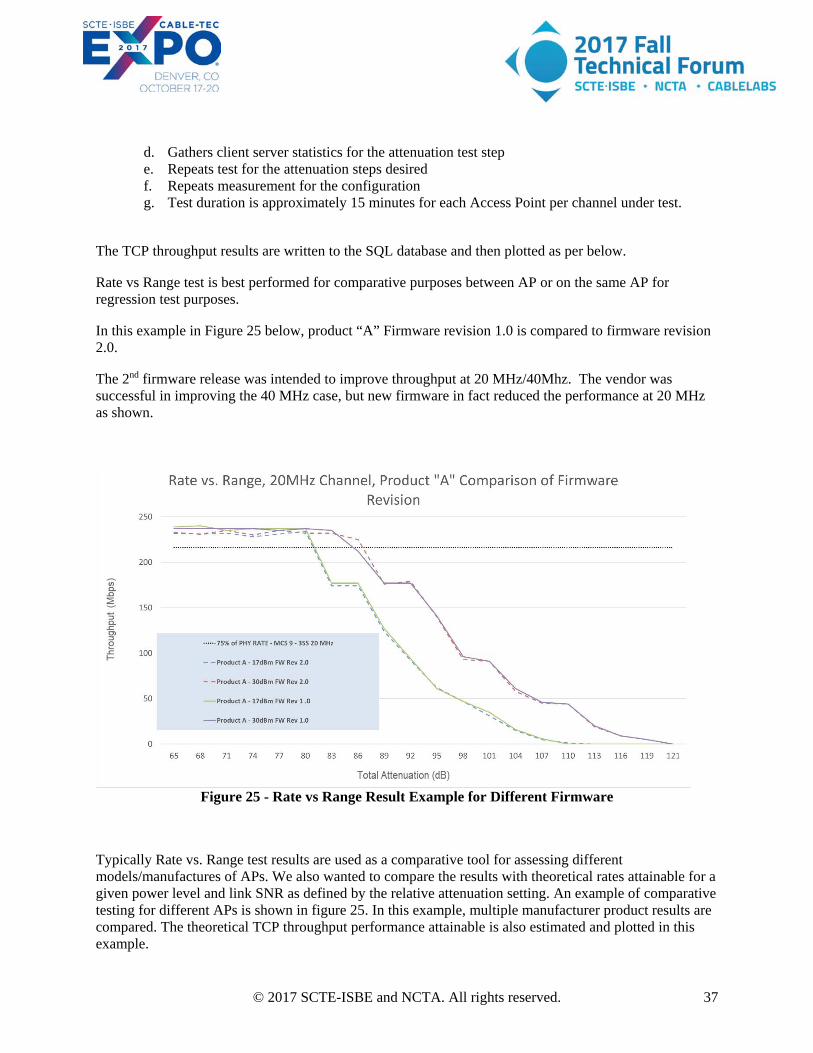
The TCP throughput results are written to the SQL database and then plotted as per below.
Rate vs Range test is best performed for comparative purposes between AP or on the same AP for regression test purposes.
In this example in Figure 25 below, product “A” Firmware revision 1.0 is compared to firmware revision 2.0.
The 2nd firmware release was intended to improve throughput at 20 MHz/40Mhz. The vendor was successful in improving the 40 MHz case, but new firmware in fact reduced the performance at 20 MHz as shown.
Figure 25 - Rate vs Range Result Example for Different Firmware
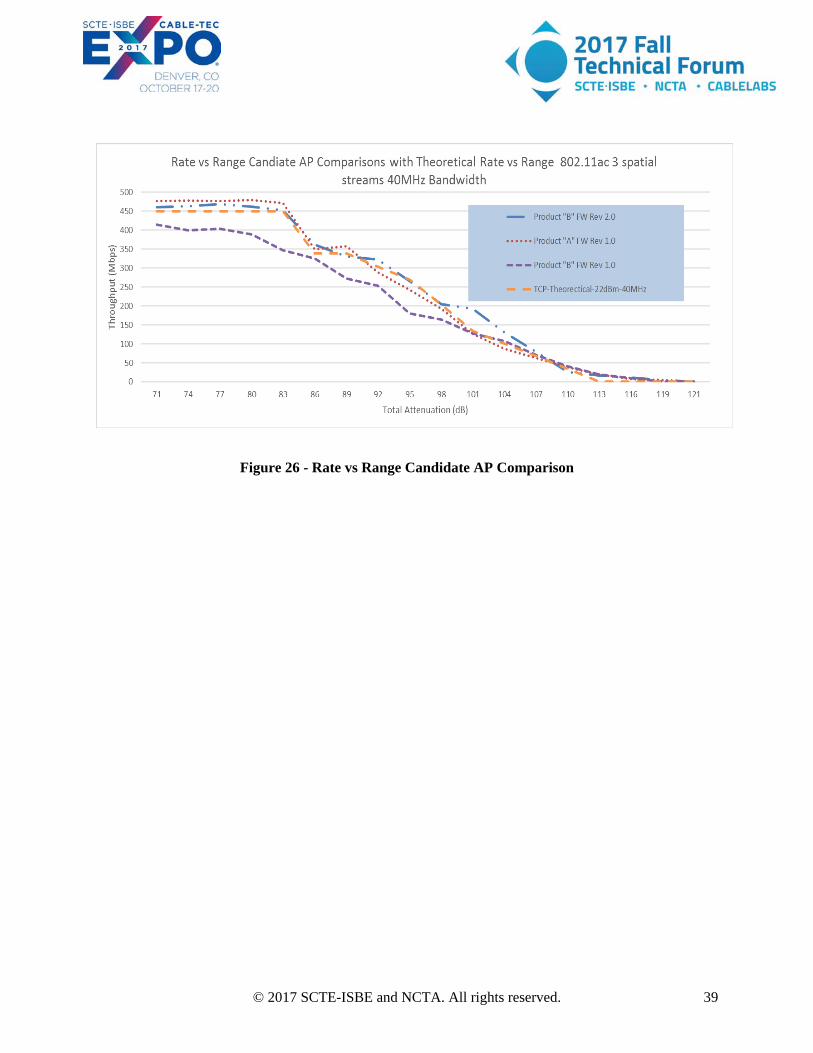
Typically Rate vs. Range test results are used as a comparative tool for assessing different models/manufactures of APs. We also wanted to compare the results with theoretical rates attainable for a given power level and link SNR as defined by the relative attenuation setting. An example of comparative testing for different APs is shown in figure 25. In this example, multiple manufacturer product results are compared. The theoretical TCP throughput performance attainable is also estimated and plotted in this example.
© 2017 SCTE-ISBE and NCTA. All rights reserved. 38
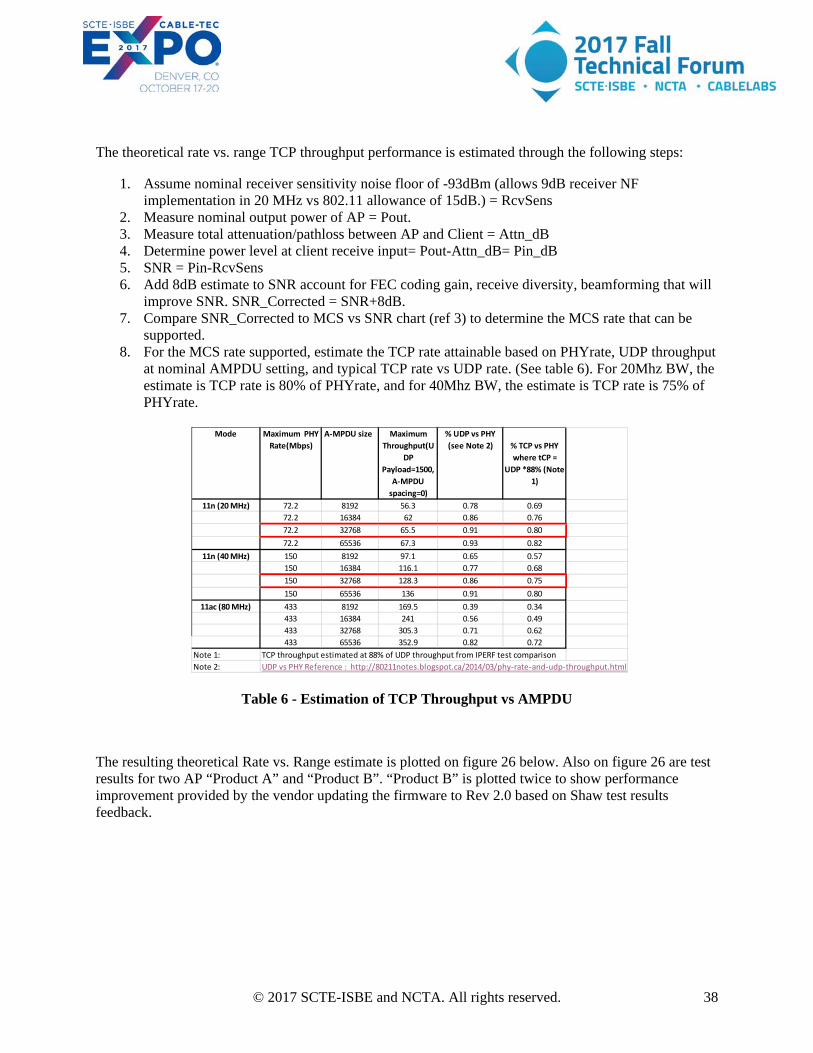
The theoretical rate vs. range TCP throughput performance is estimated through the following steps:
1. Assume nominal receiver sensitivity noise floor of -93dBm (allows 9dB receiver NF implementation in 20 MHz vs 802.11 allowance of 15dB.) = RcvSens
2. Measure nominal output power of AP = Pout. 3. Measure total attenuation/pathloss between AP and Client = Attn_dB 4. Determine power level at client receive input= Pout-Attn_dB= Pin_dB 5. SNR = Pin-RcvSens 6. Add 8dB estimate to SNR account for FEC coding gain, receive diversity, beamforming that will
improve SNR. SNR_Corrected = SNR+8dB. 7. Compare SNR_Corrected to MCS vs SNR chart (ref 3) to determine the MCS rate that can be
supported. 8. For the MCS rate supported, estimate the TCP rate attainable based on PHYrate, UDP throughput
at nominal AMPDU setting, and typical TCP rate vs UDP rate. (See table 6). For 20Mhz BW, the estimate is TCP rate is 80% of PHYrate, and for 40Mhz BW, the estimate is TCP rate is 75% of PHYrate.
Table 6 - Estimation of TCP Throughput vs AMPDU
The resulting theoretical Rate vs. Range estimate is plotted on figure 26 below. Also on figure 26 are test results for two AP “Product A” and “Product B”. “Product B” is plotted twice to show performance improvement provided by the vendor updating the firmware to Rev 2.0 based on Shaw test results feedback.
Mode Maximum PHY Rate(Mbps)
A-MPDU size Maximum Throughput(U
DP Payload=1500,
A-MPDU spacing=0)
% UDP vs PHY (see Note 2) % TCP vs PHY
where tCP = UDP *88% (Note
1)
11n (20 MHz) 72.2 8192 56.3 0.78 0.6972.2 16384 62 0.86 0.7672.2 32768 65.5 0.91 0.8072.2 65536 67.3 0.93 0.82
11n (40 MHz) 150 8192 97.1 0.65 0.57150 16384 116.1 0.77 0.68150 32768 128.3 0.86 0.75150 65536 136 0.91 0.80
11ac (80 MHz) 433 8192 169.5 0.39 0.34433 16384 241 0.56 0.49433 32768 305.3 0.71 0.62433 65536 352.9 0.82 0.72
Note 1: TCP throughput estimated at 88% of UDP throughput from IPERF test comparisonNote 2: UDP vs PHY Reference : http://80211notes.blogspot.ca/2014/03/phy-rate-and-udp-throughput.html
© 2017 SCTE-ISBE and NCTA. All rights reserved. 39
Figure 26 - Rate vs Range Candidate AP Comparison
© 2017 SCTE-ISBE and NCTA. All rights reserved. 40
6.6. Traffic Stress Test
The purpose of the Traffic Stress Test is to simulate many clients connecting to the AP over a long period of time. This simulates a real network case where an Access Point is servicing a Mall or a Train Station.
The example explained here is a test performed in the Pre-production environment the Cisco SP WiFi Network. The hardware Topology of this Network is represented in the Network Diagram shown in the figure 7 “Automation Example for WLC AP Test”.
The generation and control of multiple clients is possible using IxVeriwave chassis and ATA SW interface. The overall test sequencing is performed directly in python and will be incorporated into the RobotFramework architecture in the future.
The python program keeps a list of client MAC addresses that are connected/disconnected with nominal traffic in a controlled fashion. The rate of connection, duration of connection and packet size along with rate-of-transmission of the packets is randomized while keeping the overall aggregate throughput at a nominal rate. The detailed algorithm is shown in Figure 29.
The traffic stress test can be run continuously for a long period to flush out longer term issues such as memory leaks that cause the AP to stop functioning as expected.
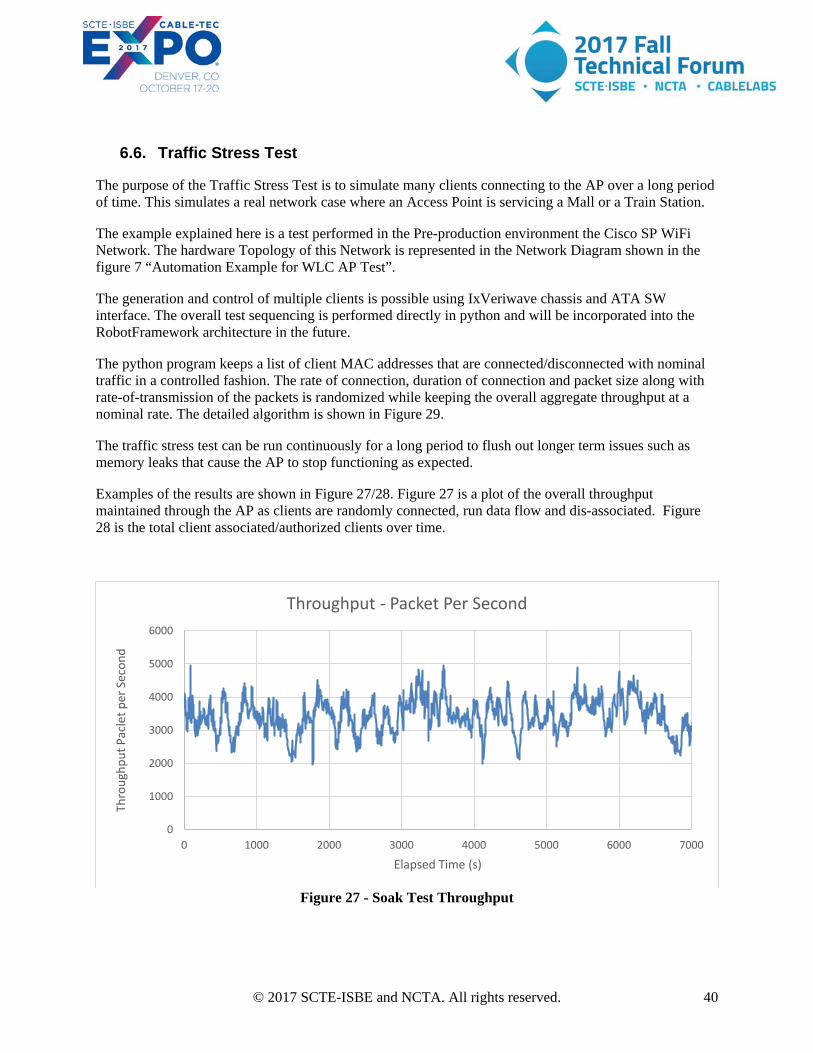
Examples of the results are shown in Figure 27/28. Figure 27 is a plot of the overall throughput maintained through the AP as clients are randomly connected, run data flow and dis-associated. Figure 28 is the total client associated/authorized clients over time.
Figure 27 - Soak Test Throughput
0
1000
2000
3000
4000
5000
6000
0 1000 2000 3000 4000 5000 6000 7000
Thro
ughp
ut P
acle
t per
Sec
ond
Elapsed Time (s)
Throughput - Packet Per Second

© 2017 SCTE-ISBE and NCTA. All rights reserved. 41
Figure 28 - Client Associations vs Time
0
10
20
30
40
50
60
70
0 1000 2000 3000 4000 5000 6000 7000
Num
ber o
f Con
nect
ed C
lient
s
Time Elapsed (s)
Connected Client vs Time (s)

© 2017 SCTE-ISBE and NCTA. All rights reserved. 42
Start
100x 11ac Clients are Setup using IxVeriwave 4x4
MIMO Card
Duration for the connected clients is
Randomized
Clients Deauth, once the timer
expires
DeAuth Clients added to the List and Recreation is
Randomized
Check test completed
its duration
End
YES
NO
Figure 29 - Soak Test Algorithm
© 2017 SCTE-ISBE and NCTA. All rights reserved. 43
Conclusion
This paper provides an insight into the test philosophy of carrier provider Shaw Communications when evaluating WiFi products for use in the network.
The 802.11 standard is a complex communications channel that supports a multitude of legacy and new products currently in the market.
Shaw has taken a tiered approach in testing of new technology at ever increasing levels of integration. Shaw has found that testing the lower components performance that is traceable to known standards is the best method to engage the vendor when non compliances are found. Given the breadth of the 802.11 standard and the multitude of test cases, Shaw has found it most expedient to develop an automation framework to simplify testing for new products and performing regression testing for product improvements.
This paper has summarized the automation approach using freeware SW that meets the requirements of being a stable test platform. Example test measurements have been discussed showing how the automated framework supports these tests. The automation framework can also be easily expanded to other test requirements for WiFi product or for other unrelated products that require such test coverage.
© 2017 SCTE-ISBE and NCTA. All rights reserved. 44
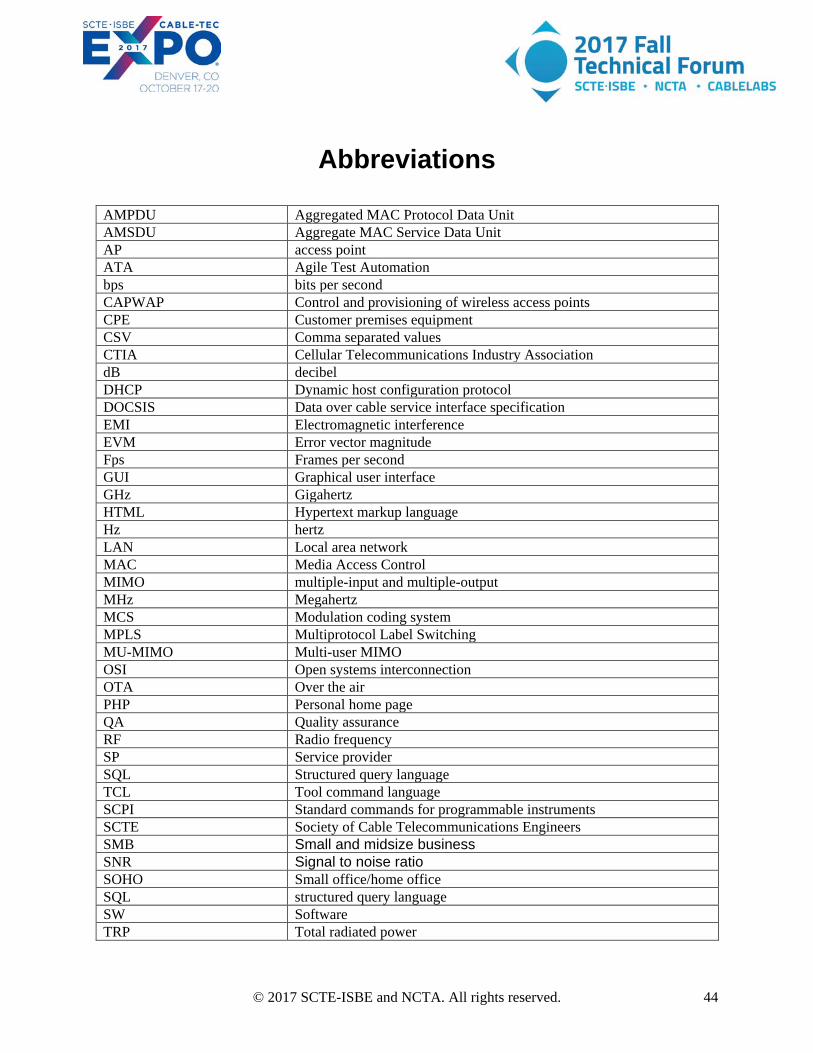
Abbreviations
AMPDU Aggregated MAC Protocol Data Unit AMSDU Aggregate MAC Service Data Unit AP access point ATA Agile Test Automation bps bits per second CAPWAP Control and provisioning of wireless access points CPE Customer premises equipment CSV Comma separated values CTIA Cellular Telecommunications Industry Association dB decibel DHCP Dynamic host configuration protocol DOCSIS Data over cable service interface specification EMI Electromagnetic interference EVM Error vector magnitude Fps Frames per second GUI Graphical user interface GHz Gigahertz HTML Hypertext markup language Hz hertz LAN Local area network MAC Media Access Control MIMO multiple-input and multiple-output MHz Megahertz MCS Modulation coding system MPLS Multiprotocol Label Switching MU-MIMO Multi-user MIMO OSI Open systems interconnection OTA Over the air PHP Personal home page QA Quality assurance RF Radio frequency SP Service provider SQL Structured query language TCL Tool command language SCPI Standard commands for programmable instruments SCTE Society of Cable Telecommunications Engineers SMB Small and midsize business SNR Signal to noise ratio SOHO Small office/home office SQL structured query language SW Software TRP Total radiated power
© 2017 SCTE-ISBE and NCTA. All rights reserved. 45
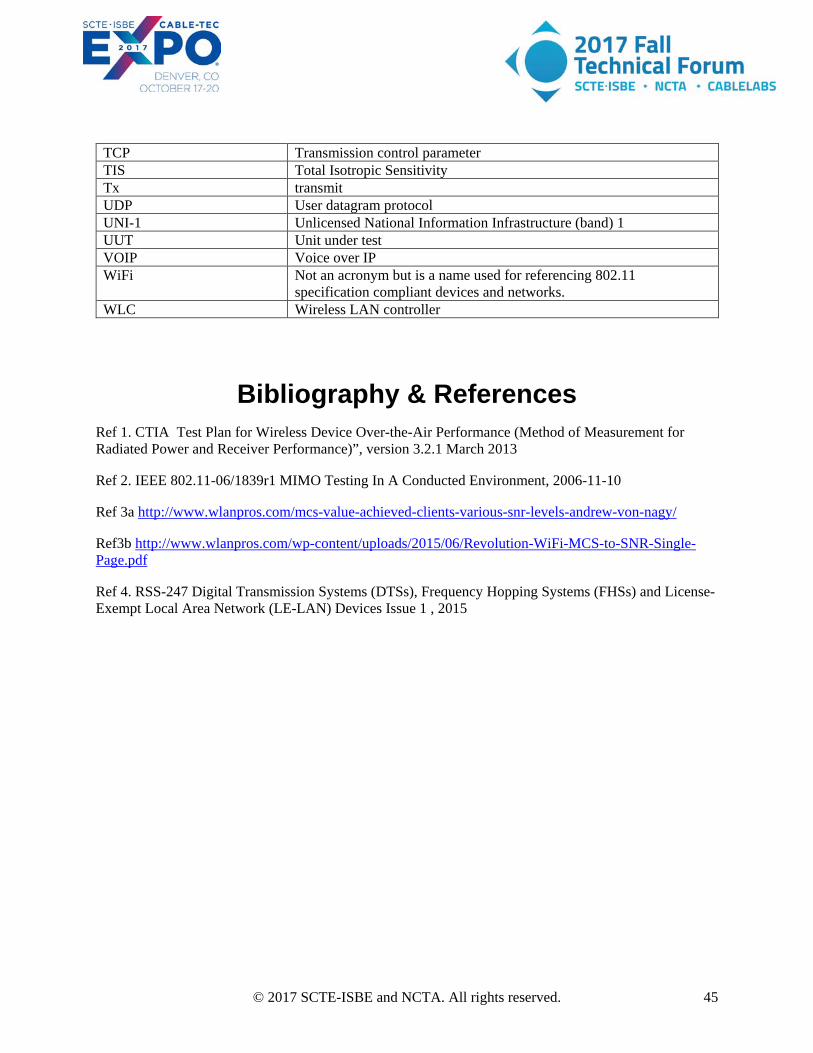
TCP Transmission control parameter TIS Total Isotropic Sensitivity Tx transmit UDP User datagram protocol UNI-1 Unlicensed National Information Infrastructure (band) 1 UUT Unit under test VOIP Voice over IP WiFi Not an acronym but is a name used for referencing 802.11
specification compliant devices and networks. WLC Wireless LAN controller
Bibliography & References
Ref 1. CTIA Test Plan for Wireless Device Over-the-Air Performance (Method of Measurement for Radiated Power and Receiver Performance)”, version 3.2.1 March 2013
Ref 2. IEEE 802.11-06/1839r1 MIMO Testing In A Conducted Environment, 2006-11-10
Ref 3a http://www.wlanpros.com/mcs-value-achieved-clients-various-snr-levels-andrew-von-nagy/
Ref3b http://www.wlanpros.com/wp-content/uploads/2015/06/Revolution-WiFi-MCS-to-SNR-Single-Page.pdf
Ref 4. RSS-247 Digital Transmission Systems (DTSs), Frequency Hopping Systems (FHSs) and License-Exempt Local Area Network (LE-LAN) Devices Issue 1 , 2015