automation alley's 2012 technology industry report
DESCRIPTION
From Rust to Resurgence: Detroit's Regional Technology EconomyTRANSCRIPT
Automation Alley’s 2012
From Rust to Resurgence: Detroit’s Regional Technology Economy

FOREWORD
INTRODUCTION
Purpose
Approach
DETROIT REGIONAL OVERVIEW
TECHNOLOGY INDUSTRY DATA
Industry Employment and Establishments
TECHNOLOGY OCCUPATION DATA
Occupational Employment
INNOVATION INDICATORS
Patent Activity
STEM Education
Appendix A: About Anderson Economic Group
Appendix B: Data Sources
04
08
10
12
16
19
23
23

Innovation has many origins.
The conference room, certainly — but also the classroom and the inventor’s workshop.
So for this year’s Technology Industry Report, we’ve taken a step back to give you a broader view of the region’s innovation landscape.
We’ve included data on two important “Innovation Indicators” — patent activity and science, technology, engineering and mathematics (STEM) education—in addition to data on technology industry employment, technology establishments and technology occupation employment.
Building a bright technology future for our state requires more than just increased job creation in the technology sector. It requires a steady stream of educated minds flowing from our colleges and universities, equipped to fill the tech positions of tomorrow. It requires an army of creative individuals, developing and patenting the technologies of the future.
And here’s the exciting news: the Greater Detroit region is a national leader in both areas. Of the 14 national technology hubs analyzed in the report, Greater Detroit ranks first in the number of engineering and engineering technologies degrees completed at colleges and universities in the region and third in the number of STEM degrees completed, trailing only Chicago and Boston. And among the nine Midwest regions, we rank third in the number of utility patents awarded, after Chicago and Minneapolis.
In other key measures, metro Detroit remains the leading tech hub in the nation. Again, we are first in advanced automotive sector employment. We lead the pack with more engineers than any other region analyzed.
In some areas, we have advanced in rank. Last year, the Greater Detroit region was ranked second nationally in the number of people working in architectural and engineering occupations, after San Jose’s Silicon Valley region. This year, we are the national leader, having added 3,500 jobs in that category.
Every day at Automation Alley, businesses from around metro Detroit share exciting anecdotal evidence of the region’s emersion from the recession, providing plenty of fuel for an optimistic outlook. But the data presented here is hard evidence of the region’s leadership position and global reach in the technology industry. That’s fuel for rebuilding a reputation.
My hope is that the media and business leaders of Southeast Michigan will use this information to set the record straight, to tell the real story. Our region is a hub for innovation, and as we continue to generate cutting edge technologies and sustainable businesses, we are demonstrating our ability to tap into the diverse origins of innovation.
Because without the conference room, the classroom and the inventor’s workshop, Southeast Michigan would not be where it is today: driving the evolution of technology in the Midwest and beyond.
Ken RogersExecutive Director,Automation Alley

04 AUTOMATION ALLEY’S 2012 TECHNOLOGY INDUSTRY REPORT
For much of the country, moving from recession to recovery has been more challenging than expected, as slow economic growth and persistent unemployment remain burdens. The Detroit area, however, appears back on the path to prosperity, with the technology sector providing a foundation for continued recovery and growth.
In this report, we present the results of the most detailed analysis of the technology economy in leading technology hubs across the United States. Using the most current data available, we measured establishment counts, employment by industry and employment by occupation for the metro Detroit area. Additional data on postsecondary educational attainment in science, technology, engineering and mathematics (STEM) fields and patents issued were also analyzed and benchmarked. Together, these data provide a complete picture of the region’s technology sector as the “Great Recession” gave way to recovery and an indicator of potential expansion for coming years.
Our analysis shows the Detroit region is securely positioned as a leading technology center, both in the Midwest and nationally. The data further show signs that the region is poised for technology-related growth that outpaces other leading tech hubs.
OUR ANALYSIS SHOWS THE DETROIT REGION IS SECURELY POSITIONED AS A LEADING TECHNOLOGY CENTER, BOTH IN THE MIDWEST AND NATIONALLY.
AUTOMATION ALLEY’S 2012 TECHNOLOGY INDUSTRY REPORT 05
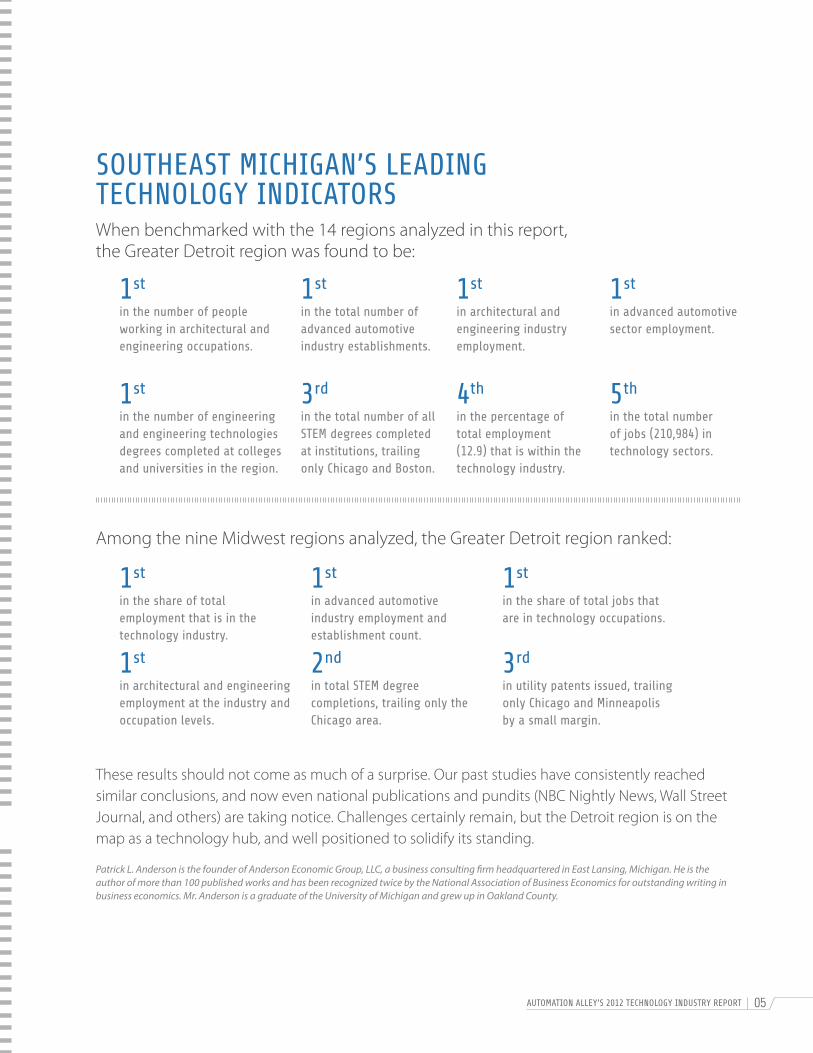
These results should not come as much of a surprise. Our past studies have consistently reached similar conclusions, and now even national publications and pundits (NBC Nightly News, Wall Street Journal, and others) are taking notice. Challenges certainly remain, but the Detroit region is on the map as a technology hub, and well positioned to solidify its standing.
Patrick L. Anderson is the founder of Anderson Economic Group, LLC, a business consulting firm headquartered in East Lansing, Michigan. He is the author of more than 100 published works and has been recognized twice by the National Association of Business Economics for outstanding writing in business economics. Mr. Anderson is a graduate of the University of Michigan and grew up in Oakland County.
When benchmarked with the 14 regions analyzed in this report, the Greater Detroit region was found to be:
Among the nine Midwest regions analyzed, the Greater Detroit region ranked:
1st
in the number of people working in architectural and engineering occupations.
1st
in the total number of advanced automotive industry establishments.
1st
in architectural and engineering industry employment.
1st
in advanced automotive sector employment.
1st
in the number of engineering and engineering technologies degrees completed at colleges and universities in the region.
3rd
in the total number of all STEM degrees completed at institutions, trailing only Chicago and Boston.
4th
in the percentage of total employment (12.9) that is within the technology industry.
5th
in the total number of jobs (210,984) in technology sectors.
1st
in the share of total employment that is in the technology industry.
1st
in advanced automotive industry employment and establishment count.
1st
in the share of total jobs that are in technology occupations.
1st
in architectural and engineering employment at the industry and occupation levels.
2nd
in total STEM degree completions, trailing only the Chicago area.
3rd
in utility patents issued, trailing only Chicago and Minneapolis by a small margin.
SOUTHEAST MICHIGAN’S LEADINGTECHNOLOGY INDICATORS

06 AUTOMATION ALLEY’S 2012 TECHNOLOGY INDUSTRY REPORT
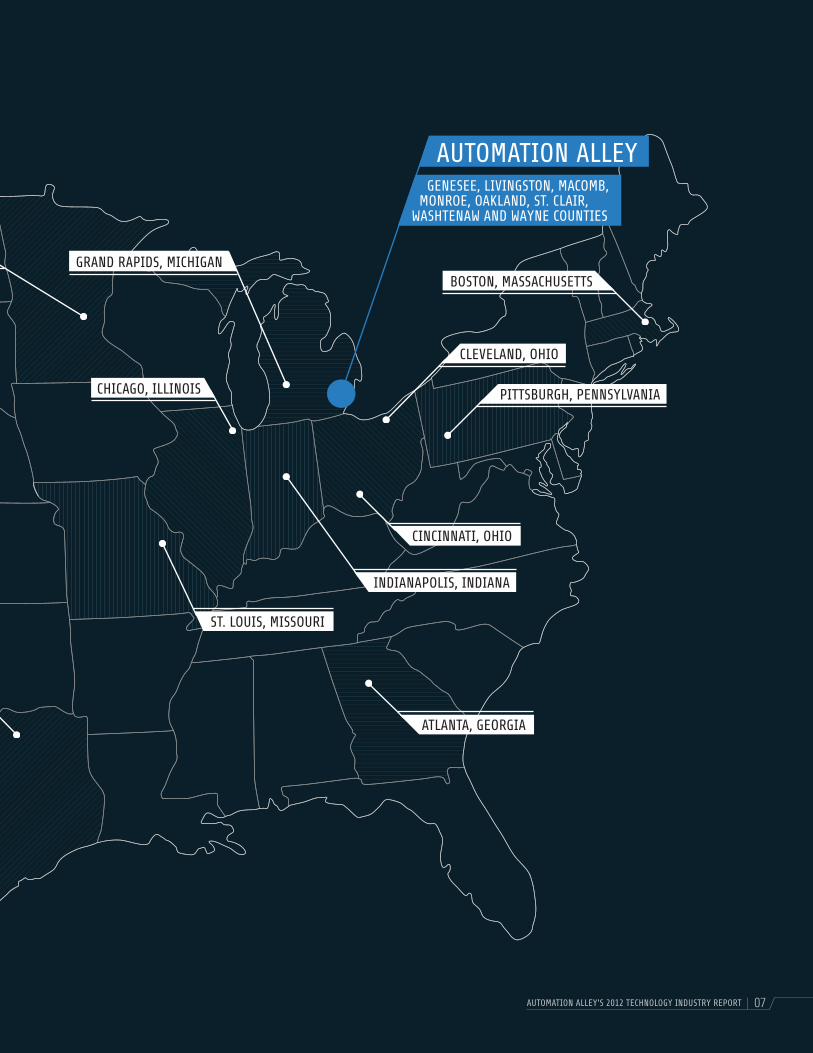
Note: Automation Alley’s geographic footprint includes the City of Detroit and eight counties in Southeast Michigan: Genesee, Livingston, Macomb, Monroe, Oakland, St. Clair, Washtenaw, and Wayne. This report includes data representative of the Detroit-Warren-Livonia MSA and the Ann Arbor MSA.
METROPOLITAN STATISTICAL AREAS (MSAs) USED IN ANALYSIS
MINNEAPOLIS-ST. PAUL, MINNESOTA
BOSTON, MASSACHUSETTS
GENESEE, LIVINGSTON, MACOMB, MONROE, OAKLAND, ST. CLAIR,WASHTENAW AND WAYNE COUNTIES
ST. LOUIS, MISSOURI
CHICAGO, ILLINOIS
ATLANTA, GEORGIA
CINCINNATI, OHIO
INDIANAPOLIS, INDIANA
PITTSBURGH, PENNSYLVANIA
CLEVELAND, OHIO
GRAND RAPIDS, MICHIGAN
AUTOMATION ALLEY
AUSTIN, TEXAS
DALLAS-FORT WORTH, TEXAS
SEATTLE, WASHINGTON
SAN JOSE-SANTA CLARA, CALIFORNIA
AUTOMATION ALLEY’S 2012 TECHNOLOGY INDUSTRY REPORT 07
MINNEAPOLIS-ST. PAUL, MINNESOTA
BOSTON, MASSACHUSETTS
GENESEE, LIVINGSTON, MACOMB, MONROE, OAKLAND, ST. CLAIR,WASHTENAW AND WAYNE COUNTIES
ST. LOUIS, MISSOURI
CHICAGO, ILLINOIS
ATLANTA, GEORGIA
CINCINNATI, OHIO
INDIANAPOLIS, INDIANA
PITTSBURGH, PENNSYLVANIA
CLEVELAND, OHIO
GRAND RAPIDS, MICHIGAN
AUTOMATION ALLEY
AUSTIN, TEXAS
DALLAS-FORT WORTH, TEXAS
SEATTLE, WASHINGTON
SAN JOSE-SANTA CLARA, CALIFORNIA

08 AUTOMATION ALLEY’S 2012 TECHNOLOGY INDUSTRY REPORT
1. Grand Rapids is included to provide an in-state benchmark, even though the MSA has a relatively low population level.
PURPOSEWith the dust still settling from the “Great Recession,” and uncertainty still lingering over national and international economies, metro Detroit has continued forward with a focus on maintaining and expanding its tech-oriented economy. This report provides a benchmark for these efforts, using industry, occupation, education and patent data to measure the region’s standing relative to other major technology economies and to identify prospects for continued growth.
APPROACHThe economy’s technology sector, as discussed in this report, includes businesses that have tech-oriented products and processes, as well as workers who have technical occupations. The businesses make up an industry and the workers make up a workforce. In order to analyze both the industry and workforce of the technology sector, data was collected from the U.S. Census Bureau and the Bureau of Labor Statistics. Additional data from the National Center for Education Statistics and the U.S. Patent and Trademark Office are also included as measures of technological progress and preparation for continued growth.
Metropolitan AreasFor this report, as with the 2011 report, we benchmark the technology sector in metro Detroit. In order to do this, we have included industry and occupational data for 14 other metropolitan areas in the United States, the same used in the previous report. New in this year’s report are data on STEM degree awards and patent activity. The benchmark regions, defined as Metropolitan Statistical Areas (MSAs) by the U.S. Census Bureau, are shown on the map on the previous page. The areas were selected for the 2011 report, and remained for this report, as they represent national and Midwestern centers of population and industry similar to metro Detroit based on location or population.1

AUTOMATION ALLEY’S 2012 TECHNOLOGY INDUSTRY REPORT 09
Industry DataIn order to assess an industry, it is necessary to provide a definition of the industry. For the technology industry, we derived a definition that is based on North American Industry Classification System (NAICS) codes. The definition is inclusive of sectors of business that rely on a significant use of technical knowledge and applications in their work.2 These sectors include:
1) Advanced Automotive2) Advanced Manufacturing3) Chemical and Material4) Information Technology5) Life Sciences6) Related and Other Technology
This study uses industry data from the U.S. Census Bureau’s 2012 County Business Patterns data set and is representative of conditions in 2010. Data on employment levels and establishment counts, by region and industry sector, are the primary variables used in this report.
Occupation DataIndustries become technology-oriented because of workers developing new tools and techniques for improving processes and products. Advancements like these are often developed by employees working in science, engineering and mathematics.3 These fields fall into four occupational categories:
1) Computer and Math Sciences 2) Architecture and Engineering3) Life, Physical, and Social Science4) Computer, Information Systems, Engineering and Natural Science Management
Employment data for each of these occupation fields is provided by the U.S.
Bureau of Labor Statistics through its Occupational Employment Statistics Survey. This study uses data representative of conditions in 2011 from the most recently published data set.
Industry and Occupation AnalysisWe present industry and occupation data in this report in pure terms, like the total number of jobs, and in relative terms, like the share of total jobs in one sector. An important relative measure is the Location Quotient (LQ), especially when comparing pure terms to previous years and reports. An LQ is the ratio between an area’s share of employment in an industry and a larger area’s share of employment in that industry. For example, if an MSA has an LQ of three compared to the nation, this indicates that the MSA’s percentage of employment in a specific field is three times the national percentage in that field.
Education and Patent DataWhile occupational and employment data provide important measures of current technology sector conditions, we also look to patent and education attainment data to provide indicators of future conditions in the industry. Specifically, the National Center for Education Statistics’ Integrated Postsecondary Education Data System (IPEDS), provides college and university degree data, which we collected for the science, technology, engineering and mathematics (STEM) fields of study. The most recent data, from the 2008-2009 academic year, was used for this report. The U.S. Patent and Trademark Office also publishes the number of patents awarded within each metropolitan area, and this data for 2010 is included.
2. The definition used in this report is consistent with that used in our prior technology industry assessments. It was first developed by Anderson Economic Group in 2005 for an analysis of the industry in Automation Alley, and was published in “Automation Alley’s First Annual Technology Industry Report: Driving Southeast Michigan Forward,” 2005.
3. These fields are often cited as STEM (science, technology, engineering, and mathematics) fields, which both the U.S. National Research Council and the National Science Foundation consider to be core technological underpinnings of an advanced society.

10 AUTOMATION ALLEY’S 2012 TECHNOLOGY INDUSTRY REPORT
For this report, we focus on the City of Detroit and the surrounding counties in Southeast Michigan. Lapeer, Livingston, Macomb, Oakland, St. Clair, Washtenaw, and Wayne counties are included in this area.
Industry and occupational data used in this report are not always available for each individual county. Because of this, we combine the Detroit-Warren-Livonia MSA and Ann Arbor MSA to be representative of the Greater Detroit region.4
REGION’S GLOBAL CONNECTIVITY
4. Lapeer County is included in the Detroit MSA and is not part of the Automation Alley region. Data for the Monroe and Flint MSAs, while available, often proves incomplete due to low sampling sizes and as such was not included in the analysis.
5. U.S. Department of Transportation Research and Innovative Technology Administration Bureau of Transportation Statistics TransBorder Freight Data.
6. World Port Source, www.worldportsource.com, accessed on April 12, 2012.
7. U.S. Department of Transportation Research and Innovative Technology Administration Bureau of Transportation Statistics TransBorder Freight Data.
8. Federal Aviation Administration Passenger Boarding and All-Cargo Data.
The Detroit region is very close in proximity to several other major markets. Major interstates including I-94, I-75 and I-96, as well as extensive road networks, connect the region to the rest of the United States. The area is only a few hours’ drive from Toledo and Cleveland, Ohio; Chicago, Illinois; and Toronto, Ontario. The Ambassador Bridge, Detroit-Windsor Tunnel and Blue Water Bridge in Port Huron also make the region a connector for the United States and Canada.
In 2011, $98.4 billion in trade crossed the U.S. border in Detroit via truck, the highest amount for truck border crossings for U.S.-Canada trade. In Port Huron, just under $47.7 billion in trade crossed via truck in 2011, the third highest amount for truck crossing for U.S.-Canada trade. Detroit had the second highest amount of U.S.- NAFTA trade by truck in 2011, $98.7 billion (trailing only Laredo, Texas). Port Huron had the fifth highest amount, with over $47.7 billion of U.S.-NAFTA trade by truck.5
Rail and water networks also facilitate trade between the region and the rest of the world. The Port of Detroit
spans 35 acres along the Detroit River, providing an international shipping port for businesses in Greater Detroit. In 2010, more than $957 million in goods were imported through the Detroit/Wayne County Port and more than $1.8 billion were exported. At the Port of Port Huron in St. Clair County, an additional $88 million in goods were imported in 2010 and $1.3 billion were exported.6 Port Huron had the highest amount of U.S.-Canada trade for train crossings, with $26.2 billion in 2011. Detroit had second highest in 2011, with $21.3 billion in trade via train crossings.7
There are several airports that service the region, making travel for leisure or business convenient. In 2010, Detroit Metro Airport serviced more than 15 million passengers, making it the 15th busiest primary airport in the country.8 Other regional airports include Willow Run in Wayne County, Bishop International in Genesee County and Oakland County International in Oakland County.

AUTOMATION ALLEY’S 2012 TECHNOLOGY INDUSTRY REPORT 11
2011 Metropolitan Area Populations
CHICAGO9,504,753
SEATTLE3,500,026
SAN JOSE1,865,450
MINNEAPOLIS-ST. PAUL3,318,486
ST. LOUIS2,817,355
METRO DETROIT4,633,794
CLEVELAND2,068,283
PITTSBURGH2,359,746
DALLAS-FORT WORTH6,526,548
AUSTIN1,783,519
BOSTON4,591,112
ATLANTA5,359,205
INDIANAPOLIS1,778,568
GRAND RAPIDS779,604
CINCINNATI2,138,038
POPULATIONThe Greater Detroit region ranks as the fourth largest in terms of total population compared to the 14 metro regions that are analyzed in this report. The 2011 population for the region was 4.21 million, which accounts for 1.4 percent of the entire U.S. population. This was second in the Midwest, behind Chicago with a 2011 population of 9.5 million people.
12 AUTOMATION ALLEY’S 2012 TECHNOLOGY INDUSTRY REPORT
Technology is used in daily operations across almost every industry. However, there are some industries that are of a technical nature in their processes and products. These businesses fall within six sub-sectors that comprise the overall technology industry.
Technology Industry Sub-Sectors1) Advanced Automotive2) Advanced Manufacturing3) Chemical and Material
It is important to note that while the businesses are in the technology industry, not all of the employees hold technology jobs. Employees within businesses in the technology industry can be accountants, custodians and sales people — jobs that are not technical by nature but are involved with the technological processes and products that are central to the technical business.
INDUSTRY EMPLOYMENT AND ESTABLISHMENTSJobsMetro Detroit was home to 210,984 employees who worked for businesses in the technology industry in 2010, making it a leader in overall technology employment. Of the 14 other regional economies that were analyzed in this report, only four had more technology industry jobs than metro Detroit, including Chicago, Dallas, Boston and San Jose. Among the economies in the Midwest, metro Detroit ranked second behind Chicago. These positions held steady from the 2008 figures reported in our last report. See Figure 1, “Technology Industry Employment by Region (2010),” on page 13.
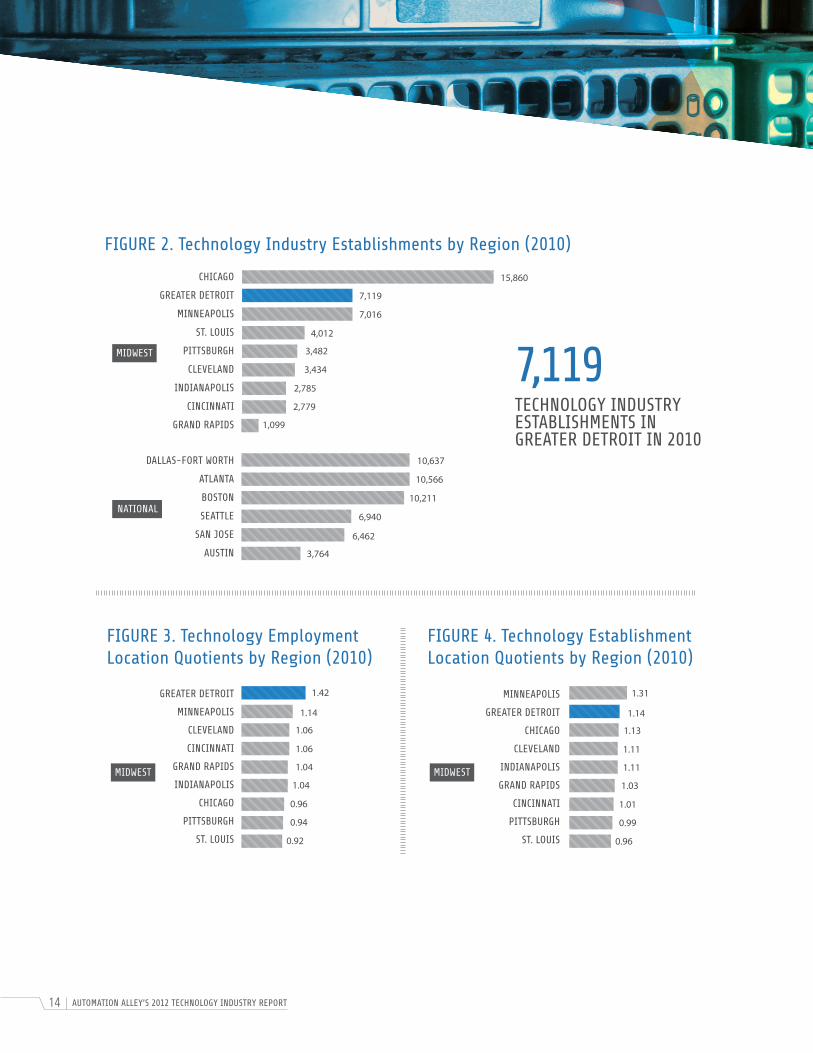
EstablishmentsIn 2010, there were 7,119 technology-industry business establishments in the region, which was second most in the Midwest, again behind Chicago. Establishment counts provide a measure of an industry’s potential for short-term growth, especially in a period of recovery, as existing businesses will likely be the first to resume hiring. Among the 15 markets analyzed, only four had more technology-industry establishments (Chicago, Dallas, Atlanta and Boston, respectively). The Greater Detroit region surpassed the remaining 10 regions analyzed in the number of technology establishments, including Minneapolis, Seattle and San Jose. See Figure 2, “Technology Industry Establishments by Region (2010),” on page 14.
4) Information Technology5) Life Sciences6) Related and Other Technology

AUTOMATION ALLEY’S 2012 TECHNOLOGY INDUSTRY REPORT 13
FIGURE 1. Technology Industry Employment by Region (2010)
RELATIVE SHARE OF ECONOMYJobsMetro Detroit’s 210,984 technology jobs represented 12.9 percent of the total 1.63 million jobs in the region in 2010. Nationally, only 6 percent of all jobs were in the technology industry, which implies a technology jobs location quotient (LQ) of 1.42 for the region.
Based on this data, metro Detroit had the highest concentration of 2010 technology sector employment among Midwest regions analyzed in this report, with the second highest score being a 1.14 for Minneapolis. Chicago, the regional leader in total technology jobs, had an LQ of 0.96, implying that the area had fewer technology jobs relative to total industry employment that was observed throughout the nation as a whole.
EstablishmentsMetro Detroit’s technology business establishments accounted for 6.8 percent of all establishments in 2010. The national average was 6 percent, which gives the Detroit region an LQ of 1.14 on the establishment side. This lower
LQ score, relative to the jobs LQ, is evidence that many of the establishments in the region employed larger numbers of people, whereas nationally, technology establishments, on average, tend to be smaller in terms of employment.
Of the Midwest regions we analyzed, only Minneapolis had a higher technology establishment LQ (1.31) than metro Detroit. San Jose (with an LQ of 2.41) led the nation, while Austin, Boston and Atlanta also posted establishment LQs above metro Detroit. Again, this data suggests that technology businesses in the Greater Detroit region are larger in terms of employment levels than are technology establishments in markets that have an establishment LQ exceeding the employment LQ. A strong advanced automotive sector is central to the larger technology establishment sizes in metro Detroit.
210,984TECHNOLOGY INDUSTRY JOBS IN GREATER DETROIT IN 2010
210,984
84,834
208,231
98,631
286,284
70,206
88,616
164,109
294,487
84,417
203,840
88,405
235,376
30,090
331,742
MIDWEST
NATIONAL
CHICAGO
GREATER DETROIT
MINNEAPOLIS
ST. LOUIS
PITTSBURGH
CINCINNATI
CLEVELAND
INDIANAPOLIS
GRAND RAPIDS
DALLAS-FORT WORTH
BOSTON
SAN JOSE
ATLANTA
SEATTLE
AUSTIN
14 AUTOMATION ALLEY’S 2012 TECHNOLOGY INDUSTRY REPORT
7,119TECHNOLOGY INDUSTRY ESTABLISHMENTS IN GREATER DETROIT IN 2010
FIGURE 2. Technology Industry Establishments by Region (2010)
15,860
7,119
3,434
6,940
4,012
10,566
2,779
3,764
7,016
10,637
2,785
6,462
3,482
10,211
1,099
FIGURE 3. Technology Employment Location Quotients by Region (2010)
1.14
1.04
1.06
0.94
1.06
0.96
1.04
0.92
1.42
FIGURE 4. Technology Establishment Location Quotients by Region (2010)
1.14
1.03
1.11
0.99
1.13
1.01
1.11
0.96
1.31
MIDWEST
MIDWEST MIDWEST
NATIONAL
CHICAGO
GREATER DETROIT
MINNEAPOLIS
ST. LOUIS
PITTSBURGH
CLEVELAND
INDIANAPOLIS
CINCINNATI
GRAND RAPIDS
DALLAS-FORT WORTH
ATLANTA
BOSTON
SEATTLE
SAN JOSE
AUSTIN
GREATER DETROIT
MINNEAPOLIS
CLEVELAND
CINCINNATI
GRAND RAPIDS
INDIANAPOLIS
CHICAGO
PITTSBURGH
ST. LOUIS
MINNEAPOLIS
GREATER DETROIT
CHICAGO
CLEVELAND
INDIANAPOLIS
GRAND RAPIDS
CINCINNATI
PITTSBURGH
ST. LOUIS
AUTOMATION ALLEY’S 2012 TECHNOLOGY INDUSTRY REPORT 15
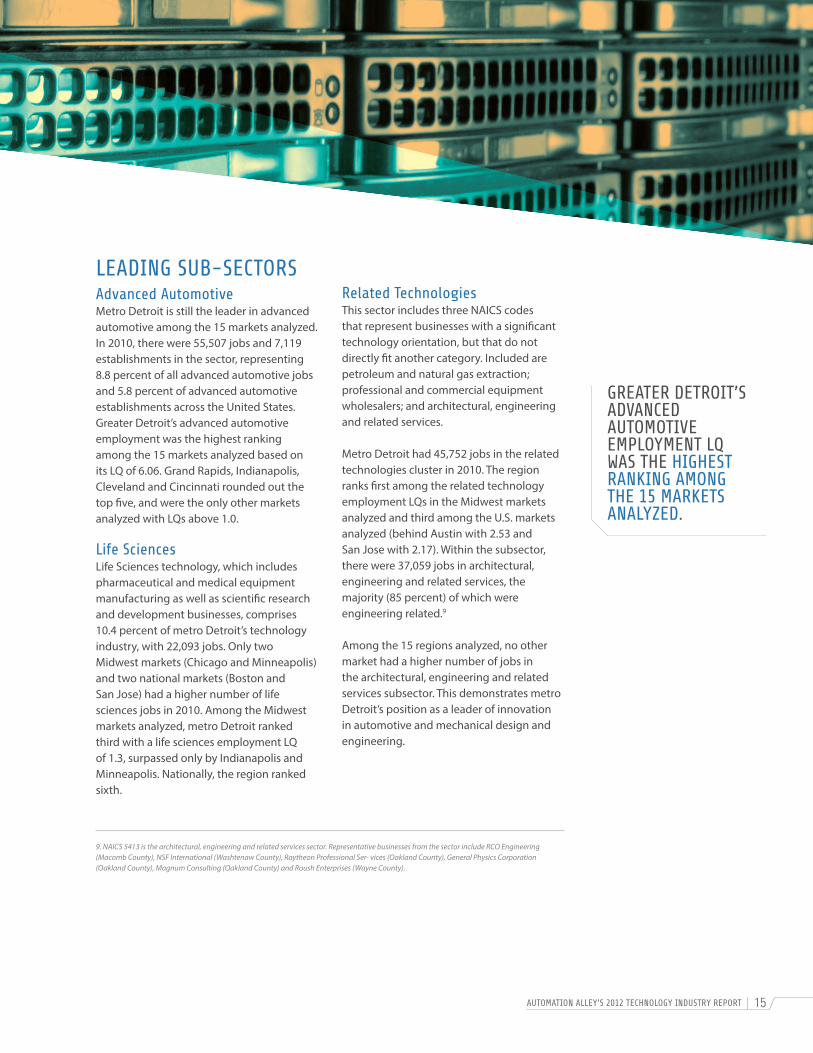
LEADING SUB-SECTORSAdvanced AutomotiveMetro Detroit is still the leader in advanced automotive among the 15 markets analyzed. In 2010, there were 55,507 jobs and 7,119 establishments in the sector, representing 8.8 percent of all advanced automotive jobs and 5.8 percent of advanced automotive establishments across the United States. Greater Detroit’s advanced automotive employment was the highest ranking among the 15 markets analyzed based on its LQ of 6.06. Grand Rapids, Indianapolis, Cleveland and Cincinnati rounded out the top five, and were the only other markets analyzed with LQs above 1.0.
Life SciencesLife Sciences technology, which includes pharmaceutical and medical equipment manufacturing as well as scientific research and development businesses, comprises 10.4 percent of metro Detroit’s technology industry, with 22,093 jobs. Only two Midwest markets (Chicago and Minneapolis) and two national markets (Boston and San Jose) had a higher number of life sciences jobs in 2010. Among the Midwest markets analyzed, metro Detroit ranked third with a life sciences employment LQ of 1.3, surpassed only by Indianapolis and Minneapolis. Nationally, the region ranked sixth.
Related TechnologiesThis sector includes three NAICS codes that represent businesses with a significant technology orientation, but that do not directly fit another category. Included are petroleum and natural gas extraction; professional and commercial equipment wholesalers; and architectural, engineering and related services.
Metro Detroit had 45,752 jobs in the related technologies cluster in 2010. The region ranks first among the related technology employment LQs in the Midwest markets analyzed and third among the U.S. markets analyzed (behind Austin with 2.53 and San Jose with 2.17). Within the subsector, there were 37,059 jobs in architectural, engineering and related services, the majority (85 percent) of which were engineering related.9
Among the 15 regions analyzed, no other market had a higher number of jobs in the architectural, engineering and related services subsector. This demonstrates metro Detroit’s position as a leader of innovation in automotive and mechanical design and engineering.
GREATER DETROIT’SADVANCED AUTOMOTIVE EMPLOYMENT LQ WAS THE HIGHEST RANKING AMONG THE 15 MARKETS ANALYZED.
9. NAICS 5413 is the architectural, engineering and related services sector. Representative businesses from the sector include RCO Engineering (Macomb County), NSF International (Washtenaw County), Raytheon Professional Ser- vices (Oakland County), General Physics Corporation (Oakland County), Magnum Consulting (Oakland County) and Roush Enterprises (Wayne County).

16 AUTOMATION ALLEY’S 2012 TECHNOLOGY INDUSTRY REPORT
Having a technology occupation does not necessarily mean working in the technology industry. A hospital likely employs database administrators, but because hospitals are not part of the technology industry, those employees are not measured by our industry analysis in “Technology Industry Data” on page 12. However, occupational employment data is available by MSA. This allows us to analyze technology-oriented workforce by occupation category. The four categories are below.
Technology Occupation Categories1) Computer and Math Sciences2) Architecture and Engineering3) Life, Physical and Social Science4) Computer, Information Systems, Engineering and Natural Science Management
These occupations represent four of the 23 occupational categories defined by the U.S. Bureau of Labor Statistics Occupational Employment Statistics’ Survey. Our report uses data representative of conditions in 2011, from the most recently published data set.
OCCUPATIONAL EMPLOYMENTNumber of JobsMetro Detroit had a total of 156,400 technology occupation jobs in 2011, ranking in the top half of the 15 regional economies that were analyzed in this report. Chicago was the only midwest region with more technology occupation jobs than metro Detroit. See Figure 5, “Occupational Employment Levels,” on page 18.
Relative Share of EconomyThe Greater Detroit region’s 156,400 technology occupation jobs represented 8.2 percent of the total 1,906,180 jobs in the region in 2011. Nationally, only 5.7 percent of all jobs were in a technology occupation, which implies a technology occupation LQ of 1.44 for the region.
The number of technology occupation jobs in metro Detroit was the same in 2009 and 2011; however, it was lower in 2010.10 In 2011, the total number of technology jobs increased back to the 2009 level of 156,400. From 2009 to 2010, the number of technology sector jobs compared to total employment in the region and the LQ
10.AEG’s 2011 report for Automation Alley used 2009 occupational data from the U.S. Bureau of Labor Statistics.

AUTOMATION ALLEY’S 2012 TECHNOLOGY INDUSTRY REPORT 17
GREATER DETROIT HAD THE STRONGEST CONCENTRATION OF TECHNOLOGY OCCUPATION JOBS AMONG THE MIDWEST REGIONS ANALYZED IN THIS REPORT.
decreased (8.0 percent to 7.8 percent and 1.39 to 1.38). In 2011, industry sector employment as a percentage of the total employment was the highest of the three years at 8.2 percent, despite the same number of technology occupation jobs as in 2009. The 1.44 LQ for metro Detroit in 2011 was also the region’s highest of the three years and indicates that the region’s technology occupation jobs are becoming increasingly concentrated relative to the nation.
Greater Detroit had the strongest concentration of technology occupation jobs among the Midwest regions analyzed in this report. Of the national markets we assessed, San Jose (LQ of 3.42), Seattle (1.98), Austin (1.80) and Boston (1.77) had stronger technology occupation concentrations than Metro Detroit. Chicago, the regional leader in total technology occupation jobs, had an LQ of less than 1.0, implying that the area had fewer technology occupation jobs relative to total occupation employment that was observed throughout the nation as a whole. See Figure 6 on page 18.
LEADING SUB-SECTORSArchitecture and EngineeringMetro Detroit was the leader among all of the regions analyzed in the architecture and engineering occupation category, with 76,950 such jobs. More than 3 percent of all architecture and engineering occupation jobs in the U.S. were in metro Detroit, which is significant as 1.4 percent of the total U.S. population was in the region in 2011. The architecture and engineering occupation LQ for metro Detroit was 2.24, the highest in the Midwest and second highest nationally. San Jose had the highest LQ (3.24) of the regions analyzed in this report. Seattle, Austin, Boston, Dallas, Grand Rapids, Pittsburgh and Minneapolis had architecture and engineering occupation LQs exceeding 1.0, ranging from 1.18 to 1.74.
Technology ManagementIn 2011, metro Detroit had 9,640 technology management occupation jobs. Of the Midwest regions analyzed, only Chicago (17,800) and Minneapolis (12,880) had more jobs in the Technology Management sector. Metro Detroit had the second highest LQ in the Midwest and seventh highest of the national regions analyzed, with an LQ of 1.22. The regions with the highest LQs were San Jose (4.44), Boston (2.13), Seattle (1.86), Minneapolis (1.81), Dallas (1.28) and Atlanta (1.22).
Computer and Mathematical SciencesGreater Detroit had the third largest number of occupation jobs (55,870) of the Midwest regions analyzed for computer and mathematical sciences, following Chicago (106,300) and Minneapolis (67,690). The computer and mathematical sciences LQ for the region was 1.10 in 2011. Within the Midwest, only Minneapolis and St. Louis had higher LQs, with 1.49 and 1.32, respectively.

18 AUTOMATION ALLEY’S 2012 TECHNOLOGY INDUSTRY REPORT
FIGURE 5. Occupational Employment Levels
208,870
1.44
156,400
1.35
54,870
0.99
157,120
1.77
77,680
1.05
183,470
1.98
3.42
49,090
0.88
81,150
1.08
131,870
1.07
246,190
3.42
52,071
0.89
136,440
1.34
66,390
1.04
171,320
1.80
18,610
0.87
FIGURE 6. Occupation Employment Location Quotient by Region
156,400TECHNOLOGY OCCUPATION JOBS IN GREATER DETROIT IN 2011
MIDWEST
MIDWEST
NATIONAL
NATIONAL
CHICAGO
GREATER DETROIT
MINNEAPOLIS
ST. LOUIS
PITTSBURGH
CINCINNATI
INDIANAPOLIS
CLEVELAND
GRAND RAPIDS
GREATER DETROIT
MINNEAPOLIS
ST. LOUIS
INDIANAPOLIS
PITTSBURGH
CINCINNATI
GRAND RAPIDS
CLEVELAND
CHICAGO
BOSTON
SEATTLE
SAN JOSE
DALLAS-FORT WORTH
ATLANTA
AUSTIN
SAN JOSE
SEATTLE
AUSTIN
BOSTON
DALLAS-FORT WORTH
ATLANTA
AUTOMATION ALLEY’S 2012 TECHNOLOGY INDUSTRY REPORT 19
Detroit as the next Silicon Valley? The notion, as raised by more than a few media outlets, is still distant (just as Silicon Valley is far from becoming the next Detroit).11 However, industry and occupation employment data makes clear that the Detroit region is an established hub of technology firms and workers. Innovation measures, such as patent awards and STEM degree completions, suggest that Detroit’s technology sector remains on the upswing. It’s a long drive to Silicon Valley, but there is little doubt that Detroit’s tech sector has shifted into high gear.
PATENT ACTIVITYOne of the clearest indicators of innovation in a market is the number of patents awarded to researchers and inventors located there. Specifically, we are able to analyze data from the United States Patent and Trademark Office to see, by region, how many patentable ideas, devices or processes were given patent protection in recent years.
There are distinct types of patents that are issued by the U.S. Patent and Trademark Office depending on what is being protected. Utility patents, which we discuss for the region below, are those given for the invention of processes, machines, manufacturers, or compositions of matter. These will generally protect the invention from others making, using or selling for up to 20 years. Utility patents are the best type of patent to use as a measure of innovation as they comprise approximately 90 percent of the patent documents that have been issued in recent years.12
APPROVED UTILITY PATENTS BY REGIONSIn 2010, there were 2,783 utility patents issued to applicants from the greater Detroit region. Among the Midwest regions analyzed in this report, metro Detroit had the third highest number of technology-class patents, following Chicago (2,933 patent grants) and Minneapolis (2,827).13 See Figure 1, “Utility Patents Awarded by Market Area, 2010,” on page 20.
11.Huffington Post, “Detroit could be the next Silicon Valley,” http://www.huffingtonpost.com/joan-l-witte/detroit- small-business-development_b_1825737.html, accessed September 2, 2012. See also NBC Nightly News, “Detroit on Road to Recovery,” http://video.msnbc.msn.com/nightly-news/ 47934620#47934620, accessed September 27, 2012.
12.U.S. Patent and Trademark Office http://www.uspto.gov/web/offices/ac/ido/oeip/taf/patdesc.htm.
13.U.S. Patent and Trademark Office http://www.uspto.gov/web/offices/ac/ido/oeip/taf/cls_cbsa/allcbsa_gd.htm. Note that the origin of a patent is determined by the residence of the first-named inventor.
THE DETROIT REGION IS AN ESTABLISHED HUB OF TECHNOLOGY FIRMS AND WORKERS.

20 AUTOMATION ALLEY’S 2012 TECHNOLOGY INDUSTRY REPORT
14.U.S. Patent and Trademark Office, “USPTO Announces Location for Elijah J. McCoy Satellite Office in Detroit,” http://www.uspto.gov/news/pr/2012/12-04.jsp, accessed July 3, 2012.
15.U.S. Patent and Trademark Office, “USPTO to Open First Ever Satellite Office in Detroit,” http://www.uspto.gov/ news/Detroit_Office_Announcement.jsp, accessed July 3, 2012.
Companies in the metro Detroit area have received many patents in recent years. From 2006 to 2010, GM Global Technology Operations was granted the largest number of patents (1,388). Ford Global Technologies was close behind, with a total of 1,300 patents during that time period. Others receiving patents include automotive suppliers like Lear and Visteon and major businesses with research and development hubs in the region, such as Hitachi, Toyota and Fanuc Robotics.
A number of patents were also granted to colleges and universities in the area. University of Michigan was granted 263 patents from 2006 to 2010, the seventh largest amount of patents in the Automation Alley area. Wayne State University had the next largest amount of patents granted to a school in the area with 41 patents during 2006 to 2010 (the 44th largest amount of all patents in the area).
DETROIT PATENT OFFICEIn July 2012, the U.S. Patent and Trademark Office opened a regional office in Detroit, creating an expected 100 new positions.14 The new office is the first-ever regional office for that patent and trademark division. The Patent Office cites the large number of STEM-related workers, leading research institutions, and a high volume of patent activity as reasons for choosing the Detroit area over the likes of Silicon Valley, Austin and Seattle.15
FROM 2006 TO 2010, GM GLOBAL TECHNOLOGY OPERATIONS WAS GRANTED THE LARGEST NUMBER OF PATENTS (1,388). FORD GLOBAL TECHNOLOGIES WAS CLOSE BEHIND, WITH A TOTAL OF 1,300 PATENTS DURING THAT TIME PERIOD.
2,783UTILITY PATENTS ISSUED TO APPLICANTS FROM THE DETROIT REGION IN 2010.
2,933
2,827
740
2,449
923
4,330
495
1,656
2,783
10,074
721
2,189
751
4,052
159
CHICAGO
MINNEAPOLIS
GREATER DETROIT
CINCINNATI
CLEVELAND
PITTSBURGH
ST. LOUIS
INDIANAPOLIS
GRAND RAPIDS
SAN JOSE
BOSTON
SEATTLE
AUSTIN
DALLAS-FORT WORTH
ATLANTA
FIGURE 1. Utility Patents Awarded by Market Area, 2010
MIDWEST
NATIONAL
AUTOMATION ALLEY’S 2012 TECHNOLOGY INDUSTRY REPORT 21
STEM EDUCATIONSTEM DegreesAs described in “Technology Occupation Data” on page 16, metro Detroit is a leader in technology occupation jobs in the architecture and engineering, technology management and computer and mathematical sciences subsectors. To fill these jobs, as well as others in the technology industry, it is vital to have a skilled and talented workforce. Fortunately, the Detroit region is home to 27 colleges and universities that had STEM degree completions in 2008-09. These schools include Lawrence Technological University, Oakland University, University of Michigan and Wayne State University.
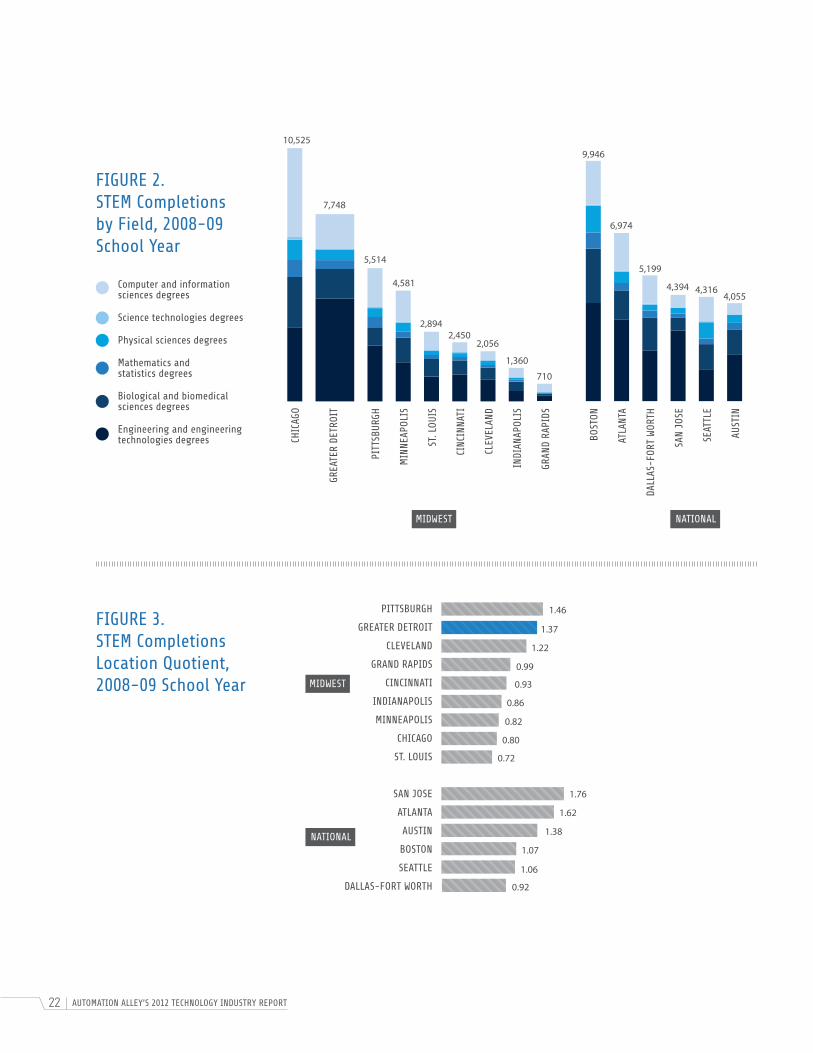
STEM Degree CompletionsDuring the 2008-09 school year, there were 7,748 STEM degree completions at the colleges and universities located across metro Detroit. Of the STEM completions, engineering and engineering technologies made up the greatest proportion (9.3 percent or 4,248 completions), followed by computer and information sciences (3.2 percent or 1,466 completions) and biological and biomedical sciences (2.7 percent or 1,252 completions). Physical sciences (441 completions), mathematics and statistics (240 completions) and science technologies (1 completion) round out the total.16 See “STEM Completions by Field by Region, 2008-09 School Year” on page 22.
Metro Detroit had the third highest number of STEM completions among the 15 regions analyzed in this report, following only Chicago and Boston. The number of completions per capita (based on the 2009 Detroit MSA population) in metro Detroit was second highest among the Midwest regions analyzed, trailing only Pittsburgh.
Looking at the STEM fields of study, the Detroit region had the largest number of engineering and engineering technologies degrees among the MSAs in this report, with 4,248 completions in the 2008-09 school year. Within the Midwest, metro Detroit had the second largest number of completions in biological and biomedical sciences (1,252 completions) and physical sciences (441 completions), following only Chicago in both fields.
Relative ShareThe 7,748 STEM completions in metro Detroit represented 16.9 percent of the total 45,822 postsecondary degree completions in the region during the 2008-09 school year. Only 12.4 percent of all completions nationally were in STEM fields, implying a STEM completion LQ of 1.37 for greater Detroit.17
Metro Detroit had the second strongest concentration of STEM completions among the Midwest regions in this report, following only Pittsburgh (1.46). Of the national markets assessed, only San Jose (LQ of 1.76), Atlanta (1.62), Pittsburgh (1.46) and Austin (1.38) had stronger STEM completion LQs than metro Detroit. Chicago, the Midwest leader of STEM completions, had an LQ of less than 1.0, implying that the area had fewer STEM completions relative to total completions observed throughout the nation. See “STEM Completions Location Quotient by Region, 2008-09 School Year” on page 22.
16.National Center for Education Statistics, IPEDS Data Center. http://nces.ed.gov/ipeds/datacenter/Data.aspx
17.Location Quotient = 16.9% metro Detroit share / 12.4% national share. Rounding of shares may account for slight differences in calculated values.
METRO DETROIT HAD THE THIRD HIGHEST NUMBER OF STEM COMPLETIONS AMONG THE 15 REGIONS ANALYZED IN THIS REPORT.
22 AUTOMATION ALLEY’S 2012 TECHNOLOGY INDUSTRY REPORT
FIGURE 2.STEM Completions by Field, 2008-09 School Year
FIGURE 3.STEM Completions Location Quotient, 2008-09 School Year
1.46
10,525
7,748
5,514
4,581
2,8942,450
2,056
1,360
710
9,946
6,974
5,199
4,394 4,3164,055
PITT
SBUR
GH
MIN
NEAP
OLIS
ST. L
OUIS
CINC
INNA
TI
CLEV
ELAN
D
INDI
ANAP
OLIS
GRAN
D RA
PIDS
1.37
0.86
1.07
0.99
1.62
0.80
0.92
1.22
1.76
0.82
1.06
0.93
1.38
0.72
Computer and information sciences degrees
Science technologies degrees
Physical sciences degrees
Mathematics and statistics degrees
Biological and biomedical sciences degrees
Engineering and engineering technologies degrees
GREA
TER
DETR
OIT
CHIC
AGO
BOST
ON
ATLA
NTA
DALL
AS-F
ORT
WOR
TH
SAN
JOSE
SEAT
TLE
AUST
IN
MIDWEST
NATIONAL
PITTSBURGH
GREATER DETROIT
CLEVELAND
GRAND RAPIDS
CINCINNATI
INDIANAPOLIS
MINNEAPOLIS
CHICAGO
ST. LOUIS
SAN JOSE
ATLANTA
AUSTIN
BOSTON
SEATTLE
DALLAS-FORT WORTH
MIDWEST NATIONAL

AUTOMATION ALLEY’S 2012 TECHNOLOGY INDUSTRY REPORT 23
APPENDIX A: ABOUT ANDERSON ECONOMIC GROUPAnderson Economic Group, LLC was founded in 1996 and today has offices in East Lansing, Michigan and Chicago, Illinois. AEG is a research and consulting firm that specializes in economics, public policy, financial valuation and market research. AEG’s past clients include:
• Governments such as the states of Michigan, Kentucky, North Carolina, Ohio and Wisconsin; the cities of Detroit, Cincinnati, Norfolk and Fort Wayne; counties such as Oakland County, Michigan and Collier County, Florida; and agencies such as the Detroit/Wayne County, Port Authority.
• Corporations such as General Motors, Ford, Delphi, Honda, Taubman Centers, MDU Resources, PG&E Generating, SBC, ITC Holdings, Labatt USA, InBev USA, Meijer, Spartan Stores, Nestle and automobile dealers and dealership groups representing General Motors, Ford, Hyundai, Toyota, Honda, Chrysler, Mercedes-Benz and other brands.
• Nonprofit organizations such as Automation Alley, Michigan State University, Wayne State University, University of Michigan, Project Management Institute, the Michigan Manufacturers Association, United Ways of Michigan, Service Employees International Union, Michigan Chamber of Commerce, Business Leaders for Michigan and the Michigan Education Association.
Please visit www.AndersonEconomicGroup.com for more information.
APPENDIX B: DATA SOURCESIndustry DataThe industry data used in this analysis was obtained from the United States Census County Business Pattern program. The vintage is 2010, which represents the most current data available at the time of publication.
Occupation DataThe occupation data used in this analysis was obtained from the United States Bureau of Labor Statistics Occupational Employment Statistics program. The vintage is 2011, which represents the most current data available at the time of publication.
University STEM Degrees DataThe university degrees data used in this analysis was obtained from the National Center for Education Statistics Integrated Postsecondary Education Data System data center, Compare Individual Institutions option. The vintage is 2008-2009, which represents the most current data available at the time of publication. The predefined “Postsecondary Awards in Science, Technology, Engineering, and Mathematics” variable was used selected. The degrees total includes all levels (associate’s, bachelor’s, master’s, doctor’s and first professional degrees), but not certificates.
Innovation DataThe patent data used in this analysis was obtained from the United States Patent and Trademark Office. The vintage is 2010, which represents the most current data available for Metropolitan Statistical Areas at the time of publication.

automationalley.com