automatic transport network matching using deep learning
TRANSCRIPT

Automatic Transport Network Matching using Deep Learning
Manuel Martin Salvador, Marcin Budka, Tom Quay
European Transport Conference 201704/09/2017 - Barcelona
discoverpassenger.comwearebase.combournemouth.ac.uk

Problems to solve
- Passenger counting (real-time and historical)- Match passenger feedback to a particular vehicle
- Negative: bus is dirty, wifi is not working- Positive: bus driver has been very friendly
- Customer profiling based on ticket usage and frequent routes- Micro-targeting campaigns- Pro-active notification of disruptions

Hardware infrastructure is expensive
- Counting sensors in each door- On-board processing unit in each bus- Antennas to send data- Bluetooth beacons
Source: Infodev
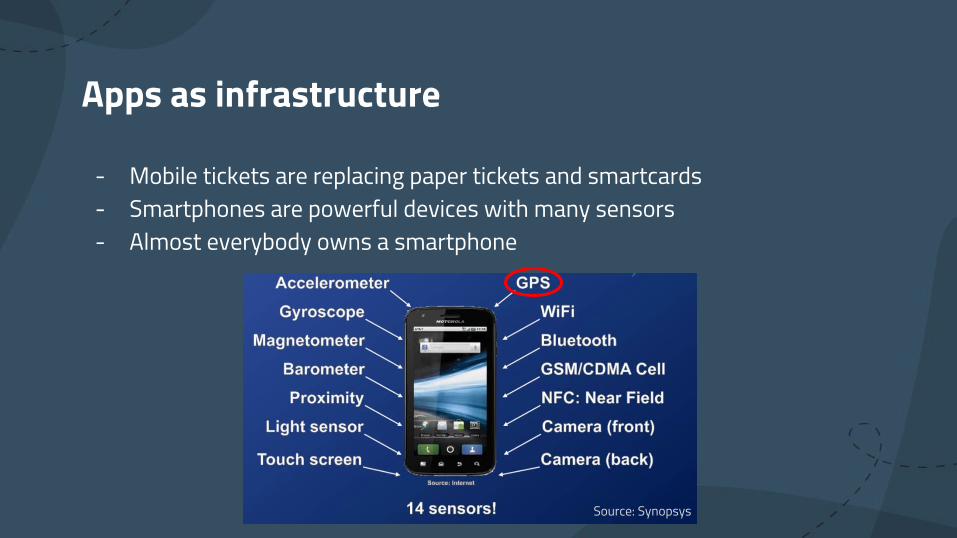
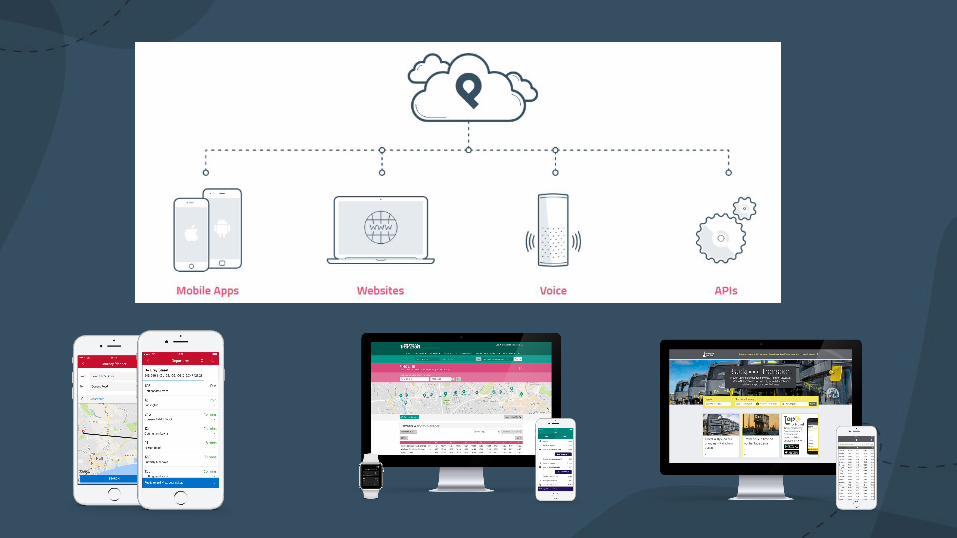
Apps as infrastructure
- Mobile tickets are replacing paper tickets and smartcards- Smartphones are powerful devices with many sensors- Almost everybody owns a smartphone
Source: Synopsys
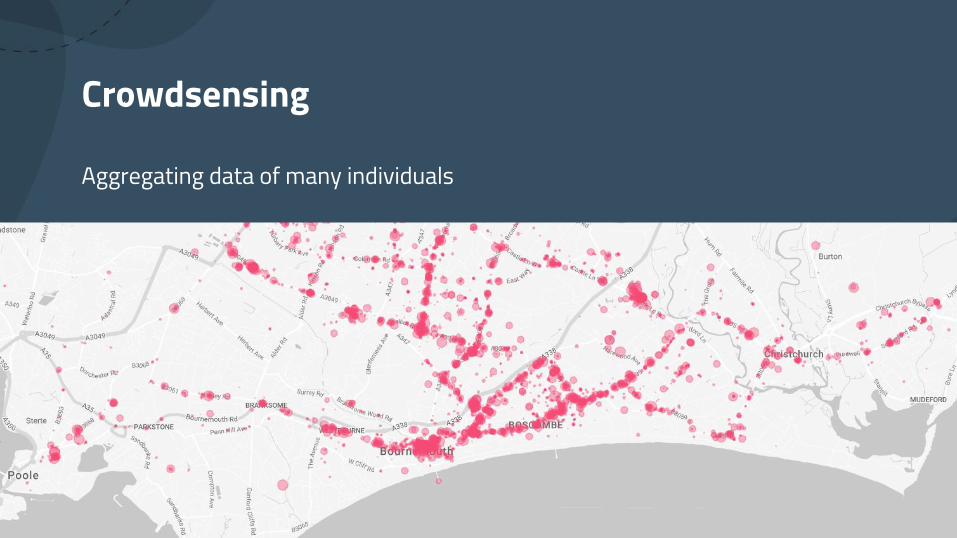
Crowdsensing
Aggregating data of many individuals

What’s network matching?
Match timestamped GPS trace to a bus line
9:30 9:31 9:329:33
9:34
9:35
Bus line??
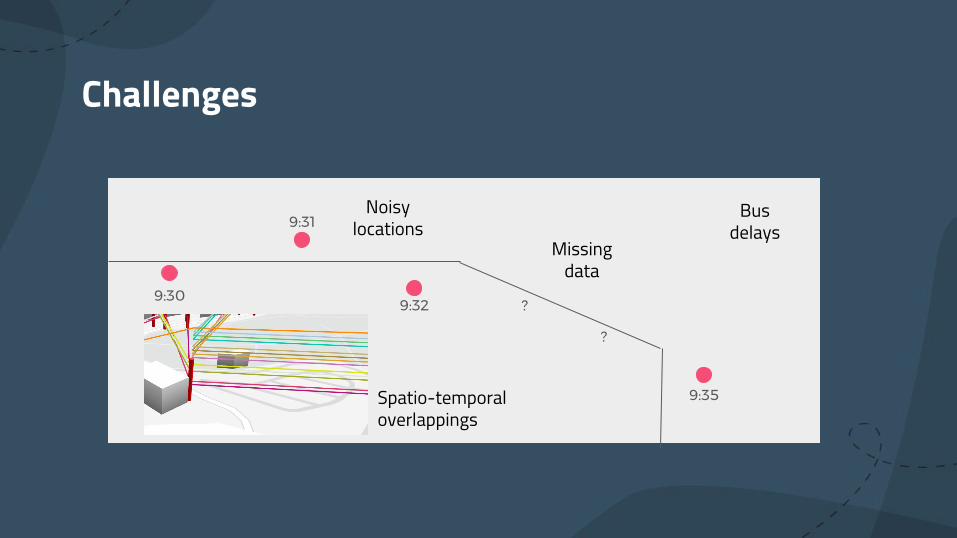
Challenges
9:30
9:31
9:32
9:35
Missing data
Noisy locations
Spatio-temporal overlappings
Bus delays
?
?

Our approaches to network matching

Data collection
- We asked app users to share their journeys and indicate in which line they were travelling.
- We collected about 200 journeys and kept 164 journeys after manual cleaning.
- Length of the journey varied from 6 to 56 minutes.- 1 GPS point every minute.

Heuristic
1. Find nearest stops to points.2. Get list of candidate lines based on
location.3. Verify candidates based on
direction and time.4. Return most likely line+direction.

Problems of heuristic
- Slow → not scalable- Based only in timetabling information and bus stop positions
- In real life, GPS points might not be close to bus stops, and buses are delayed- We need a model able to cope with uncertainty

Deep Learning approach
Build a classifier based on input data.
Sequence classification:
(lat1, lon1, time1), …, (latn, lonn, timen) → label
Classic machine learning approaches don’t work with sequential data of different lengths. Let’s try with Recurrent Neural Networks!
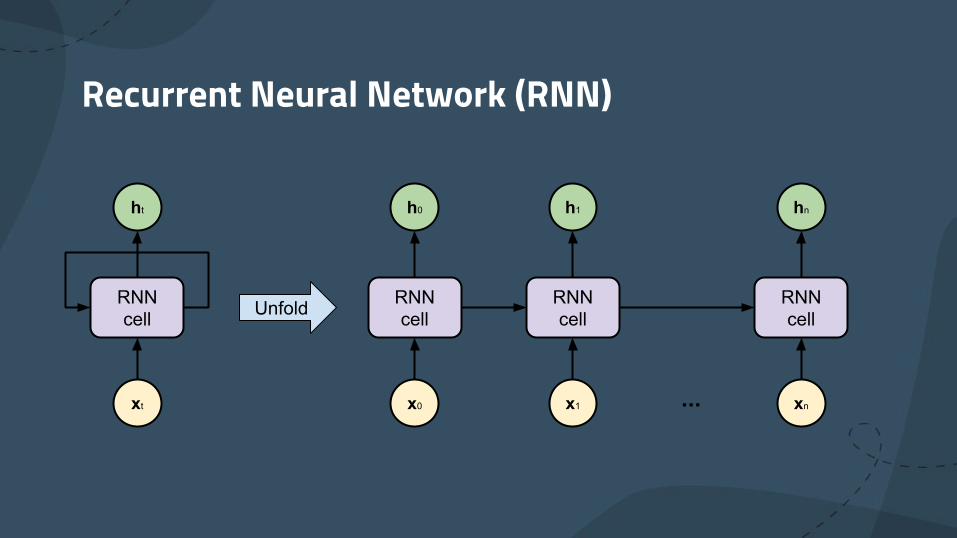
Recurrent Neural Network (RNN)
xt
ht
RNNcell
x0
h0
RNN cell
x1
h1
RNNcell
xn
hn
RNNcell
...
Unfold
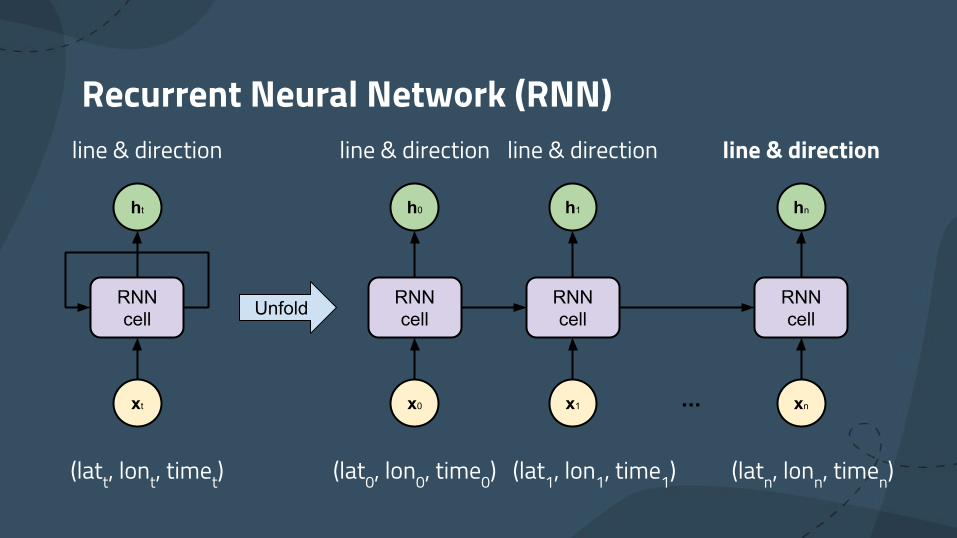
Recurrent Neural Network (RNN)
xt
ht
RNNcell
x0
h0
RNN cell
x1
h1
RNNcell
xn
hn
RNNcell
...
Unfold
(latt, lont, timet) (lat0, lon0, time0) (lat1, lon1, time1) (latn, lonn, timen)
line & direction line & direction line & directionline & direction

Challenges
- Needs loads of compute- Not enough real data with feedback- Noise due to:
- Low GPS accuracy- Bus delays- Missing points
3XS Deep Learning G10

● +15 million journeys● Covering the whole operator network -- at all times!● Start from 1 bus stop and track every minute● Random GPS accuracy based on a real distribution● Simulation of bus delays
Generating (lots of) data
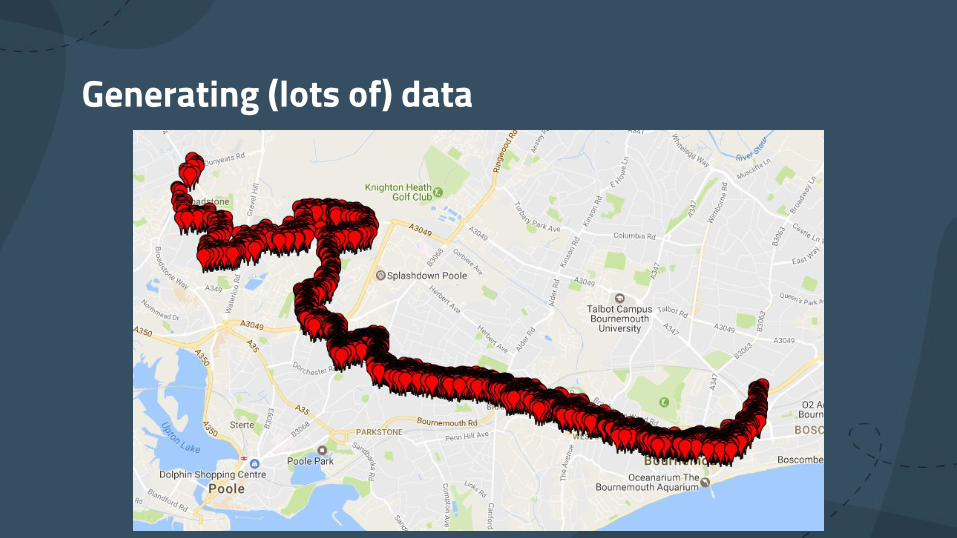
Generating (lots of) data
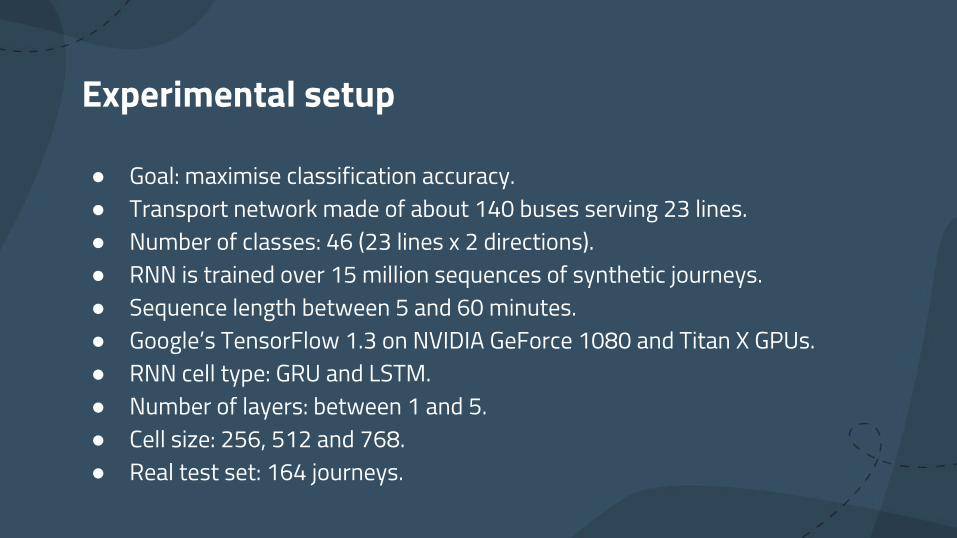
Experimental setup
● Goal: maximise classification accuracy.● Transport network made of about 140 buses serving 23 lines.● Number of classes: 46 (23 lines x 2 directions).● RNN is trained over 15 million sequences of synthetic journeys.● Sequence length between 5 and 60 minutes.● Google’s TensorFlow 1.3 on NVIDIA GeForce 1080 and Titan X GPUs.● RNN cell type: GRU and LSTM.● Number of layers: between 1 and 5.● Cell size: 256, 512 and 768.● Real test set: 164 journeys.
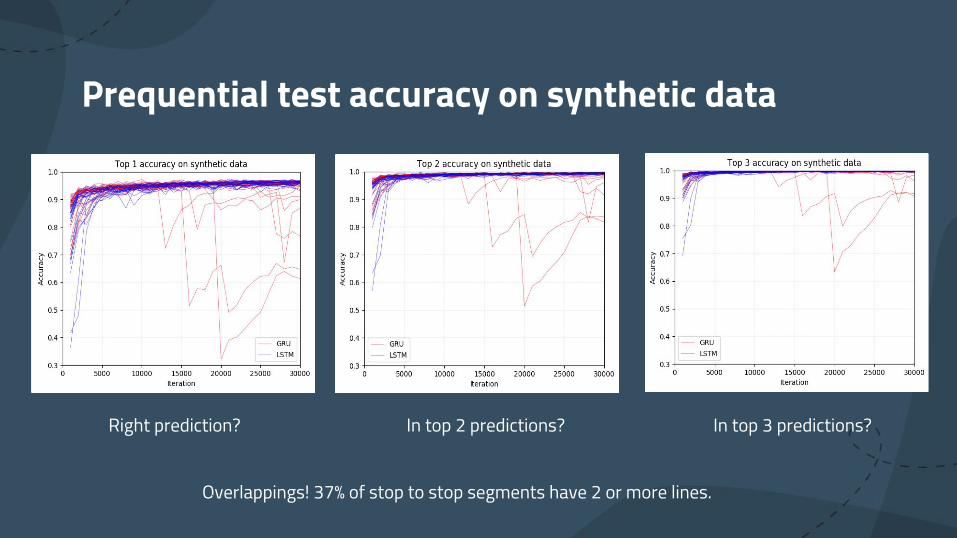
Prequential test accuracy on synthetic data
In top 2 predictions? In top 3 predictions?Right prediction?
Overlappings! 37% of stop to stop segments have 2 or more lines.

Classification results on the real test set

Conclusion and future work
Promising results:
● Best approach: 68% accuracy (RNN GRU 2 layers; cell size: 768; with embeddings).● Up to 93% accuracy on best of 3 predictions.
Future work:
● Training data from real vehicle journeys instead of only timetables.● Experiment with different sampling rates (currently 1 per minute).
