automatic screening algorithm for narrow anterior chamber angle
TRANSCRIPT
Kasetsart J. (Nat. Sci.) 47 : 940 - 952 (2013)
1 School of Information, Computer and Communication Technology, Sirindhorn International Institute of Technology, Thammasat University, Pathum Thani 12000, Thailand.
2 Advanced Automation and Electronics Research Unit, National Electronics and Computer Technology Center, Pathum Thani 12120, Thailand.
3 Center for Research and Development of Educational Technology, Tokyo Institute of Technology, Tokyo, Japan.4 Department of Ophthalmology, Faculty of Medicine, Chulalongkorn University and King Chulalongkorn Memorial Hospital,
Thai Red Cross Society, Bangkok 10330, Thailand.* Corresponding author, e-mail: [email protected]
Received date : 04/06/13 Accepted date : 30/10/13
Automatic Screening Algorithm for Narrow Anterior Chamber Angle and Angle-Closure Glaucoma Based on Slit-Lamp
Image Analysis
Chonlada Theeraworn1,*, Waree Kongprawechnon1, Toshiaki Kondo1,Pished Bunnun2, Akinori Nishihara3 and Anita Manassakorn4
ABSTRACT
To perform a narrow anterior chamber angle (NACA) and angle-closure glaucoma (ACG) screening using the Van Herick’s method, the width of the peripheral anterior chamber depth (PACD) and corneal thickness have to be measured. These are the key parameters to identify a patient who may be suffering from ACG. Therefore, to develop an automatic screening algorithm for NACA and ACG based on slit-lamp image analysis, a width measurement algorithm has to be as accurate as possible in order to produce the best result. An algorithm was proposed to increase the screening accuracy and also to reduce the computational time. To overcome bright spot reflection on the cornea, the extraction of light reflected and the measurements of both the PACD and corneal thickness were improved. In order to remove unnecessary areas from the image and decrease the processing time, an improved algorithm was designed to automatically detect a region of interest (ROI). Then, only the ROI image was used in subsequent processes. Experimental results showed that the proposed algorithm is accurate and reliable.Keywords: angle-closure glaucoma, anterior chamber depth, anterior chamber angle, slit-lamp image,
screening
INTRODUCTION Glaucoma has become a major cause of irreversible blindness and is caused by a group of diseases that can damage the eye's optic nerve and is normally associated with increased fluid pressure in the eye (American Academy of Ophthalmology, 2013). Currently, there are many techniques used
to detect glaucoma, such as using the retinal or fundus image (Ganesh and Shenbagadevi et al., 2011), confocal scanning laser tomography (CSLT) (Yu et al., 2005) or Heidelberg retinal tomography (HRT) (Coops et al., 2006) to analyze the optic nerve and visual field. Glaucoma can be roughly divided into two main types: open angle glaucoma (OAG) and angle-closure glaucoma
Kasetsart J. (Nat. Sci.) 47(6) 941
(ACG). In general, the number of patients with OAG is greater than those with ACG. Surveys of the number of people with glaucoma conducted by Quigley and Broman (2006) and Yip and Foster (2006) revealed that Asians are more at risk of developing ACG than Caucasians. The estimated number of people with glaucoma in 2020 will be 79.6 million (Quigley and Broman, 2006); although 74% will have OAG, Asians will represent 47% of those with glaucoma and 87% of these Asians will have ACG. Moreover, the symptoms of ACG are severe and dramatic if the angle suddenly closes; it must be treated quickly, otherwise, it may result in blindness within a few hours of its onset (Root, 2009). Damaged nerve fiber in the optic nerve is serious because it cannot be regenerated; therefore early detection of the disease and prevention are necessary (Eye Care and Vision Associates, 2012). Generally, people with NACA are more likely to develop ACG, but if they receive laser treatment in the early developing stage, about 98% of them will be cured (Kraemer and Gramer, 1997). Consequently, this paper focuses on how to screen NACA and ACG. ACG occurs when the fluid in the front part of the eye cannot reach the drainage area because the chamber angle gets blocked by part of the iris and it can cause a sudden buildup
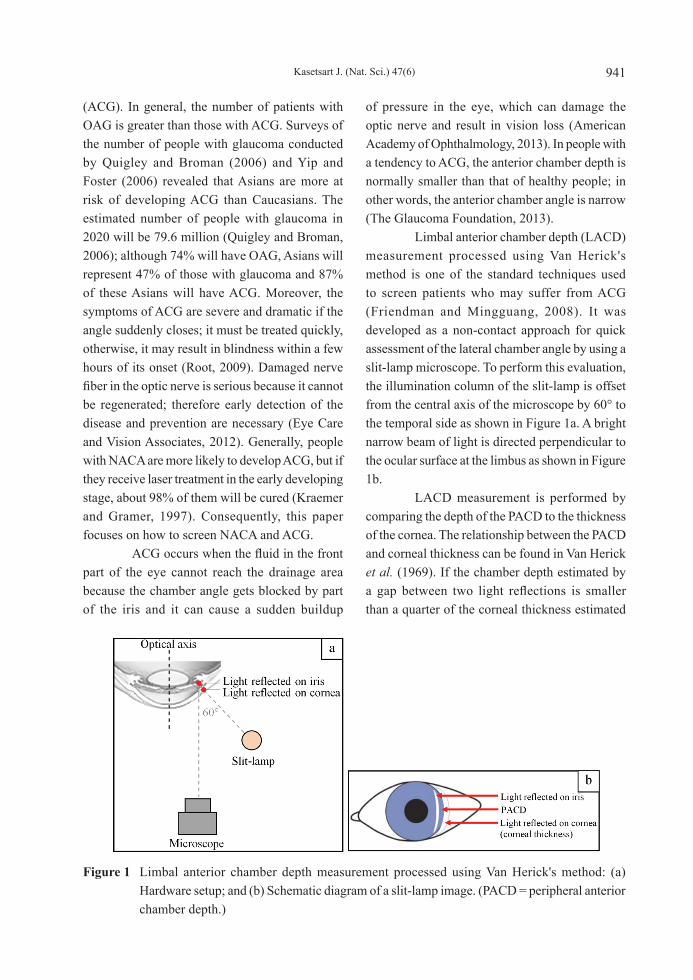
of pressure in the eye, which can damage the optic nerve and result in vision loss (American Academy of Ophthalmology, 2013). In people with a tendency to ACG, the anterior chamber depth is normally smaller than that of healthy people; in other words, the anterior chamber angle is narrow (The Glaucoma Foundation, 2013). Limbal anterior chamber depth (LACD) measurement processed using Van Herick's method is one of the standard techniques used to screen patients who may suffer from ACG (Friendman and Mingguang, 2008). It was developed as a non-contact approach for quick assessment of the lateral chamber angle by using a slit-lamp microscope. To perform this evaluation, the illumination column of the slit-lamp is offset from the central axis of the microscope by 60° to the temporal side as shown in Figure 1a. A bright narrow beam of light is directed perpendicular to the ocular surface at the limbus as shown in Figure 1b. LACD measurement is performed by comparing the depth of the PACD to the thickness of the cornea. The relationship between the PACD and corneal thickness can be found in Van Herick et al. (1969). If the chamber depth estimated by a gap between two light reflections is smaller than a quarter of the corneal thickness estimated
Figure 1 Limbal anterior chamber depth measurement processed using Van Herick's method: (a) Hardware setup; and (b) Schematic diagram of a slit-lamp image. (PACD = peripheral anterior chamber depth.)
Kasetsart J. (Nat. Sci.) 47(6)942
by the width of light reflected on the cornea, the chamber angle may be dangerously narrow and angle-closure may be likely. Otherwise, the chamber angle may be open and angle-closure is unlikely. If no space is visible between two light reflections, the chamber angle may be closed and angle-closure may already exist. Although the screening procedure is straightforward and simple, Van Herick's method requires an ophthalmologist to perform the measurement and manually grade the result. This process is subjective. Therefore, the accuracy of screening results often varies among ophthalmologists. To avoid such human error, an automatic NACA and ACG screening algorithm was presented in Rakjaeng et al. (2012). However, the accuracy and sensitivity of their algorithm are not good enough and the number of false negatives (FN) has to be reduced. Other chamber depth estimation techniques use anterior segment optical coherence tomography (Tian et al., 2010) and a RetCam image (Cheng et al., 2010). Nevertheless, the detection of angle-closure using these techniques is very expensive compared to using the slit-lamp image and some techniques that use a contact approach. Therefore, this paper proposes an automatic NACA and ACG screening algorithm based on Van Herick's method. The algorithm does not require physical contact with the patient's eye and can also detect ACG at an early stage. In addition, a slit-lamp microscope used in Van
Herick's method can also be used for general purposes, for example in a gonioscopic examination (Friendman and Mingguang, 2008) and in the eye tele-analyzer system (Charukamnoetkanok et al., 2009). The algorithm can process the slit-lamp image at maximum resolution in a short time by performing automatic region of interest (ROI) detection and subsequently process only the ROI image. In order to improve the algorithm accuracy, a power-law transformation and an image intensity clipping function are also added in the light reflection extraction process. Furthermore, this method can estimate the corneal thickness and peripheral anterior chamber depth (PACD) even though the images contain bright spot reflection on the cornea. The corneal thickness and PACD are analyzed and then the result is classified into angle-closure being unlikely or likely. There are two steps to evaluate the algorithm performance. In the first step, the width measurement algorithm is evaluated, while the accuracy of the overall algorithm is assessed in the second step.
MATERIALS AND METHODS
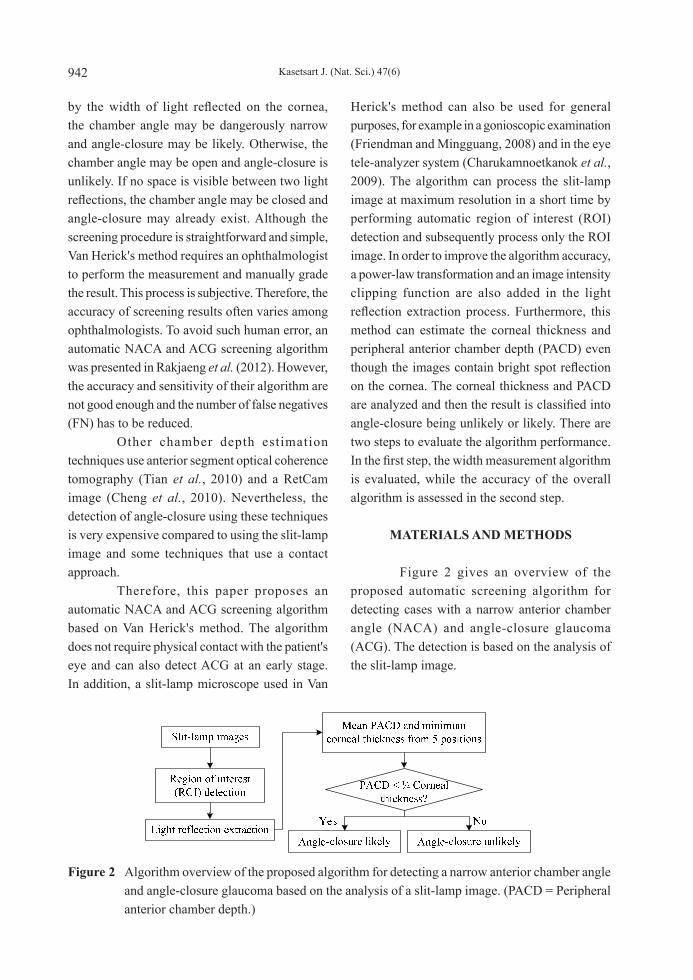
Figure 2 gives an overview of the proposed automatic screening algorithm for detecting cases with a narrow anterior chamber angle (NACA) and angle-closure glaucoma (ACG). The detection is based on the analysis of the slit-lamp image.
Figure 2 Algorithm overview of the proposed algorithm for detecting a narrow anterior chamber angle and angle-closure glaucoma based on the analysis of a slit-lamp image. (PACD = Peripheral anterior chamber depth.)

Kasetsart J. (Nat. Sci.) 47(6) 943
The algorithm reads a slit-lamp image of 3,264 × 2,448 pixels and extracts the ROI that contains the boundaries of the light reflected on the eye. The PACD and the corneal thickness are measured in the ROI. Finally, the input image is classified into positive (likely to be an angle-closure case) or negative (healthy) using Van Herick’s method. The input image is classified positive if the PACD is smaller than a quarter of the corneal thickness.
Region of interest detection As shown in Figure 2, the ROI is extracted for efficient computation. Figure 3 shows the detailed steps for the ROI detection. The objective is to extract the light reflected on the iris by removing unnecessary structures such as light reflection on the eyelids and the sclera. Each step in Figure 3 is described below. Downsampling In this research, the input image is first down-sampled by a factor of n = 5.44, resulting
in lower resolution images of 600 × 450 pixels. This step helps to reduce the computational cost, while maintaining high accuracy. Top-hat transform In the second step of ROI detection, the top-hat transform (also referred to as opening residue) is applied to the input image to make the iris the brightest component in the red channel as demonstrated in Figure 4. Channel subtraction In the experiment, the color of the light reflected on the iris was reddish orange, while that of the light reflected on the cornea was light blue (Rakjaeng et al., 2012). Note that in the current experiment the subjects were predominantly Asians. To extract the iris component, the light reflected on the cornea, eyelids and sclera has to be removed. This is performed in the third step using channel subtractions—the red channel of the top-hat transformed image minus the blue channel of the top-hat transformed image. The subtraction result is shown in Figure 5a.
Figure 3 Flowchart of the region of interest (ROI) detection function.
Figure 4 (a) Input slit-lamp image and (b) Top-hat transformed image.

Kasetsart J. (Nat. Sci.) 47(6)944
Left, right bound identification andimage cropping In the fourth step, the left and right boundaries of the ROI are determined. For this purpose, the column whose mean intensity is the maximum in the channel subtraction result is determined (Figure 5a). Then, ±11% of the width of the image is used (600) from the column detected as the left and right boundaries of the ROI (Figure 5b). The value 11% was determined through experiments, which ensured the perfect inclusion of the light reflected on the iris. Upperandlowerboundsidentification In the fifth step, the upper and lower boundaries were detected by applying thresholding to the channel subtraction result, followed by morphological smoothing to remove isolated small components and to fill holes in the light reflected on the iris. Then, the largest connected component was found as shown in Figure 5c. The upper and lower terminals of the component give the upper and lower boundaries of the ROI. Region of interest scaling The sixth step returns to the original input image of 3,264 × 2,448 pixels. By enlarging the ROI defined in the preceding steps by the factor 5.44, the ROI can be finally cropped from the original image as shown in Figure 6.
Lightreflexextraction This is the next step in Figure 2 and
consists of two main processes; first the light reflected on the iris is extracted and then the light reflected on the cornea is extracted. The two processes are similar to each other, except that the second process requires two extra steps, image intensity clipping and the power-law transformation as highlighted in Figure 7. Note also that the channel subtraction for the cornea is conducted as the blue channel minus red channel because the light reflected on the cornea appears blue (Rakjaeng et al., 2012). Depending on the illumination conditions of the slit-lamp, some images show an excessively bright region in the vicinity of the light reflections as shown in Figure 8a, which may disturb the extraction of the light reflections. Figure 8b shows an image without such a problem. The two cases are distinguished by observing the mean intensity of each input image. It is apparent that the overexposed image has a higher mean. A top-hat transform is applied to the input image if overexposure is detected (Figure 8). The ROI images are classified into two types: type 1 and type 2, depending on the mean intensity of the images. Figure 9 shows two examples of type 1 that are adequately illuminated. By contrast, Figure 10 shows two examples of type 2 that show over-exposure (Figure 10a) and an extremely bright spot on the cornea (Figure 10b).
Figure 6 Sixth step in the region of interest (ROI) detection: (a) Enlarged ROI superimposed on the original input image and (b) Cropped ROI.
Figure 5 Left and right bounds detection: (a) Channel subtraction, (b) Left, right bound identification and image cropping and (c) Iris extraction.

Kasetsart J. (Nat. Sci.) 47(6) 945
Figure 7 Flowchart of light reflex on cornea extraction for type 2 images.
Figure 8 (a) Over-exposed slit-lamp image and (b) Appropriately exposed slit-lamp image.
Figure 9 Two adequately illuminated slit-lamp sample images of type 1. Figure 10 Two inadequately illuminated slit-
lamp sample images of type 2: (a) Over-exposed slit-lamp image and (b) Slit-lamp image with an extremely bright spot.
Image intensity clipping The step of image intensity clipping aims to suppress excessively bright regions and render them as adequately exposed intensities. In other words, this step transforms type 2 images into type 1 images. As shown in Figure 11, first the mean intensity of the type 1 image is determined; this must only be done once. If the intensities in an input image are greater than the mean intensity, those greater intensities are replaced with the mean
intensity (for example, 180). Subsequently, all images can be processed as type 1 images. Figure 12a shows a type 2 image. Figure 12b shows the preprocessed top-hat transformed image. Figures 12c and 12d show the red and blue channels, respectively, of the image in Figure 12a. Since

Kasetsart J. (Nat. Sci.) 47(6)946
most pixels in the input image have intensities greater than the threshold (for example, 180), the intensities of those corresponding red and blue channels are replaced with the normal intensity as shown in Figures 12e and 12f, respectively. Figure 13 demonstrates the benefit of this step. The extraction of the cornea failed without
intensity clipping (Figures 13c to 13f), while successful intensity clipping is shown in Figures 13g to 13j. After the intensity clipping operation, the intensities are equalized, which helps the subsequent measurements of type 2 images to be more accurate and reliable.
Figure 11 Flowchart of limit intensity algorithm
Figure 12 Image intensity clipping: (a) ROI image of Type 2, (b) Preprocessed image (top-hat transformed), (c) Red channel of preprocessed image, (d) Blue channel of preprocessed image, (e) Red channel after intensity clipping, and (f) Blue channel after intensity clipping.

Kasetsart J. (Nat. Sci.) 47(6) 947
Figure 13 Image intensity clipping: (a) Region of interest image of type 2, (b) Preprocessed image (top-hat transformed image), (c) Red channel of the preprocessed image, (d) Blue channel of the preprocessed image, (e) Channel subtraction result (blue - red), (f) Extracted cornea region, (g) Red channel with intensity clipping, (h) Blue channel with intensity clipping, (i) Channel subtraction result with the intensity clipping, and (j) Extracted cornea regions with intensity clipping.
Power-Law transformation The power-law transformation (Equation 1) was applied to enhance the normalized gray scale image from the channel subtraction process: S = r γ, (1)where S is an output gray level [0, 1], r is an input gray level [0, 1] and the value of γ determines how input intensities are mapped to outputs. In this study, 0.4 was used for extracting the light reflection on the cornea and 0.75 for extracting the light reflection on the iris. Figure 14 shows the effect of the power-law transformation when it was applied to the image for extracting the light reflection on the cornea. After completing the light reflection extraction, a logical OR operation was performed on the extracted iris and cornea components for combining. Consequently, the final binary image of the light reflection on the eye was obtained and used to perform the measurements for
classification. The result of the light reflection extraction process is shown in Figure 15.
Peripheral anterior chamber depth and corneal thickness measurement In general, the central part of the iris is the most important area for the measurement of ACG. However, the maximum PACD is not always the correct indicator of the central position. For instance, Figure 16 shows that the maximum PACD can be found off the center of the iris. Hence, the central area was identified by dividing the area along the vertical axis of the iris into five parts. The PACD and corneal thickness were measured at five places in the central band of the input image (Area3) as shown in Figure 17. To avoid error from a bright spot reflection on the cornea, the minimum value of corneal thickness (Figure 18) and the mean value of PACD were used.

Kasetsart J. (Nat. Sci.) 47(6)948
Figure 14 Power-law transformation: (a) Raw channel subtraction image and (b) Power-law transformed subtraction image (γ = 0.4).
Figure 15 Light reflection extraction process: (a) Input region of interest image and (b) Light reflection extracted image.
Figure 16 An example showing the maximum peripheral anterior chamber depth (bounded by the white dotted line) not in the center of iris.
Figure 18 Example of selecting minimum value of corneal thickness: (a) Input slit-lamp image and (b) Processed image.
Figure 17 Measurement area of peripheral anterior chamber depth and corneal thickness.
RESULTS AND DISCUSSION
The experiment was carried out at the King Chulalongkorn Memorial Hospital on slit-lamp images from 27 volunteers. In total, 50 slit-
lamp images were used. One volunteer had only one eye and three other slit-lamp images were unable to be graded because the volunteers had a plateau iris, pterygium and peripheral anterior synechiae, respectively.
Accuracy of width measurement algorithms The accuracy of the measurements of the PACD and cornea thickness by the proposed algorithm was evaluated on the 50 slit-lamp images by comparing them with the manual measurements made on the input images by three volunteers. The mean values of the three manual measurements were used for the comparison. Table 1 shows the results of the evaluation. The median absolute deviation between the manual measurements and those by the proposed algorithm was 4.2 pixels, or about 4.8% of the manually measured PACD. The measurements of the PACD by the proposed

Kasetsart J. (Nat. Sci.) 47(6) 949
algorithm tended to be slightly smaller than those by manual counting. The corneal thicknesses estimated using the proposed algorithm tended to be slightly larger than those by manual counting. These were preferable trends because they produced less false negatives (FN) where the algorithm did not detect genuine cases of NACA or ACG.
Accuracy of automatic screening algorithm for narrow anterior chamber angle and angle-closure glaucoma The accuracy of the proposed screening algorithm was evaluated by comparing the diagnoses based on the manual measurements. The statistics used in Table 2 are explained below. The sensitivity (SENS.) is the percentage of true positive (TP) incidents of actual angle closure-likely and is determined using Equation 2:
SENS.= TPTP+ FN
, (2)
where TP is an angle closure-likely correctly classified as angle closure-likely and FN is an angle closure-likely incorrectly classified as angle closure-unlikely. The specificity (SPEC.) is the percentage of true negative (TN) incidents of actual angle closure-unlikely and is determined using Equation 3:
SPEC.= TNTN + FP
(3)
where TN is an angle closure-unlikely correctly classified as angle closure-unlikely and FP is an angle closure-unlikely incorrectly classified as angle closure-likely. The positive predictive value (PPV) or precision rate is the percentage of true positive (TP) incidents of angle closure-likely result and is determined using Equation 4:
PPV = TPTP+ FP
(4)
The negative predictive value (NPV) is the percentage of true negative (TN) incidents of
Table 1 Accuracy of width measurement algorithm.
Average value from 50 imagesPACD(pixels)
Corneal thickness(pixels)
¼ Corneal
thickness(pixels)
Mean of manual measurement 64.2 64.5 16.1Mean measurement by proposed algorithm 62.9 66.0 16.5Median absolute deviation 3.1 3.0 0.75
Image size: 3,264 × 2,448 pixels.
Table 2 Table of confusion of proposed screening algorithm. (TP = True positive, FN = False negative, FP = False positive, TN = True negative, SENS. = Sensitvitiy, SPEC. = Specificity, PPV = Positive predictive value, NPV = Negative predictive value, ACC = Accuracy.)
Evaluation by Algorithm
Man
ual P
ixel
Cou
ntin
g

Kasetsart J. (Nat. Sci.) 47(6)950
angle closure-unlikely result and is determined using Equation 5:
NPV = TNTN + FN
(5)
The accuracy (ACC.) is the percentage of true results that is the summation of true positive (TP) and true negative (TN) incidents of all input data and is determined using Equation 6:
ACC.= TP+TNTP+ FN + FP+TN
(6)
The results of the proposed screening algorithm are summarized in Table 2, showing a perfect screening result. T h e d i a g n o s e s b y t h e t h r e e ophthalmologists were compared with the diagnoses based on the same manual measurements in Table 3. When the diagnoses by the three ophthalmologists were split, the algorithm was consistent with the majority. Table 3 shows that the ophthalmologists never missed positive cases,
but they sometimes diagnosed negatives cases as positive (FP), thus resulting in a lower specificity. This may not be a problem in real clinical settings. However, the diagnoses by the ophthalmologists were not the best-choice as the ground truth for evaluating the proposed algorithm. For this reason, the final evaluation was performed by comparing the algorithm with the diagnoses based on the manual measurements as shown in Table 2. There were four improvements over the previously proposed algorithm by Rakjaeng et al. (2012). Firstly, unlike the previous algorithm, an input image down-sampled only for determining the region of interest (ROI) in this paper. The selected ROI was projected back to the input image of high resolution where subsequent processes were conducted. This helped to improve the accuracy of measurements in slit-lamp images. Secondly, the selection of the ROI was fully automated and has been described in this paper. This automation enabled fast screening of slit-lamp images because no human interaction is required. Thirdly, the measurement of PACD and corneal thickness was performed at five spots in the central band of the ROI image in this paper (Figure 17). This makes the measurement far more robust to the negative influence of bright spot reflection on the cornea. Lastly, the new style of measurements described above also allow the curve fitting technique employed in the previously proposed algorithm to be abandoned. Depending on the structure of the iris, there were always some errors in the curve fitting, which degraded the quality of measurements. Furthermore, the fitting technique was susceptible to bright spot reflection.
CONCLUSION
An automatic screening algorithm was described for detecting cases with narrow anterior chamber angle (NACA) and angle-closure glaucoma (ACG). With a series of image processing techniques, the proposed algorithm
Table 3 Table of confusion of ophthalmologists results. (TP = True positive, FN = False negative, FP = False positive, TN = True negative, SENS. = Sensitvitiy, SPEC. = Specificity, PPV = Positive predictive vlaue, NPV = Negative predictive value, ACC = Accuracy.)
Voting Result from 3Ophthalmologists
Man
ual P
ixel
Cou
ntin
g
Kasetsart J. (Nat. Sci.) 47(6) 951
could cope with bright spot reflection on the cornea that disturbs the measurement of the corneal thickness. As the important measurements for the screening were conducted within a small region of interest, the algorithm was fast and efficient regardless of the high resolution of the input images. A comparison between the proposed algorithm and manual operations showed that the proposed algorithm performed both measurement and screening accurately. Since the procedure of the proposed algorithm was fully automated, it can replace the screening process by specialists, including ophthalmologists. This will help to reduce the lengthy time required for mass screening and also eliminate human errors that inevitably occur in manual grading. Future work should develop a fully automatic screening machine for NACA and ACG by considering a hardware control system. The camera and slit-lamp projecting positions could be automatically controlled instead of manually by a human operator. This will help to improve the system accuracy.
ACKNOWLEDGEMENTS
This research was financially supported by the Thailand Advanced Institute of Science and Technology (TAIST), the National Science and Technology Development Agency (NSTDA), the Tokyo Institute of Technology, Center of Excellence in Biomedical Engineering, Sirindhorn International Institute of Techcnology (SIIT), Thammasat University (TU) and the National Research University Project, Thailand Office of Higher Education Commission. The authors would like to thank the King Chulalongkorn Memorial Hospital for support with medical advice and data.
LITERATURE CITED
American Academy of Ophthalmology. 2013. What Is Glaucoma? [Available from http://www.geteyesmart.org/eyesmart/diseases/
glaucoma/index.cfm]. [Sourced: 26 December 2013].
Charukamnoetkanok, P. , K. Ekkachai , N. Klanarongran, T. Leelasawassuk, P. Komeswarakul, P. Suramethakul, O. Thonginnetra, S. Asawaphureekorn, S. S i n t u w o n g , K . Tu n g p i m o l r u t , W. Kongprawechon and P. Pangputhipong 2009. Robotic slit-lamp for tele-ophthalmology, pp. 2535–2539. In Proceedings of the ICCAS-SICE.
Coops, A., D.B. Henson, A.J. Kwartz and P.H. Artes 2006. Automated analysis of heidelberg retina tomograph optic disc images by glaucoma probability score. Invest. Ophthalmol. Vis. Sci. 47(12): 5348–5355.
Eye Care and Vision Associates. 2012. Glaucoma. [Available from http://www.ecvaeyecare.com/youreyes/glaucoma.php]. [Sourced: 26 December 2013].
Friendman, D.S. and H. Mingguang. 2008. Anterior chamber angle assessment techniques. Survey of Ophthalmology 53(3): 250–273.
Ganesh, B., T.R. and S. Shenbagadevi. 2011. Automatic detection of glaucoma using fundus image. European Journal of Scientific Research 59(1): 22–32.
Cheng, J., J. Liu, B.H. Lee, D.W.K. Wong, F. Yin, T. Aung, M. Baskaran, P. Shamira and T.Y. Wong. 2010. Closed angle glaucoma detection in RetCam images, pp. 4096–4099. In Proceedings of the 32nd Annual International Conference of the IEEE Engineering in Medicine and Biology Society.
Kraeme, C. and E. Gramer 1997. Long-term follow-up after Nd:YAG user iridotomy - A pilot study. Investigative Ophthalmology and Visual Science 38(4): 852–852.
Quigley, H.A. and A.T. Broman. 2006. The number of people with glaucoma worldwide in 2010 and 2020. Br. J. Ophthalmol. 90(3): 262–267.

Kasetsart J. (Nat. Sci.) 47(6)952
Rakjaeng K., W. Kongprawechnon, T. Kondo, K. Tungpimolrut, N. Sugino and A. Manassakorn. 2012. Automatic screening of angle-closure glaucoma using peripheral anterior chamber depth estimation in slit-lamp images. In Proceedings of the 3rd International Conference on Information and Communication Technology for Embedded Systems (ICICTES 2012).
Root T. 2009. Introduction to Glaucoma. [Available from http://www.ophthobook.com/chapters/glaucoma]. [Sourced: 26 December 2013].
The Glaucoma Foundation. 2013. Angle-closure Glaucoma. [Available from http://www.glaucomafoundation.org/angle-closure_glaucoma.htm]. [Sourced: 26 December 2013].
Tian, J., P. Marziliano and H.T. Wong. 2010. Automatic detection of Schwalbe’s line in the anterior chamber angle of the eye using HD-OCT images, pp. 3013–3016. In Proceedings of the 32nd Annual International Conference of the IEEE Engineering in Medicine and Biology Society.
Van Herick, W., R.N. Shaffer and A. Schwartz. 1969. Estimation of width of angle of anterior chamber. Incidence and significance of the narrow angle. American Journal of Ophthalmology. 68: 626–629.
Yip, J.L.Y. and P.J. Foster. 2006. How to manage a patient with glaucoma in Asia. Community Eye Health Journal 19(59): 40-41.
Yu, J., S.S.R. Abidi, P.H. Artes, A. McIntyre and M. Heywood. 2005. Automated optic nerve analysis for diagnostic support in glaucoma, pp. 97–102. In Proceedings of the 18th IEEE Symposium on Computer-Based Medical Systems.