automatic modal analysis – myth or reality?sandv.com/downloads/0803peet.pdf · sound and...
TRANSCRIPT

www.SandV.com SOUND AND VIBRATION/MARCH 2008 17
Automatic Modal Analysis – Myth or Reality?Bart Peeters, Jenny Lau, Jeroen Lanslots and Herman Van der AuweraerLMS International, Leuven, Belgium
The increasing use of experimental modal analysis (EMA) as a standard tool means that both experienced and inexperienced analysts are faced with new challenges: uncertainty about the accuracy of results, The route to automation still requires discrimi-nation methods to distinguish physical from mathematical poles, in particular in the case of high-order or highly damped structures. This article discusses an approach for automating the modal pa-rameter estimation process and its industrial validation.
The vibration and acoustical behavior of a mechanical struc-ture is determined by its dynamic characteristics. This dynamic behavior is typically described with a linear system model. The inputs to the system are forces (loads), and the outputs are the resulting displacements or accelerations. System poles usually occur in complex conjugate pairs, corresponding to structural vi-bration ‘modes.’ The pole’s imaginary part relates to the resonance frequency and the real part to the damping. Structural damping is typically very low (a few percent of critical damping). The system’s eigenvectors, expressed on the basis of the structural coordinates, correspond to characteristic vibration patterns or “mode shapes.” System identification from input-output measurements yields the modal model parameters.1 This approach is now a standard part of the mechanical product engineering process.
However, several constraints make the system identification process for structural dynamics more complex than in electrical engineering or process control. A key issue is the difficulty of select-ing the correct model order and the corresponding validation of the obtained system poles. First of all, a continuous structure has an infinite number of modes. In practice, the analyst is interested only in a limited number of these, up to a certain frequency or only in a certain frequency band. Still, model orders of more than 100 are no exception. Furthermore, while some of the modes are separated in resonance frequency, others may be very close, leading to highly overlapping responses. The standard approach of selecting a model order and then deriving the corresponding poles is in general not applicable, and over-specification of the model order is needed. Finally, the size of the problem often requires more than 1000 re-sponses to be processed (e.g. a car body is discretized by more than 500 nodes and measured in three directions) and using large data segments to reduce the measurement noise. The consequence of these constraints is that classical system identification approaches, extracting the parameters of a discrete-time state-space model or of an ARMA model directly from the sampled input-output data, are often neither practical nor feasible. Specific procedures are then needed for modal analysis.
Modal analysis users face the following challenges:• The ever increasing complexity of the tested structures: e.g. fully
assembled vehicles instead of components, in-situ instead of laboratory measurements.
• The changing role of testing in the product development cycle,2 implying a reduction of time available for testing and analysis and a demand for increased accuracy adequate for use with hybrid or FE applications,
• Specific to the modal parameter estimation process itself: incon-sistency between estimates of different operators, the tedious task of selecting obvious poles in a stabilization diagram and the time-consuming iterations required to validate a modal model.A key requirement for experimental modal analysis (EMA) is
that a reliable analysis of complex datasets should be possible
with minimal, or even excluding, user interaction. This is the context of the methodology developed here. The following sec-tions discuss:• Using a stabilization diagram to solve the order determination
problem. • An automatic procedure is expanded to heavily rely on the
stabilization diagram concept.• The methodology is validated using industrial examples.
Stabilization DiagramThe key difficulty in applying system identification for EMA of
large-scale structures is the selection of the model order and of the corresponding system poles. In EMA, measured frequency response functions (FRFs) are curve-fit by a modal model:1
where: [ ( )]H l mw Œ ¥ = FRF matrix containing the FRFs between all m
inputs and all l outputs n = number of modes •H = complex conjugate transpose of a matrix ni
l{ } Œ = mode shapes < >Œli
T m = modal participation factors li = polesThe poles occur in complex conjugated pairs and are related to the eigenfrequencies, wi [rad/s], and damping ratios xi [-] (•* denotes a complex conjugate):
So in EMA, the problem of determining model order boils down to deciding how many modes n to use for fitting the FRFs. Note that in classical system identification literature, many formal procedures exist to solve the problem of determining model order. Models of different order are identified and compared according to quality criteria such as Akaike’s final prediction error or Rissanen’s minimum description length criterion. Most of these techniques were developed in the context of control theory, where it is the aim to identify optimal low-order models. But in structural dynamics, the order of the models is typically chosen much higher to reduce the bias on the estimates and to capture all relevant characteristics of the structure, even in the presence of large amounts of measure-ment noise. As a consequence of order over-specification, the physi-cally meaningful poles are completed with a set of ‘mathematical’ poles, modelling model, data and process noise but without having
(1)[ ( )]*
*Hl
j
l
ji i
T
ii
n i iH
i
wn
w l
n
w l= { } < >
-+
{ } < >
-=Â
1
(2)l l x w x wi i i i i ij, * = - ± -1 2
Based on a paper presented at IMAC XXV, the 25th International Modal Analysis Conference, Orlando, FL, February 2007.
Figure 1. Stabilization diagram. Symbols have following meaning: o – new pole; f – stable frequency; d – stable frequency and damping; v – stable frequency and eigenvector; s – all criteria stable.
www.SandV.com18 SOUND AND VIBRATION/MARCH 2008
The process remains very interactive and requires good user experience, especially for complex datasets. In some cases, it may even appear that the problem of determining model order has been shifted to the problem of interpreting very unclear stabilization diagrams (see Industrial Validation, below).
Automatic Modal Parameter SelectionWith the increasing use of modal analysis as a standard tool by
many, including less experienced users, the primary need is to automate the process. Researched solutions include estimation methods that are much more robust with respect to the appearance of spurious poles. In this context, impressive results are obtained with PolyMAX, a discrete frequency-domain method that uses a least-squares approach to fit a rational fraction polynomial model to a multiple input multiple output (MIMO) FRF matrix. Exactly four years ago, an article on PolyMAX appeared in Sound and Vi-bration.3 The technical background on PolyMAX can also be found elsewhere.4,5 The extension of PolyMAX to operational modal analysis (i.e. modal parameter estimation using operational data obtained under immeasurable excitation) was also presented.6
Very high system orders (more than 50) are clearly identified in a single-step procedure, leading to extremely clear stabilization diagrams drastically improving the quality and the interpretability of the result. It is a feature of the PolyMAX identification method to estimate the mathematical poles with a negative damping ratio. Therefore, these poles are readily excluded before constructing the stabilization diagram. The fact that inherently unstable models are identified is not a problem as a new model is recomposed3 after selecting the stable poles from the stabilization diagram.
Nevertheless, the route to automation still requires discrimina-tion methods to distinguish physical from mathematical poles. Probably, the most ‘natural’ way is trying to capture the decisions that an experienced modal analyst makes based on a stabilization diagram or by rules that can be implemented as an autonomous procedure. The selection of poles in a stabilization diagram has classically been done by an expert engineer visually inspecting the symbols, which are based on similarity in frequency, damping ratio or mode vector between poles belonging to subsequent model orders (see above). Typical questions include:• How to select poles in a stabilization diagram?• How to speed up the iterative process of pole selection in stabi-
lization diagram?• How to ensure that consistent analyses are obtained from dif-
ferent people from the same database?
a relation to the structural problem. To address this problem, the concept of a “stabilization diagram”
is introduced. The basic idea is that several runs of the complete pole identification process are made by using models of increasing order. Experience on a very large range of problems shows that in such analysis, the pole values of the ‘physical’ eigenmodes always appear at a nearly identical frequency, while mathematical poles tend to scatter around the frequency range. The pole values from all these analyses at different orders can be combined in one single diagram, with the pole frequency as the horizontal axis and the solution order as the vertical axis. The pole is shown by a symbol in this diagram (Figure 1). Physical poles are readily visible in the diagram. To show that the frequency (damping and eigenvector, respectively) of a pole falls within certain bounds of the values obtained at a lower system order, this is indicated by a symbol (for example by an ‘f’ for frequency stabilization, ‘d’ for damping and frequency or ‘v’ for eigenvector and frequency). As typical stability criteria, the following values are used:• 1% for frequency stability,• 5% for damping stability,• 2% for eigenvector stability.These ‘defaults’ reflect the accuracy of the estimates that can be ex-pected in a wide range of industrial modal analysis applications.
From such a diagram, it is not only possible to select the optimal system order, and for this order the valid system poles, but it is even possible to select individual poles from different analyses. To this purpose, several criteria can be used, such as the lowest order at which a pole becomes ‘stable,’ the frequency or damping trend when plotting a specific pole across the order etc. Of course, when selecting individual poles, a complete structural model is not available. Recombining the poles into a new model usually solves this problem. In most modal parameter estimation methods, a stabilization diagram is constructed based on pole li and partici-pation factor <li
T> information. After interpreting the stabilization diagram, the mode shapes {ni} and the lower and upper residuals are obtained as the linear least-squares solution of Eq. 3:
With respect to Eq. 1, the lower and upper residuals [ ],[ ]LR UR l mŒ ¥ , modelling the influence of the out-of-band modes in the considered frequency band, have been added. Solving Eq. 3 also solves the mode recombination problem that arises from selecting individual modes in the stabilization diagram.
(3)[ ( )][ ]
[ ]*
*Hl
j
l
j
LRURi i
T
ii
n i iH
i
wn
w l
n
w l w= { } < >
-+
{ } < >
-- +
=Â
12
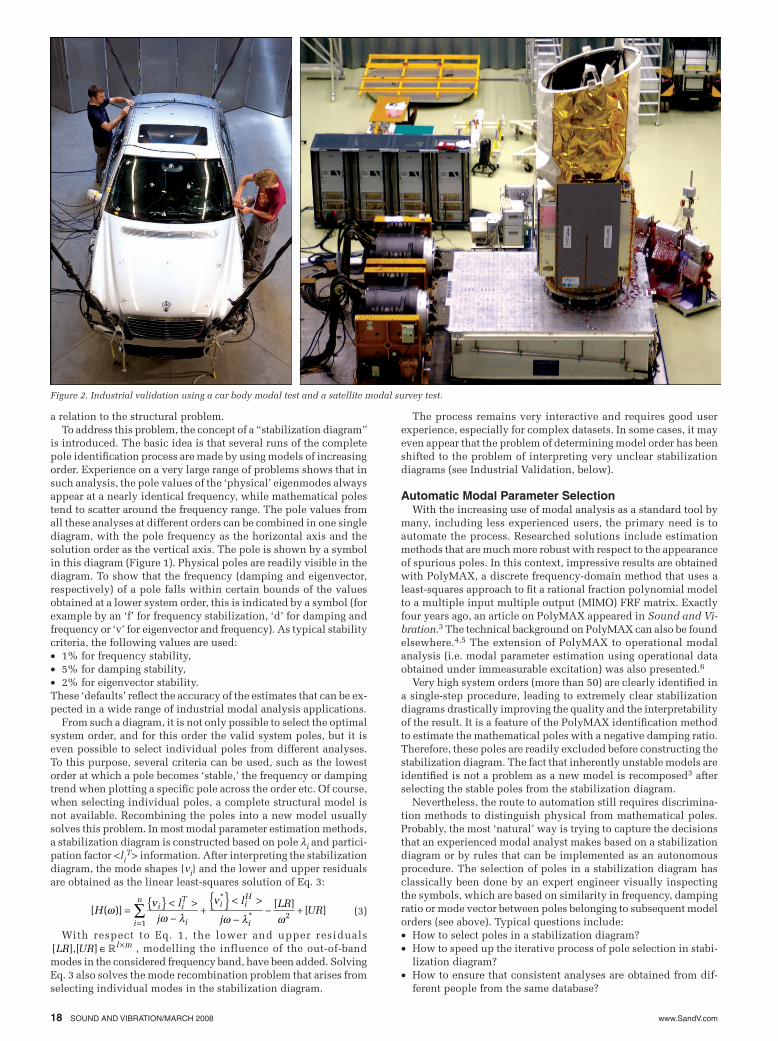
Figure 2. Industrial validation using a car body modal test and a satellite modal survey test.

www.SandV.com SOUND AND VIBRATION/MARCH 2008 19
An automatic selection procedure is the answer to these ques-tions. The so-called automatic modal parameter selection (AMPS) procedure is an intelligent rule-based approach in which the knowledge of experienced analysts is captured.7-9 The combination of PolyMAX and AMPS has the advantages that it is much faster than the time-consuming iterative process of manually selecting poles. The combination provides less-experienced analysts access to expert knowledge bases and helps generate user-independent results.
Industrial ValidationProof of Concept. A benchmark analysis was performed to
evaluate the results derived from the new AMPS tool. The goal of the benchmark test was to provide a qualitative assessment of the tool and to place it within the spectrum ranging from novice to experienced modal analysts. Eight people were selected for the test, including four novices and four experts, all of whom had an engineering background. The novices received a short description of the task they had to carry out.
In the test, a MIMO dataset from a fully trimmed car body was used (Figure 2). It has two inputs and 264 measurement points distributed over the entire car body, leading to 528 FRFs. The parameter estimation was done with both a time-domain method (Poly-reference LSCE) and a frequency-domain method (PolyMAX) for the frequency band 35-75 Hz. Both stabilization diagrams were created using a model size of 64.
An initial examination of the two stabilization diagrams (Figure 3) shows that the LSCE diagram is rather complicated and clouded by spurious, mathematical poles, especially at higher model or-ders. But the PolyMAX diagram clearly shows the stable poles throughout the entire frequency band. This resulted in large differ-ences in the number of poles selected by the various participants. The time taken by each participant to make the assessment was measured, and in general, the LSCE task took about twice as long to complete as the PolyMAX task. In addition, the experts spent about twice as much time in the assessment as the novices, who were so overwhelmed by the complexity of the LSCE diagram that they quickly gave up.
Figure 4 shows a frequency spectrum of the pole selection of all the test participants for the two stabilization diagrams. Users 1-4 are the novices; Users 5-8 are the experts. The vertical dotted lines show the selection made by the AMPS tool. Relying on the LSCE diagram (Figure 3a), it was clear that the novices encountered difficulties in the 45-60 Hz band; not only did they miss poles, there was also a wide variation in those that were selected. Even the experts did not find it easy in this frequency range, since the poles they selected did not line up well, indicating differences in the frequencies (Figure 4a). Above 65 Hz, the experts agreed quite well, but the novices missed some of the poles completely. Relying on the PolyMAX diagram (Figure 3b), the majority of the participants selected all the poles. The results from all of the us-ers (experts and novices) agreed much better, as indicated by the nicely aligned dots (Figure 4b).
Figure 5 shows a comparison of the damping ratios of the selected poles. The crosses (¥) represent the AMPS selection. A cluster of dots (∑) represents consensus over the selection by the different test participants,while a scatter over the damping would indicate, in case of novices, lack of experience and feeling for physical damping values. In general, the participants demonstrated more consensus with respect to damping in the PolyMAX diagram (Figure 5b) than in the LSCE diagram (Figure 5a). AMPS largely agrees with this consensus. The sparse number of selections in the 45-60 Hz band explains the differences. There is a remarkable improvement for both novices and experts in that band for the PolyMAX plot.
It is clear that the association of the PolyMAX method and AMPS generates user-independent results and can be an educational tool for both novices and experts. More benchmark results and details can be found Reference 9.
Increased Productivity. Using AMPS, the iterative process of pole selection from a stabilization diagram is much less time consuming. More poles are selected in just a few seconds, and the pole selection procedure can be made faster by using a larger band
and a higher maximum model order. This is illustrated using data from the “body in white” of a midsize car. The data consist of two inputs and as much as 2005 response degrees of freedom (DOFs). A complete modal analysis was performed by an expert modal analyst over two weeks and resulted in 233 poles being found. The iterative procedure used in this type of modal analysis cannot be applied to the whole band of interest. Different frequency bands are analyzed and the poles, estimated from each frequency band, are then merged into one analysis. With AMPS, the whole frequency range (with 1437 spectral lines) of interest was treated at the same time with a model size of 256. After 40 seconds, 112 poles were highlighted and automatically selected in the stabilization diagram. Figure 6 shows the results from a more detailed study of the range between 36 and 79 Hz. Not only is the PolyMAX diagram much clearer, but AMPS is also able to find many more poles. Figure 7 shows the excellent quality of the synthesized FRFs of the modal model generated by the PolyMAX-AMPS selection.
Most of the AMPS modes agree well with a manual expert
Figure 3. Car body stabilization diagrams; a) Poly-reference LSCE; b) PolyMAX.
Figure 4. Car body pole selection results per user (Novices: 1-4, Experts 5-8); a) LSCE; b) PolyMAX.

www.SandV.com20 SOUND AND VIBRATION/MARCH 2008
Figure 5. Car body pole selection, frequency versus damping for all users (∑) and AMPS (¥); a) LSCE; b) PolyMAX.
Figure 6. Car body in white stabilization diagrams with AMPS results indi-cated by vertical lines; a) LSCE; b) PolyMAX.
analysis. The remaining modes need to be estimated iteratively. For a simple structure, all modes are identified by AMPS, and the time gain achieves a significant 95%. On a more complex structure, where interactive modal analysis is performed on sev-eral smaller bands, an average 80% of the modes are identified with high confidence by AMPS. Taking the remaining interactive analysis time into account, the overall productivity gain still is an impressive 50%.
Outlook and ConclusionsSimplified or even automated identification of the parameters
of complex systems offer the key to a whole series of model-based engineering applications. In many problems, structural identifica-tion is closely related to detecting changes in the system dynamics. An example is the flight qualification of aircraft, requiring repeated in-flight modal analyses at different airspeeds. At each air speed, resonance frequencies and damping ratios of critical modes are checked to verify the absence of aero-elastic instability (flutter). During the change from one flight condition to the next, the dynam-ics may change due to imminent flutter, and the damping must be monitored continuously.8,10
Another example is the use of changes in the modal system model to detect structural damage or in assessing the integrity of a structure after forced loading during a qualification test. An example of such a structural health monitoring (SHM) approach is found in Reference 11. As part of scheduled major maintenance, each orbiter in the NASA Space Shuttle fleet undergoes modal testing on a regular basis. It was demonstrated that automatic procedures could reduce the data analysis efforts from one month to one hour. In vibration-based SHM of civil engineering struc-tures, ad-hoc automatic modal analysis12 as well as statistical test methods are pursued.13 The same methodology can be applied to problems such as variant analysis (product scatter) or end-of-line product testing.
Significant progress has been made in addressing the key prob-lem of discriminating physical system poles from mathematical poles in the identification of the dynamics of complex structures. The stabilization diagram offers a heuristic approach. Novel model estimation algorithms with clear stabilization behavior ease the
Figure 7. Measured (red) and synthesized (green) FRFs.
process dramatically, opening the way to a fully automated proc-ess.
The combination of the PolyMAX modal parameter estima-tion method with the AMPS procedure means that the myth of automating modal analysis is close to becoming a reality. We have demonstrated proof of concept, increased productivity and industrial applicability.
AcknowledgementThis work was carried out within the EUREKA project E! 3341
FLITE2. The financial support of the Institute for the Promotion of Innovation by Science and Technology in Flanders (IWT) is gratefully acknowledged.

www.SandV.com SOUND AND VIBRATION/MARCH 2008 21
References 1. Heylen, W., Lammens, S., Sas, P., Modal Analysis Theory and Testing.
Dept. of Mech. Eng., K.U. Leuven, Belgium, 2007. 2. Van der Auweraer, H., “Requirements and Opportunities for Structural
Testing in View of Hybrid and Virtual Modelling,” Proc. of ISMA 2002 Int. Conf. on Noise and Vibration Eng., Leuven, Belgium, September 2002.
3. Peeters, B., Lowet, G., Van der Auweraer, H., Leuridan, J., “A New Pro-cedure for Modal Parameter Estimation,” Sound and Vibration, January 2004.
4. Guillaume, P., Verboven, P., Vanlanduit, S., Van der Auweraer, H., Peeters, B., “A Poly-Reference Implementation of the Least-Squares Complex Frequency-Domain Estimator,” Proc. of IMAC 21, the Int. Modal Analysis Conf., Kissimmee, FL, February 2003.
5. Peeters, B., Van der Auweraer, H., Guillaume, P., Leuridan, J., “The Poly-MAX Frequency-Domain Method: A New Standard for Modal Parameter Estimation?”Shock and Vibration, Vol. 11, pp. 395-409, 2004.
6. Peeters, B., Van der Auweraer, H., Vanhollebeke, F., Guillaume, P., “Operational Modal Analysis for Estimating the Dynamic Properties of a Stadium Structure During a Football Game,” Shock and Vibration, Vol. 14, No. 4, pp. 283-303, 2007.
7. LMS International, LMS Test.Lab – Modal Analysis, Leuven, Belgium,
www.lmsintl.com, 2008. 8. Scionti, M., Lanslots, J., Goethals, I., Vecchio, A., Van der Auweraer,
H., Peeters, B., De Moor, B., “Tools to Improve Detection of Structural Changes from In-Flight Flutter Data,” Proc. 8th Int. Conf. on Recent Advances in Structural Dynamics, Southampton, UK, July 2003.
9. Lanslots, J., Rodiers, B., Peeters, B., “Automated Pole-Selection: Proof-of-Concept and Validation,” Proc. of ISMA 2004 Int. Conf. on Noise and Vibration Eng., Leuven, Belgium, September 2004.
10. Verboven, P., Cauberghe, B., Guillaume, P., “A Structural Health Moni-toring Approach for Flutter Testing,” Proc. of ISMA 2002 Int. Conf on Noise and Vibration Eng., Leuven, Belgium, September 2002.
11. Pappa, R. S., James III, G. H., Zimmerman, D. C., “Autonomous Model Identification of the Space Shuttle Tail Rudder,” Journal of Spacecraft and Rockets, Vol. 35, No. 2, pp. 163-169, 1998.
12. Peeters, B., De Roeck, G., “One-Year Monitoring of the Z24-Bridge: Environmental Effects Versus Damage Events,” Earthquake Engineering and Structural Dynamics, Vol. 30, No. 2, pp. 149-171, 2001.
13. Basseville, M., Abdelghani, M., Benveniste, A., “Subspace-Based Fault Detection Algorithms for Vibration Monitoring,” Automatica, Vok. 36, No. 1, pp. 101-109, 2000.
The authors can be reached at: [email protected].