automatic microscopes for nuclear emulsion readout in high-energy and particle physics
TRANSCRIPT

Automatic microscopes for nuclear emulsion readout in high-energy and particle physics
C. Bozza*,1 , T. Nakano2 1 Dipartimento di Fisica dell’Università di Salerno and INFN Gruppo Collegato di Salerno, Via Ponte Don Melillo, 84084
Fisciano(SA), Italy 2 Nagoya University, Furo-cho, Chikusa-ku, Nagoya, 464-8602, Japan
Nuclear emulsions feature unequalled spatial precision and resolution (better than 1 micrometer) among the detectors used for high-energy and particle physics. They can be used to perform topological study of interaction and decays of subnuclear particles, but the traditional workflow is heavily manpower-dependent. The quick development of electronic devices in the ‘70s and ‘80s made them progressively obsolete. Starting from the ‘90s, with the development of machine vision, electronics and computers revamped the technique, and automatic microscopes appeared in Japan and Europe. Automatic 3D imaging was essential to conceive and carry out the new generation of experiments based on nuclear emulsions, combining very high statistics and high data quality. Concepts and detailed features of such microscope systems are reviewed in the paper, and an outlook is given of the probable evolution of technology in the field.
Keywords nuclear emulsion; imaging; tracking; vertexing; topology; high speed; high energy physics; particle physics
1. Nuclear emulsions in high-energy physics
Nuclear emulsions are a special variety of photographic emulsions. The basic components are a gel, usually obtained from animal body tissues, and silver halides, among which AgBr is the most common choice. The main differences of nuclear emulsions from products for more common photographic applications are the quantity and size of AgBr crystals. Such emulsions are mostly used as tracking devices with very high spatial precision and resolution; large-scale batches have been produced with crystals smaller than 0.3 μm, but it is also possible to produce emulsions with even smaller crystals (0.1 μm and less). Emulsion films are normally deposed on a transparent plastic support, coating one or both sides. When a charged particle traverses the gel with the AgBr crystals suspended, it induces ionisation in the medium. If ionisation involves an AgBr crystal, the unbalanced charge may migrate on the crystal, until it comes to a stop. Such sensitised crystals, marking the path of the ionising particle, are a meta-stable latent image, which may last even for several years. Humidity and heat tend to destroy such latent image, by enhancing restoration of overall neutrality of the crystal. The latent image can be fixed by developing the emulsion, with a process that is conceptually similar to the development of a negative photographic film. The chemical agents used in the development promote the growth of filaments of metallic Ag starting from the sensitised sites. Each filament grows in a random way, one end moving relatively far away from the original site, and several filaments may cluster around a sensitised crystal, building up a grain. Figure 1 shows the AgBr crystals and grains as seen by an electronic microscope. The size of the filaments depends on the duration and temperature of the development stage and on the chemicals used. In most cases the films are observed by optical microscopes, so that a grain size in the range 0.5 μm to 1.0 μm is a good compromise between ease of detection and precision of measurement. With such a size, optical microscopy is not able to resolve the actual shape of the filaments, and grains appear as spheroidal objects. The development process has a statistical nature, being faster and more likely for sensitised crystals, but it occurs, more slowly, also for crystals not touched by any ionising particle. As a consequence, the grains marking the path of a charged particle are surrounded by a so-called fog of randomly developed grains, obviously smaller and not aligned.
Fig. 1 Electron micrographs of nuclear emulsions. Left: AgBr crystals suspended in the gel. Right: Result of the development process, where several filaments of metallic Ag grow from the sensitised sites. The cluster of filaments is the grain that is seen as a spheroidal object in optical microscopy.
Current Microscopy Contributions to Advances in Science and Technology (A. Méndez-Vilas, Ed.)
© 2012 FORMATEX 1511

The fixing stage stops the growth of filaments, and residual Ag and Br and other chemicals are then washed away, leaving only the gel with the developed grains. The reduction in mass usually produces also a shrinkage of the emulsion film (normally in the range 20% to 50%), which can be compensated if needed by the addition of glycerine. After washing and drying, mechanical tensions on the plastic support or at the surface may produce shifts in the position of grains. Such effects are globally termed “distortion”, and the most typical ones are summarised in Figure 2. Distortion and shrinkage affect the position of grains, altering the originally straight path of an ionising particle. In the following, a sequence of grains in the same emulsion layer, marking the path of a particle, will be termed a microtrack. Because of shrinkage and distortion, microtracks detected by human operators or by automatic systems need to be corrected.
Fig. 2 The three main effects that alter the position and slopes of microtracks in nuclear emulsions. a) Shrinkage: grains are displaced vertically as a result of the thickness reduction of the emulsion layer. Microtrack slopes are altered by a constant multiplicative factor. b) Linear distortion: a stress applied on the surface, as would be for example the friction caused by the drying air flow, causes a constant viscous shear in the emulsion thickness. The plane in contact with the support (bottom) is not displaced, the plane of the free surface (top) has maximum displacement. As a result, microtrack slopes are altered by an additive constant. c) Parabolic distortion: if a stress arises at the support surface (bottom), and no stress is applied externally, the stress field has to decrease from inside outwards. The simplest approximation is a linear decrease of the stress, which produces a constant gradient of the viscous shear.
Fig. 3 A neutrino interaction vertex in emulsion film from the CHORUS experiment. The linear size of the field of view is about 300 μm. Nuclear fragments are seen as heavily ionising tracks (dark, continuous strips). Compton electrons from environmental radioactivity are easily recognised as wiggling trajectories of individually resolved grains. High-energy particles produce less ionisation in the medium per unit path length, and appear as sequences of aligned grains; since the film was exposed orthogonally with respect to the neutrino beam, hard tracks appear as single grains in this image, and several images taken at different depths need to be stacked together to reconstruct tracks nearly orthogonal to the field of view. Alpha particles emitted from radioactive nuclei present in the emulsion or in the neighbourhood also appear as short, dark tracks, due to the high ionisation.
If many microtracks are available in the observed region, shrinkage and distortion effects can in principle be measured and corrected. This becomes more difficult if the exposure time of the emulsion is long: as nuclear emulsions are continuously sensitive from production to development, environmental radioactivity and cosmic rays pile up a background of microtracks, each one of which is not distinguishable from those produced by charged particles involved in the physics measurement of interest. A common nuclear emulsion image features a variety of background grains, due to fog, electrons from Compton scattering of photons from ambient radioactivity, beta rays and alpha particles, plus a fraction of high-energy secondaries from cosmic rays. In a common microscope view, with a linear size of the order of a few hundred micrometers, the grains of a microtrack produced in the experiment are surrounded by thousands of completely unrelated grains. It is possible to single out microtrack grains because of the very tight alignment: the deviation of grain positions from the straight line fit is of the order of 50 nm in optical microscopy. Nuclear emulsions compensate the lack of a time trigger with the highest precision available among detectors used in particle physics, a field in which they have a long tradition. Almost every particle physicist has seen at least once the decay chain of a pion as recorded by the nuclear emulsions exposed at Pic du Midi by Lattes et al. [1]. In that experiment, the ability to precisely mark the path and ionisation of a charged particle was crucial to determine several quantities, and to classify the kinematics as typical of two-body decays. In the decades that followed, many other experiments successfully exploited the unique ability to explore interactions and decays on a topological basis. Being a visual device was the
a)
b)
c)
Current Microscopy Contributions to Advances in Science and Technology (A. Méndez-Vilas, Ed.)
© 2012 FORMATEX 1512
strength and the weakness of nuclear emulsion: early electronic devices could not replace the eyes and brain of experienced human scanners, who were forced to work at conventional microscopes for many months in high-statistics experiment. At the end of the ‘70s, nuclear emulsions had lost ground to electronic detectors, which were more expensive but needed less manpower. Further increase in data processing power made image analysis by machines possible in the late ‘80s, with the advent of the first automatic microscopes.
2. General structure of an automatic microscope
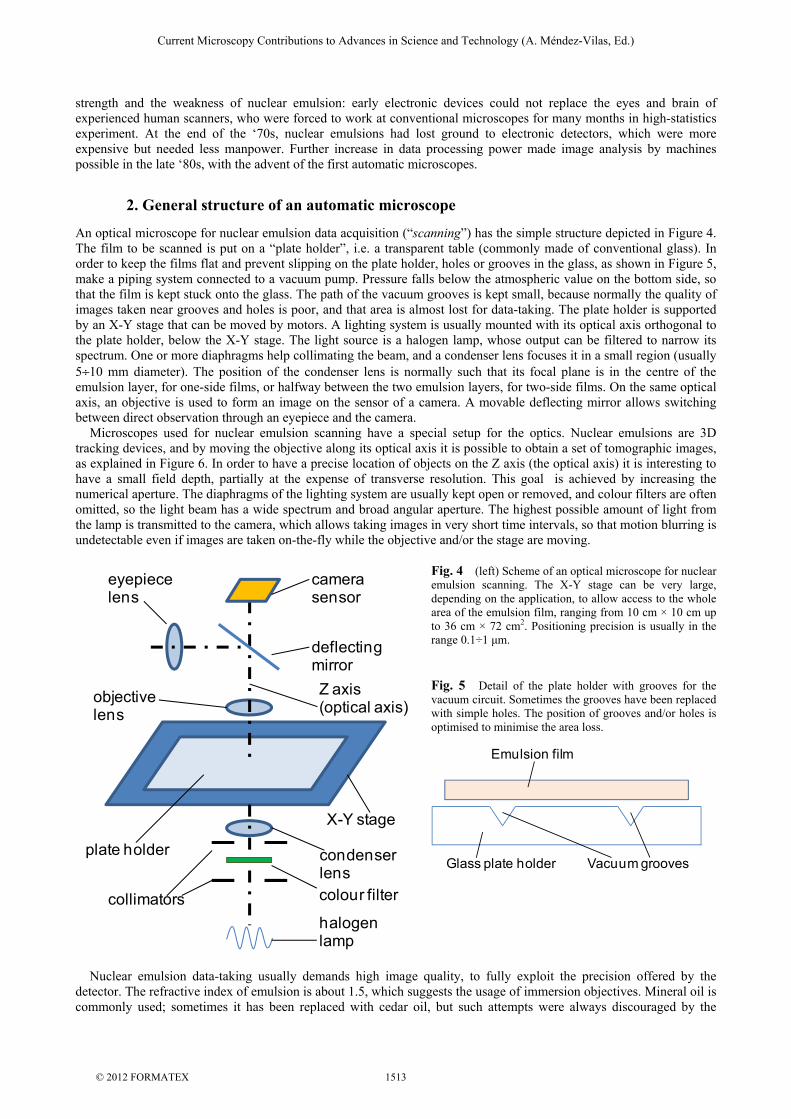
An optical microscope for nuclear emulsion data acquisition (“scanning”) has the simple structure depicted in Figure 4. The film to be scanned is put on a “plate holder”, i.e. a transparent table (commonly made of conventional glass). In order to keep the films flat and prevent slipping on the plate holder, holes or grooves in the glass, as shown in Figure 5, make a piping system connected to a vacuum pump. Pressure falls below the atmospheric value on the bottom side, so that the film is kept stuck onto the glass. The path of the vacuum grooves is kept small, because normally the quality of images taken near grooves and holes is poor, and that area is almost lost for data-taking. The plate holder is supported by an X-Y stage that can be moved by motors. A lighting system is usually mounted with its optical axis orthogonal to the plate holder, below the X-Y stage. The light source is a halogen lamp, whose output can be filtered to narrow its spectrum. One or more diaphragms help collimating the beam, and a condenser lens focuses it in a small region (usually 5÷10 mm diameter). The position of the condenser lens is normally such that its focal plane is in the centre of the emulsion layer, for one-side films, or halfway between the two emulsion layers, for two-side films. On the same optical axis, an objective is used to form an image on the sensor of a camera. A movable deflecting mirror allows switching between direct observation through an eyepiece and the camera. Microscopes used for nuclear emulsion scanning have a special setup for the optics. Nuclear emulsions are 3D tracking devices, and by moving the objective along its optical axis it is possible to obtain a set of tomographic images, as explained in Figure 6. In order to have a precise location of objects on the Z axis (the optical axis) it is interesting to have a small field depth, partially at the expense of transverse resolution. This goal is achieved by increasing the numerical aperture. The diaphragms of the lighting system are usually kept open or removed, and colour filters are often omitted, so the light beam has a wide spectrum and broad angular aperture. The highest possible amount of light from the lamp is transmitted to the camera, which allows taking images in very short time intervals, so that motion blurring is undetectable even if images are taken on-the-fly while the objective and/or the stage are moving.
Fig. 4 (left) Scheme of an optical microscope for nuclear emulsion scanning. The X-Y stage can be very large, depending on the application, to allow access to the whole area of the emulsion film, ranging from 10 cm × 10 cm up to 36 cm × 72 cm2. Positioning precision is usually in the range 0.1÷1 μm. Fig. 5 Detail of the plate holder with grooves for the vacuum circuit. Sometimes the grooves have been replaced with simple holes. The position of grooves and/or holes is optimised to minimise the area loss.
Nuclear emulsion data-taking usually demands high image quality, to fully exploit the precision offered by the detector. The refractive index of emulsion is about 1.5, which suggests the usage of immersion objectives. Mineral oil is commonly used; sometimes it has been replaced with cedar oil, but such attempts were always discouraged by the
deflecting mirror
camerasensor
eyepiecelens
Z axis(optical axis)objective
lens
plate holder
X-Y stage
condenserlens
collimatorshalogenlamp
colour filter
Glass plate holder
Emulsion film
Vacuum grooves
Current Microscopy Contributions to Advances in Science and Technology (A. Méndez-Vilas, Ed.)
© 2012 FORMATEX 1513

interactions with the emulsion itself, which would soon turn out very sticky. In a laboratory with a strong data-taking activity the consumption of oil may become sizable, and since it is also moderately toxic it would be desirable to get rid of it. For this purpose, sometimes image quality has been traded off for more comfortable working conditions, and dry objectives have been used; however, the increased effective field depth unavoidably spoils the quality of images, decreasing either the track recognition efficiency or the angular resolution.
Fig. 6 The objective lens can be moved along the Z axis. Correspondingly, the focused region spans the whole emulsion thickness. Sequences of aligned grains are detected using information from all layers. While the transverse coordinates of developed grains are measured in the image, the Z coordinate is set by the position of the Z axis. The precision on Z is given by the field depth, which is kept below 4 μm in common applications. The maximum tolerable field depth depends on the amount of fog in the emulsion: lower amounts of fog, e.g. below 5 grains / 1000 μm3, could allow also larger field depth about 5 μm; with fog above 10 grains / 1000 μm3 the image is usually too crowded for practical usage unless the field depth is reduced below 2 μm.
2. The first automatic microscope: the Track Selector from its origin to the 90‘s
The concept of an automatic system to look at nuclear emulsion images was first proposed in Japan in 1974 [2], but the technology was not advanced enough at that time to make a really functioning device. The first step was automation of stage control, through the development of a unit that could undertake the task of motion control and image acquisition without having to use computing resources from the host computer CPU. The resulting machinery was actually a semi-automatic scanning system, controlling a microscope with DC-motor equipped X-Y and Z stages. The position readout precision was 1 μm. The system was used for the E531 (Fermilab) experiment, and later for WA75 (at CERN), E653 and E176 (at Fermilab). At the end of the decade, the first automatic scanning system was developed adding image processing capabilities. A computer hosted both the stage interface and a video-image processor device, named “Track Selector” [3]. The camera sensor was a CCD with a size of 2/3” and 512 × 512 pixel, with a pixel size about 0.3 μm when coupled to a Tiyoda 50× objective, and a total view size of 160 × 160 μm2. At each field of view, a tomography of 16 frames was acquired, at the speed of 30 frames per second. Image recognition worked by the following steps:
1. The analog signal of each horizontal scan line was differentiated, picking only tiny spikes, with the typically expected size for grains.
2. The digitized signal was stored into one of the 16 frame memories, each corresponding to one layer of the tomography. Hence the frame memories contained a binarized version of the image, with spots of “dark” pixels over a “white” background.
3. The 3D tracking looked for tracks with a predicted slope, which were “selected” out of a background. The contents of the frame memories were shifted with a desired slope, and the contents were summed. Grains aligned along that direction would pile-up and make a spike that showed the presence of a track (Figure 7).
Because of distortion, scattering and measurement errors, the real track slope could be slightly different from the predicted one. In order to allow for such effects, the Track Selector “expanded” dark spots by one pixel before summing the images, actually increasing the alignment tolerance.
Fig. 7 Illustration of the Track Selector algorithm. The left sketch depicts grains in an emulsion layer. The blue ones were produced by the passage of a charged particle, and are well aligned. If the contents of the frame memories are not skewed with the right angle, the sum of pulses produced by each grain, or possible random alignments, does not pile up to give a signal above a proper threshold. The right sketch shows what happens when the correct shift is applied, i.e. when the track has the predicted slope: the signals of the aligned grains pile up to form a pulse that exceeds a threshold (red pulse), signalling that a track is there. The actual value of the threshold defines efficiency and purity, and has to be tuned according to the amount of fog and sensitivity of the emulsion.
If a specific track was being followed from film to film, the slope was known in advance, and hence the Track Selector could confirm/disprove the existence of a track in a certain film (non-existence meaning that the particle had undergone an interaction). If several angles were tried, the Track Selector could reconstruct all tracks in an angular
Objective lens
Emulsion film
Focusedregion
Sum Sum
Current Microscopy Contributions to Advances in Science and Technology (A. Méndez-Vilas, Ed.)
© 2012 FORMATEX 1514
region. This operational mode was of course slower, the working time growing linearly with the total angular acceptance. A large area was covered by tiling many fields of view repeating the same acquisition cycle with the X-Y stage being moved only between each view and the next. The Track Selector was tested and used for the E653 experiment at Fermilab, studying hadroproduction of particles with charm and beauty quarks, and the WA75 experiment (search for open beauty production) at CERN. It was able to analyze automatically 0.0025 cm2/h of emulsion film, searching for tracks with slope below 0.4 (both X and Y projections) with respect to the normal to the film plane. In 1994 the processing power of the Track Selector was improved to obtain the “NTS” (a shortcut for “New Track Selector”), used in combination with the Nikon “L-mic” microscope base. The NTS used CPLD (Complex Programmable Logical Devices) to perform many more slope trials per unit time, boosting the ability of the system to detect and measure complex interactions, in which many particles were produced. The data rate was also increased, by taking images with a Photocam camera operated at 120 frames per second. The scanning speed jumped to 0.08 cm2/h of emulsion film, with the same angular acceptance of the TS. The NTS was used in the WA95 (CHORUS [4]) experiment, searching for νμ→ντ oscillation appearance in the Wide Band Neutrino Beam at CERN, to locate automatically about 94% of the neutrino interactions produced and studied (about 170,000), and exclude the high δm2 region (1 eV2 and above) of the parameter space for neutrino oscillation in the νμ→ντ channel.
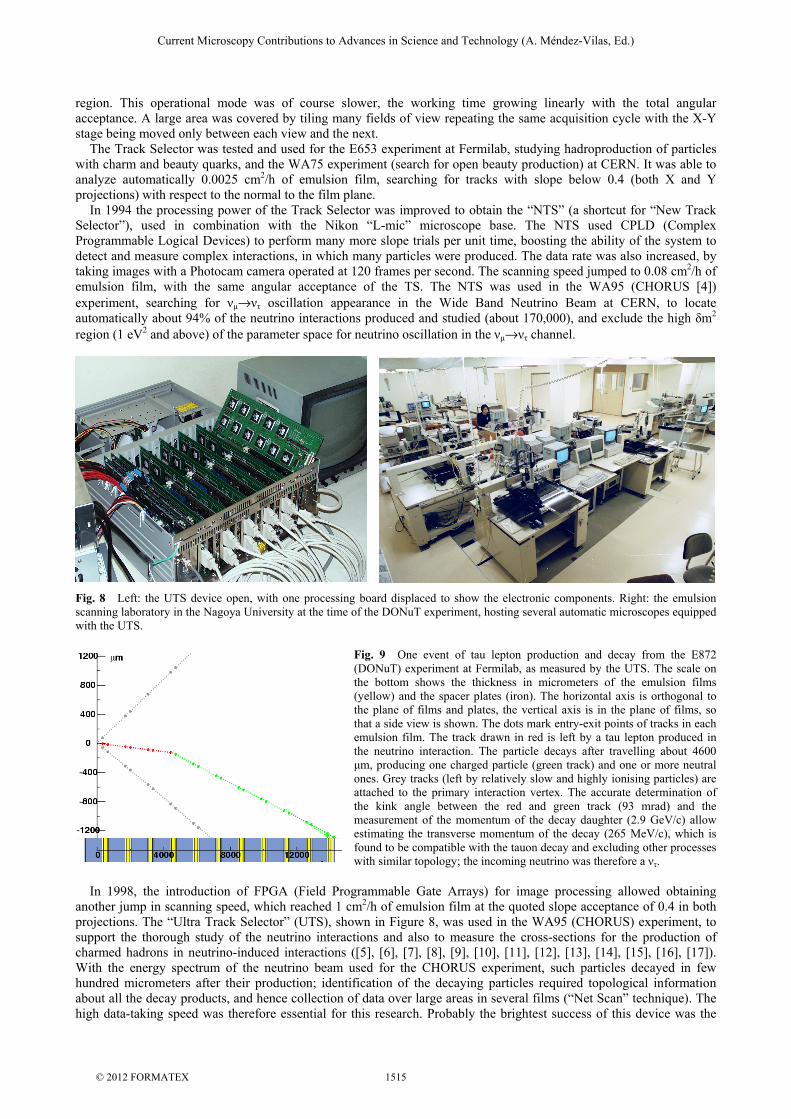
Fig. 8 Left: the UTS device open, with one processing board displaced to show the electronic components. Right: the emulsion scanning laboratory in the Nagoya University at the time of the DONuT experiment, hosting several automatic microscopes equipped with the UTS.
Fig. 9 One event of tau lepton production and decay from the E872 (DONuT) experiment at Fermilab, as measured by the UTS. The scale on the bottom shows the thickness in micrometers of the emulsion films (yellow) and the spacer plates (iron). The horizontal axis is orthogonal to the plane of films and plates, the vertical axis is in the plane of films, so that a side view is shown. The dots mark entry-exit points of tracks in each emulsion film. The track drawn in red is left by a tau lepton produced in the neutrino interaction. The particle decays after travelling about 4600 μm, producing one charged particle (green track) and one or more neutral ones. Grey tracks (left by relatively slow and highly ionising particles) are attached to the primary interaction vertex. The accurate determination of the kink angle between the red and green track (93 mrad) and the measurement of the momentum of the decay daughter (2.9 GeV/c) allow estimating the transverse momentum of the decay (265 MeV/c), which is found to be compatible with the tauon decay and excluding other processes with similar topology; the incoming neutrino was therefore a ντ.
In 1998, the introduction of FPGA (Field Programmable Gate Arrays) for image processing allowed obtaining another jump in scanning speed, which reached 1 cm2/h of emulsion film at the quoted slope acceptance of 0.4 in both projections. The “Ultra Track Selector” (UTS), shown in Figure 8, was used in the WA95 (CHORUS) experiment, to support the thorough study of the neutrino interactions and also to measure the cross-sections for the production of charmed hadrons in neutrino-induced interactions ([5], [6], [7], [8], [9], [10], [11], [12], [13], [14], [15], [16], [17]). With the energy spectrum of the neutrino beam used for the CHORUS experiment, such particles decayed in few hundred micrometers after their production; identification of the decaying particles required topological information about all the decay products, and hence collection of data over large areas in several films (“Net Scan” technique). The high data-taking speed was therefore essential for this research. Probably the brightest success of this device was the
Current Microscopy Contributions to Advances in Science and Technology (A. Méndez-Vilas, Ed.)
© 2012 FORMATEX 1515

first detection of ντ charged current interactions in emulsion, through the identification of the associated τ lepton in the DONuT experiment ([18], [19], [20]) at Fermilab. Figure 9 shows one such interaction, as reconstructed from data collected by UTS-equipped automatic microscopes. Given the short lifetime of the τ lepton (about 2.9×10⁻¹³s), a topological signature for the decay was possible only using nuclear emulsion films, scanned by suitable microscopes. In all of these versions the TS algorithm was extremely efficient, often exceeding 95% in track detection; however, its working method was not optimized to follow the track bending due to parabolic distortion in thick emulsion layers. For thin emulsion layers, this was not a problem; in case of emulsion thickness exceeding about 100 μm, either the acquisition was limited to 100 μm near the emulsion surface (less affected by parabolic distortion), or the emulsion was acquired in several slices, each about 100 μm thick. The TS/NTS/UTS were successfully installed and operated not only in their mother institution, the University of Nagoya, but also in other laboratories in Japan and Europe.
3. Software-based automatic microscope systems in the 90‘s
3.1 The first prototype of the SySal system
At the beginning of the 90’s, the Emulsion Group of the University of Salerno had a custom-made system for automatic emulsion scanning. The microscope had a plate-holder with a working area of 22×8 cm2. The basic hardware was a Leitz Ortholux with stepper motors. A 22× oil immersion objective was used to produce images on the surface of the CCD sensor of a conventional JVC camera with a resolution of 512×512 pixel. The signal format was PAL, hence analog TV-like, interlaced. This last detail was a serious bottleneck, because row interlacing among even and odd rows prevented a quick view change, or data-taking “on-the-fly”. Instead, the stage had to be stopped at every image, so that the two half-images were consistent with each other. In such a setup, each pixel covered an area of 0.24×0.30 μm2. In a first version of this system, digitisation of the analog signal from the camera was performed by an AT&T Targa board, hosted on the same workstation that controlled the motors of the stage and optical axis of the microscope. The processor of the workstation was an Intel 80486. This was the first prototype of SySal (an acronym standing for “System of Salerno”) [21]. 2D images acquired by the Targa board were digitised in memory, and the grains in each image were recognised in a four-step procedure:
1. the image was “binarized” by applying a threshold on the grey level; 2. in each row of the image, “dark pixels” were grouped in horizontal segments; 3. segments from consecutive rows touching each other were grouped to form clusters of dark pixels; 4. clusters with proper shape and size were promoted to grains.
Figure 10 shows a sketch of the 2D image processing algorithm.
Fig. 10 Sketch of the image processing algorithm in the first version of SySal. Images are binarized, row by row, by comparing the grey level of each pixel to a threshold. Sequences of pixels whose grey level is below threshold in each row are grouped together in a cluster. Most fog grains are expected to be small, and very large clusters are due to scratches and dust on the emulsion surface. In addition, grains are expected to appear like spheres in the wavelength of common lamps. Hence, clusters with proper size and shape are selected as possible grains of charged particle tracks. In a later version of this prototype system, segment recognition was moved to a Digital Signal Processor developed on purpose, which speeded up processing. Segment clustering and filtering to grains were instead kept on the host computer CPU. After recognising grains in 2D images, the information from each tomographic sequence was further processed to find 3D tracks. At the time of its development, the 3D tracking algorithm was optimised for tracks that had a direction almost orthogonal to the film plane; nevertheless, there was no angular pre-selection, and the acceptance was indeed quite large for all practical purposes, i.e. tan θ < 0.4 (θ being the angle between the track and the optical axis). The system was used to work on thick emulsion films (100÷350 μm), and its first task was multiplicity counting in heavy ion interactions from the NA34 experiment. Such emulsion films had a sizable parabolic distortion, and indeed the tracking algorithm was able to adaptively follow the bending of tracks along the whole thickness of the emulsion layer. The concept is sketched in Figure 11. A track was built starting from a seed of two grains that defined an initial line. The two seed grains were chosen from non-consecutive images, and the seed was accepted if a third grain was found
Current Microscopy Contributions to Advances in Science and Technology (A. Méndez-Vilas, Ed.)
© 2012 FORMATEX 1516

aligned with the first two. The algorithm then attempted to append more grains at both ends of the seed, selecting grains aligned with the initial seed within proper tolerances (0.3÷1 μm). After appending each new grain the slope and position were updated, to allow for track bending due to distortion, which was also the driving parameter in defining alignment tolerances. When no more grains could be appended, grains that were far from the local parabolic fit (above 2 standard deviations) were discarded. The track quality was compared to proper cuts, most commonly minimum length, minimum number of grains, and maximum r.m.s. deviation of grains from the global parabolic fit. This approach to track recognition was very advanced for the time, and by preserving the identity of each grain it was possible to quantitatively measure the ionisation; moreover, since each track had the full list of the grains used, it was also possible to recover distortion effects by measuring the relative displacement of two tracks in each horizontal plane and comparing the positions of the respective grains. This allowed very precise semi-automatic measurements to be performed, thus establishing the first real competition for quality between human scanners and machines. It is worth to mention that the same system also allowed off-line processing of recorded video-images, and indeed it was used several times to analyze data originally taken by the TS-NTS system for the WA95 (CHORUS) experiment at CERN.
Fig. 11 Sketch of the tracking algorithm in the first version of SySal, in a small 3D region on five consecutive layers. On each layer, the image is divided in cells to speed up grain searching. The size of each cell is chosen in such a way that its occupancy number is very low, hence reducing the combinatorial complexity of the problem. The two blue dots stand for the track seed grains, taken in two non-consecutive layers, but in the same cell position. These define the first line along which other grains, shown in red, are sought to be appended. Grey dots are grains that are nearby but not aligned with the track seed. Given the extrapolated position of the seed on each layer, the first neighbouring cells, marked with asterisks, are checked for presence of an aligned grain, except for the layers between the seeding ones: in that case, the only cell checked is in the same horizontal position as the two seed grains.
3.2 The SySal system
Starting from the middle of year 1996, the Salerno Emulsion Group evolved the prototype into a fully automatic system. The microscope base was the same Nikon “L-mic” used for the NTS, with its large plate holder, about 40×40 cm2. The system was used mostly for the WA95 (CHORUS) experiment ([4]). The plate holder was replaced with an extended version, able to hold emulsion films exposed in the experiment in full size (36×71cm2) without cutting them to smaller samples. Being a software-based system, integration of new hardware was very quick in the following years, with the availability of new components on the market of industrial automation, and several setups were actually used. The one that was used for the longest time is described in the following. The microscope was equipped with stepper motors (VEXTA Nanostep RFK by Oriental Motor). Motion control was obtained through FlexMotion PCI 7344, by National Instruments. The board could drive up to 6 axes in closed-loop (by getting position feedback from encoders), but only three were actually used. In the final setup, the precision reached on the X and Y axes was about 1 μm and about 0.5 μm on the Z axis, by means of linear encoders. The image was formed on the sensor of the progressive-scan Hitachi KP-F110 CCD camera, coupled to a Tiyoda 50× oil immersion objective; the resolution obtained was 0.297 μm/pixel, well suited for CHORUS emulsions (mostly produced by FujiFilm). Adoption of a progressive-scan camera allowed acquisition on-the-fly at 30 frames per second, even rows being consistent with odd ones.
Fig. 12 Automatic detection of minimum ionising particles and highly ionising ones. Left: the picture shows a minimum ionising particle track in the X-Y projection, with small spheroidal grains aligned in a sequence. The shape of each grain gives no hint about the position of other grains in the same track. Right: a strongly ionising track (e.g. nuclear fragment, alpha or slow proton), sketched as a blue strip, is recognised as several elliptical clusters, one in each tomographic
layer; the shape of each cluster defines a region of angular compatibility where other clusters of the same track may be found, thus reducing the combinations to a very small number. In the first version of such a system, a Matrox Pulsar digitizer board with almost no processing capability was used. The CPU of the host workstation, a Pentium running at 200 MHz, was used to discriminate dark and light pixels, build the segments and the clusters. The generation of Pentium II at 266 MHz featured MMX-extended instructions, which allowed a relatively easy implementation of FIR (Finite Impulse Response) digital filters. The simplest one was an
∗∗
∗
∗∗∗ ∗∗∗
Current Microscopy Contributions to Advances in Science and Technology (A. Méndez-Vilas, Ed.)
© 2012 FORMATEX 1517

edge-detection filter acting only on horizontal rows. This filter yielded a considerable improvement in grain discrimination. At the beginning of 1998, the Matrox Genesis vision processor became available, which featured a Texas Instruments C80 control unit and a NOA (Neighborhood Operation Accelerator), specifically designed for mathematical convolution operations such as those required by digital filters. While the structure of the system remained basically software-oriented, usage of a programmable hardware was a good compromise between speed and flexibility. The FIR filter was implemented with a 6×6 kernel, completely user-defined, and working in 2D; the filter output was dependent on the amount of available light and the residual optical aberrations (which showed up mostly near the edges of the field of view). Such effects were compensated by adoption of different thresholds in the same view, in a “mosaic” or “patchwork” scheme. The output of the Matrox Genesis was a binary map of pixels, and they were processed by the host CPU to work out clusters. The system was installed at the University of Salerno on two machines, and on one machine at the University of Rome. It was used to monitor the flux of muons in the decay tunnel of the Wide Band Neutrino Beam at CERN, to measure the flux from the X7 beam in the experimental hall of the West Area, and to take part in the main analysis of the WA95 (CHORUS) experiment, contributing to the final statistics with about 10,000 neutrino interaction events located and studied. The tracking algorithm was evolved to use also the shape of clusters of dark pixels, which made it also capable of discriminating highly ionizing particle tracks and nuclear fragments, usually emitted isotropically after nuclear de-excitation or fission. Figure 12 shows a sketch of the algorithm logic for recognition of highly ionizing tracks at very wide angles. The track recognition software was able to measure distortion in each field of view and compensate it. During the massive acquisition tasks of the CHORUS experiment, penetrating tracks produced in the interactions were followed across several films, until the stopping point, i.e. the neutrino interaction vertex, was reached. In most cases, SySal was able to detect the vertex, by studying on-line the convergence of patterns of tracks from films downstream of the vertex point. A dedicated software, running on another machine while the scanning workstations were taking data, analysed data files as soon as they were produced, checking for possible interaction vertices. On a positive signal, a set of images was recorded of the field of view of the vertex, for later confirmation by human operators without the need to use the microscope manually. The competition with the UTS was natural in terms of speed, and also SySal was credited to take data at 1 cm2/h/side. Both systems provided all the tracks present in the field of view. The ability to resolve each grain and to observe natively the full thickness of the emulsion made SySal especially easy to use for the study of short-lived particles, since they could be followed up to the interaction vertex and measured grain-by-grain. Figure 13 shows a neutrino interaction from CHORUS with the typical topology of production and decay of a charmed meson.
Fig. 13 Charm production in CHORUS. The films had two emulsion layers, 350 μm thick, with 90 μm plastic base. Penetrating tracks (grey dotted lines), from charged products of interactions upstream in the target, are reconstructed in two halves. The νμ beam has the direction of the Z axis, orthogonal to the film plane. A νμ interacts near the plastic base, producing 4 prongs, one of which (track 2) is identified as a μ-. The event was located following track 1. The impact parameters of tracks are below 3 μm. Track 3 has a “kink” of 103 mrad, after a flight length of 304 μm, compatible with a D+ decay. Other interpretations such as distortion or hadron interaction are excluded by the analysis of the positions of each grain in the track and the absence of other charged kink daughters.
3.3 The CERN/NIKHEF automatic scanning system
Another system was used for mass data-taking in the WA95 (CHORUS) experiment at CERN, which was the biggest emulsion-based experiment in the ‘90s. It was developed as a joint project by CERN and NIKHEF, merging ideas from the Track Selector approach and from SySal, but also introducing some innovations. It had a unusually large microscope stage: as mentioned above, the Nikon microscopes were equipped with a modified plate-holder that allowed not cutting the plates, but still only half of the plate was accessible to measurement; after data acquisition in one half, it had to be rotated by 180° in its plane to complete data-taking in the second half. The CERN hardware, developed with Micos Gmbh, had instead a working area as large as 40×80 cm2, suitable to cover the full size of the CHORUS films. The optics was also developed on purpose for this project, integrating an automated oil dispenser and recuperation system near the objective, in order to minimize the consumption of immersion oil and leakage to the nearby environment. The system featured a CCD camera, operated at 15 frames per second, with 1 MPixel resolution coupled to a 40× oil immersion objective (field of view about 350×350 μm2); later it evolved to usage of a CMOS camera operated at 50÷100 frames per second, coupled to a 28× oil immersion objective. The camera was driven by a C80 DSP to control the exposure and data transfer, and data were sent to two C620 DSP’s for processing, where a 3-pole IIR (Infinite Impulse Response) filter, acting on each horizontal scan line, prepared the image for binarization; the resulting segments (as described for the SySal system) were zero-suppressed and sent via DMA transfer to the host workstation memory. Cluster recognition was then performed by the Pentium III processor.
x
y
z
Current Microscopy Contributions to Advances in Science and Technology (A. Méndez-Vilas, Ed.)
© 2012 FORMATEX 1518

It was customary to use this system in three different modes: 1. “prediction scan”, i.e. search for a track of known slopes in a small region, taking 25 layers distributed in 100 μm
thickness and running a software implementation of the Track Selector algorithm for track recognition; 2. “Net Scan” , taking 25 layers distributed in 100 μm thickness, with a tracking algorithm that could recognise tracks
of any angle (within a slope acceptance usually about 0.4), by organising data in a 3D tree, looking for the longest possible sequence of aligned grains;
3. “vertex analysis” with data taking in the whole emulsion layer, using 60 layers distributed in 350 μm thickness, and general tracking.
An interesting idea pioneered in this system was the delocalization of data processing. The Track Selector approach had motion control, image processing and tracking implemented in a single device; SySal also integrated all the hardware in the same machine, with the software expected to run on the host workstation CPU. The CERN/NIKHEF approach explored the possibility to share the workload of tracking to a farm of computers. This idea was revived a few years later, as shown in the following.
4. Fast systems in the 21st century: the European Scanning System and the Super-UTS
Most of the evolution of the microscope systems at the beginning of the 21st century is driven by the needs of the CNGS-1 (OPERA) experiment at the LNGS ([22],[23]), searching for ντ appearance as a result of neutrino oscillation in an emulsion detector; a total area of the order of 100 m2 has to be scanned, and preliminary results are available at the time of the compilation of this text [24]. The same systems were used also for the PEANUT ([25]) experiment. The ability to acquire data faster, more than one order of magnitude with respect to the previous generation of machines, also allowed side applications of high-energy and particle physics science, at least three of which are worth mentioning: 1. some studies of interactions of particles from hadron or ion beams, like the ones used for cancer therapy, in a
medium with the same average density as living tissue, use nuclear emulsions as tracking devices to measure the initial and final states of the processes ([26],[27]);
2. the inner density distribution of volcanic buildings can be investigated by measuring the differential absorption rates of muons from secondary particles of cosmic rays ([28]);
3. anomalies in the absorption rates in ground or rock of muons from cosmic rays may signal the presence of concentration of ores.
4.1 The European Scanning System (ESS)
The SySal software has been evolved to coordinate all the hardware of what is now called the European Scanning System ([29],[30]), developed mostly by the University and INFN Sections of Bari, Bologna, Napoli, Padova, Roma, University of Salerno, Laboratori Nazionali di Frascati and Laboratori Nazionali del Gran Sasso. The University of Bern focused on using it with dry objective [31]. The ESS is used also in other laboratories in Europe and Japan researching on high-energy physics and related applications. Figure 14 shows an assembled ESS system.
Fig. 14 An automated microscope implementing the European Scanning System, built with Micos XY stage and Z stage, Mikrotron MC1310 camera and Nikon optics. The workstation that hosts the Matrox Odyssey vision processor and the NI FlexMotion PCI 7344 motion controller is not shown.
Fig. 15 The interaction of a pion (red track) in a target of lead plates (1mm thickness) and emulsion films (about 0.3 mm thickness) as reconstructed and automatically measured by an ESS microscope. The white segments stand for the tracks actually measured in emulsion films, which are aligned to reconstruct the particle path on a large scale.
Current Microscopy Contributions to Advances in Science and Technology (A. Méndez-Vilas, Ed.)
© 2012 FORMATEX 1519
The mechanical base of the ESS microscope is produced by Micos Gmbh. The MS-8 stage, equipped with VEXTA NanoStep RFK motors, provides X-Y motion and support for the plate holder. The overall travel length in both axes is 25 cm. The position readout accuracy is 0.1 μm on the whole working area. The Z stage is an LS-110, with the same motors and position readout accuracy of 0.01 μm. The illumination system and the optical tube were developed by Nikon Italia. A Nikon CFI Plan Achromat 50× oil immersion objective with 0.9 NA is commonly used, and the condenser is tuned to provide the same numerical aperture. The image is formed on the sensor of a Mikrotron MC1310 CMOS camera, with 1280×1024 pixels; the pixel size in such conditions is 0.3097 μm/pixel. The camera is operated at 376 frames per second, and transfers images through a Single-Full Camera Link connection to a Matrox Odyssey vision processor. The motion controller is still the NI FlexMotion PCI 7344 used in the CHORUS days by the SySal system. The host workstation has a quad-core processor, used to drive the motion controller and control grabbing / processing on the Odyssey, and to recognise clusters from segments of dark pixels, as explained in section 3.1. At each field of view, the XY stage holds steady while the Z axis moves downwards, and the camera acquires a sequence of images; at the end of the Z scanning sweep, the Z axis resets to the beginning of the next sweep, while the XY stage moves to the next view. The full cycle takes 185 ms, but data-taking uses only 55 ms for 15 images in the emulsion; vibrations must be damped before the next cycle begins. The speed of 20 cm2/h/side is set by the processing power of the Matrox Odyssey vision processor. The pipeline for 2D image processing is evolved from the SySal one, including: 1. subtraction of pixel ADC pedestals, dead pixels, dust spots on the sensor; 2. compensation of lighting (equalization of the grey level histogram); 3. 2D FIR filtering to enhance objects of the expected size of the grains; 4. a threshold map optimised over the whole image to compensate lighting variations and optical aberrations; 5. recognition of horizontal segments; 6. assembling segments into clusters of dark pixels.
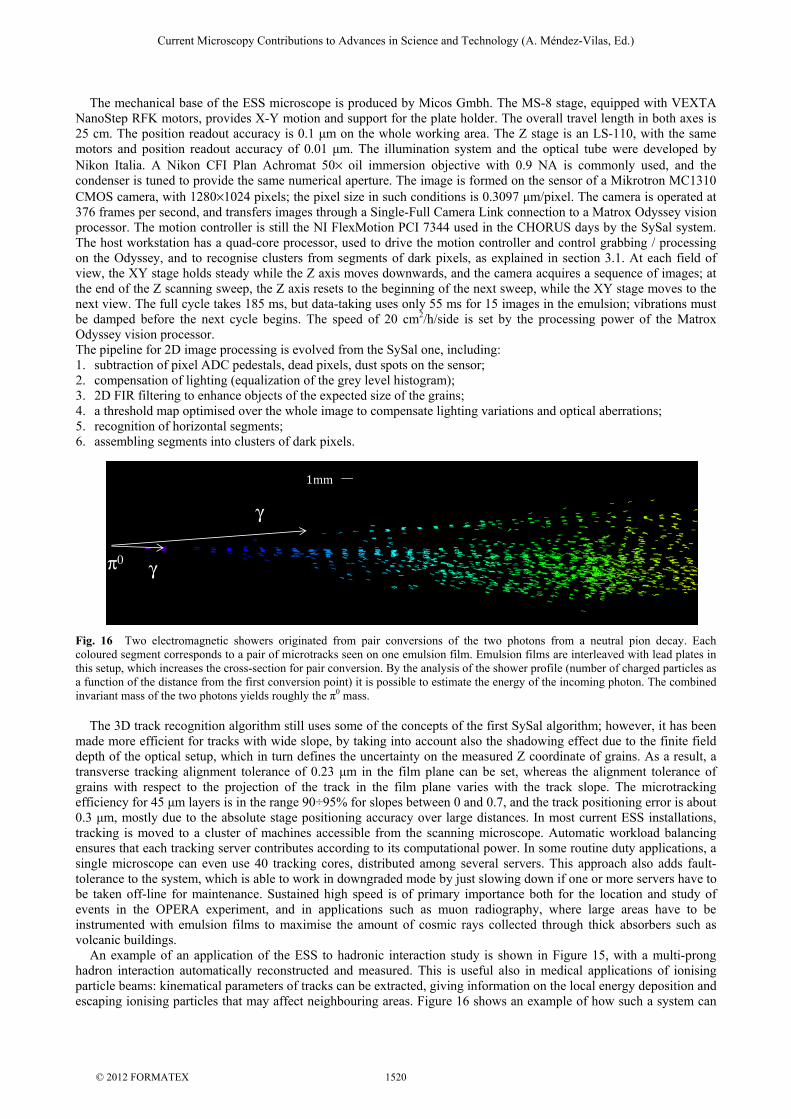
Fig. 16 Two electromagnetic showers originated from pair conversions of the two photons from a neutral pion decay. Each coloured segment corresponds to a pair of microtracks seen on one emulsion film. Emulsion films are interleaved with lead plates in this setup, which increases the cross-section for pair conversion. By the analysis of the shower profile (number of charged particles as a function of the distance from the first conversion point) it is possible to estimate the energy of the incoming photon. The combined invariant mass of the two photons yields roughly the π0 mass.
The 3D track recognition algorithm still uses some of the concepts of the first SySal algorithm; however, it has been made more efficient for tracks with wide slope, by taking into account also the shadowing effect due to the finite field depth of the optical setup, which in turn defines the uncertainty on the measured Z coordinate of grains. As a result, a transverse tracking alignment tolerance of 0.23 μm in the film plane can be set, whereas the alignment tolerance of grains with respect to the projection of the track in the film plane varies with the track slope. The microtracking efficiency for 45 μm layers is in the range 90÷95% for slopes between 0 and 0.7, and the track positioning error is about 0.3 μm, mostly due to the absolute stage positioning accuracy over large distances. In most current ESS installations, tracking is moved to a cluster of machines accessible from the scanning microscope. Automatic workload balancing ensures that each tracking server contributes according to its computational power. In some routine duty applications, a single microscope can even use 40 tracking cores, distributed among several servers. This approach also adds fault-tolerance to the system, which is able to work in downgraded mode by just slowing down if one or more servers have to be taken off-line for maintenance. Sustained high speed is of primary importance both for the location and study of events in the OPERA experiment, and in applications such as muon radiography, where large areas have to be instrumented with emulsion films to maximise the amount of cosmic rays collected through thick absorbers such as volcanic buildings. An example of an application of the ESS to hadronic interaction study is shown in Figure 15, with a multi-prong hadron interaction automatically reconstructed and measured. This is useful also in medical applications of ionising particle beams: kinematical parameters of tracks can be extracted, giving information on the local energy deposition and escaping ionising particles that may affect neighbouring areas. Figure 16 shows an example of how such a system can
π0
γ
γ
1mm
Current Microscopy Contributions to Advances in Science and Technology (A. Méndez-Vilas, Ed.)
© 2012 FORMATEX 1520

yield kinematical quantities and particle identification starting from purely geometrical data. Example of the estimation of particle moment from scattering measured in emulsion can be found in [32]. Such capabilities are needed for the study of high-energy interactions and the detection of rare processes, such as charm production and neutrino oscillations.
4.1 The Super-UTS
The operating principle of the Track Selector is still the foundation for the Super-UTS ([33]), usually shortcut as S-UTS, a further evolution of the UTS. Most of the improvements for the latter focused on increasing the scanning speed, and this required re-designing the automatic microscope in many aspects. Figure 17 shows a picture of this automatic microscope system. A Tiyoda 35× magnification objective, with 0.85 NA, is used in oil with refractive index matching the one of emulsion films. The camera was developed on purpose for this project by NAC Imaging Technology: the CMOS sensor has 512×508 pixels, and each pixel covers an area of 0.45×0.45 μm2 with the above mentioned objective; 3000 frames per second are output to a dedicated hardware device for image processing. The data-taking cycle is repeated about 90 times per second, and the top-down motion of the objective is produced by a piezo-electric device to reduce the inertia. A novel concept introduced by the S-UTS is the reduction of dead times due to mechanics by abandoning the “stop and go” data taking cycle: instead of having the stage holding steady while the optical axis is moved to produce the tomographic sequence, the X axis is always kept in motion. Nevertheless, the images do not have a transverse skewing, because the objective moves horizontally while descending to follow the motion of the stage. This transverse motion is obtained by another piezo-drive acting on the objective. Figure 18 clarifies the concept in a sketch. The motion of both piezo-drives is synchronized so that the relative shift between the objective and the stage is smaller than the transverse size of one pixel. Images are processed in the following steps: 1. one-dimensional filtering; 2. binarization using a threshold on the filter output and encoding of pixel data to lists of X-Y positions; 3. pixel expansion (depending on track slope); 4. shift-and-sum as in the case of TS, NTS, UTS. In order to cover a region of slope up to |tanθx,y|<0.6, about 1200 shift-and-sum cycles have to be applied on the 16 layers in the tomography. With the constraint that processing should keep the pace with the data flow, these four steps would be a huge computing load for a typical CISC or RISC processor, but the logic of each step is very easy to implement in an FPGA, where it can be obtained by implementing addition and shift operations. The S-UTS communicates with a host workstation to receive data-taking commands and output data in the final format used for later analysis.
Fig. 17 View of a microscope equipped with the Super-UTS. The mechanical base is still the Nikon microscope used for the CHORUS experiment, but it has been largely revisited to introduce the concept of “follow-shot” motion, i.e. the ability of the objective to compensate the transverse motion of the stage. Fig. 18 Sketch of the “follow-shot” motion technique to acquire still images with one horizontal axis in motion. The triangles depict the area covered by the objective in the two outermost positions in the data-taking stroke.
The upgrades introduced in optics, motion control, image acquisition and processing make S-UTS microscopes able to take data at a speed as high as 72 cm2/h/side, with a microtracking efficiency about 95% and a positioning precision about 0.4 μm on 45 μm thick emulsion layers. Recently, a 28× magnification objective allowed reaching 121 cm2/h/side. At the present time, the S-UTS is primarily used to locate neutrino interactions in the films of the OPERA experiment, where a few tracks are to be detected in a wide area (10÷100 cm2) and singled out of a background of microtracks due to environmental radiation. The output in terms of events/hour in this case is of the order of few units, because of the low event density. In addition to the primary task, a variety of other applications is possible. With proper detector setup and exposure duration, a single automatic microscope can collect in few hours a high statistics of interactions for later analysis. Figure 19 shows a sample of data for ion interactions in a detector simulating living
objectivelens in top position
objectivelens in bottom position
Layers of the tomographicImage sequence
Current Microscopy Contributions to Advances in Science and Technology (A. Méndez-Vilas, Ed.)
© 2012 FORMATEX 1521

tissue, for studies on cancer therapy by ion beams. The S-UTS is also actively used for muon radiography of volcanoes and study of gamma-ray bursts through balloon experiments.
Fig. 19 Interactions of ions in a detector simulating the properties of living tissue, instrumented with nuclear emulsion films as tracking planes. Different colours stand for different emulsion films. High statistics to study nuclear interactions is easily available by fast systems that also provide excellent spatial and angular resolution. The analysis of the ionisation by each track also allows to identify the different ions produced in the primary interaction, which cause additional ionisation and in turn may also have secondary interactions.
5. Conclusions and outlook
The technology of automatic microscopes optimised for 3D analysis of tracks from nuclear emulsion films is evolving quickly, and it is fair to say that the availability of new and more powerful devices is driving the emulsion technique to new experiments and applications that could not be imagined even a few years ago. The ability to produce high statistics restarted a competition with electronic detectors for high-energy physics that microscopes easily win on the field of data quality and detail, with sub-micron spatial precision. The next generation of high-speed microscopes will exploit wide fields of view, obtained through custom optics, larger sensors and also multi-head readout, using many CMOS sensors to cover wider areas. Advanced mechanics and special motion control will also help speed up the data acquisition. Data processing will massively use the GPGPU (General Purpose use of Graphical Processing Unit) paradigm, with relatively cheap units working in parallel not only for image recognition, but also performing filtering and pre-analysis. From the semi-automatic devices of early days, automatic microscopes are hence evolving towards smarter, sophisticated acquisition stations that produce data immediately suitable for analysis in fundamental physics as well as in a variety of wide-interest applications.
References
[1] Lattes C, Muirhead H, Occhialini G, Powell C, Processes Involving Charged Mesons, Nature 159; 1947: 694 [2] Niwa K, Hoshino K, Niu K, Proc. Int. Cosmic Ray. Symp. on High Energy Phenomena; 1974: 149 [3] Aoki S, Hoshino K, Nakamura M, Niu K, Niwa K, Torii N, Fully Automated Emulsion Analysis System, NIM B 51; 1990: 466 [4] Eskut E et al. (CHORUS Collaboration), Final results from a search for nu-mu to nu-tau oscillations with the CHORUS experiment, Nucl. Phys. B 793 ; 2008: 326 [5] Kayis-Topaksu A et al. (CHORUS Collaboration), Measurement of D0 production in neutrino charged current interactions, Phys. Lett. B 527 ; 2002: 173 [6] Kayis-Topaksu A et al. (CHORUS Collaboration), Observation of one event with the characteristics of associated charm production in neutrino charged-current interactions, Phys. Lett. B 539 ; 2002: 188 [7] Kayis-Topaksu A et al. (CHORUS Collaboration), Determination of the semi-leptonic branching fraction of charm hadrons produced in neutrino charged-current interactions, Phys. Lett. B 549 ; 2002: 48 [8] Kayis-Topaksu A et al. (CHORUS Collaboration), Measurement of Lambda_c production in neutrino charged-current interactions, Phys. Lett. B 555 ; 2003: 156 [9] Kayis-Topaksu A et al. (CHORUS Collaboration), Cross-section measurement for quasi-elastic production of charmed baryons in neutrino nucleus interactions, Phys. Lett. B 575 ; 2003: 198 [10] Onengut G et al. (CHORUS Collaboration), Measurement of charm production in antineutrino charged-current interactions, Phys. Lett. B 604 ; 2004: 11 [11] Onengut G et al. (CHORUS Collaboration), Measurement of fragmentation properties of charmed particle production in charged-current neutrino interactions, Phys. Lett. B 604 ; 2004: 145 [12] Onengut G et al. (CHORUS Collaboration), Measurements of D-zero production and branching fractions in neutrino nucleon scattering, Phys. Lett. B 613 ; 2005: 105 [13] Onengut G et al. (CHORUS Collaboration), Measurement of D-star production in neutrino interactions, Phys. Lett. B 614 ; 2005: 155 [14] Onengut G et al. (CHORUS Collaboration), Search for Superfragments and Measurement of the Production of Hyperfragments in Neutrino-Nucleus Interactions, Phys. Lett. B 718 ; 2005: 35 [15] Kayis-Topaksu A et al. (CHORUS Collaboration), Measurement of topological muonic branching ratios of charmed hadrons produced in neutrino-induced charged-current interactions, Phys. Lett. B 626 ; 2005: 24
Current Microscopy Contributions to Advances in Science and Technology (A. Méndez-Vilas, Ed.)
© 2012 FORMATEX 1522

[16] Kayis-Topaksu A et al. (CHORUS Collaboration), Associated Charm Production in Neutrino-Nucleus Interactions, Eur. Phys. J. C 52 ; 2007: 543 [17] Kayis-Topaksu A et al. (CHORUS Collaboration), Measurement of charm production in neutrino charged-current interactions, New. J. Phys. 13 ; 2011 : 093002 [18] Kodama K et al. (DONuT Collaboration), Final tau-neutrino results from the DONuT experiment, Phys. Rev. D. 78 ; 2008: 052002 [19] Kodama K et al. (DONuT Collaboration), Observation of tau neutrino interactions, Phys. Lett. B 504 ; 2001: 218 [20] Kodama K et al. (DONuT Collaboration), Detection and Analysis of tau-neutrino interactions in DONuT emulsion target, NIM A 493; 2008: 45 [21] Rosa G, Di Bartolomeo A, Grella G, Romano G, Automatic analysis of digitized TV-images by a computer-driven optical
microscope, NIM A 394; 1997: 357 [22] Acquafredda R et al. (OPERA Collaboration), The OPERA experiment in the CERN to Gran Sasso neutrino beam, JINST 4 ; 2008: P04018 [23] Agafonova N et al. (OPERA Collaboration), The detection of neutrino interactions in the emulsion/lead target of the OPERA experiment, JINST 4 ; 2009: P06020 [24] Agafonova N et al. (OPERA Collaboration), Observation of a first ντ candidate event in the OPERA experiment in the CNGS beam, Phys. Letters. B 691 ; 2010: 138 [25] Aoki S. et al. (PEANUT Collaboration), Measurement of low-energy neutrino cross-sections with the PEANUT experiment, New Journal of Physics 12; 2010: 113028 [26] De Lellis G et al., Emulsion Cloud Chamber technique to measure the fragmentation of a high-energy carbon beam, JINST 2 ; 2007: P06004 [27] Toshito T et al., Measurements of total and partial charge-changing cross sections for 200- to 400-MeV/nucleon 12C on water and polycarbonate, Phys. Rev. C 75; 2007: 054606 [28] Tanaka H, Nakano M, Takahashi S, Yoshida J, Niwa K, Development of an emulsion imaging system for cosmic-ray muon radiography to explore the internal structure of a volcano, Mt. Asama, NIM A 575 ; 2007; 489 [29] Armenise N et al., High-speed particle tracking in nuclear emulsion by last-generation automatic microscopes, NIM A 551;
2005: 261 [30] Arrabito L et al., Hardware performance of a scanning system for high speed analysis of nuclear emulsions, NIM A 568; 2006:
578 [31] Kreslo I et al., High-speed analysis of nuclear emulsion films with the use of dry objective lenses, JINST 3; 2008: P04006 [32] G. De Lellis et al., Momentum measurement by the angular method in the Emulsion Cloud Chamber., Nucl. Inst. Meth. A 512;
2003 : 539 [33] Morishima K, Nakano T, Development of a new automatic nuclear emulsion scanning system, S-UTS, with continuous 3D
tomographic image read-out, JINST 5; 2010: P04011
Current Microscopy Contributions to Advances in Science and Technology (A. Méndez-Vilas, Ed.)
© 2012 FORMATEX 1523