automatic mapping of surfaces affected by forest fires in spain using avhrr ndvi composite image...
TRANSCRIPT
ELSEVIER
Automatic Mapping of Surfaces Affected by Forest Fires in Spain Using AVHRR NDVI Composite Image Data
Alberto Ferndndez, ° Pilar Illera,* and Jose Luis Casanova*
I n this work, we describe the statistical techniques used to analyze images from the National Oceanic and Atmo- spheric Administration's' advanced ver~j high resolution radiometer for the calculation and mapping of surfaces affected by large fi)restfires in Spain in 1993 and 1994. Maximum value normalized difference vegetation index (NDVI) composites (MVCs) were generated for every ten-day period over the two yeacs" of the study. Two tech- niques, one regression analysis and the other differenc- ing, were applied to the NDVI-MVCs' both before and after each fire event to determine detection thresholds of change and to delineate and objectively evaluate the burned surfaces. The comparison between the single-fires burned areas predicted by the techniques and that pro- vided by the Spanish Forestr~j Service (ground based) showed that the regression algorithm was more reliable, giving rise to virtually no bias (-0.9%) and a root mean square error (RMS) of 20.3%, both calculated as a per- centage of the mean burned area of the whole sample. The technique of differencing provided worse results with a 3.2% bias and a 23.5% RMS error. Likewise, a com- parison between the perimeters of the large fires supplied by official data (GPS-based) and those obtained by the regression method cot!fimned the validity of the technique not only fl)r calculating fire size, but als'o fi)r mapping of large forest fires. ©Elsevier Science Inc., 1997
°Departlnent of Applied Physics 1, University of Valladolid, Pa- lencia, Spain
Address correspondence to Pilar Illera, Dpto. Ffsica Aplieada I, E.T.S. de Ingenierfas Agrarias, Avda. de Madrid 57, 34071 Paleneia, Spain.
Received 27 November 1995; revised 9 August 1996.
REMOTE SENS. ENVIRON. 60:153-162 (1997) ©Elsevier Science Inc., 1997 655 Avenue of the Americas, New York, NY 10010
I N T R O D U C T I O N
Forest fires constitute one of the most serious environ- mental problems affecting Spanish Mediterranean for- ests, with large areas being destroyed each year. Ac- cording to official data, more than 1 million ha was affected in Spain from 1990 to 1994. In 1993, nearly 90,000 ha was devastated by fires; and, in 1994, a sad lnilestone was reached, with a record 31 deaths and more than 400,000 ha affected of which 248,000 ha was in forested areas. The prolonged drought that has been affecting Spain in recent years has led to a worsening of the situation and has given rise to an increase both in the number and in the size of fires. Thus, 26 fires of more than 500 ha in 1993 grew to 67 in 1994, with the subsequent increase in economic losses. An improvement in systems for the prevention and extinction of forest fires constitutes a major goal. Satellite remote-sensing data provide extremely useful information toward achiev- ing this objective.
Data from satellites have been widely used in the detection and monitoring of forest fires in tropical tbrests and savannas (Malingreau et al., 1985; Matson et al., 1987; Langaas, 1993; Kennedy et al., 1994), in northern forests (Flannigan and Vonder Haar, 1986; Kasischke et al., 1993), as well as in American areas (Lee and Tag, 1990) and Mediterranean areas (Illera et al., 1994). The NOAA (National Oceanic and Atmospheric Administra- tion) series of satellites have been the most widely used for this purpose--in particular, the AVHRR (advanced very high resolution radiometer).
The instrumentation on board the NOAA satellites provides images of large areas as often as ~bur times per day with a spatial resolution of 1.1×1.1 km at nadir, which offers the potential for global monitoring and a highly satisfactory temporal repetitivity. The data are available at a relatively low cost. The first two channels
0(/34-4'257/97/$17.00 PII S0034-4257(96)00178-2
154 Fermmdez et al.
> J t
l / f
/
k)
AVILA
NAVARRA
_ . o4,
ZARA6OZA _ . / /
TAR~GONA GUADALAJARA
TERUEL F
CACLLON cu JcA /
r
ALBACETE > ,~
~_ SEVlLLA \ GRANADA ALMERIA
~;, MAI.AC~ . . . . . . . . . . . . . . ,_ V-" \ /
\\.\ jr--
MURCIA J (
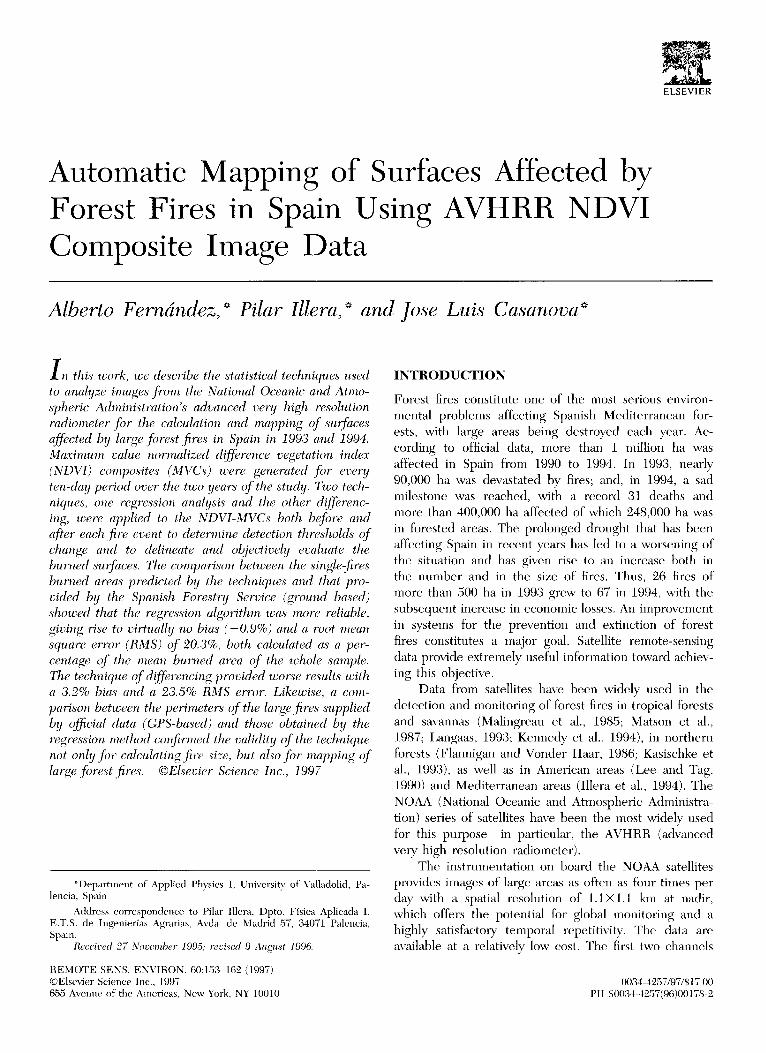
Fi~uce 1. Location of tile area under study on the Iberian Peninsula, corresponding to 22 Spanish provinces.
<)f" the AVHRR may be combined to obtain the NDVI (nor- realized difference vegetation index), which is an indicator of photos~lthetie at, tidally. The thennal channels, which ~dso are av~filable, allow estimation o{" sur[:ace temperature. The images are usefifl fi)r monitoring the state of" the vegetation in re'a/time, and the satellite's frequent overpass time also allows tbr teinponfl evolution studies to be peribrmed.
The applications of NOAA satellites in the monitor- ing of tbrest fires may be summed up under three com- ponents. Betore a fire, they allow the calculation of risk indices linked to the hydric stress of the vegetation (Pal- (ridge and Barber, 1988; Ldpez et al., 1991; Vidal et al., 1994; Illera et al., 1996a). During a fire, they can be used to detect and analyze the evohltion of actiw~ hot spots, \~4th the use of channel 3 of the AVHRR, owing to the high radiance of focus at high temperatures in middle- infrared wavelengths (Muirhead and Cracknell, 1985; Matson and ttolben, 1987; Pereira and Setzer, 199:3; Ceccato et al., 1995). Finally, alter the extinction of a fire, they allow rapid mapping of the aff~'cted areas, with the use of AVHtlR channels 1 and 2 and NDVI (Cahoon et al., 1992; Kasisehke et al., 1993; Kasischke and French, 1995). We have deveh)ped a fire monitoring sys- tem that allows us to follow these three components (Fernfindez et al., 1995; Illera et al., 199,5).
In this work, we present one of the components of
our system. Using NOAA-AVItRR images from 1993 and 1994 aeqnired by the NOAA-HRPT (high resolution pic- tures transmission) receiver installed at the University of Valladolid, we have developed two antomatic techniques tbr the evahlation and mapping of burnt areas and have applied them to the Iberian Peninsula. Our aim w~Ls to vail- (late and improve both techniques by comparing the results obt>dned with the measurements of burned Stlritlees pro- vided by the Spanish Forestry Service (I.C.O.N.A., 1994).
STUDY AREA
Tile present study was carried out on tile Iberian Penin- sula. The area under study is shown ill Fignre 1. It corre- sponds to 22 Spanish provinces situated mainly ill the southern and eastern regions of the Peninsula. The area under study offers a rather complicated reliet~ with areas of high mountains in the northeastern provinces, inner plains in the central prtMnces of the Peninsula, and re- gions in provinces Oll the Mediterranean coast. The study area has a warm Mediterranean climate with eohl winters and hot summers. The proximity of tile Mediterranean Sea means that, in the coastal regions, the temperatures, especially in winter, are more moderate than in the inte- rior. With regard to rainfall, m~Lximums are usual]y tbund in spring and autumn, whereas the minimum is usually

Mapping Forest Fires 155
found in summer as a result of the subtropical anticy- clone in the Azores, a phenomenon that is accentuated in the southern part of the Peninsula. The drought or lack of rainfall in summer together with the high temper- atures in this period, which in some areas may reach 40°C, make the summer the season when risk of forest fires is greatest.
The vegetation in the study area is very diverse, with species typical of Mediterranean forests--especially holm oak and cork oak--as well as pine forests replanted after previous forest fires.
DATA
Forty-seven fires ranging from 400 to 30,000 ha were used in the study. These occurred from April 1993 to September 1994 and constitute about 50% of the total number of major fires in Spain in these two years. The location of the fires was determined by using AVHRR im- ages and a detection 'algorithm developed by Femfindez et al. (1995) and Illera et al. (1995), together with the of- ficial fire data supplied by the Spanish Forestry Service, which consisted of the dates of the fires as well as their extent and geographical location in 10×10 km grid cells.
AVHRR-HRPT images (1.1-kin resolution) acquired by the NOAA 11 satellite during its daytime pass were recorded daily throughout the study period by the NOAA-HRPT receiver installed at the Department of Applied Physics 1, at the University of Valladolid. The images were then georeferenced and resampled to 1×1 km grids, using our own software (Illera et al., 1996b). A mask was applied to avoid cloud-contamination prob- lems. NDVI images were generated daily with the use of AVHRR channels 1 and 2, which were calibrated in accord with the procedure proposed by Kaufinann and Holben, (1993). To reduce problems caused by atmo- spheric dispersion, different sun-sensor angles, and over- cast areas, the NDVI data were combined to generate MVC (maximum value composite) data sets for each ten- day period (Holben, 1986). Twenty-two composites were produced for the period under study. Figure 2a shows an NDVI-MVC of the Mediterranean coast between 29 June and 1 July 1994, this being one of the areas most affected by fires in Spain. Figure 2b shows an image of the same area generated between 12 and 21 July 1994. The lighter areas correspond to high NDVI-MVC values and the (lark areas to low values, a mask having been applied to delineate the sea, which appears in black. The significant decrease in the NDVI-MVCs of the areas a f lbeted by major fires during the first ten days of July 1994 can be seen clearly in Figure 2b.
METHODOLOGY
The radiometric contrast oflbred by healthy vegetation in ehannels 1 and 2 of the AVHRR (visible and near infra- red, respectively) allows us to combine both to ealeulate
b
Fignre 2. NDVI-MVC images of the Mediterranean coast. The light areas correspond to high NDVI-MVC values and the dark areas to low values. The Mediterranean Sea appears in black. (a) The image was generated for the period 22 June to 1 July 1994. (b) The image was generated for the period between 12 and 21 July 1994. The areas in the latter image that show a large decrease in NDVI-MVC eorrespond to for- est fires that occurred in the first ten days of July.
vegetation indices such as the NDVI. This index is calcu- lated as the ratio between the difference and the sum of the reflectanees of the said channels:
C~, - Ci NDVI - (1)
C 2 -}- C I '
where CI is the reflectance of channel 1 (0.58-0.68 #in)
1 5 6 F~,~andc: et al.
and C~ is the reflectance of channel 2 (0.73-1.1 ¢tm). The NDVI is linked to different physiological variables such as the green biomass or the absorbed photosynthetically active radiation, APAR (Tucker, 1979; Sellers, 1989). The NDVI could also be an indicator of the moisture content of the vegetation (Paltridge and Barber, 1988). ttealthy vegetation tends to give rise to high NDVI values be- cause it has a high reflectance in the near infrared and a low reflectance in the visible; burned surfaces give rise to lower NDVI vahles because the reflectance of the burned vegetation increases in the visible and decreases in the infrared.
The dit}~renee in NDVI values befbre and after a fire allow rapid mapping of the affected area, which pos- sesses lower NDVI values (Malingreau, 1985). The prob- lem lies in adequately establishing the thresholds t~br de- tecting changes in order to identify and evahlate the burned area. Various authors have established numerical thresholds in dit}~rent areas by means of careful visual in- spection of the images (Kasisehke et al., 199,3; Kasischke and French, 1995; Martin and Chn~ieco, 1994). However the problem is that the threshold vahles depend on the stu@ area as well as on the time when the images were acqnired. This means that thresholds appropriate ibr one image and set of conditions may not be applied to other data sets with the same degree of accuracy of results.
We have developed a procedure that allows us to determine the thresholds automatically. The difference and the regression of the NDVI values before and after a fire in 100xl00 km windows around the approximate area of the fire are used as techniques for detecting change. This allows ns to autoinatieally map the affected areas by using an approach that could be independent of the geographical location and time at which the fire oc- curs, although fnrther research on this topic should be carried ont.
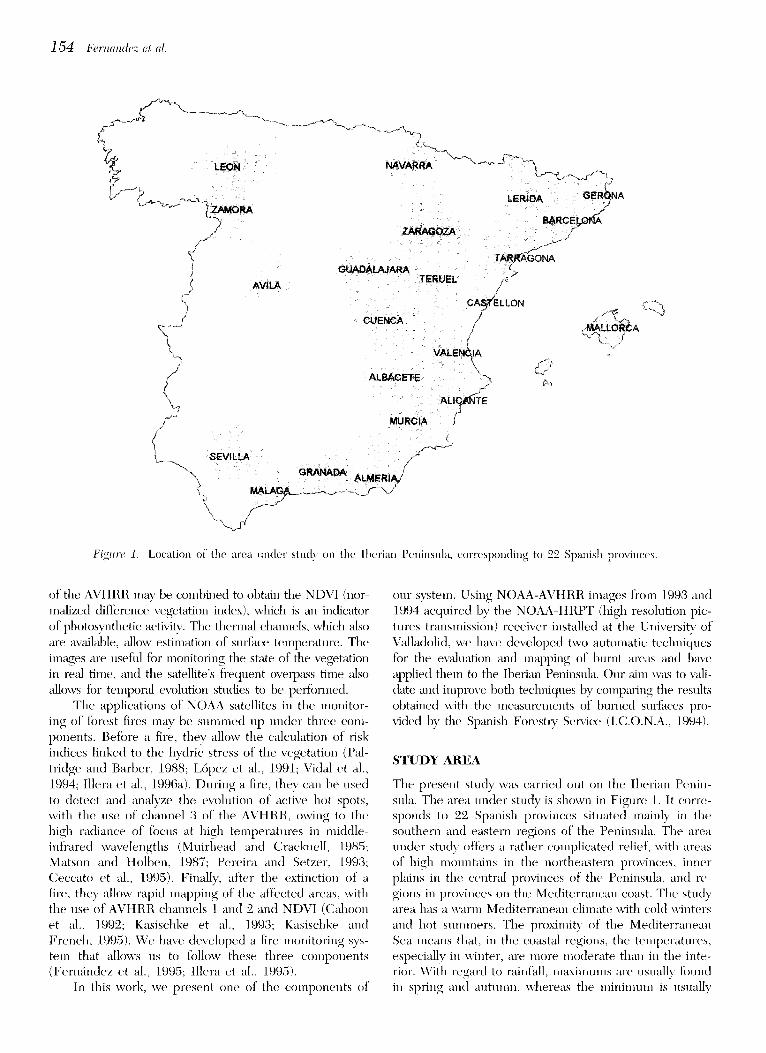
Automatic Algorithms for the Calculation of Burned Areas When a fire had been located, the next step was to de- terlnine its approximate center. To do this, the NDVI- MVC dif|~wence images before and after tile fire were generated as can be seen in Figure 3, which shows the dii}~rence in the NDVI-MVC shown in Figures 2a and 2b. The centers of the fires were determined easily by visual inspection of the affected areas: the light-colored areas in Figure 3 display wdnes that are inuch higher than those lot the rest of the image, in which the NDVI- MVC wtriation is nearly zero.
The difficul~ lies in calcnlating the exact extent of the fire because the pixels at the edge, normally less af- fected than the central pixels, tend to be confused with nearby vegetation canopy that remains undamaged. I f we establish a numerical threshold in tile NDVI difference by using visual analysis to deterlnine the limits of the
Fit~ure 3. hnage of differences of the NDVI-MVC before and after the fires (see Fig. :2). The light-colored areas corre- spond to areas affected by fires and display high values, whereas the rest of the image shows values close to zero.
fire, we are fitted with the prol)lem that it will only be a local wdue, which will vm T fi'om one fire to another, from one area to another, and from onc time to another. This has given rise to the wide variation in tlle threshold values f}mnd in the literature (Kasischke ct al., 1993; Martfn and Chnvieco, 1994). We have therefore devel- oped two diftbrent algorithms that allow objective calcu- lation of thresholds to determine the extent of a fire and are valid tor the whole stndy area and for the whole time period under consideration. Both approaches are based on an analysis of the decrease in the NDVI-MVC in the burned areas after the fire has been extinguished.
Regression Analysis The first algorithm developed nses regression analysis of the NDVI values for the MVC images imlnediately be- fore and after the fire event over 100× 100 km windows around the appr()ximate center of the fire. These win- dows arc [m'ge enough to be statistically significant in major fires and small enough to allow for homogeneity in the area under study.
The procedure consists of: 1) perfbrming a linear re- gression analysis between the values of tile NDVI-MVC before and after the fire occurrence for the pixels that are not contmninated by clouds in the 100x 100 km win- dow in which the fire is situated. This enables us to ob- tain a linear regression equation; 2) calculating the NDVI-MVC after the fire with the use of the said equa- tion we call this value NDVI~; 3) comparing the

Mapping Forest Fires 157
NDVI-MVC value after the fire (NDVIA) and the one calculated by using the regression equation (NDVIAH); as- suming that a pixel is affected if
NDVIA<NDVIAR--2S, (2)
where S is the regression error.
Difference Technique The second technique that we have developed uses a similar procedure applied to windows of the same size and consists of 1) calculating the local average,/,z,_,, and the standard deviation, rrB_A, of the difference between the previous NDVI-MVC (NDVIB) and the subsequent NDVI-MVC (NDVIA) of the pixels not contaminated by clouds; 2) assuming that a pixel is affected by the fire if
NDVIB- NDVIA>/z B-A + "20"B-*, (3)
where NDVIB and NDVIa are the NDVI-MVC values of the pixel before and after the fire occurrence and/ZB, <7B A are the local average and the standard deviation of the dif- ference NDVIB-NDVIa in the 100x100 km window.
Both procedures have the advantage that they do not require radiometric normalization of AVHRR chan- nels 1 and 2 for the generation and comparison of the NDVI images before and after the fire. This normaliza- tion process is partially, carried out in both methods by means of the regression and averaging of the study win- dow, respectively. In addition to reducing the time needed for calculation, this prevents decision errors when searching for areas with high and low reflectances, which are necessary for the normalization of the images. Such a problem is made worse in areas where there are extremely heterogeneous vegetation canopies, such as the one in the present study.
Error Sources The errors in the calculation of areas affected, using the techniques described in this work, are mainly due to three sources. The first source lies in the comparison of the AVHRR data with the size of the fires estimated at ground level by visual inspection by the Spanish Forestry Service. Visual inspection leads to error in detecting not only the total area of a fire, but also unaffected inner areas that may not be detected, because fires do not burn in a uniform fashion over the whole area. This problem does not arise, however, when AVHRR imagery is used. The second source lies in resolution of AVHRR images. The fact that these images cannot be used for calculating burned areas with a subpLxel resolution (Mat- son and Holben, 1987) means that the smallest detect- able area affected by a fire is 1 pixel (100 ha) even if it is not completely burned. This leads to an overestimation of burned area. Moreover, a pixel with a small part af- fected can be undetected in the images, leading to an underestimation. Both problems could be corrected by using methods that compensate for systematic errors,
3° I 25!
~ 1 5 " 0 ILl n-lO LL
1.5 I l l
2.5 3.5 4.5 5.5 6.5 7.5 8.5 9.5 10.5 11.5 THRESHOLDS x 100
Figure 4. Threshold regression-differences. Frequency, histo- grams for the thresholds of change detection obtained by the regression (shaded bars) and difference (open bars) algo- rithms. The thresholds are multiplied by 100. The regression procedure provides less variation xvith an average value of 7.6 and a standard deviation of 1.6 compared with an average of 5.7 and a standard deviation of 2.1 for the difference al- gorithm.
such as spectral mixture analysis (SMA) (Caetano et al., 1995). The third source of error is in the use of NDVI- MVC imagery. The registering of the image may be an error factor when generating NDVI composites, as may the choice of maximum NDVI values over the ten-day period used for the generation of the composites.
RESULTS
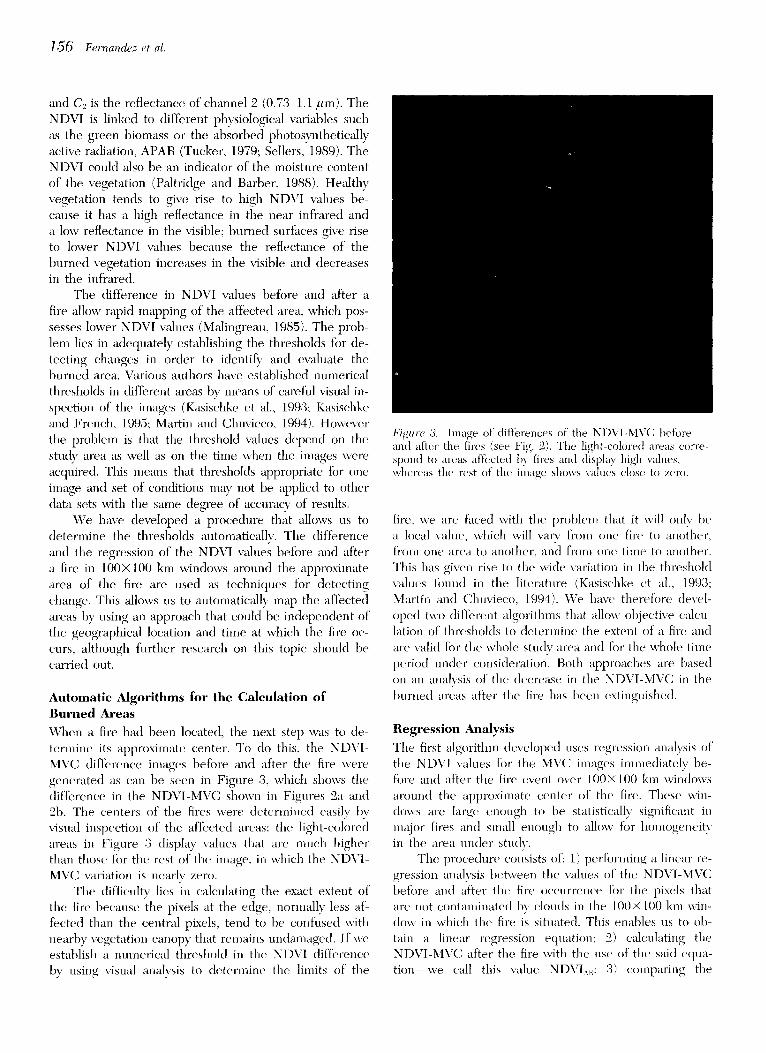
Table 1 shows the results of the two techniques applied to 47 major fires (>400 ha) that occurred in the area of study from April 1993 to September 1994, affecting a to- tal of 287,000 ha. The size of the fires as estimated by the Spanish Forestry Service (I.C.O.N.A.) and by the AVHRR-derived techniques can be seen. Both proce- dures provide similar results, which are satisfactory when compared with official data. Also shown are the correla- tion coefficient values r for the regression fitting, which in general are high values with an average of 0.80.
A problem with both techniques is the joint identi- fication of certain fires that occurred at the same time and in areas close to one another. This is the case with the fires in Andilla and E1 Toro (provinces of Valencia and Castellon, respectively) in 1993 and iu Domefio and Loriguilla (province of Valencia) and Santa Coloma de Faru6s and Gualba (provinces of Girona and Barcelona, respectively) in 1994. Table 1 shows the joint estimations for these fires provided by both methods.
Table 1 also shows the thresholds calculated by the 'algorithms for each of the fires: 2S×100 for the regres- sion model and 2CrBAX100 for the difference model, S [Eq. ('2)] being the regression error and au-a [Eq. (3)] the standard deviation of the difference values of the NDVI-
1 5 8 Fernandez et al.
Table 1. Comparison of Spanish Foresto' Service (ICONA) Data versus AVHRR-Algorithms Results Corresponding to Fires in Spain in 1993 and 1994
Fire Location Size Size Size r Thre~shold Thre.s'hold Fire Date ICONA D!ff'crenees ReFres'.s'ion Regres.s.iol~ DifJ}mmce.~ t~eFres.s'ion
Townshil~ Province (Start-Stop) (ha)" (ha) (ha) Methorl (2aB ~xlOO) 128×100)
1993 Fires Vi]lalonga Valencia 8/26-8/29 51)5 500 3011 0.66 8.4 7.6
Lorcha Alicante 7/10 7/11 625 900 4110 0.72 1.8 6.4 Marbella Mfilaga 8/'26 8/27 758 1000 S00 0.87 1.8 10.1
Nfjar Almerfa 8/08-8/09 8(10 1100 9110 0.84 5.9 5.9 Molinaseca I~on 8/19 8/20 837.5 1100 9110 11.73 2.5 I 1.7
Andilla Valencia 8/117-8//19 2087" 8700 7400 0.68 5.1 7.2
E1 Toro Castel[6n 8/1t7 8/10 2135" Bufiol Valencia 8/07-8/08 2333 2601) 2200 0.74 5.3 8.5
San Mateo CastelI6n 9/13 9/17 :3521/ 3100 39t10 0.63 4.7 8.8 Argelita CastelkSn 9/12 9/16 4896 3501t 41111) 0.61 2.8 9.;3
I)os Aguas Valencia 8/26-8/31 5200 8501t 8000 0.70 7.7 7.7 Beas de (;ranada (;ramtda 8/t)7 8/H1 6222.8 9800 6300 (I.72 8.3 6.9
1994 Fires
Cubo de Benavente Zamora 8/22-8/22 450 11011 806 0.911 6.0 9.5 El t/onquillo Sevilla 7/0&-7/08 651) 61111 600 0.88 6.1 7.2 Navalacrttz A~ila 8/28 8/29 9511 1001) 400 0.82 4.2 7.9 (]anvelles Barcelona 7/04-7/09 999 12111/ 1200 11.82 T. 1 5.6 Andraitx Mallorea 6/01 6/1/7 1050 1211/) 1110t) 0.81 2.9 S.7 Margalet" Tarragona 7/17-7/20 12511 11100 8011 0.93 3.8 5.3
Tramacastie] Teruel 6/I11 6/08 1365.8 1400 12111) 1t.8tl !.7 8.4 Monda M filaga 7/t)5-7/I 1 16211 34/10 3001t 0.90 7. I 6.2
Petilla de Aragdn Navarra 7/15 7/23 1665 18110 1500 0.95 2. I 8.6 Ponts 1,6rida 8/2:3 8/'2,5 1940 26110 2300 0.88 6.2 9.1
(]astcllbisbal Barc'elona 7//14 7/05 2195 17110 181111 /I.88 8.1 7.2 Anguita Guadal~tjara 8128 91111 2250.3 340t) 2711tl 0.88 3.6 6.9 l)Oll/ef]o Valencia 5126-6/I12 2350"
44t111 461t/) 0.71 3.0 7.5 Loriguil]a Valencia 6/02-6/10 2962.1"
Albaida Vah',K'ia 7/04 7106 2496 29t10 2700 9.79 7.6 6.2 Sta. Co]oma Farn(ts (;erona 8/1t) 8/13 2631"
90011 8000 (t.77 8.7 11.6 Cualba Barcelona 8/11) 8/1:3 6126"
Bi~ues i l/ie[Is Barcelona 7/t):3 7/t)7 2700 1700 17110 0.88 7.5 8.0 Maj&'ar-Turre Almen'a 8/119-8/11 27111 2900 2600 0.85 5.5 4.3
Collbat6 Barcelona 7//14 7/04 2800 21111) 2500 0.71 8.1 7.5 Salsadel]a CasteIIdn 8/26 8/28 281111 2900 2900 0.86 5..5 7..5
Tivissa Tarragona 4/10-4/13 2825 2600 2400 0.85 5.3 7.9 I,entejf Cranada 7/I)6 7/I19 3904 5200 5001) 0.87 6.5 6.0
(;asti]lo vilIamalefa Castel16n 41112 4107 4486 4100 4700 0.53 5.6 11). I Altura Castelldn 8/1tl-8/13 7000 6200 5700 I).,54 4.1 6.9
Uncastillo-Sofuentes Zaragoza 7/17 7/22 8638 6600 5100 0.95 2. I 8.6 Lfjar Almerfa 7105 7/07 9786 13300 131 O0 0..S8 .5.4 5.1 Yestc Albacete 8/07 8/19 14225 15900 143011 9.89 4.7 6.6
S. Martin Boniches Cuenea 7/17 7/28 18365.7 17400 1741)1) 0.,~4 5.6 6.4 Fontanares Valencia 7/04-7/12 18417.3 1911110 19700 1/.79 7.6 6.2
Alto Mijarcs Castell6n 7/03 7/1(1 19310 18700 18300 0.76 7.7 7.0 l/equena-Bufio] Valencia 7/ll5 7/12 24770 236011 24000 0.59 9.9 9.0
Millarcs Valencia 7/1t4-7/12 25930 27200 27200 0.79 8.6 8.3 MorataIla M m'cia 7//t4 7/08 27635 23300 232(10 0.8.3 7.2 7.2
villarluengo-Els Ports Teruel-Castell6n 7/t12 7/98 2821:3 26200 27200 0.84 6.7 6.1
" contiguous fires detected together by the algorithlns.
M V C b e f o r e a n d a f t e r t i l e f i re f o r t h e p i x e l s in t h e w i n -
d o w u n d e r study. T h e f r e q u e n c y h i s t o g r a m fo r b o t h
thresholds is shown in Figure 4. Less variation of the re- sults in the regression model can be seen, with an aver- age value of 7.6 and a standard deviation of 1.6 com- pared with an average of 5.7 and a standard deviation
o f 2 .1 f b r t h e d i f f e r e n c e t e c h n i q u e . T h e s e r e s u l t s o f f e r
r e l a t i v e l y s t a b l e t h r e s h o l d v a l u e s in all t h e a r e a s a n a l y z e d
a n d fo r t h e d i f ' t S r en t p e r i o d s o f t i m e s t u d i e d .
T a b l e 2 s t m u n a r i z e s t i l e r e s u l t s o b t a i n e d fo r f ive d i f
f e r e n t s i z e s o f f i res , as w e l l as t b r t i l e w h o l e s a m p l e . T h e
m e a n b i a s e r r o r ( M B E ) a n d t i l e r o o t m e a n s q u a r e e r r o r
Mapping Forest Fires 159
25 ~ . . . . i
2 0
O 1 5 z w
! 1 i , 5 / _ ~:
0 2 L L ~ klg
-55 -35 -15
I I !
l ]HH, l I 5 25 45 65 85 105 125 145
RELATIVE ERROR %
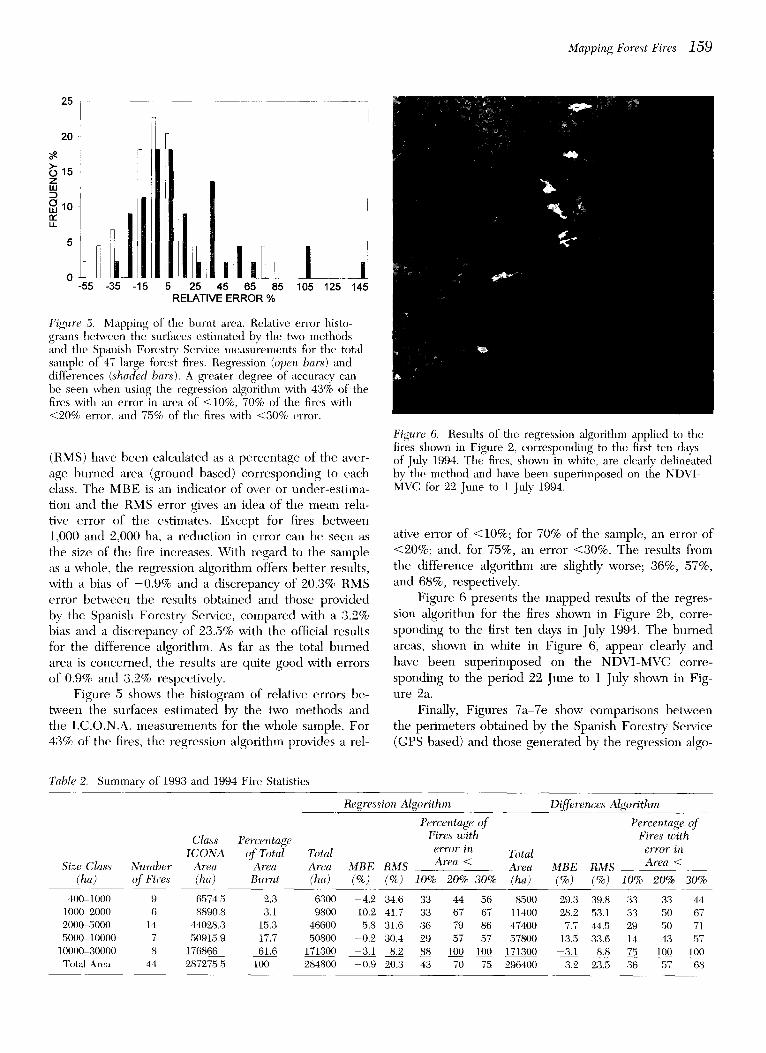
Figure 5. Mapping of the burnt area. Relative error histo- grmns between the surfaces estimated by the two methods and the Spanish Forestry Service measurements for the total sample of 47 large forest fires. Regression (open bars) and differences (shaded bars). A greater degree of accuracy can be seen when using the regression algorithm with 43% of the fires with an error in area of <10%, 70% of the fires with <20% error, and 75% of the fires with <30% error.
(RMS) have been calculated as a percentage of the aver- age burned area (ground based) corresponding to each class. The MBE is an indicator of over or under-estima- tion and the RMS error gives an idea of the mean rela- tive error of the estimates. Except for fires between 1,000 and 2,000 ha, a reduction in error can be seen as the size of the fire increases. With regard to the sample as a whole, the regression algorithm offers better results, with a bias of -0 .9% and a discrepancy of 20.3% RMS error between the results obtained and those provided by the Spanish Forestry Service, compared with a 3.2% bias and a discrepancy of 23.5% with the official results for the difference algorithm. As far as the total burned area is concerned, the results are quite good with errors of 0.9% and 8.'2% respectively.
Figure 5 shows the histogram of relative errors be- tween the surfaces estimated by the two methods and the I.C.O.N.A. lneasurements for the whole sample. For 43% of the fires, the regression algorithm provides a rel-
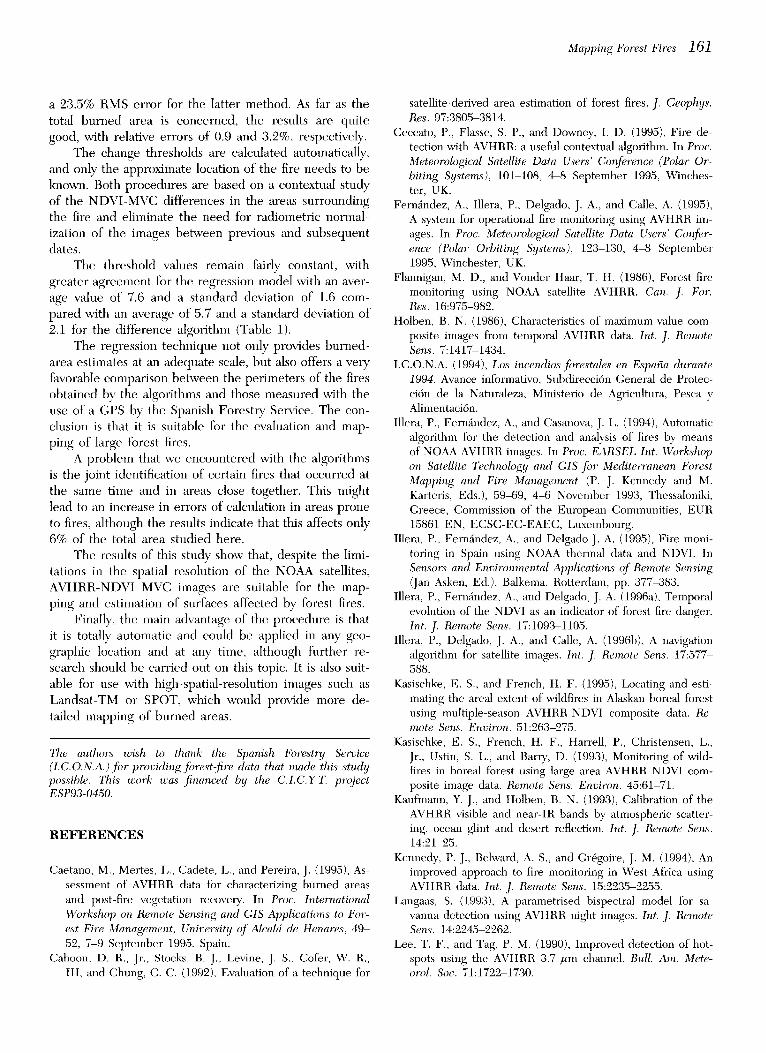
Figure 6. Results of the regression algorithm applied to the fires shown in Figure 2, corresponding to the first ten days of July 1994. The fires, shown in white, are clearly delineated by the method and have been superimposed on the NDVI- MVC for 22 June to 1 July 1994.
ative error of <10%; for 70% of the sample, an error of <20%; and, for 75%, an error <30%. The results from the difference algorithm are slightly worse; 36%, 57%, and 68%, respectively.
Figure 6 presents the mapped results of the regres- sion algorithm for the fires shown in Figure 2b, corre- sponding to the first ten days in July 1994. The burned areas, shown in white in Figure 6, appear clearly and have been superimposed on the NDVI-MVC corre- sponding to the period 22 June to 1 July shown in Fig- ure 2a.
Finally, F igures 7 a - 7 e shove compar i sons b e t w e e n
the p e r i m e t e r s o b t a i n e d by the Spanish Fo re s t ry Service
(GPS based) and those g e n e r a t e d by the regress ion algo-
Table 2. Summary of 1993 and 1994 Fire Statistics
Class Percentage ICONA of Total Total
Size Class Number Area Area Area (ha) of Fires (ha) Burnt (ha)
Regression Algorithm Differences Algorithm
Percentage of Fire,s with
error in Total MBE RMS Area < Area MBE RMS (%) (%) 10% 20% 30% (ha) (%) (%)
Percentage of Fires with
error in Area <
10% 20% 30%
400-1000 9 6574.5 2.3 6300 1000 2000 6 8890.8 3.1 9800 2000-5000 14 44028.3 15.3 46600 5000-10000 7 50915.9 17.7 50800
10000-30000 S 176866 61.6 171300 Total Area 44 287275.5 100 284800
-4.2 34.6 33 44 56 8500 29.3 39.8 33 33 44 10.2 41.7 33 67 67 11400 28.2 53.1 33 50 67 5.8 31.6 36 79 86 47400 7.7 44.5 29 ,50 71
-0.2 30.4 29 57 57 57800 13.5 33.6 14 43 57 -3.1 8.2 88 100 100 171300 - 3 . l 8.8 75 100 100 -0.9 20.3 43 70 75 296400 3.2 23.5 36 57 68

a 4260
4256
4252
4248
4244
4240
4236
4232 , r , r -- 7" T . . . . . . . ~ ~ . . . . = T
540
t I
4410
544 548 552 556 560 564 568 572 576
4418 ~ b
i 4414 I
4406
4402
4435
160 Fet~amte: et al.
i 4398 - , . . . . . . . " I " ' r
617 621 625 629 633 637 641 645
4443 T I ! c !
4439
4431
C
4427
4423 ~ , . . . . . . . . . .
700 704 708 712 716 720 724 728
4312
d 4308
4304
4300
4296
4292
4288
4284 , , . . . . . . - r . . . . . ~ - = ,
687 691 695 699 703 707 711 715 719
4356
4352
I 4 3 4 8
i 4 3 4 4
4 3 4 0
4 3 3 6
4332
4 3 2 8 , , , , , , . . . . . . ~ , ,
675 679 683 687 691 695 699 703 707 711
Figuce 7. Comparisons of fire boundaries estimated from offi- cial GPS-based data (smooth ecl~,es) and the AVItRR-regression technique (rectangular edff, es) for the fires in (a) Yeste; (b) San Martin de Boniehes; (e) Mijares; (d) Fontanares: and (e) Mil- lares. The geographical location is indicated by a UTM grid in kilometers.
rithm ibr five of the fires studied, ranging from 14,000 to 26,000 ha in size. The geographical location is indi- cated by a UTM grid in kilometers. In all of the compari- sons, good agreement can be seen between the perime- ter outlines provided by our algorithm and the official data.
C O N C L U S I O N S
In this work, we present two automatic algorithms for the evaluation of burned land and the mapping of large
forest fires with the use of NOAA-AVHRR images. The comparison between the NDVI-MVC values before and after a fire event allows us to calculate the total area af- fected.
As methods for the detection of change, we have used regression analysis [Eq (2)] and difference models [Eq. (3)], which give rise to similar results. The former method gives somewhat better results with virtually no bias(-0.9%) and a 20.3% RMS error mnong the areas of the fires detected by the algorithm and the official ground data compared with 3.2% of overestimation and
Mapping Forest Fires 161
a 23.5% RMS error for the latter method. As far as the total burned area is concerned, the results are quite good, with relative errors of 0.9 and 3.2%, respectively.
The change thresholds are calculated automatically, and only the approximate location of the fire needs to be known. Both procedures are based on a contextual study of the NDVI-MVC differences in the areas surrounding the fire and eliminate the need for radiometric normal- ization of the images be tween previous and subsequent dates.
The threshold values remain fairly constant, with greater agreement for the regression model with an aver- age value of 7.6 and a standard deviation of 1.6 com- pared with an average of 5.7 and a standard deviation of 2.1 for the difference algorithm (Table 1).
The regression technique not only provides burned- area estimates at an adequate scale, but also offers a very favorable comparison be tween the per imeters of the fires obtained by the algorithms and those measured with the use of a GPS by the Spanish Forestry Service. The con- clusion is that it is suitable for the evaluation and map- ping of large forest fires.
A problem that we encountered with the algorithms is the joint identification of certain fires that occurred at the same t ime and in areas close together. This might lead to an increase in errors of calculation in areas prone to fires, although the results indicate that this affects only 6% of the total area studied here.
The results of this stud}, show that, despite the limi- tations in the spatial resolution of the NOAA satellites, A V H R R - N D V I MVC images are suitable for the map- ping and estimation of surfaces affected by forest fires.
Finally, the main advantage of the procedure is that it is totally automatic and could be applied in any geo- graphic location and at any time, although further re- search shonld be carried out on this topic. It is also suit- able for use with high-spatial-resolution images such as Landsat -TM or SPOT, which would provide more de- tailed mapping of burned areas.
The authors wish to thank the Spanish Forestry Service (I.C.O.N.A.) fl)r providing fl~rest-fire data that made this study possible. This work was financed by the C.LC.Y.T. project ESP93-0450.
R E F E R E N C E S
Caetano, M., Metres, L., Cadete, L., and Pereira, J. (1995), As- sessment of AVHRR data for characterizing burned areas and post-fire vegetation recovery. In Proc. International Workshop on Remote Sensing and GIS Applications to For- est Fire Management, University ~f Alcald de Henares, 49- 52, 7-9 September 1995, Spain.
Cahoon, D. R., Jr., Stocks, B. j., Levine, j. s., Cofer, w. R., III, and Chung, C. C. (1992), Evaluation of a technique for
satellite-derived area estimation of forest fires. J. Ge~rphys. Res. 97:3805-3814.
Ceeeato, P., Flasse, S. P., and Downey, I. D. (1995), Fire de- tection with AVHRR: a useful contextual algorithm. In Proc. Meteorological Satellite Data [2~ers" Conference (Polar Or- biting Systems), 101-108, 4-8 September 1995, Winches- ter, UK.
Fernfindez, A., Illera, P., Delgado, J. A., and Calle, A. (1995), A system for operational fire monitoring using AVHRR im- ages. In Proc. Meteorological Satellite Data Users" Confer- ence (Polar Orbiting Systems), 1"23-130, 4-8 September 1995, Winchester, UK.
Flannigan, M. D., and Vonder Haar, T. H. (1986), Forest fire monitoring using NOAA satellite AVHRR. Can. J. For. Res. 16:975-982.
ttolben, B. N. (1986), Characteristics of maximum-value com- posite images from temporal AVHRR data. Int. J. Remote Sens. 7:1417-1434.
I.C.O.N.A. (1994), Los incendios forestales en Espaaa durante 1994. Avance informativo, Snbdireeci6n General de Protec- ei6n de la Naturaleza, Ministerio de Agricultura, Pesca y Alimentaei6n.
Illera, P., Fernandez, A., and Casanova, J. L. (1994), Automatic algorithm for the detection and analysis of fires by means of NOAA AVHRR images. In Proe. EARSEL Int. Workshop on Satellite Technology and GIS for Mediterranean Forest Mapping and Fire Management (P. J. Kennedy and M. Karteris, Eds.), 59-69, 4~6 November 1993, Thessaloniki, Greece, Commission of the European Communities, EUR 15861 EN, ECSC-EC-EAEC, Luxelnbourg.
Illera, P., Fern~indez, A., and Delgado J. A. (1995), Fire moni- toring in Spain using NOAA thermal data and NDVI. In Sensors and Environmental Applications of Remote Sensing (Jan Asken, Ed.), Balkema, Rotterdam, pp. 377~83.
Illera, P., Fernfindez, A., and Delgado, J. A. (1996a), Temporal evolution of the NDVI as an indicator of forest fire danger. Int. J. Re~ru~te Sens. 17:1093-1105.
Illera, P., Delgado, J. A., and Calle, A. (1996b), A navigation algorithm for satellite images. Int. J. Remote Sens. 17:577- 588.
Kasischke, E. S., and French, H. F. (1995), Locating and esti- mating the areal extent of wildfires in Alaskan boreal forest using multiple-season AVHRR-NDVI composite data. Re- nu~te Sens. Environ. 51:263-275.
Kasisehke, E. S., French, H. F., Harrell, P., Christensen, L., Jr., Ustin, S. L., and Barry, D. (1993), Monitoring of wild- fires in boreal forest using large area AVHRR NDVI com- posite image data. Remote Sens. Environ. 45:61-71.
Kaufmann, Y. J., and Holben, B. N. (1993), Calibration of the AVHRR visible and near-IR bands by atmospheric scatter- ing, ocean glint and desert reflection. Int. J. Rerru)te Sens. 14:21 25.
Kennedy, P. J., Belward, A. S., and Gr6goire, J. M. (1994), An improved approach to fire monitoring in West Africa using AVHRR data. Int. J. Remote Sens. 15:2235 2255.
Langaas, S. (1993), A parametrised bispectral model for sa- vanna detection using AVHRR night ilnages. Int. J. Remote Sens. 14:2245-2262.
Lee, T. F., and Tag, P. M. (1990), hnproved detection of hot- spots using the AVHRR 3.7 ¢tm channel. Bull. Ant. Mete- orol. Soc. 71:1722-1730.

] 6 2 Fernandez et al.
Ldpez, S., Gonztilez, F., Llop, R., and Cuevas, J. M. (1991), An evahlation of the utility of NOAA AVHRR images tbr monitoring forest fire risk in Spain. Int. J. liemote Sens. 12:1841-1851.
Malingreau, J. P. (1985), Remote sensing and disaster monitor- ing: a review of application in Indonesia. In 18th hit. S!lm p. Remote Sens. Environ., 283-297, 1-5 October 1984, Paris.
Malingreau, J. P., Stephens, G., and Fellows, L. (1985), Re- mote sensing of forest fires: Kalimantan and North Borneo in 1982-83. Aml)io 14:314 321.
Mart/n, M. P., and Chuvieco, E. (1994), Mapping and evahm- tion of burned land from multitempora] analysis of AVIIRR NDVI images. In Prim. EARSEL Int. Worl¢sho I) on Satellite Teclmolo~j and GIS fi~r ,Mediterranean Forest Mappin~ and Fire ManaFement (P. J. Kemledy and M. Karteris, Eds.), 71-83, 4-6 November 1993, Thessaloniki, Greece, Commis- sion of the European Communities, EUR 15861 EN, ECSC-EC-EAEC), Luxembomg.
Matson, P. M, and Holben, B. (1987), Satellite detection of tropical burning in Brazil. Int. J. Bemote Sens. 8:509 516.
Matson, P. M., Stephens, G., and Robinson, J. (1987), Fire de-
tection using data from the NOAA-N satellites, hit. J. Be- mote Sens. 8:961-970.
Muirhead, K., and Craeknell, A. P. (1985), Straw burning over Great Britain detected by AVHRR. Int. .[. Remote Sens. 6:827 833.
Paltridge, G. W., and Barber, J. (1988), Monitoring grassland dvvness and fire potential in Australia with NOAA-AVIIRR data. Ilemote Sens. Envinm. 25:381 394.
Pereira, M. C., and Setzer, A. W. (1993), Spectral characteris- tics o[' defi)restation fires in NOAA-AVHRR images. Inl. J. Remote Sens. 14:583-597.
Sellers, P. J. (1989), Vegetation-canopy spectral reflectance and biophysical processes. In Themf /aml Applicatim~s of Optical Bemote Sensin F (G. Asrar, Ed.) Wiley, New York, pp. 297-335.
Tucker, C. J. (1979), Red and photographic infiared linear eoml3inations i)3r monitoring ~egetation. llemote Sens. Enci- rim. 8:127-150.
Vidal, A., Pinglo, F., Durand, It., Devaux-Ros, C. and Maillet, A. (1994), Evaluati(m of a temporal fire risk index in Medi- terranean fi)rests from NOAA thermal IR. Remote Sens. En- d;iron. 49:296-303.