automatic estimation of users’ verbal intelligence
TRANSCRIPT
Automatic Estimation of Users’Verbal Intelligence
Dissertation zur Erlangung des Doktorgrades Dr.Ing.der Fakultat fur Ingenieurwissenschaften und Informatik
der Universitat Ulm
vorgelegt von
Ksenia Zablotskaya
2015


III
Amtierende
Dekanin:
Prof. Dr. Tina Seufert
Gutachter: Prof. Dr. Dr.-Ing. Wolfgang Minker
Prof. Dr. Michael F. McTear
Prof. Dr. Harald C. Traue
Tag der Promotion: 9.10.2015

IV
Acknowledgements.
First of all, I would like to thank Professor Wolfgang Minker for supporting me all the
time during my work on this thesis. His belief in me and his immense patience always
motivated me to continue this work and never give up. My gratitudes also go to Professor
Michael McTear, Professor Harald Traue, and Professor Albrecht Rothermel for acting as
examiners of this dissertation. Moreover, I am very thankful to Professor Harald Traue
and Steffen Walter for providing me with all the necessary information about psychological
aspects of my work.
I am in debt to Mumtaz Ahmed, Mohsin Abbas, and Umair Rahim who wrote their
thesis under my supervision and made a valuable contribution to this research.
I am very thankful to several colleagues at our Institute for a great time spent together:
Alexander Schmitt, Tobias Heinroth, Amparo Albalate, Helmut Lang, Florian Nothdurft,
Gregor Bertrand, Stefan Ultes, Maxim Sidorov, Tatiana Gasanova, and Roman Sergienko.
I sincerely thank Werner Birkle, Werner Hack, and Falk Huber for their ability to find a
positive moment in every situation and the sense of humour that have made the mornings
with them unforgettable.
I am also very thankful to Fernando Fernandez Martınez and so glad, that he won his
grant and decided to make a project at our university. This gave me an opportunity to know
such a great person and to work with him.
I want to express the gratitude to my employer Zielpuls GmbH, in particular to Marc
Poppner and Isabel Berlich. It would be difficult for me to finish this work without their
unbelievable support. I am also very thankful to a great amount of colleagues for their
encouragement: Stephan, Andreas, Johannes, Ikeya, Said, Christian, Arun, Patrick, Philipp,
Timm, Susanne, Sonia, and many others. I also appreciate a great emotional support of
Isabella.
I am very thankful to Sergey who was always ready to help me in any situation and
supported me a lot when I had any difficulties. My special thanks go to Lena and Chris
for helping me with collecting and transcribing the speech data corpus. I particularly thank
my friends Lena, Kostja, Igor, and Sally for their encouragement, enthusiasm, continuing
support, and many unforgettable moments spent together.
I would like to thank Rene, Karo, Chris, and Sonja from the choreo-group “Air” for great
events we celebrated together. My special thanks go to Rene for his encouragement and help
in all occasions. I sincerely thank Christian for his great support, understanding, and time.
Finally, my deepest gratitude goes to my family. Everything that I have accomplished
has been because of their unconditional love, support, and inspiration.

Summary. The purpose of our research is the development of algorithms for the au-
tomatic estimation of the verbal intelligence of individuals - in other words the level of
verbal cognitive processes - based on the analysis of transcribed spoken utterances. There
are many psychological research studies which show that certain language peculiarities may
reflect psychological and emotional states of a speaker, his age, gender, social class, etc. In
this work we investigate how speakers with different verbal intelligence interact with each
other, which vocabulary they use, how they construct their sentences, what the peculiarities
of their speech style are and how this information may be used for automatic determining of
the verbal intelligence of speakers. To our knowledge, this is the first report of experiments
attempting to automatically predict verbal intelligence.
In our opinion, this research is necessary to develop an exact companion system tech-
nology in human-machine interaction. We are aware of the critical ethical issue of this
technology, but only when a companion system recognizes the verbal ability of a user, it can
precisely adapt to the user specific strategies. Future dialogue systems may use information
about the estimated cognitive processes of a user and change the level of the interaction,
make the interaction for a non-experienced user easier and clearer, and may help the user
solve different problems more effectively.
The work is based on a corpus that was collected at the University of Ulm, Germany.
100 native German speakers participated in this study. As a result, the corpus contains 100
descriptions of a short film (monologues) and 56 discussions about the same topic (dialogues)
and verbal intelligence scores of the speakers that were obtained using the Hamburg Wechsler
Intelligence Test for Adults.
To investigate differences in the language use of speakers with different verbal intelli-
gence, their monologues were analysed at different linguistic levels (morphological, lexical,
syntactic and semantic) and compared with the film transcript. The speech style of the
test persons and their vocabulary were also investigated. All the extracted features were
compared with the verbal intelligence scores of the experiment participants in order to find
the most informative features that reflect verbal intelligence behaviour of individuals and
may be used for further investigations. For the classification task, two main approaches
were applied. In the first approach, the extracted linguistic features were used to classify
the test persons into several groups. Such feature selection methods as the information gain
ratio, V2-Test and genetic algorithm were used. The naive Bayes, k-nearest neighbours and
support vector machines were trained using different combinations of linguistic features.
In the second approach, the text files were represented as feature vectors using the TF-
IDF weighting scheme. The naive Bayes, k-nearest neighbours and Rocchio classifiers were
trained using the leave-one-out cross validation approach. The achieved classification accu-
racy can be deemed as satisfactory for a number of classes that is reasonably high enough
to enable its integration into SDSs.
The same approaches (linguistic analysis, usage of the most informative features for the
classification, and representation of text files as feature vectors) were applied to the di-
alogues. It should be noted that the automatic verbal intelligence estimation of speakers
using their dialogue transcripts is a more challenging task than working with monologues.
When engaged in a conversation, dialogue partners usually try to adapt to each other and
automatically change their choice of words, speech style, etc. For example, when an adult
with a certain level of verbal intelligence talks to his child, his words and sentence struc-

VI
tures are easier than those he uses when he talks to his friends or colleagues. As a result,
for estimating the verbal intelligence of dialogue participants, the level of their conversation
should be taken into account. The ability of individuals to adapt to their dialogue partners
was analysed using such methods as social networks, language style matching analysis, dom-
inance estimation, etc. The obtained information was used to determine the best strategy
of automatic verbal intelligence estimation.

Contents
1 Introduction . . . . . . . . . . . . . . . . . . . . . . . . . . . . . . . . . . . . . . . . . . . . . . . . . . . . . . . . . . . . . . . . . . . . . . . . . . 1
1.1 SDSs that Estimate the Verbal Intelligence of Users . . . . . . . . . . . . . . . . . . . . . . . . . . . . . . . . . . . . . 3
1.2 Thesis Contributions . . . . . . . . . . . . . . . . . . . . . . . . . . . . . . . . . . . . . . . . . . . . . . . . . . . . . . . . . . . . . . . 6
1.3 Document Structure . . . . . . . . . . . . . . . . . . . . . . . . . . . . . . . . . . . . . . . . . . . . . . . . . . . . . . . . . . . . . . . 7
2 Background . . . . . . . . . . . . . . . . . . . . . . . . . . . . . . . . . . . . . . . . . . . . . . . . . . . . . . . . . . . . . . . . . . . . . . . . . . . 9
2.1 History of Intelligence and Intelligence Tests . . . . . . . . . . . . . . . . . . . . . . . . . . . . . . . . . . . . . . . . . . . 9
2.2 Verbal Intelligence . . . . . . . . . . . . . . . . . . . . . . . . . . . . . . . . . . . . . . . . . . . . . . . . . . . . . . . . . . . . . . . . . 17
2.3 Cognitive Abilities’ Tests and Personality . . . . . . . . . . . . . . . . . . . . . . . . . . . . . . . . . . . . . . . . . . . . . . 20
2.4 Role of Verbal and Cognitive Abilities in Social Life . . . . . . . . . . . . . . . . . . . . . . . . . . . . . . . . . . . . . 21
2.5 Linguistic Cues of High Verbal Abilities . . . . . . . . . . . . . . . . . . . . . . . . . . . . . . . . . . . . . . . . . . . . . . . . 23
3 Verbal Intelligence Corpus . . . . . . . . . . . . . . . . . . . . . . . . . . . . . . . . . . . . . . . . . . . . . . . . . . . . . . . . . . . . . . 25
3.1 Pilot Study . . . . . . . . . . . . . . . . . . . . . . . . . . . . . . . . . . . . . . . . . . . . . . . . . . . . . . . . . . . . . . . . . . . . . . . 25
3.1.1 Topic and Genre of Speech Samples . . . . . . . . . . . . . . . . . . . . . . . . . . . . . . . . . . . . . . . . . . . . 25
3.1.2 Verbal Intelligence Benchmark . . . . . . . . . . . . . . . . . . . . . . . . . . . . . . . . . . . . . . . . . . . . . . . . 27
3.1.3 Questionnaires for the Interview . . . . . . . . . . . . . . . . . . . . . . . . . . . . . . . . . . . . . . . . . . . . . . . 30
3.2 Corpus Collection . . . . . . . . . . . . . . . . . . . . . . . . . . . . . . . . . . . . . . . . . . . . . . . . . . . . . . . . . . . . . . . . . . 31
3.2.1 Organization of the Experiment . . . . . . . . . . . . . . . . . . . . . . . . . . . . . . . . . . . . . . . . . . . . . . . 31
3.2.2 Search for New Candidates . . . . . . . . . . . . . . . . . . . . . . . . . . . . . . . . . . . . . . . . . . . . . . . . . . . 32
3.2.3 Analysis of Feedback . . . . . . . . . . . . . . . . . . . . . . . . . . . . . . . . . . . . . . . . . . . . . . . . . . . . . . . . 32
3.2.4 Resulting Verbal Intelligence Corpus . . . . . . . . . . . . . . . . . . . . . . . . . . . . . . . . . . . . . . . . . . . . 33
4 Features for the Estimation of Verbal Intelligence . . . . . . . . . . . . . . . . . . . . . . . . . . . . . . . . . . . . . . . . . 39
4.1 Analysis of Verbal Behaviour . . . . . . . . . . . . . . . . . . . . . . . . . . . . . . . . . . . . . . . . . . . . . . . . . . . . . . . . 40
4.1.1 Morphological Analyses . . . . . . . . . . . . . . . . . . . . . . . . . . . . . . . . . . . . . . . . . . . . . . . . . . . . . . 41
4.1.2 Lexical Analyses . . . . . . . . . . . . . . . . . . . . . . . . . . . . . . . . . . . . . . . . . . . . . . . . . . . . . . . . . . . . 44
4.1.3 Syntactic Analysis . . . . . . . . . . . . . . . . . . . . . . . . . . . . . . . . . . . . . . . . . . . . . . . . . . . . . . . . . . . 56
4.1.4 Semantic Analysis . . . . . . . . . . . . . . . . . . . . . . . . . . . . . . . . . . . . . . . . . . . . . . . . . . . . . . . . . . . 65
4.1.5 Stylistic Analysis . . . . . . . . . . . . . . . . . . . . . . . . . . . . . . . . . . . . . . . . . . . . . . . . . . . . . . . . . . . . 67
4.2 Analysis of Communication Behaviour . . . . . . . . . . . . . . . . . . . . . . . . . . . . . . . . . . . . . . . . . . . . . . . . . 72
4.2.1 Flow of Conversations . . . . . . . . . . . . . . . . . . . . . . . . . . . . . . . . . . . . . . . . . . . . . . . . . . . . . . . 73
4.2.2 Adaptation Ability . . . . . . . . . . . . . . . . . . . . . . . . . . . . . . . . . . . . . . . . . . . . . . . . . . . . . . . . . . 76
4.2.3 Ability to Dominate . . . . . . . . . . . . . . . . . . . . . . . . . . . . . . . . . . . . . . . . . . . . . . . . . . . . . . . . . 84
4.3 Information Retrieval Approaches . . . . . . . . . . . . . . . . . . . . . . . . . . . . . . . . . . . . . . . . . . . . . . . . . . . . 90
4.3.1 TF-IDF based Approaches . . . . . . . . . . . . . . . . . . . . . . . . . . . . . . . . . . . . . . . . . . . . . . . . . . . . 91
4.4 Feature Selection . . . . . . . . . . . . . . . . . . . . . . . . . . . . . . . . . . . . . . . . . . . . . . . . . . . . . . . . . . . . . . . . . . 92
4.4.1 Clustering of Text Files . . . . . . . . . . . . . . . . . . . . . . . . . . . . . . . . . . . . . . . . . . . . . . . . . . . . . . 92
4.4.2 Determining the Significance of Linguistic Features . . . . . . . . . . . . . . . . . . . . . . . . . . . . . . . 94

VIII Contents
4.4.3 Feature Selection for TF-IDF Approach . . . . . . . . . . . . . . . . . . . . . . . . . . . . . . . . . . . . . . . . . 95
5 Empirical and Classification Results . . . . . . . . . . . . . . . . . . . . . . . . . . . . . . . . . . . . . . . . . . . . . . . . . . . . . . 97
5.1 Analysis of Monologues . . . . . . . . . . . . . . . . . . . . . . . . . . . . . . . . . . . . . . . . . . . . . . . . . . . . . . . . . . . . . 98
5.1.1 Feature Analysis . . . . . . . . . . . . . . . . . . . . . . . . . . . . . . . . . . . . . . . . . . . . . . . . . . . . . . . . . . . . 99
5.1.2 Training Classifiers Using Linguistic Features . . . . . . . . . . . . . . . . . . . . . . . . . . . . . . . . . . . . 103
5.1.3 Training Classifiers Using TF-IDF Approach . . . . . . . . . . . . . . . . . . . . . . . . . . . . . . . . . . . . . 108
5.2 Analysis of Dialogues . . . . . . . . . . . . . . . . . . . . . . . . . . . . . . . . . . . . . . . . . . . . . . . . . . . . . . . . . . . . . . . 115
5.2.1 Feature Analysis . . . . . . . . . . . . . . . . . . . . . . . . . . . . . . . . . . . . . . . . . . . . . . . . . . . . . . . . . . . . 115
5.2.2 Training Classifiers using Linguistic Features . . . . . . . . . . . . . . . . . . . . . . . . . . . . . . . . . . . . . 123
5.2.3 Training Classifiers using the TF-IDF Approach . . . . . . . . . . . . . . . . . . . . . . . . . . . . . . . . . . 125
5.3 Conclusion . . . . . . . . . . . . . . . . . . . . . . . . . . . . . . . . . . . . . . . . . . . . . . . . . . . . . . . . . . . . . . . . . . . . . . . 128
6 Conclusions and Future Work . . . . . . . . . . . . . . . . . . . . . . . . . . . . . . . . . . . . . . . . . . . . . . . . . . . . . . . . . . . 131
6.1 Language Cues that Reflect the Verbal Intelligence of Speakers . . . . . . . . . . . . . . . . . . . . . . . . . . . 132
6.2 Adaptation of Speakers to Each Other . . . . . . . . . . . . . . . . . . . . . . . . . . . . . . . . . . . . . . . . . . . . . . . . 133
6.3 Estimation of Users’ Verbal Intelligence . . . . . . . . . . . . . . . . . . . . . . . . . . . . . . . . . . . . . . . . . . . . . . . 134
6.4 Future Directions . . . . . . . . . . . . . . . . . . . . . . . . . . . . . . . . . . . . . . . . . . . . . . . . . . . . . . . . . . . . . . . . . . 135
Documents used for Corpus Collection . . . . . . . . . . . . . . . . . . . . . . . . . . . . . . . . . . . . . . . . . . . . . . . . . . . . . . . 137
References . . . . . . . . . . . . . . . . . . . . . . . . . . . . . . . . . . . . . . . . . . . . . . . . . . . . . . . . . . . . . . . . . . . . . . . . . . . . . . . . 139
List of Figures . . . . . . . . . . . . . . . . . . . . . . . . . . . . . . . . . . . . . . . . . . . . . . . . . . . . . . . . . . . . . . . . . . . . . . . . . . . . . 146
List of Tables . . . . . . . . . . . . . . . . . . . . . . . . . . . . . . . . . . . . . . . . . . . . . . . . . . . . . . . . . . . . . . . . . . . . . . . . . . . . . 148
List of Own Publications . . . . . . . . . . . . . . . . . . . . . . . . . . . . . . . . . . . . . . . . . . . . . . . . . . . . . . . . . . . . . . . . . . . . 151

Acronyms
ANOVA One-Way Analysis of Variance
AW Abstract Word
ACTA Applied Cognitive Task Analysis
CDM Critical Decision Method
CT Cycle Model
DF Document Frequency
DL Dialogue Length
ET Emotional Tone
HAWIE Hamburg Wechsler Intelligence Test for Adults
GA Genetic Algorithm
GATB General Aptitude Test Battery
IDF Inverse Document Frequency
IDM Influence Diffusion Model
IGR Information Gain Ratio
IQ Intelligence Quotient
IR Information Retrieval
KBIT Kaufman Brief Intelligence Test
kNN k-Nearest Neighbours
LIWC Linguistic Inquiry and Word Count
LOO-CV Leave-One-Out Cross Validation
LSA Latent Semantic Analysis
LSM Language Style Model
NB Naive Bayes
SQ Social Quotient
SDS Spoken Dialogue System
SVM Support Vector Machines
TC Text Categorisation
TF Term Frequency
TST Total Speaking Time
VI Verbal Intelligence
VSM Vector Space Model
WAIS Wechsler Adults Intelligence Test
WPPSI Wechsler Preschool and Primary Scale of Intelligence

1
Introduction
A significant number of approaches to the functionality and multimodality of spoken dia-
logue systems (SDSs) have been developed during the last 40 years. One of the first dialogue
systems was a primitive computer program called Eliza [Weizenbaum, 1966]. It simulated an
interaction with a psychotherapist and was created using pattern-matching algorithms. To
keep the conversation going, it asked the user questions like “Why do you say that?”, “Do
you want to talk about it?”, and so on. Compared to Eliza, modern dialogue systems are
much more advanced. They are frequently used in travelling domains to help customers make
enquiries about possible flights, book hotels, obtain necessary information about arrivals and
departures, and so on. SDSs may also be used for the automatic routing of telephone calls.
The goal of such dialogue systems is to understand the problems of speakers and to connect
them with responsible human employees [Jurafsky and Martin, 2009]. The book shopping
domain with voice search helps users find books in which they are interested [Lee et al.,
2011]. The user does not need to know (or pronounce) the complete information about the
book. For example, a user may forget the exact title of a book if it is too long or compli-
cated. The system may perform searching using just a few key words, for example the name
of the author or a book category (detective, adventure, novel, and so on). Kyoto City Bus
Information System provides users with information about how long they will have to wait
before the bus comes [Komatani et al., 2003]. It may also tell users which bus they need to
take to reach their destination. If the user cannot say the name of the station, the system
asks for a famous place or location nearby and uses this input for searching in its database.
NJFun helps users find locations or entertainment places in New Jersey [Litman and Pan,
2000]. To provide a user with the necessary information, the system asks him or her for
certain attributes (for example, desired time and preferred activity). The system makes a
query against the database, which then parses the query and returns the requested data to
the user.
There are a large number of investigations on increasing the quality of human-machine
interaction, for example [Giachin, 1997]. However, creating an SDS that is able to participate
in a conversation like a human dialogue partner remains a challenging task. Such systems
should be able to deal with difficult tasks and react to a wide range of situations and
problems. Moreover, they should also be user-friendly and easy to use. Including aspects of
adaptation to users in an SDS may help increase the system’s communicative competence
and influence its acceptability (Figure 1.1).

2 1 Introduction
User
Acoustic front-end
speech recognitionLinguistic analysis
Dialogue
management
Text generationSpeech synthesis
Cognitive processes
of the user
Application
Adaptation to the
user
Spoken Dialogue System
Fig. 1.1. Next-Generation Spoken Dialogue System.
In this work, we propose that the automatic estimation of the verbal intelligence of users
may increase the adaptivity and user-friendliness of SDSs. Automatic verbal intelligence
estimation may help dialogue systems to choose the level of communication and become
simpler and more useful and effective. Based on the verbal intelligence estimation, a dialogue
system may predict the level of interaction for each particular user and find an appropriate
dialogue strategy. To our knowledge, such approaches for improving the adaptivity of an
SDS do not exist in the literature. Moreover, no other investigations have been performed
for the automatic estimation of the verbal abilities of users.
In this thesis, we suggest two approaches for estimating the verbal intelligence of speak-
ers. By “estimation” we understand the automatic classification of a speaker into a group of
individuals with similar verbal abilities (for example, lower and higher). These approaches
are based on the linguistic and statistical analysis of spoken utterances. The first approach
is based on language peculiarities that reflect the verbal abilities of individuals (for exam-
ple, the usage of abstract words in speech or the occurrence of the passive voice in sentence
structures). Moreover, we also took into account that individuals, when engaged in a con-
versation, change their language in order to adapt to their dialogue partners and make the
discussion more interesting and fluent. We determined linguistic and communication cues
that indicate speakers from different verbal intelligence groups and used them for the classi-
fication task. For the second approach, we selected the most representative words from each
verbal intelligence group using the term frequency - inverse document frequency (TF-IDF)
weighting scheme.
To compare the language use of individuals with different levels of verbal intelligence, we
invited 100 native German speakers of different ages and educational levels to participate
in our experiment. The goal of the experiment was to collect speech samples from our
participants and to measure their verbal intelligence abilities. We took into account that
speech samples should be about the same topic. Only in this case we may analyse which
vocabulary and language structures are used by different speakers to describe the same idea
or event.
1.1 SDSs that Estimate the Verbal Intelligence of Users 3
As a result we collected a speech data corpus that consists of monologues and dialogues
of participants and their verbal intelligence scores. We called it Verbal Intelligence Corpus.
Monologues and dialogues from it were used for determining the linguistic and communi-
cation peculiarities of individuals from different verbal intelligence groups and for creating
corresponding lists of the most frequently used terms.
We showed how individuals with different levels of verbal intelligence construct their
phrases, which syntactic structures they tend to use, and how they choose their words to
describe their ideas and thoughts. Additionally, we analysed the adaptation behaviour of
individuals and their ability to keep the conversation going.
Techniques proposed in this thesis may easily be integrated into an SDS because they
satisfy the following requirements:
• language cues that are used for the classification task may be automatically extracted
from speech samples and do not require any manual labeling;
• the extraction of these features does not take much time and may be performed after
each dialogue turn;
• the proposed techniques allow the system to obtain the required classification accuracy
and to determine the verbal intelligence group to which a current user belongs.
1.1 SDSs that Estimate the Verbal Intelligence of Users
The automatic estimation of users’ verbal intelligence may help SDSs to more effectively
control the flow of the dialogues, engage users in the interaction, and be more attentive to
human needs and preferences.
Using information about the verbal intelligence of speakers, an SDS may adapt to them
in the following way. From the beginning of the dialogue, the SDS may analyse the user’s
speech, behaviour, difficulties, and questions. When deciding on the best response to a user,
the dialogue manager may change words and sentence structures based on the information
about cognitive processes. Its responses may become more helpful and the user-friendliness
of the system may be improved.
Figure 1.2 explains the adaptation process of SDSs based on the verbal intelligence
estimation in more detail. When talking to the system, all j spoken utterances of a user are
analysed for the verbal intelligence determination. This means that the intelligence level is
re-estimated at each turn based on features extracted from the new spoken utterances and
from all the phrases which were spoken in the previous turns. In Figure 1.2, the SDS has
three different dialogue scenarios corresponding to users with higher, average, and lower
levels of verbal intelligence. At the beginning of the dialogue, the system uses scenarios
corresponding to users with average verbal intelligence levels. In the following turns, the
system switches to alternative dialogue scenarios.
The main purpose of this work is to find language peculiarities that reflect different
levels of verbal intelligence of speakers and that, at the same time, may be integrated into
a dialogue system for its automatic adaptation to users. We analysed spoken utterances
of individuals with different verbal abilities at several linguistic levels (e.g., morphological,
lexical, syntactic, etc.) and investigated their levels of communication, ability to adapt to
the other, and so on. In the following chapters, we use a general term feature to describe

4 1 Introduction
jth User’s Spoken
Utterances
User
Turn 1
Turn 2
…
Turn j-1
Turn j
Verbal Intelligence
EstimationFeature Extraction
average VI
low VI
high VI Dialogue Scenarios for
Different VI Groups
Scenario for
low VI
Scenario for
high VI
j+1th System’s
Reply
VI Groups
Scenario for
average VI
Fig. 1.2. Adaptation to the user.
such linguistic and interaction cues. We also show that these features may be further used
for the automatic estimation of the verbal intelligence of speakers.
It should be noted that our techniques for the automatic estimation of verbal intelligence
may only be integrated into SDSs that have certain properties. One of the most important
properties of such SDSs is the reliable functioning of all the modules: high-quality speech
recognition, detailed semantic analysis, and so on. Every component of the system should
be able to access the dialogue history at any moment. This increases the quality of internal
communication and allows the system to better solve internal problems and deal with users’
complicated sentence structures like ellipses, anaphora, and so on. Each interaction agent is
able to solve certain kinds of problems and is responsible for special interaction acts [Jokinen
et al., 2002]. For example, one agent is programmed to work with speech recognition errors;
another agent is responsible for choosing an appropriate dialogue strategy. Several agents
may be responsible for the same task but use different methods of solving problems. In this
case, the task of the evaluator is to decide which interaction agent should be chosen for a
particular situation.
A user should not feel restricted in choosing words and expressions for the system. The
system should allow users to speak in natural language that may include jokes, junk words,
irony, and so on and should be able to extract the context important for solving the task.
A large database of dialogues (about different topics) is necessary for teaching the dialogue
manager to construct the system’s responses in a natural way [Jokinen et al., 2002].
When users need information or help from an SDS, they start the dialogue with a short
expression or phrase and do not put all their requirements in the same sentence. The task of
the system is to involve a user in a productive conversation by asking additional questions.
The system should ensure that it has obtained all the information needed for a successful
completion of the task and has satisfied the needs of the user.
1.1 SDSs that Estimate the Verbal Intelligence of Users 5
The system’s ability to adapt to the user’s behaviour also depends on implemented
dialogue strategies and their sophisticated algorithms.
Komatani et al. (2003) suggest a dialogue system that estimates the “skill level” and
“the degree of hastiness” of a user and changes its dialogue strategy depending on these
values. When interacting with users having a high skill level, the system allows them to
take the initiative in the conversation. With users indicated having a low skill level, the
system controls the flow of the dialogue by asking necessary questions or providing required
information. If the user is not in a hurry, the system may ask him or her to confirm that
it has understood his or her query correctly. When talking to a user with a high degree of
hastiness, the system interacts without such confirmations.
When a system generates a response to a user, it should take into account his or her
knowledge about the domain. Depending on this information, the system should decide
what “kind” of information may be provided to the user and what “amount” of it may be
sufficient for a successful dialogue [Paris, 1988]. If the user has enough knowledge in this
field, the system should not give too detailed explanations or annoy a user by talking about
obvious things [Grice, 1975]. On the other hand, if the user is a novice in this domain, short
and concise replies will not be sufficient for him or her [Wilson and Anderson, 1986]. As
an example, an inhabitant does not need too detailed information about public locations
in his or her city compared to a stranger. If an SDS has too much information about the
topic in its database, it cannot provide a user with all these facts, especially if they are very
detailed and the user has enough knowledge in this domain. The system should estimate
how much knowledge about the topic a user may have, properly choose important and useful
facts, and construct coherent sentences to present this information to the user. An adaptive
SDS should take into account whether a user is in a hurry and wants to get the required
information as soon as possible. In this case, the system should quickly understand the
user’s problem and provide him or her with the most important facts that he or she needs
to know.
A flexible dialogue system should be able to choose between a variety of dialogue strate-
gies depending on the dialogue flow and user capabilities. It should also allow users to initiate
the dialogue and to switch to another topic at any time. On the other hand, it should not
lose control of the dialogue, should keep analysing its level, and should change the dialogue
strategy if something goes wrong. In [Griol et al., 2011], an algorithm for determining the
optimal dialogue strategy in a human-computer conversation was suggested. An SDS gen-
erates its responses to a user based on a labelled dialogue corpus and the dialogue history,
which should be saved after each conversational turn. If a dialogue corpus contains a great
variety of user queries and system responses, the SDS is able to automatically choose the
proper dialogue strategy and satisfy the needs and preferences of the user.
As described above, an adaptive SDS that is able to estimate the verbal intelligence of
speakers should work in the following way: it should analyse new phrases and sentences
of the user, extract all necessary features, re-run the classification algorithm (or any other
algorithm for automatic estimation of verbal intelligence), update the information about
the verbal intelligence of the user, and, if necessary, change the level of interaction. This
procedure should be repeated iteratively, after each user’s turn or a series of turns which
requires rapid and reliable functioning of the feature extraction and classification modules.
6 1 Introduction
1.2 Thesis Contributions
The thesis has made the following theoretical, practical, and experimental contributions:
Theoretical
• The development of two main approaches for verbal intelligence estimation:
– In the first approach, features extracted at different linguistic levels are used for the
classification of users into several verbal intelligence groups.
– In the second approach, each monologue and dialogue is represented as a feature
vector where each word is a feature and its weight is a feature value.
• Application of approaches like Language Style Matching, Social networks, Dominance
estimation, and so on to estimate the ability of speakers with different levels of verbal
intelligence to adapt to each other when engaged in a conversation.
• Investigation of the spoken utterances of individuals with different levels of verbal intel-
ligence at several linguistic levels.
• Description of the possible functioning of a user-friendly SDS that takes into account the
verbal intelligence of a user estimated after each dialogue turn and uses this information
to increase its adaptivity.
• Definition of language features that reflect the verbal intelligence of speakers, do not
require much computational time, and may be used for the classification of users into
several verbal intelligence groups with a satisfactory accuracy.
• Determination of the optimal verbal intelligence estimation algorithm that may easily be
implemented in an SDS and at the same time satisfies all computational requirements
(computational speed and ability to be automatically estimated).
• Investigation of the linguistic peculiarities of the German spoken language (vocabulary,
syntactic structures, speech styles, etc.) to determine features that may identify speakers
of higher and lower verbal intelligence levels.
Practical
• Collection of a corpus containing speech samples of 100 native German speakers and
their verbal intelligence scores measured using one of the most famous verbal intelligence
tests, HAWIE. The corpus was used for training and testing models for the automatic
estimation of the verbal intelligence of speakers. Additionally, it may be further used for
other research purposes like emotion recognition, analysis of gender and age differences
in spoken language, and so on. One of the most useful advantages of the corpus is that
the monologues and dialogues that were collected during the study were about the same
topic. This may be further used for investigating other personality differences among
individuals.
• A study to determine the peculiarities of the dominant behaviour of individuals.
• The implementation of algorithms that may be used for the classification of dialogue
participants into several verbal intelligence groups taking into account the phenomenon
of adaptation of dialogue participants to each other and corresponding changes in the
level of interaction.
1.3 Document Structure 7
Experimental
• Identification of language and behaviour features that may reflect the verbal intelligence
of a speaker (using analysis of variance and different approaches to select the most
informative variables).
• Identification of features that reflect the level of adaptation of dialogue partners to each
other during the interaction and using this information to improve the verbal intelligence
classification results.
In the following section, we describe the structure of the thesis.
1.3 Document Structure
This document contains six chapters. In the present chapter, we provide the motivation for
the study. We also suggest a dialogue strategy that may allow an SDS to change the level
of interaction depending on the verbal intelligence level of a speaker. In the second chapter,
we describe different theories about the nature of cognitive abilities and introduce the term
intelligence. Based on these theories, a great variety of intelligence tests were created. Some
of them are presented in Chapter 2. We also introduce the term verbal intelligence and talk
about its role in social life, education, success, and so on. In Chapter 3, we present a speech
data corpus that was collected for the analysis of the language peculiarities of speakers with
different verbal abilities. It consists of speech samples of 100 native German speakers with
different educational backgrounds and social statuses. Their verbal abilities were measured
using a verbal intelligence test that is also described in the chapter. In Chapter 4, we
present approaches that were used for the analysis of verbal and communication behaviour
of individuals. These techniques are based on the linguistic and computational analysis of
speech samples. They take into account morphological, lexical, syntactic, semantic, and
stylistic information and estimate the ability of individuals to keep the conversation going
and to adapt to the dialogue partner. We also describe information retrieval approaches
like TF-IDF measures that may be used for determining the choice of words of speakers
with different levels of verbal intelligence. The approaches were applied to the monologues
and dialogues from the Verbal Intelligence Corpus. The results of this analysis are shown in
Chapter 5. We also determine language peculiarities that reflect the verbal intelligence of
speakers and use them for the classification task. In Chapter 6, we compare the classification
results and discuss the achievements of this work.


2
Background
2.1 History of Intelligence and Intelligence Tests
Intelligence is a Latin word (“inter” meaning between and “legere” meaning to choose) that
“refers to the ability to comprehend; in a more limited use, it meant sensitivity and good
sense” [Agostini and De Carlo, 2012].
Gotfredson gives the following definition of intelligence: “Intelligence is a very general
mental capability that, among other things, involves the ability to reason, plan, solve prob-
lems, think abstractly, comprehend complex ideas, learn quickly, and learn from experience.
It is not merely book learning, a narrow academic skill, or test-taking smarts. Rather, it
reflects a broader and deeper capability for comprehending our surroundings by ‘catching
on’, ‘making sense’ of things, or ‘figuring out’ what to do” [Gottfredson, 1997b].
One of the first attempts to measure intelligence is attributed to an English scientist
named F. Galton. Galton believed that the intellectual abilities of individuals depend on
the keenness of their senses. Individuals with keener senses are better able to perceive infor-
mation from the environment, analyse it, and develop their reasoning skills [Galton, 1896].
Galton suggested that indicators of intelligence would include the individuals’ height, weight,
reaction time, thresholds of sensitivity, etc. For “testing” the intelligence of individuals, he
used existing methods and also created new ones. Some of them (for example, using a whis-
tle to determine the threshold of pitch perception) are still used nowadays and named after
Galton.
James McKeen Cattell proposed that the mental abilities of individuals depend on the
size of their brains and the functioning of their nervous systems. He published a number of
tests that, according to his theory, measure the differences in the intelligence level of people
[Cattell, 1890]. The tests were similar to Galton’s tests; they included measuring the size
of the head, reaction time, the keenness of senses, etc. However, his investigations did not
show any significant correlation between the parameters considered and the mental abilities
of individuals.
The first attempts to scientifically measure intelligence were made by Alfred Binet at
the beginning of the 20th century. He believed that intelligence should be related to more
complex psychological processes. In 1896 Alfred Binet and Victor Henri described a series
of tests for measuring attention, memory, imagination, comprehension, etc. [Fancher, 1985].
Binet also investigated dependencies between mental abilities and personality. It should be
noted that similar ideas were expressed by other scientists. In the XVIII century, Charles
10 2 Background
Bonnet suggested analysing the opinions of individuals about the same situation or fact for
measuring intellectual differences. In 1889, A. Orn proposed that mental processes may be
divided into four basic abilities: perception, memory, association, and motor reactions and
developed tests for measuring these skills [Burlatchuk, 1997]. Krapelin was interested in
the investigation of individuals with mental disorders [Krapelin, 1895]. He created a series
of tests that consisted of a number of arithmetic operations and used them for analysing
memory and susceptibility to tiredness and fatigue. In 1891, Hugo Munsterberg developed
14 tests for children which included arithmetical, reading, verbal association, and memory
tasks. However, these ideas were not widely acknowledged at the time. Binet’s model of
mental processes and intelligence tests was used by psychologists for approximately 60 years.
Binet believed that only the most complicated mental processes may reflect individuals’
intellectual differences. He recommended using such psychological tests as they may help
to analyse the reasoning, memory and imagination of the test persons. For example, he
suggested using ink blots as an imagination test [Burlatchuk, 1997]. In 1904, he was asked
by the French Ministry of Education to create a series of tests that may determine whether
a child has lower mental abilities than other children of the same age and whether they
may need additional help from teachers or special education. In 1905 Binet and Theodore
Simon created a mental test for children that consisted of 30 tasks with increasing difficulty
[Binet and Simon, 1905]. The test also contained verbal tasks to analyse the comprehension
and reasoning skills of children. In 1908 the Binet-Simon test was modified; the new version
contained 59 tests developed for children from three to 13 years old. For example, the
Binet-Simon test for seven-year and eight-year old children consisted of the following tasks:
Seven-year old:
• To differ between right and left sides;
• To describe a picture;
• To perform some orders;
• To find the total cost of several coins.
Eight-year old:
• To compare two objects using memory;
• To count from 20 to 1;
• To find what was missing in the appearance of people;
• To repeat a string of 5 digits.
Binet’s main idea was that a child of a certain age should perform well in tests successfully
taken by other children of the same age. If a child passes the tests without any difficulty, then
his or her intellectual abilities are normal. Binet suggested using these tests to determine
the ‘mental age’ of children. For example, a six-year-old child is not able to perform all the
tasks in the test dedicated for his or her age-group, but he or she successfully passes the test
developed for five-year-old children. Therefore, his or her mental age is five years old and
several months corresponding to the number of successfully performed tasks in more difficult
tests (developed for children of older ages). The intelligence coefficient of the child is the
absolute difference between his or her mental age and biological age. In 1912, William Stern
suggested using the relative measure of intelligence instead of the absolute one [Heilbron,
2003]. He called this relative difference intelligence quotient (IQ):

2.1 History of Intelligence and Intelligence Tests 11
IQ =mental age
biological age∗ 100%.
Binet agreed that his tests have many disadvantages. He claimed that intelligence tests
cannot measure intelligence itself but intelligence with knowledge obtained from school and
perceived from the environment. However, these conclusions were ignored by many other
scientists that used Binet’s ideas for further investigation.
In 1901, Spearman proposed that the different intellectual abilities of individuals are
dependent on each other. He analysed children’s academic performance at school and dis-
covered that their progress in subjects such as classics, French, English, maths, music, and
pitch discrimination is correlated with each other. His two factor theory explains this phe-
nomenon and states that there exists a “general factor” or g and “specific factors”, S1, S2,
and so on (for example, memory, vocabulary, ability to solve mathematical problems, etc.).
Each test is a measure of a certain specific factor Si and, at the same time, of the general
intelligence factor g that summarizes correlations between such tests. Spearman claimed
that g is common for all measures of intelligence. He also proposed a hypothesis that the
general factor reflects the mental energy of individuals: g is “something of the nature of an
‘energy’ or ‘power’ that serves in common the whole cortex” [Spearman, 1923]. This theory
suggested that tests for measuring different mental abilities should not be chosen intuitively,
as was done before, and that the dependency between certain skills should be considered.
Further investigations showed that different tests may show stronger or weaker correlations
with each other that may not be explained only by the two factor theory.
The hierarchical theory of intelligence is based on Spearman’s ideas. According to this
theory, “g” is the most important ability, and it should be placed at the top of the hierarchy.
Specific abilities are placed at lower hierarchical levels (see Figure 2.1).
General abilityGeneral ability
Fluid abilities Crystallized abilities Short memory
Verbal reasoning Quantitative reasoning Abstract reasoning
Verbal classification
Comprehension
Verbal analogies
Quantitative relations
Number series
Equation building
Figure analogies
Figure analysis
Matrices
Memory tests using
numbers, words, subjects
General ability
Verbal ability Numerical ability
Level 1
Level 2
Level 3
Subtests
C M D N E
U
C
R
S
T
J
FS
MB
mental
operation
content
cognitive
product
Level 1
General factor
Group factors
Specific factors
Fig. 2.1. Hierarchical model of intelligence.
Numerous other psychologists (e.g., Cattel and Horn in their theory about crystallized
and fluid intelligence) supported the hierarchical theory [Horn and Cattell, 1966].
In the United States, Henry Goddard used Binet’s test [Goddard, 1913]. However, the
test was not adapted to individuals who could not speak English. Subsequently, Lewis
Terman analysed the validity of Binet’s test for American children and improved it by
modifying some tasks and adding new ones [Terman, 1916]. About 2,100 children and 180
adults were asked to complete the modified version of the test. After analysing the results
obtained, Terman suggested classifying IQs in the following way: IQ between 90 and 109
shows average mental abilities, IQ lower than 70 reflects mental disorders, and IQ greater
than 140 indicates genius. He claimed that such classification is arbitrary and should be
considered only as a general rule.

12 2 Background
During the First World War, intelligence tests often were used to measure the cognitive
abilities of individuals without military education. In 1917, the General Committee was
established to analyse the psychological state of soldiers, estimate the cognitive abilities of
selectees, and solve psychological and communication problems in the army. In addition,
one of the purposes of the committee was to identify candidates for special commissions and
individuals with possible psychological disorders [Burlatchuk, 1997].
After the First World War, a great variety of new tests for measuring intelligence and the
other abilities of individuals was created. For example, John Langdon Stenquist developed
a test for determining individuals’ mechanical abilities that could be useful for success-
fully working with technical equipment [Stenquist, 1922], and Florence Laura Goodenough
created the Draw-A-Person test, which was based on the analysis of drawings created by
examinees [Goodenough, 1926]. In addition, the Porteus Maze Test was designed to measure
the intellectual abilities of children and adults. It consisted of a number of mazes of different
complexity levels; those tested were asked to find a way through the mazes in a limited time
[Porteus, 1959].
Despite the wide selection of tests created, psychologists remained dissatisfied with their
quality and clearly understood that further investigations in this area were required. Con-
sequently, several tests were improved and developed.
In 1937, an improved version of the Stanford-Binet scale was developed [Becker, 2003].
The test was organized for children of ages from two and, compared to the previous version,
could also be used when working with children from 11 to 13 years old. The scale was
criticized for shortcomings such as having a significant number of verbal tasks and being
useless for estimating the intelligence of adults. However, most psychologists agreed that
this version was a great improvement on the previous one and began to use it to measure
the intelligence of individuals.
Raven’s Matrices, developed in 1938, allowed psychologists to measure the intelligence
of individuals while largely excluding the influence of culture and education on the results
[Raven, 1941]. Those tested were asked to find a missing element in a composition of similar
objects. Although the test was not able to predict the academic success of individuals,
scientists of that time acknowledged it, and nowadays it is widely used by psychologists in
different countries.
In 1939, David Wechsler developed the Wechsler-Bellevue test, an intelligence test for
determining the verbal and nonverbal (performance) intelligence of individuals [Wechsler,
1939b]. The test was divided into two parts, namely verbal and nonverbal or performance
sections, and it contained 11 subtests. Verbal subtests consisted of questions for measuring
the general knowledge of those tested and their abilities to solve mathematical tasks and
see similarities between different objects. In addition, test subjects were asked to repeat a
string of digits and to explain the meaning of terms of different complexity. The nonverbal
part of the test included tasks such as designing symbols, finding a missing part of a picture,
and determining the logical sequence of events. Wechsler did not agree with the theory of
mental age. For calculating intelligence, he compared results obtained by an individual after
passing the test with the results of other individuals of the same age.
IQ =obtained results of a test person
average results of test persons of the same age∗ 100%.

2.1 History of Intelligence and Intelligence Tests 13
When developing this scale, Wechsler established that younger subjects were better able
to pass the tests and obtained higher intelligence scores than older individuals did. This
difference was clearly observed when the intelligence scores of subjects that were older than
35 were analysed. Some psychologists concluded that when an individual has reached a
certain age, his or her intelligence begins gradually decreasing. For other psychologists, this
phenomenon proved that the intellectual abilities of individuals vary depending on the way
they are measured.
In 1937, the California Tests of Mental Maturity was published [Sullivan et al., 1937]. The
test was initially formulated for children of school age, and it consisted of tasks for measuring
keenness of sight and hearing, coordination, memory, reasoning and vocabulary. Moreover,
in 1938, Louis L. Thurstone published his Primary Mental Abilities Test [Thurstone, 1938].
Thurstone was one of the followers of the multiple-factor theory of intelligence and claimed
that, in contrast to Spearman’s theory, intelligence consists of seven factors (or “primary
mental abilities”):
• V Verbal comprehension (ability to understand and interpret spoken or written infor-
mation);
• W Verbal fluency (ability to quickly find appropriate words in a given situation, ability
to rhyme);
• N Number (computation skills and ability to solve mathematical problems);
• S Spatial visualization (perception of geometric figures and their forms);
• M Associative memory (ability to find a relationship between objects);
• P Perceptual speed (ability to quickly and correctly determine particularities of patterns,
similarities and differences between them);
• I(R) Inductive reasoning (ability to find a rule for solving different problems).
In 1979, H. J. Eysenck tried to combine Speaman’s and Thurstone’s theories. He defined
intelligence in the following way: “If we can derive a model of the intellect, therefore, from
the existing literature, it may be suggested that a combination of Spearman’s g, Thurstone’s
primary abilities (grouped under mental processes and test material), and the break-down of
the IQ into speed, persistence and error-checking, may be the best available at the moment”
[Eysenck, 1979].
Similarly, J. P. Guilford opposed Spearman’s theory of “g” [Guilford, 1956]. In his
Structure-of-Intellect theory, he suggested that mental abilities could be described in terms
of three dimensions (or factors) that are independent of each other. The first dimension,
mental operation, consists of abilities such as cognition (C), memory (M), divergent pro-
duction (D), convergent production (N), and evaluation (E). The second factor, content,
determines individuals’ ability to effectively operate with different kinds of information
such as figural (F), symbolic (S), semantic (M), and behavioural (B) information. The third
dimension is cognitive product, which determines the ability to process information as units
(U), classes (C), relations (R), systems (S), and transformation (T) (Figure 2.2) [Barlow,
2000]. According to Guilford, different combinations of these components determine the
unique intellectual abilities of individuals.
In addition, in 1935, E. A. Doll created the Vineland Social Maturity Scale for deter-
mining the degree of social competence of individuals [Doll, 1953]. The test could be used
for individuals from birth until the age of 30, and the results indicated the person’s social

14 2 Background
General abilityGeneral ability
Fluid abilities Crystallized abilities Short memory
Verbal reasoning Quantitative reasoning Abstract reasoning
Verbal classification
Comprehension
Verbal analogies
Quantitative relations
Number series
Equation building
Figure analogies
Figure analysis
Matrices
Memory tests using
numbers, words, subjects
General ability
Verbal ability Numerical ability
Other factors Other factors
Level 1
Level 2
Level 3
Subtests
C M D N E
U
C
R
S
T
J
FS
MB
mental
operation
content
cognitive
product
Fig. 2.2. Guilford’s “Structure of intellect”.
quotient (SQ). It consisted of 117 questions administered during an interview with one of the
parents (or with another close friend or relative) of the person tested. When developing this
test, Doll focused his attention on individuals who might have a high intelligence level but
low social abilities (for example, criminals). Thus, he became one of the first psychologists
to investigate dependencies between people’s intelligence and personalities.
During the Second World War, psychologists continued developing and modifying tests
for measuring the abilities of individuals. At the same time, a significant number of sit-
uational tests were created. These tests allowed psychologists to analyse the behaviour of
soldiers in stressful situations and to estimate their appropriateness for special commissions.
In 1942, the second version of the Wechsler Intelligence Test was published. This scale
was one of the most popular intelligence tests of those years, and numerous psychological
research studies proved the validity of its results. In 1949, Wechsler created intelligence tests
for measuring the mental abilities of children from five to 15 years old [Wechsler, 1949].
This scale gradually became more popular in the United States than the Stanford-Binet
test for children, which still was used frequently in those days. In 1955, the Wechsler Adult
Intelligence Scale (WAIS) was created [Wechsler, 1955]. This test had a similar structure
to the Wechsler-Bellevue test and was developed for adults from 16 to 64 years old. In
the following years, Wechsler’s scales were further developed and improved. The following
versions of the test were published: Wechsler Intelligence Scale for Children - Revised Edition
(WAIS-R) [Wechsler, 1981], Wechsler Preschool and Primary Scale of Intelligence - Revised
Edition (WPPSI-R) [Wechsler, 1989] and Wechsler Adult Intelligence Scale - Third Edition
(WAIS-III) [Wechsler, 1997].
Furthermore, the General Aptitude Test Battery (GATB), created in 1956, was used
for analysing the professional abilities of applicants for different positions [Hirt, 1959]. It
consisted of 15 subtests for measuring factors such as verbal and mathematical abilities
and the learning capability of applicants. It should be noted that the validity of this test
was studied by analysing professional canons of the subjects. In contrast, the reliability of
intelligence tests was measured by considering the academic success of subjects.
2.1 History of Intelligence and Intelligence Tests 15
In the 1960s to 1970s, intelligence tests were strongly criticized for being unreliable. Some
psychologists proposed the prohibition of using tests for any purposes. Other researchers
disagreed with situations in which applicants for certain positions were not employed because
of having a lower intelligence score than some other candidates. Furthermore, New York was
one of the first cities in the United States that forbade the use of group intelligence tests
at schools, and other cities soon followed suit. Trade unions and parents claimed that using
intelligence tests in education and professional spheres is discriminatory because such tests
prevent people from obtaining further education and achieving success at work.
Despite the criticism, psychologists continued to develop and improve tests for measuring
mental abilities. Raymond Cattell suggested that the “g” of Spearmans theory consists of
two abilities: fluid “Gf” and crystallized “Gc” [Horn and Cattell, 1966]. Fluid intelligence
includes abilities such as reasoning, memory, and way of thinking. They determine the
way individuals process information and explain why some are more successful in acquiring
knowledge than others. These abilities help people to rationally react in new situations,
make decisions, and solve problems that cause the development of crystallized abilities.
Crystallized abilities “indicate the extent to which an individual has attained the knowl-
edge of the culture” [Yekovich, 1994], and these abilities depend on individuals’ education,
experience, interests, and activities.
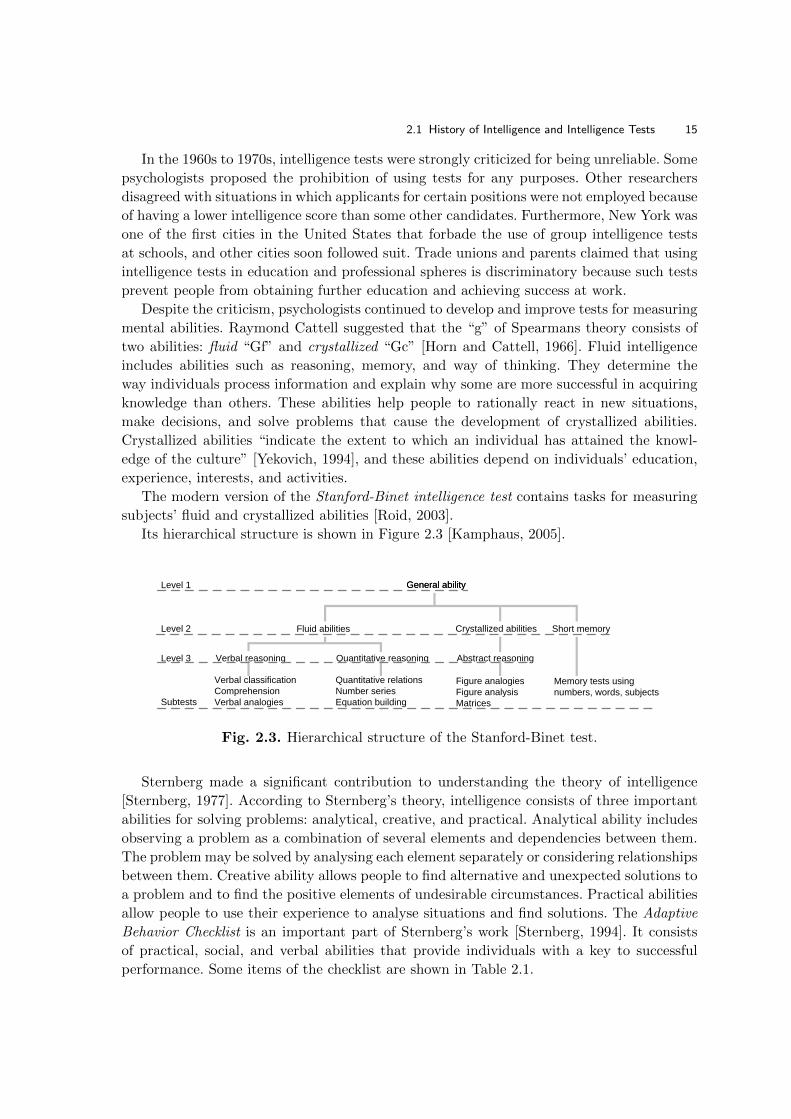
The modern version of the Stanford-Binet intelligence test contains tasks for measuring
subjects’ fluid and crystallized abilities [Roid, 2003].
Its hierarchical structure is shown in Figure 2.3 [Kamphaus, 2005].
General abilityGeneral ability
Fluid abilities Crystallized abilities Short memory
Verbal reasoning Quantitative reasoning Abstract reasoning
Verbal classification
Comprehension
Verbal analogies
Quantitative relations
Number series
Equation building
Figure analogies
Figure analysis
Matrices
Memory tests using
numbers, words, subjects
General ability
Verbal ability Numerical ability
Other factors Other factors
Level 1
Level 2
Level 3
Subtests
Fig. 2.3. Hierarchical structure of the Stanford-Binet test.
Sternberg made a significant contribution to understanding the theory of intelligence
[Sternberg, 1977]. According to Sternberg’s theory, intelligence consists of three important
abilities for solving problems: analytical, creative, and practical. Analytical ability includes
observing a problem as a combination of several elements and dependencies between them.
The problem may be solved by analysing each element separately or considering relationships
between them. Creative ability allows people to find alternative and unexpected solutions to
a problem and to find the positive elements of undesirable circumstances. Practical abilities
allow people to use their experience to analyse situations and find solutions. The Adaptive
Behavior Checklist is an important part of Sternberg’s work [Sternberg, 1994]. It consists
of practical, social, and verbal abilities that provide individuals with a key to successful
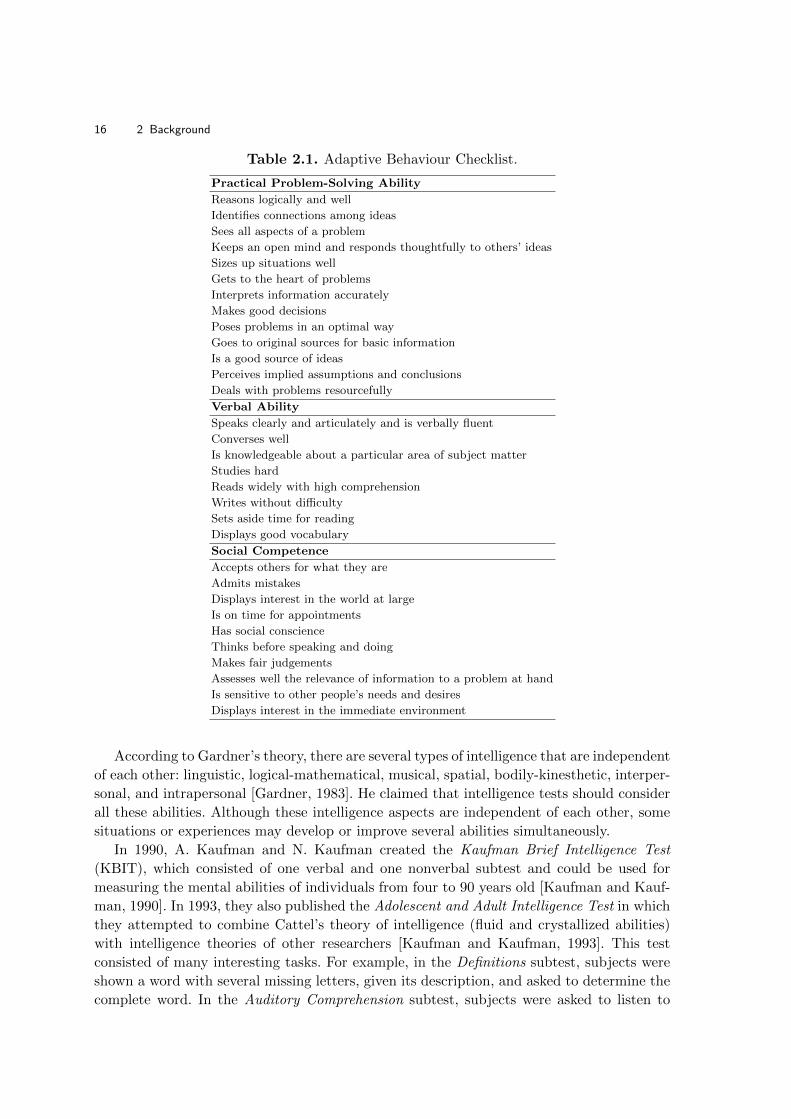
performance. Some items of the checklist are shown in Table 2.1.
16 2 Background
Table 2.1. Adaptive Behaviour Checklist.
Practical Problem-Solving Ability
Reasons logically and well
Identifies connections among ideas
Sees all aspects of a problem
Keeps an open mind and responds thoughtfully to others’ ideas
Sizes up situations well
Gets to the heart of problems
Interprets information accurately
Makes good decisions
Poses problems in an optimal way
Goes to original sources for basic information
Is a good source of ideas
Perceives implied assumptions and conclusions
Deals with problems resourcefully
Verbal Ability
Speaks clearly and articulately and is verbally fluent
Converses well
Is knowledgeable about a particular area of subject matter
Studies hard
Reads widely with high comprehension
Writes without difficulty
Sets aside time for reading
Displays good vocabulary
Social Competence
Accepts others for what they are
Admits mistakes
Displays interest in the world at large
Is on time for appointments
Has social conscience
Thinks before speaking and doing
Makes fair judgements
Assesses well the relevance of information to a problem at hand
Is sensitive to other people’s needs and desires
Displays interest in the immediate environment
According to Gardner’s theory, there are several types of intelligence that are independent
of each other: linguistic, logical-mathematical, musical, spatial, bodily-kinesthetic, interper-
sonal, and intrapersonal [Gardner, 1983]. He claimed that intelligence tests should consider
all these abilities. Although these intelligence aspects are independent of each other, some
situations or experiences may develop or improve several abilities simultaneously.
In 1990, A. Kaufman and N. Kaufman created the Kaufman Brief Intelligence Test
(KBIT), which consisted of one verbal and one nonverbal subtest and could be used for
measuring the mental abilities of individuals from four to 90 years old [Kaufman and Kauf-
man, 1990]. In 1993, they also published the Adolescent and Adult Intelligence Test in which
they attempted to combine Cattel’s theory of intelligence (fluid and crystallized abilities)
with intelligence theories of other researchers [Kaufman and Kaufman, 1993]. This test
consisted of many interesting tasks. For example, in the Definitions subtest, subjects were
shown a word with several missing letters, given its description, and asked to determine the
complete word. In the Auditory Comprehension subtest, subjects were asked to listen to
2.2 Verbal Intelligence 17
several short stories that became increasingly complex and required them to be attentive
and to recall some important details. In the Famous Faces subtest, examinees were shown
pictures of famous people with a description of who these people are and were asked to
identify their faces.
As is evident, a great variety of tests for measuring the abilities of individuals was created
in the 20th century. Today, researchers and psychologists continue working on intelligence
theories and on developing tests that are more reliable. One of the main purposes of in-
telligence tests remains the prediction of academic performance, and employers frequently
use intelligence tests to better know the intellectual abilities of job applicants. In addition,
psychologists create special tests that should help organizations and companies solve certain
problems. For example, the ACTA (Applied Cognitive Task Analysis) method is frequently
used for the analysis of difficulties at work, employee error, and possible actions for improv-
ing the situation [Militello et al., 1997]. The technique is based on interviews with individuals
involved in this activity. Another technique, CDM (Critical Decision Method), also includes
interviews and is used for the analysis of employees’ decisions in difficult or uncertain sit-
uations [Klein et al., 1989]. Often, individuals themselves are interested in estimating their
cognitive abilities and take part in different intelligence tests or solving mathematical or
logical tasks.
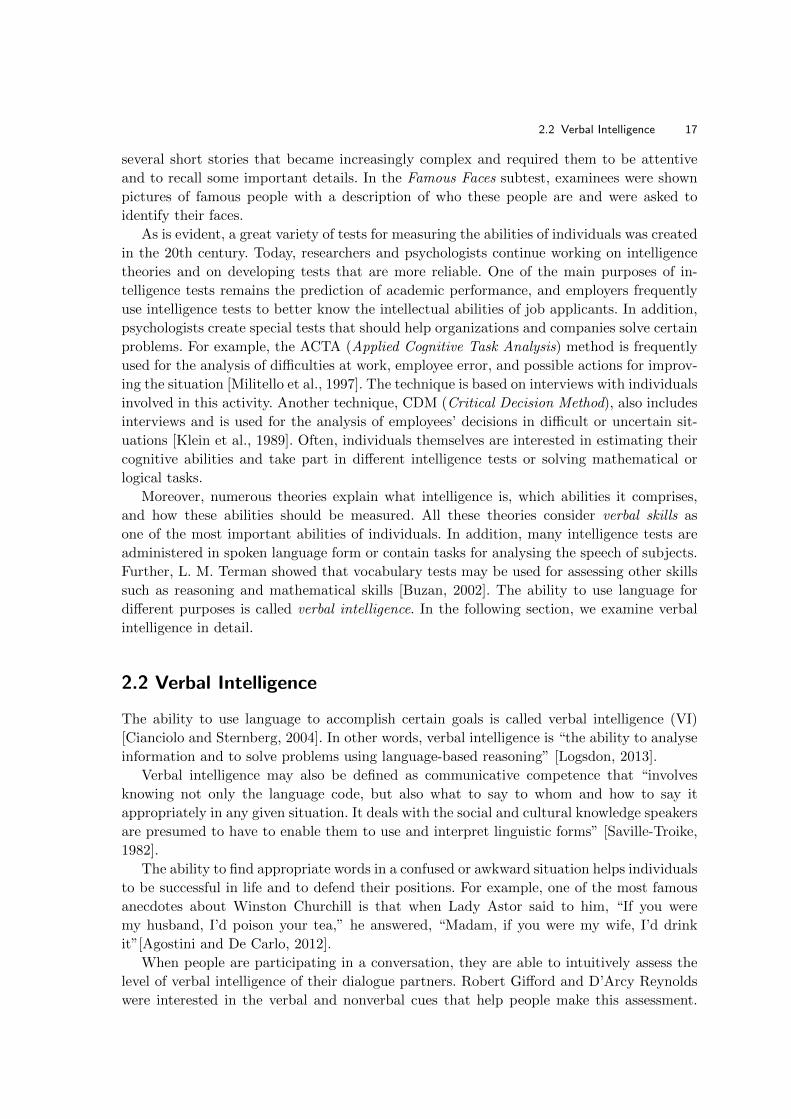
Moreover, numerous theories explain what intelligence is, which abilities it comprises,
and how these abilities should be measured. All these theories consider verbal skills as
one of the most important abilities of individuals. In addition, many intelligence tests are
administered in spoken language form or contain tasks for analysing the speech of subjects.
Further, L. M. Terman showed that vocabulary tests may be used for assessing other skills
such as reasoning and mathematical skills [Buzan, 2002]. The ability to use language for
different purposes is called verbal intelligence. In the following section, we examine verbal
intelligence in detail.
2.2 Verbal Intelligence
The ability to use language to accomplish certain goals is called verbal intelligence (VI)
[Cianciolo and Sternberg, 2004]. In other words, verbal intelligence is “the ability to analyse
information and to solve problems using language-based reasoning” [Logsdon, 2013].
Verbal intelligence may also be defined as communicative competence that “involves
knowing not only the language code, but also what to say to whom and how to say it
appropriately in any given situation. It deals with the social and cultural knowledge speakers
are presumed to have to enable them to use and interpret linguistic forms” [Saville-Troike,
1982].
The ability to find appropriate words in a confused or awkward situation helps individuals
to be successful in life and to defend their positions. For example, one of the most famous
anecdotes about Winston Churchill is that when Lady Astor said to him, “If you were
my husband, I’d poison your tea,” he answered, “Madam, if you were my wife, I’d drink
it”[Agostini and De Carlo, 2012].
When people are participating in a conversation, they are able to intuitively assess the
level of verbal intelligence of their dialogue partners. Robert Gifford and D’Arcy Reynolds
were interested in the verbal and nonverbal cues that help people make this assessment.

18 2 Background
They discovered that if an individual uses a great variety of words, speaks fluently, and is
easy to understand, listeners automatically judge the person as someone with a high verbal
intelligence level. On the other hand, cues such as slang words, expressions such as “hm”
and “ehm”, and loud speech do not play a significant role in this assessment [Buzan, 2002].
Speech of verbal intelligent individuals may be characterized by the following aspects
[Grice, 1975; Eysenck and Keane, 2005]:
• verbally intelligent speakers provide informative facts;
• their speech is truthful;
• they talk about things that are relevant to a particular conversation;
• they may intuitively estimate the verbal intelligence of their listeners and find clear and
understandable words and sentences.
Furthermore, it has been shown that verbal intelligence strongly correlates with other mental
abilities and skills.
Advanced technologies of the 21st century allow researchers to better understand how
the brain works. It is becoming possible to investigate what brain activity takes place when
an individual experiences elevated levels of stress or sleep problems and why it is so difficult
to break bad habits. Modern brain imaging equipment permits researchers to determine
which parts of the brain are activated when people listen to music, watch talk shows, or
play with their pets. Similarly, language is processed in certain parts of the brain, allowing
people to find appropriate words and sentences when they are involved in a conversation and
to understand the information obtained from their dialogue partners. Moreover, a signifi-
cant number of investigations have been made to determine whether there is a relationship
between thought and language [Vygotsky, 1986; Chomsky, 1968; Goodman, 1968].
When people think, certain parts of the brain “translate” emotions and feelings into ideas
and thoughts. If people want their listeners to know about these ideas, they “verbalize”
them by finding appropriate words and expressions and combining these into coherent and
grammatically correct (or incorrect) phrases and sentences. At the same time, if they want
their dialogue partners to understand them, they have to find the best way of introducing
this information. Thus, they have to choose words that reflect their point of view and
consider the opinion of the listener. Thoughts may replace each other at a very high speed,
and sometimes people do not even understand how certain ideas came to mind. Other ideas
become more important and remain the focus of attention. The “workspace” for current
ideas is called short-term memory.
In [Carroll and Casagrande, 1958], it was proposed that the way people think depends
on the complexity of their native language. According to this theory, the complexity of
language influences the processes in the brain and results in the way people analyse events
and situations. For example, if the grammatical structure of language includes constructions
such as passive voice and future in the past, native speakers may, for example, compare
things with each other, talk about the past, and analyse unreal situations using “if I could”.
The Sapir-Whorf hypothesis consists of similar ideas. According to this theory, the way
people think and process information strongly depends on the structure of the language
they speak [Hoijer, 1971]. Languages with small vocabularies and the way of thinking of
corresponding nationalities were analysed. The researchers claimed that if a language does
not contain a certain word, the native speakers would not use the concept of this word in
their lives and vice versa.

2.2 Verbal Intelligence 19
Vygotsky proposed that the speech and thoughts of children between one month and
three years old are independent of each other [Vygotsky, 1986]. A three-year-old child ex-
plores the environment around her and solves certain problems without verbalizing her
emotions. At the same time, she is acquiring language, and she begins pronouncing her
first sounds, words, and short sentences. As a child ages, the connection between language
and thought becomes stronger. Children use images when thinking about something; adults
verbalize their emotions and use words to describe the environment.
The process of comprehension is also important for verbalizing one’s own ideas and
thoughts. During the last 50 years, cognitive psychologists investigated how individuals
comprehend new information when participating in a conversation, listening to others, or
reading new texts. It was proposed that “the human mind actively constructs various types
of cognitive representation (that is, codes, features, meanings, structured sets of elements)
that interpret the linguistic input” [Graesser et al., 1997].
In [Chan et al., 1998], it was demonstrated that children who attend music lessons may
better memorize words than other children. Moreover, Funk and Lewis (1942) described
the following experiment: Children of the same age and background were divided into two
groups. Both groups had the same classes at school. However, the second group had addi-
tional classes for improving their vocabulary and verbal skills. As a result, children in the
second group had higher marks not only in English but also in other subjects than children
in the first group did [Funk and Lewis, 1942].
T. Buzan suggested playing word games to increase verbal intelligence, for example, code
crackers, crosswords, and word puzzles. Another way to increase one’s verbal intelligence
is reading books, explanatory dictionaries, or thesauruses. Buzan further emphasized the
importance of a relationship between verbal intelligence, voice, and body language. Without
the right intonation and confident gestures, even words that are relevant to a particular
situation may not be convincing for a listener. Verbal intelligence and the power of words
automatically increase if speakers use their voices and bodies to aid in the expression of
ideas and thoughts [Buzan, 2002].
J. O’Connor determined that there is a correlation between the verbal intelligence of
individuals and their professional success. He asked 100 students to complete a verbal test
and after five years analysed which of them was able to reach a higher position. The results
showed that all the students with the highest scores held executive positions [O’Connor,
1944].
In this work, we attempted to find empirical evidence that verbal intelligence may be
reflected by language and behaviour cues. We analysed whether speakers with higher verbal
intelligence levels have a wider vocabulary than individuals with lower verbal intelligence
levels do. In addition, we examined whether speakers with higher verbal intelligence levels
tend to use more adjectives and adverbs (and certain other parts of speech) when speak-
ing. Fillers, slang words, paralinguistic expressions (hm, ehm), grammatical structures, and
speech style also were considered. Furthermore, we analysed to what degree speakers with
different verbal abilities were able to maintain a conversation and suggest new topics for
the discussion. Individuals’ ability to adapt to each other when engaged in an interaction
was investigated using approaches such as the influence diffusion model, social nets, speech
style similarity, and so forth. The relationship between verbal and cognitive abilities also
was analysed. For example, we compared the monologues and the film transcript with each

20 2 Background
other, measured the similarity between them, and identified speakers with better short-term
memory.
2.3 Cognitive Abilities’ Tests and Personality
Many researchers claim that the personality of subjects normally influences the results of
any cognitive ability test, and Binet believed that the behaviour of individuals reflects
their cognitive abilities [Binet and Simon, 1905]. In his later works, Spearman attempted
to prove that intelligence is also related to factors such as persistence, uncertainty, and
will [Spearman, 1950]. Eysenck determined that persistence and uncertainty are related to
introversion, neuroticism, and some other personality traits [Eysenck, 1971]. In addition,
several researchers have investigated the dependency between intelligence and motivation,
creativity, problem-solving ability, and so forth [Kaufman et al., 2013].
Sometimes it is difficult to determine whether a subtest measures individuals’ cognitive
abilities or personality traits. For example, the Comprehension subtest in WAIS includes
questions to determine how subjects react in certain social situations. Their answers to the
question “What is the [right] thing to do if you find an envelope in the street that is sealed,
addressed, and has a new stamp on it?” may reflect how individuals view this situation (their
personal opinion) and does not provide any information about how they comprehend it. In
this case, the answers may be, “It depends how much time I have”. Wechsler himself believed
that all intelligence tests simultaneously measure the personality of individuals. In his tests,
he attempted to consider the personality factors of prospective examinees [Wechsler, 1955].
Furthermore, if a test contains tasks for measuring the creativity of individuals, the
answers may reflect the subjects’ life experiences rather than their creative thought patterns.
For example, a listener should provide the first answer that comes to mind when asked the
following question: “On the twentieth floor of a skyscraper there lived a dwarf. Methodical in
his habits, and dedicated to his work, he would rise early, get himself ready, make breakfast,
take the lift down, and go off for the day. Every evening at the same hour he would return
and relax. All so far seems perfectly normal. However, one feature of the dwarf’s day was
odd: on his way back in the lift in the evenings, he would stop at the tenth floor and walk
the remaining ten. A fair hike! Why did he not take the lift all the way to the twentieth
floor? Was there some reason?” [Agostini and De Carlo, 2012].
The most frequent answers to this question are that the dwarf wants to exercise or visit
friends who live in the same building. Less popular answers are that the dwarf is drunk and
is afraid that his wife may wake from the noise of the lift when it is approaching the 20th
floor; or that some time ago the lift stopped between the 10th and the 20th floor and now
the dwarf has a fear that this may happen again. However, the correct answer is that the
dwarf can reach only the button of the 10th floor and has to go by foot to his apartment.
When an individual is asked to answer this question, the person automatically uses his or
her own experience or a logical explanation: exercising, being afraid, or coming home drunk.
In [Sternberg and Ruzgis, 1994] it was shown that the emotional states of subjects also
influence the results of intelligence tests. For example, optimistic individuals successfully
perform verbal tests; in contrast, pessimists fare better at performance tasks than verbal
ones. Thus, it is difficult to measure a certain capability while excluding the influence of

2.4 Role of Verbal and Cognitive Abilities in Social Life 21
other personality traits on the results. Nevertheless, psychologists and researchers continue
working on the reliability and validity of capability measures.
In this work, we used an intelligence test for measuring the verbal and cognitive abilities
of speakers, as recommended by our colleagues in the department of psychology. The test,
a German version of the Hamburg Wechsler Intelligence Test for Adults [Wechsler, 1982],
provides a reliable estimation of the verbal intelligence of speakers. However, the results
of the test might be influenced by the personality of the candidates. When preparing the
study, we were aware of this phenomenon and attempted to consider it. We attentively
studied the description of the test and the rules that should be followed. When working
with subjects, we endeavoured to recognize answers that did not reflect cognitive abilities
but the personality of individuals, and we asked participants for a more detailed explanation.
The test is described in Chapter 3.
2.4 Role of Verbal and Cognitive Abilities in Social Life
Numerous studies have shown that the results of intelligence tests significantly correlate
with the academic success of children, and it was found that there is a significant difference
between the intelligence of individuals with different levels of education. Thus, educational
background may greatly influence the development of verbal abilities. In addition, educa-
tional programs and the way individuals acquire knowledge at schools and universities may
have a significant influence on their academic success.
H.J. Walberg (1984) provided an overview of investigations of the dependency between
the academic achievement of students and factors such as IQ, the frequency of watching
television, and so forth. He found that academic performance strongly depends on IQ (r =
0.7).
Furthermore, Walberg found that the intelligence levels of children correlated with the
educational background of their parents: the lower the educational levels of parents, the
smaller the intelligence coefficients of children. Conversely, he found that parents with higher
intelligence are more attentive to their children. In addition, they are better able to formulate
instructive and pedagogic strategies and to understand how to better develop the skills and
abilities of their children [Walberg, 1984]. Similarly, [Bradley et al., 1989] showed that such
parents may create a favourable atmosphere at home, which has a significant effect on the
development of their children, especially during the first three years of their life. A low
educational level of parents may negatively influence the success of their children at school
and university [Gutman et al., 2003].
When comparing the cognitive abilities of children from villages and cities, psychologists
found that children from cities have higher verbal intelligence levels; on the other hand, the
performance intelligence of children from villages is higher compared to children from cities.
Moreover, individuals with superior educational backgrounds have greater possibilities to
attain high and prestigious positions. In [Jensen, 1998], it was concluded that the correlation
between the intelligence of individuals and their wages is about 0.3-0.4.
In [Harrell and Harrell, 1945], 18,782 recruits were studied. Their levels of intelligence
were compared with their professional achievements. The results are shown in Table 2.2.

22 2 Background
Table 2.2. Professions and intelligence levels.
Profession Number of recruits Intelligence coefficient
Bookkeeper 172 128.1
Engineer 39 126.6
Chemist 21 124.8
Reporter 45 124.5
Teacher 256 122.8
Photographer 95 117.6
Radio-mechanic 267 115.3
Engine-driver 456 110.1
Electrician 289 109.0
Barman 98 102.2
Driver 194 100.8
Unskilled worker 865 95.8
Farmer 700 92.7
Miner 77 87.7
In addition, intelligent employees and employers are able to recognize more important
problems and tasks and to concentrate on them instead of less necessary tasks, and others
usually forgive the laziness or disorganization of clever students.
Similarly, Gottfredson (1997) illustrated how greater cognitive abilities help individu-
als to perform complicated tasks at work and to deal with routine situations in everyday
life. When beginning to solve a complicated problem, employees often have to acquire new
knowledge, compare it with information they have already learned, and find a practical
solution. These tasks require components of intelligence such as concentration, attention,
working memory, and a high speed of information processing [Gottfredson, 1997b]. Disci-
pline, dependability, carefulness, and emotional stability are some other factors necessary
for job success [Geary, 2005].
Furthermore, it has been shown that the intelligence level of populations is slowly in-
creasing. Psychologists have found that the average intelligence coefficient of Americans
became greater, at 13.8, from 1932 to 1978. Similarly, an American psychologist, James
Flynn (1998), demonstrated that the intelligence levels of the Dutch and Belgians also had
increased. He ascribed this phenomenon to rising levels of education in these countries.
Other scientists claimed that improved social conditions, the availability of information,
and television and computer games further influenced the increase in the intelligence of
populations [Flynn, 1998].
When recruiting candidates for participation in our study, we attempted to find indi-
viduals with different educational backgrounds, social status, and professions and people
who had completed or were completing different courses of study. The collected corpus is
too small to draw any conclusions about the verbal intelligence of the population or the
cognitive abilities of individuals of certain professions. However, collected speech samples
allowed us to determine linguistic and communication peculiarities that should be used for
the automatic classification of individuals into several verbal intelligence groups.

2.5 Linguistic Cues of High Verbal Abilities 23
2.5 Linguistic Cues of High Verbal Abilities
L. M. Turman established that the vocabulary of speakers is a perfect indicator of their
intelligence [Buzan, 2002]. Similarly, Busemann (1925) suggested that the use of certain parts
of speech by individuals may reflect their cognitive abilities and may be used as an indicator
of personality. He found that children who are very active at school and have difficulty
remaining calm during lessons have a higher verb-adjective ratio than quiet children do
[Busemann, 1925a]. Borstel (1977) determined that a high verb-adjective ratio of native
German speakers is an indicator of sociability and agreeableness [Borstel, 1977]. In addition,
Oberlander and Gill (2004) suggested that the occurrence of certain parts of speech may
reflect the personality of individuals. They found that extroverts frequently use conjunctions
and past participle verbs, while neurotics frequently use conjunctions, pronouns, adjectives,
and nouns [Oberlander and Gill, 2004].
Moreover, Doob (1958) showed that speakers with an analytical way of thinking tend to
use more nouns, pronouns, and adverbs, and Saucier (1997) suggested that adjectives are
the most useful features for denoting personality differences. In comparison to substantives
that often depend on the topic under discussion, adjectives may occur in any phrase or
sentence and may reflect the speaker’s personality variations [Doob, 1958; Saucier, 1997]. In
[Gleser et al., 1959], it was proposed that speakers with higher intelligence levels use more
adjectives, auxiliary verbs, prepositions, and articles and fewer verbs, adverbs, interjections,
and references to self.
Furthermore, it was found that the occurrence of certain words (or indicators of psycho-
logical dimensions) in spoken utterances may reveal a great deal about the psychological
state and intention of a speaker. For example, an individual tends to use more positive
emotion words in a conversation if he or she agrees with the dialogue partner [Semin and
Fiedler, 1988]. When lying, individuals use more negative emotion words and fewer first-
person pronouns [Newman et al., 2008]. Additionally, the use of personal pronouns may
provide information about a relationship between speakers [Spence et al., 1994]. For exam-
ple, dialogue partners that are close to each other use “we” with a relatively high frequency
[Simmons et al., 2008]. When an individual says “we”, the person identifies with the other
and shows a closer relationship between them. It was also found that happy couples use
the pronoun “we” more often than unhappy ones do. In contrast, the frequent use of “you”
shows a negative quality of the relationship and is often related to criticism of the other
[Simmons et al., 2005]. In [Slatcher et al., 2008] it was proposed that the frequent use of
“I” by the woman in a couple shows that both partners are satisfied with their relationship.
Moreover, it was found that the frequent use of fillers, positive emotion words, and first-
person pronouns indicate female language; male language may be indicated by the frequent
use of swearing and words indicating anger. The frequent use of prepositions and cognitive
mechanisms is an indicator of a more complex way of thinking.
When a dialogue partner wants to tell listeners about a certain experience or a situation,
the person usually begins his or her utterance by providing information about the time
and space of the event (for example, Yesterday, it was Mary’s birthday, and she invited
us to her house) [Tomasello, 2008]. By using expressions such as “you know” and “you
understand”, a speaker unconsciously attempts to focus the listener’s attention on the topic
under discussion [Schiffrin, 1987].

24 2 Background
In this work, we empirically determined language cues that reflect the verbal intelligence
of individuals and compared them with these theories. For example, we analysed the vocab-
ulary of speakers using the TF-IDF approach and compared individuals’ spoken utterances
with certain dictionaries, such as the Linguistic Inquiry and Word Count dictionary. We
calculated the usage of various parts of speech used by individuals with higher and lower
verbal intelligence levels and compared our results with the theories of Busemann, Doob,
Gleser, and other researchers mentioned in this chapter [Busemann, 1925a; Doob, 1958;
Gleser et al., 1959]. Furthermore, we investigated the flow of individuals’ conversation, com-
pared it with the verbal intelligence levels of the dialogue partners, analysed their adaptation
abilities, and so forth. In addition, we extracted some other language peculiarities that may
be relevant to our task, for example, abstract words, speech styles, and cues that reflect the
dominant behaviour of dialogue partners.
Almost all the features described in this work were extracted either manually or using
scripts specifically created for this task. Tools exist for the automatic estimation of the
complexity of texts, for example, DeLite [vor der Bruck et al., 2008]. DeLite is a readability
checker that analyses German texts at the morphological, lexical, syntactic, semantic, and
discourse levels and extracts 48 corresponding indicators. It calculates the readability score
as a weighted sum of these 48 indicators. However, DeLite (and other tools that estimate
the complexity of texts) are created for working with syntactically correct texts. When
analysing spoken language, it is often difficult to determine the ends of sentences. Manual
labeling of such texts may influence the results of further investigations.
Similarly, Coh-Metrix is a tool that estimates the cohesion of texts by measuring the
word frequency, ambiguity, density of certain word classes, and distance between sentences;
it uses linguistic approaches such as LSA (latent semantic analysis) and readability formulas.
This tool works with English texts and is not available for public use because of copyright
restrictions [Graesser et al., 2004].
The goal of this work was to find features that may be automatically extracted from
spoken utterances without any manual editing. These cues may then be implemented into
an SDS.

3
Verbal Intelligence Corpus
For the analysis of speakers’ verbal intelligence, we collected a speech data corpus. All the
participants were native German speakers of different genders, ages, educational levels and
social status. The corpus contains 100 monologues, 56 dialogues and 100 verbal intelligence
scores of the participants. The corpus is described in the following sections.
3.1 Pilot Study
To determine the language peculiarities of individuals with different verbal intelligence levels,
we should analyse their speech samples and compare them to an objective estimation of
their language abilities. Speech samples should consist of phrases and sentences that these
individuals use every day, for example when communicating with their relatives and friends,
during telephone calls, small talk, etc. At the same time, speech samples should be about the
same topic and not contain domain specific terms. To our knowledge, no corpora satisfying
these requirements exist. That is why we decided to invite native German speakers to take
part in our study, to record their speech and to measure their levels of verbal intelligence.
However, first we decided to conduct a pilot study, the purpose of which was to determine
the best strategy for collecting the verbal intelligence corpus. Fifteen students and PhD
candidates of the University of Ulm, Germany, were invited to take part in it. All of them
were native German speakers from 20 to 30 years old. We established the following goals of
the pilot study:
• To determine the topic and genre of speech samples;
• To find an appropriate way to estimate the verbal intelligence of participants;
• To develop questionnaires for the interview;
• To analyse the difficulties that may occur during our study.
3.1.1 Topic and Genre of Speech Samples
As discussed above, if we want to compare the linguistic characteristics of individuals with
different verbal abilities, their spoken utterances should be about the same topic. We all
have different interests: one could be an expert in technology, another could prefer art and
the third one could be fond of cooking. If individuals discuss their favorite topics, they may
use very specific vocabulary compared to other people who are not interested in that area.
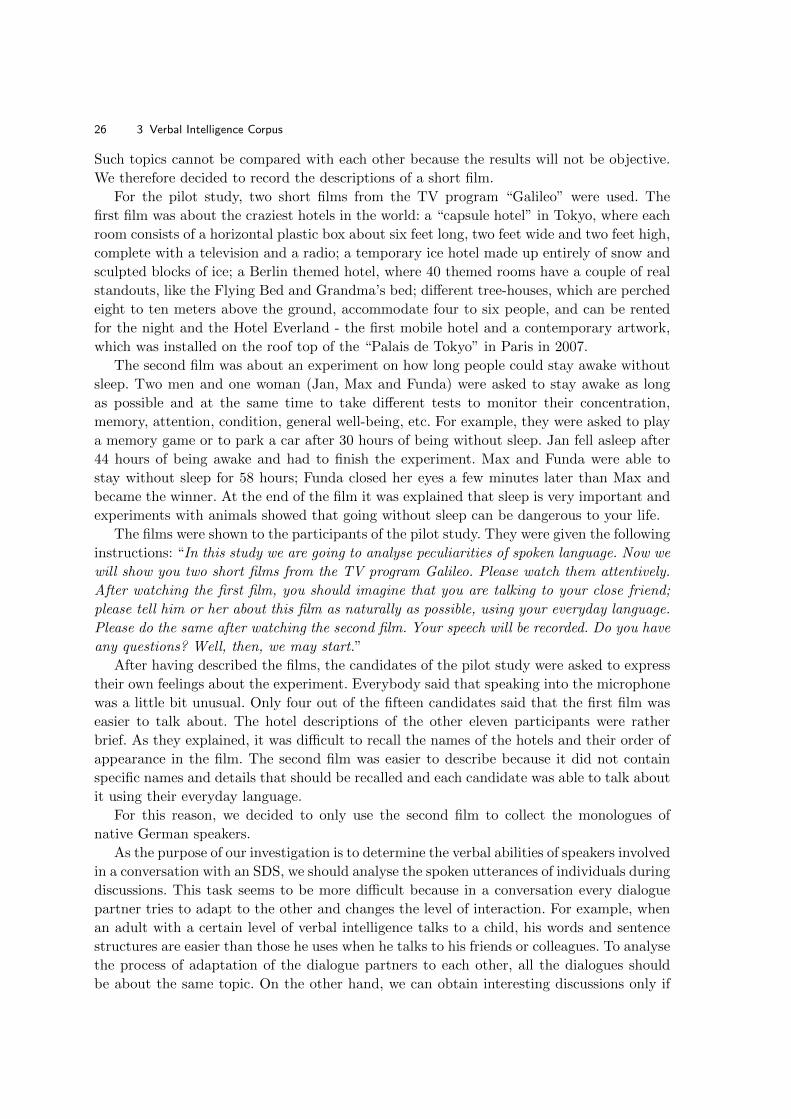
26 3 Verbal Intelligence Corpus
Such topics cannot be compared with each other because the results will not be objective.
We therefore decided to record the descriptions of a short film.
For the pilot study, two short films from the TV program “Galileo” were used. The
first film was about the craziest hotels in the world: a “capsule hotel” in Tokyo, where each
room consists of a horizontal plastic box about six feet long, two feet wide and two feet high,
complete with a television and a radio; a temporary ice hotel made up entirely of snow and
sculpted blocks of ice; a Berlin themed hotel, where 40 themed rooms have a couple of real
standouts, like the Flying Bed and Grandma’s bed; different tree-houses, which are perched
eight to ten meters above the ground, accommodate four to six people, and can be rented
for the night and the Hotel Everland - the first mobile hotel and a contemporary artwork,
which was installed on the roof top of the “Palais de Tokyo” in Paris in 2007.
The second film was about an experiment on how long people could stay awake without
sleep. Two men and one woman (Jan, Max and Funda) were asked to stay awake as long
as possible and at the same time to take different tests to monitor their concentration,
memory, attention, condition, general well-being, etc. For example, they were asked to play
a memory game or to park a car after 30 hours of being without sleep. Jan fell asleep after
44 hours of being awake and had to finish the experiment. Max and Funda were able to
stay without sleep for 58 hours; Funda closed her eyes a few minutes later than Max and
became the winner. At the end of the film it was explained that sleep is very important and
experiments with animals showed that going without sleep can be dangerous to your life.
The films were shown to the participants of the pilot study. They were given the following
instructions: “In this study we are going to analyse peculiarities of spoken language. Now we
will show you two short films from the TV program Galileo. Please watch them attentively.
After watching the first film, you should imagine that you are talking to your close friend;
please tell him or her about this film as naturally as possible, using your everyday language.
Please do the same after watching the second film. Your speech will be recorded. Do you have
any questions? Well, then, we may start.”
After having described the films, the candidates of the pilot study were asked to express
their own feelings about the experiment. Everybody said that speaking into the microphone
was a little bit unusual. Only four out of the fifteen candidates said that the first film was
easier to talk about. The hotel descriptions of the other eleven participants were rather
brief. As they explained, it was difficult to recall the names of the hotels and their order of
appearance in the film. The second film was easier to describe because it did not contain
specific names and details that should be recalled and each candidate was able to talk about
it using their everyday language.
For this reason, we decided to only use the second film to collect the monologues of
native German speakers.
As the purpose of our investigation is to determine the verbal abilities of speakers involved
in a conversation with an SDS, we should analyse the spoken utterances of individuals during
discussions. This task seems to be more difficult because in a conversation every dialogue
partner tries to adapt to the other and changes the level of interaction. For example, when
an adult with a certain level of verbal intelligence talks to a child, his words and sentence
structures are easier than those he uses when he talks to his friends or colleagues. To analyse
the process of adaptation of the dialogue partners to each other, all the dialogues should
be about the same topic. On the other hand, we can obtain interesting discussions only if
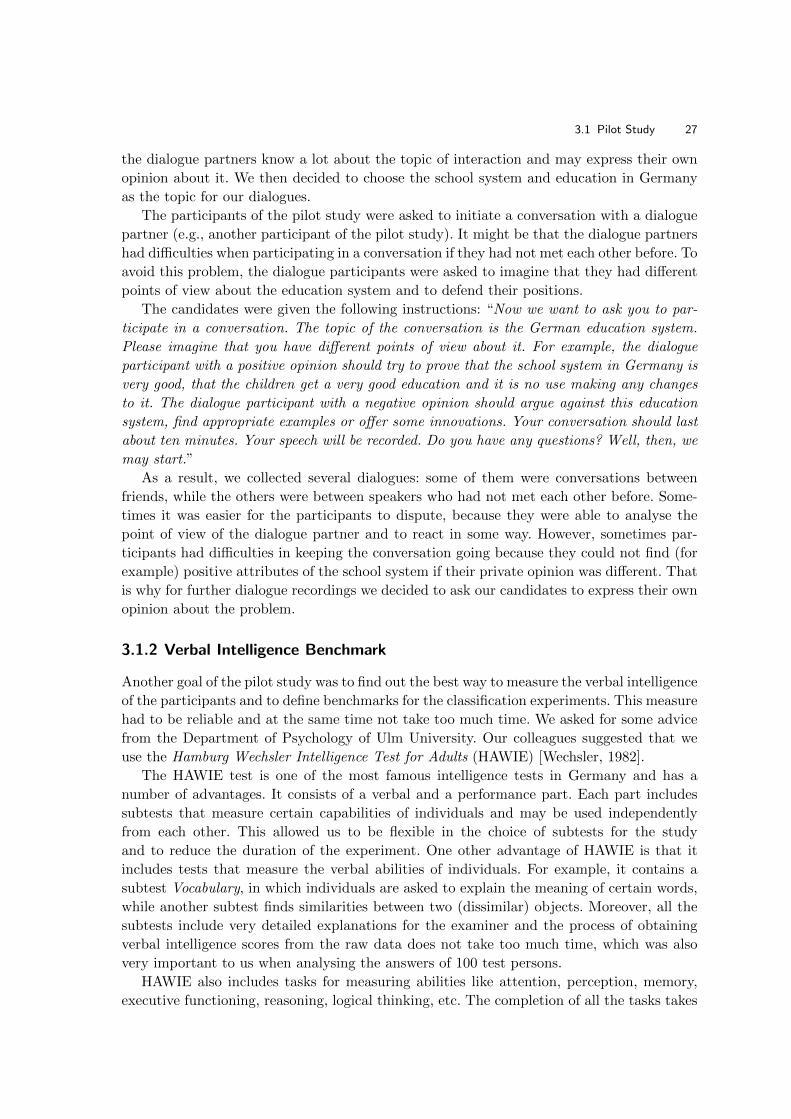
3.1 Pilot Study 27
the dialogue partners know a lot about the topic of interaction and may express their own
opinion about it. We then decided to choose the school system and education in Germany
as the topic for our dialogues.
The participants of the pilot study were asked to initiate a conversation with a dialogue
partner (e.g., another participant of the pilot study). It might be that the dialogue partners
had difficulties when participating in a conversation if they had not met each other before. To
avoid this problem, the dialogue participants were asked to imagine that they had different
points of view about the education system and to defend their positions.
The candidates were given the following instructions: “Now we want to ask you to par-
ticipate in a conversation. The topic of the conversation is the German education system.
Please imagine that you have different points of view about it. For example, the dialogue
participant with a positive opinion should try to prove that the school system in Germany is
very good, that the children get a very good education and it is no use making any changes
to it. The dialogue participant with a negative opinion should argue against this education
system, find appropriate examples or offer some innovations. Your conversation should last
about ten minutes. Your speech will be recorded. Do you have any questions? Well, then, we
may start.”
As a result, we collected several dialogues: some of them were conversations between
friends, while the others were between speakers who had not met each other before. Some-
times it was easier for the participants to dispute, because they were able to analyse the
point of view of the dialogue partner and to react in some way. However, sometimes par-
ticipants had difficulties in keeping the conversation going because they could not find (for
example) positive attributes of the school system if their private opinion was different. That
is why for further dialogue recordings we decided to ask our candidates to express their own
opinion about the problem.
3.1.2 Verbal Intelligence Benchmark
Another goal of the pilot study was to find out the best way to measure the verbal intelligence
of the participants and to define benchmarks for the classification experiments. This measure
had to be reliable and at the same time not take too much time. We asked for some advice
from the Department of Psychology of Ulm University. Our colleagues suggested that we
use the Hamburg Wechsler Intelligence Test for Adults (HAWIE) [Wechsler, 1982].
The HAWIE test is one of the most famous intelligence tests in Germany and has a
number of advantages. It consists of a verbal and a performance part. Each part includes
subtests that measure certain capabilities of individuals and may be used independently
from each other. This allowed us to be flexible in the choice of subtests for the study
and to reduce the duration of the experiment. One other advantage of HAWIE is that it
includes tests that measure the verbal abilities of individuals. For example, it contains a
subtest Vocabulary, in which individuals are asked to explain the meaning of certain words,
while another subtest finds similarities between two (dissimilar) objects. Moreover, all the
subtests include very detailed explanations for the examiner and the process of obtaining
verbal intelligence scores from the raw data does not take too much time, which was also
very important to us when analysing the answers of 100 test persons.
HAWIE also includes tasks for measuring abilities like attention, perception, memory,
executive functioning, reasoning, logical thinking, etc. The completion of all the tasks takes

28 3 Verbal Intelligence Corpus
about one hour. In our study we decided to use only the verbal part of the test. This allowed
us to reduce the time to 25-30 minutes.
The description of the test includes instructions that should be followed by the examiner
to encourage the test persons during the test and to obtain reliable results. For example, it
describes what the examiner should say when preparing a test person for the next task or
how he should react when a test person does not know the correct answer. The verbal part
of the test and our reaction in different situations are described in the following.
The verbal part consists of the following subtests:
Information: this subtest measures general knowledge and includes 25 questions about
history, geography, etc., for example:
• What is a thermometer? (Right answer: A device for measuring temperature.)
• What is the capital of Japan? (Right answer: Tokio.)
• Who wrote Faust? (Right answer: Goethe.)
At the beginning, we started the subtest with a simple question (e.g., Who is the pres-
ident of Germany?) in order to prepare the test persons for further tasks. The questions
are organized in such a way that the examiner should not have difficulties in determining
whether the answer is right or wrong. However, in uncertain situations we asked the test
persons to give a more detailed answer. If a test person gave five wrong answers one after
another, we finished the subtest. For each right answer the test persons obtained one point;
the maximum score of the subtest is 25.
Comprehension: test persons are asked to solve different practical problems and explain
some social situations. The subtest consists of ten questions. Test persons may obtain zero,
one or two points for each answer, for example:
• What is the thing to do if you find an envelope in the street that is sealed, addressed and
has a new stamp?
– 2-point answer: to throw it in the post box;
– 1-point answer: to bring it to the post office; if it is not too far, to bring it to the
sender;
– 0-point answer: nothing; to take it with me; to open.
• Why should you keep away from bad company?
– 2-point answer: we will be influenced by such people;
– 1-point answer: because we will have many difficulties;
– 0-point answer: there is nothing good in it; we may not profit from them.
HAWIE gives a detailed description of the criteria for evaluating the answers. Depending
on the quality of their answers, test persons may obtain up to 20 points for the subtest.
Digit Span: test persons are asked to repeat increasingly longer strings of numbers
forward and then backward; the subtest measures short-term memory and attention. It
shows whether individuals can concentrate on a certain thing and ignore other irrelevant
information.
The first part of the subtest, string of numbers forward, begins with three numbers. Each
new string is one number longer than the previous one, for example:
(3) 5 9 3

3.1 Pilot Study 29
(4) 2 9 6 4
(5) 9 2 1 8 6
(6) 8 3 6 9 1 4
(7) 8 6 3 9 2 7 5
(8) 2 6 8 7 4 1 5 9
(9) 7 3 9 4 1 8 2 5 6
If a test person cannot repeat a certain string, the examiner asks him or her to try with
another string of digits of the same length. If the test person fails, the examiner continues
with the second part of the subtest.
The second part, string of numbers backward, begins with two numbers, for example:
(2) 1 7
(3) 3 9 8
(4) 8 5 2 9
(5) 7 6 1 8 2
(6) 5 2 9 6 1 3
(7) 7 4 8 1 2 9 6
(8) 2 8 6 1 9 3 7 4
Adding the maximum number of digits repeated forward to the maximum number of
digits repeated backward gives the score of this subtest. For example, if a test person is able
to repeat the strings “2 6 8 7 4 1 5 9” from the first part and “5 2 9 6 1 3” from the second
part, his or her score equals to 14.
Arithmetic: test persons are asked to solve some arithmetic problems given in a story-
telling way; the subtest measures their concentration and computational ability. The test
consists of ten tasks that should be solved in the head (without using a pen and a piece of
paper). For each right answer the test person gets one point. If a mathematical problem is
solved faster than 40 seconds, the test person gets one additional point; if it is solved faster
than 15 seconds, the test person gets two additional points. If a test person needs more than
two minutes to solve a certain problem, his or her answer is not taken into account. Several
examples from this subtest are given in the following:
• How many rolls can you buy if you have 36 cents and one roll costs 4 cents? (Answer: 9
rolls.)
• How many hours do you need for 24 km if you are walking at 3 km per hour. (Answer:
8 hours.)
• 7 envelopes cost 25 cent. How many envelopes can you get if you have 1 Euro? (Answer:
28 envelopes.)
Similarities: test persons are asked to find a similarity between a pair of words. For
example, Please find a similarity between “wood” and “alcohol”? Depending on the quality of
the answer, test persons may obtain zero, one or two points. When deciding on the obtained
points, the answers should be compared with special criteria described in the test.
Some examples of possible answers are given in the following:
• Please find a similarity between “apple” and “banana”?
– 2-point answer: fruit;

30 3 Verbal Intelligence Corpus
– 1-point answer: they have a peel; you can eat them; they have vitamins;
– 0-point answer: they have the same colour; they come from the same region; they are
sweet.
• Please find a similarity between “fly” and “tree”?
– 2-point answer: live creatures; they are alive;
– 1-point answer: belong to nature; they both are growing; they need the sun and air;
– 0-point answer: they have cells; they flourish in summer.
Vocabulary: test persons were asked to explain increasingly more difficult words using
their vocabulary. For example, What does “to creep” mean? The answers to these questions
should also be compared with special criteria from the test description. In this subtest, it
is important that test persons may explain the meaning of the words. Precision expressions
and witty utterances should not be taken into account. Each answer may be estimated using
the 3-point scale (zero, one, and two points):
• What is an apple?
– 2-point answer: fruit;
– 1-point answer: something for eating;
– 0-point answer: its red, round.
• What is a chance?
– 2-point answer: opportunity;
– 1-point answer: if you have luck, success;
– 0-point answer: if you have a good game.
• What is an anonym?
– 2-point answer: unknown, secret;
– 1-point answer: a letter without a name;
– 0-point answer: obliged not to divulge something.
Calculating the verbal intelligence score.
As described above, for each answer a test person may obtain from zero to three points
(depending on the question asked and the quality of the answer given). The addition of all
the points gives us the raw score (Figure 3.1).
The raw scores should then be converted into scaled scores using special tables from the
test. The scaled scores vary between 0 and 16 and may be used to compare the performance
of the participants. The sum of the scaled scores and the age of the test person are used to
estimate his or her verbal intelligence score.
3.1.3 Questionnaires for the Interview
When developing the questions for the interview, we wanted to obtain information about
the educational background of the test persons, their own estimation of the complexity of
the test, their general well-being when answering the questions and their feedback about
the experiment. The interview protocols created for the study are shown in Figure 3.2 and
Figure 3.3.

3.2 Corpus Collection 31
Information
Comprehension
Digit Span
Arithmetic
Similarities
Vocabulary
Verbal Subtests
Test
Person j
Verbal
IQ
Raw Scores621 ,...,, jjj yyy
Scaled Scores
Scoring 1
Scoring 2
Sum of Scaled Scores
621 ,...,, jjj xxx
Age
621 ... jjj xxx
Fig. 3.1. Verbal Part of the Hamburg Wechsler Intelligence Test for Adults.
The first part of the questionnaire was prepared to obtain information that may be
further compared with the verbal intelligence scores of the test persons (Figure 3.2). In this
questionnaire individuals were asked about their age, gender, their highest level of education
and profession. They were also asked to estimate the difficulty of the study (describing the
film and discussing a certain topic) and the difficulty of the questions in the test.
The second part of the questionnaire (Figure 3.3) was created to analyse how the test
persons feel during the test. At the end they were asked to say what they would do to
make the experiment better. Their answers were analysed to further make the study more
interesting and less stressful for new candidates. The analysis is described in the following
section.
3.2 Corpus Collection
After the pilot study we analysed all the difficulties that we encountered and decided to
make the following changes to optimize the experiment flow and to increase the motivation
of the test persons.
3.2.1 Organization of the Experiment
To make the experiment less stressful for the test persons, we asked them if their relatives or
friends may join them and also take part in the study. In this case the test persons already
had dialogue partners and were more relaxed during the conversation than those who were
engaged in a discussion with a stranger. Then the study was organized in the following
way. Two examiners were needed to work with the test persons. At the beginning, the
first examiner explained the purpose and the tasks of the study and suggested to start the
experiment by recording the dialogue. After finishing the conversation, the second examiner
invited one of the test persons to follow him to another room. From this moment, the
examiners could work simultaneously with the test persons and ask them to describe the

32 3 Verbal Intelligence Corpus
film and to answer questions in the verbal intelligence test. Then both test persons finished
the experiment at approximately the same time.
If a test person wanted to come alone, we tried to make the next appointment (with
another test person) approximately one hour later so that the former and the latter were
able to meet each other and participate in a conversation. In this case, just one examiner
was able to organize the entire session. The examiner started the experiment with the first
test person by asking him or her to describe the film and to answer the questions in the
test. When the second test person arrived, the examiner suggested to both candidates to
record the dialogue and then continued working with the second candidate.
In all the experiments, we obtained permissions from the candidates to use the data for
our investigation (Figure A.1).
3.2.2 Search for New Candidates
As stated above, 15 students and PhD students of the University of Ulm took part in the
pilot study. As the goal of the experiment was to find native German speakers of different
ages and educational levels, we had to look for new candidates outside of the University. For
this purpose, we used our social connections, distributed flyers at schools and advertised
the experiment in a newspaper. Asking test persons about bringing somebody with them
as a dialogue partner was another way to obtain new candidates for the experiment. We
discovered that putting an advertisement in a newspaper and asking candidates about their
relatives and friends were the most productive and helpful ways to recruit new speakers for
the corpus. All the test persons received ten euros for their participation in the study.
3.2.3 Analysis of Feedback
During the study, we continued the analysis of the difficulties and created measures to
improve the situation. As shown in Figure 3.3, we asked our test persons to suggest some
improvements for the experiment if they had any. Their feedback was continuously analysed
to understand whether some changes to the experiment flow were needed or not. It should
be noted that about 40% of the candidates used the opportunity to express their opinion
about the experiment and answered this question.
25% of the candidates suggested making changes to the verbal intelligence test and to
some of its questions, for example:
• In the test “Digit Span” the strings should be repeated twice.
• Right answers should also be said.
• Questions should be simpler.
• You should prepare more actual questions.
Their suggestions could not be taken into account because our goal was to follow the rules
of the test as much as possible and we were not able to change any of the instructions in it.
10% of the candidates would like to get more positive feedback from us during the test.
Their suggestions were:
• To praise me more frequently.
• To offer me a piece of cake.

3.2 Corpus Collection 33
Several candidates told us that they would like to listen to a more detailed description
of the tasks at the beginning of the experiment. This suggestion was taken into account
and we tried to give our next candidates as much information as possible about this study
before obtaining their permission to participate.
Other participants said that the study was prepared well and they did not have any
suggestions about how it may be improved. Some of their answers are presented in the
following:
• Nothing, it is always like that with me.
• Nothing, a test has always a test character.
• I have nothing to suggest. It was performed very well.
3.2.4 Resulting Verbal Intelligence Corpus
The resulting corpus included 100 monologues, 56 dialogues and information about the
verbal intelligence of the test persons.
Out of these 100 participants, 52 were female and 48 male. The average age of the partic-
ipants was 32.1: the youngest test person was 16 years old, while the oldest one was 72 years
old. The participants had different educational backgrounds: 15% of the candidates were still
attending school; 39% were graduates of secondary school and were either students at univer-
sities or colleges or employees in different companies; 10% of the test persons had graduated
from college (Fachhochschulen) and 36% from university. All of them had a completely dif-
ferent course of studies, for example Finance, Biology, Mathematics, Psychology, Medicine,
Electrical Engineering, Informatics, Mechanical Engineering, Communications Engineering,
etc.
All monologues and dialogues were transcribed using the Transcription Standards by
Mergenthaler [Mergenthaler, 1993]. According to these rules, punctuation marks in tran-
scripts are used to show rhythmical and syntactical speech interruptions, for example:
• “?” is used for interrogative word intonation and for rising tone.
• “.” is used to mark the completed thought and falling tone.
• “,” is used to mark a short pause in the speech, but with a continuation of the main
idea.
• “;” is used to mark an interrupted thought. For instance “no no. or yes? you say; under-
stand,”.
Nonverbal and paralinguistic aspects of the speech and repeated words were also marked.
Transcription Standards by Mergenthaler are frequently used to create transcriptions in
psychological investigations. Let us explain why these rules were chosen for our work. In the
following sections, we present a number of features that were extracted from the monologues
and dialogues in order to determine the language peculiarities of speakers with different
verbal intelligence. To extract these features, we prepared scripts that did not depend on the
type of transcript. However, to extract features like abstract words for the linguistic analysis
of text files or to determine emotion-abstraction patterns to investigate the conversational
behaviour of dialogue participants we used the software tool CM [Mergenthaler, 1998a]. This
tool is able to work with transcripts that are prepared according to the rules of Mergenthaler.
Since CM was the only software tool for the analysis of text files that we did not create

34 3 Verbal Intelligence Corpus
ourselves, we decided to transcribe the monologues and dialogues using Mergenthaler’s rules,
so as to be able to use CM for the analysis and to avoid the additional adaptation of text
files in case of using other transcription rules.
The analysis of the questionnaires provided several interesting results. The candidates did
not find it difficult to give descriptions of the film (the average value of their estimations was
3.69). Moreover, it was even easier for them to be engaged in a conversation (average value
was 4.23). Independent of verbal intelligence levels, the test persons found it rather difficult
to answer the questions in the test (3.44 for higher verbal intelligence speakers and 3.36 for
lower verbal intelligence speakers). It is interesting that higher verbal intelligence speakers
tried harder to answer the questions of HAWIE (3.61) than lower verbal intelligence speakers
(3.15). On the other hand, the latter ones were more afraid of embarrassing themselves
(1.69) than the former ones (1.46). All the candidates did not express any negative feelings
in the questionnaire. Moreover, most of them were delighted and made jokes during the
experiment.
Figures 3.4, 3.5, 3.6, and 3.7 show excerpts from the film and from monologues of speakers
with different verbal intelligence1.
Each monologue is about three minutes long and contains 403.34 words on an average.
Details of the recorded monologues are listed in Table 3.1.
Table 3.1. Statistical details of the monologues and dialogues.
Monologues Dialogues
Number of files 100 monologues 56 dialoguesDuration in total 6 hours 10.79 hoursNumber of turns in total - 7,248 turnsAverage number of turns - 64.14 turnsAverage turn length - 23.67 wordsNumber of words in total 40,334 words 11,3649 wordsAverage number of words per text file 403.34 words 1,005.74 wordsVocabulary size in total 2,185 words 4,632 words
The topic of the dialogues was the German education system. The participants were
asked to discuss its problems, to compare it to the European education system, to talk
about the advantages and disadvantages of the school system and the quality of higher
education in universities, etc. They were asked to feel as relaxed as possible as if they were
talking to their relatives or friends. Some test persons were asked to engage in several two-
person conversations with different dialogue partners. The others participated in a dialogue
only once.
An excerpt from one of the dialogues is shown in Figure 3.8.
The collected monologues and dialogues were used for the analysis of the linguistic and
communicative behaviour of speakers with different verbal intelligence. For this purpose,
certain approaches were applied to the speech samples from the corpus. These approaches
are presented in Chapter 4.
1 As the conversation language is German, the example was directly translated into English.
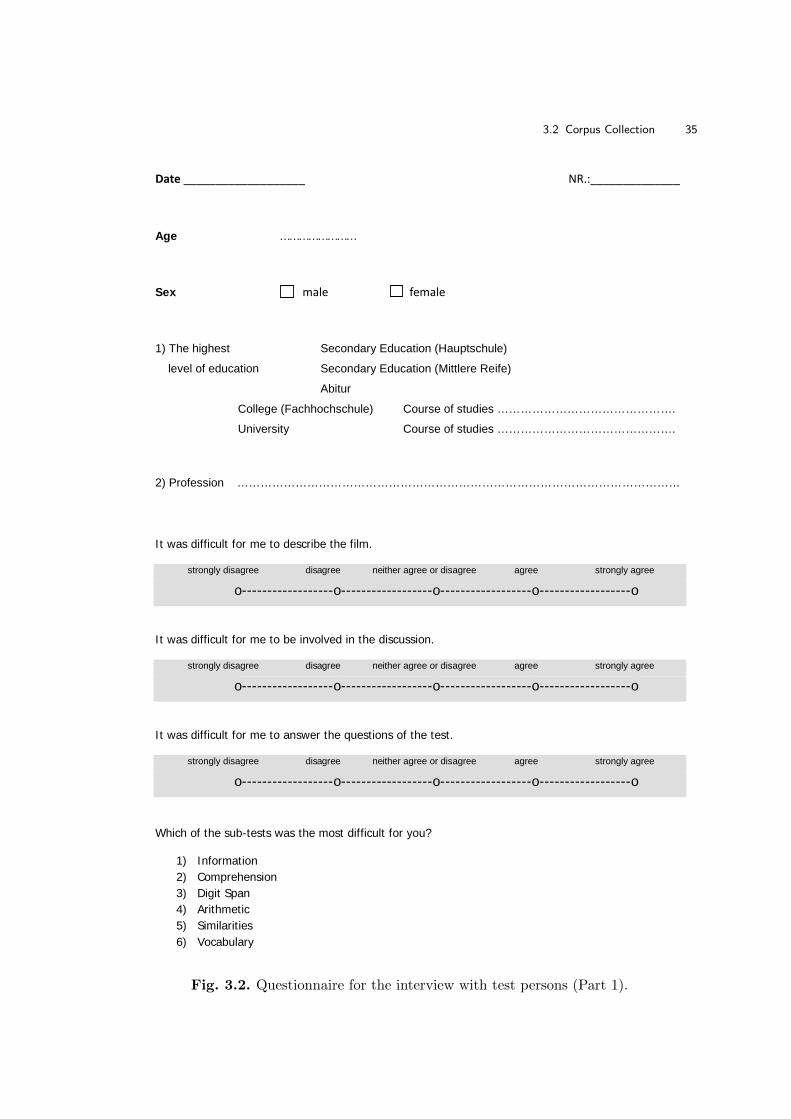
3.2 Corpus Collection 35
Date ___________________ NR.:______________
Age ……………………
Sex male female
1) The highest Secondary Education (Hauptschule)
level of education Secondary Education (Mittlere Reife)
Abitur
College (Fachhochschule) Course of studies ……………………………………….
University Course of studies ……………………………………….
2) Profession ……………………………………………………………………………………………………
It was difficult for me to describe the film.
strongly disagree disagree neither agree or disagree agree strongly agree
o------------------o------------------o------------------o------------------o
It was difficult for me to be involved in the discussion.
strongly disagree disagree neither agree or disagree agree strongly agree
o------------------o------------------o------------------o------------------o
It was difficult for me to answer the questions of the test.
strongly disagree disagree neither agree or disagree agree strongly agree
o------------------o------------------o------------------o------------------o
Which of the sub-tests was the most difficult for you?
1) Information 2) Comprehension 3) Digit Span 4) Arithmetic 5) Similarities 6) Vocabulary
Fig. 3.2. Questionnaire for the interview with test persons (Part 1).

36 3 Verbal Intelligence Corpus
How did you feel? Please complete the survey by circling the value that best reflects your opinion. If
you are not sure, mark the “5”. Don’t think too much over each question and try to answer
spontaneously.
Strongly Strongly disagree agree
embarrassed, afraid to seem ridiculous
anxious, fearful
cheerful, joyful, delighted
angry, mad, furious
relaxed, easy, quiet, balanced
Strongly Strongly disagree agree
nervous, restless
without energy, tired, sluggish
aktiv, full of energy, fresh
confused, baffled, mazed
attentive, with a clear mind, awake
unpleasant, negative
pleasant, positive
bored, without any interest
curious, motivated, interested
Did you try hardest to answer the questions?
No Yes, a little bit Yes, a bit Yes, very Yes, very much 1 2 3 4 5
Were you afraid of embarrassing yourself? 1 2 3 4 5
- If yes: what would you do for making the experiment better so that other test persons do not have such a feeling?
..............................................................................................................
..............................................................................................................
0 1 3 4 5 6 7 8 92 1 00 1 3 4 5 6 7 8 92 1 0
0 1 3 4 5 6 7 8 92 1 00 1 3 4 5 6 7 8 92 1 0
0 1 3 4 5 6 7 8 92 1 00 1 3 4 5 6 7 8 92 1 0
0 1 3 4 5 6 7 8 92 1 00 1 3 4 5 6 7 8 92 1 0
5 4 2 1 0 1 2 3 43 55 4 2 1 0 1 2 3 43 55 4 2 1 0 1 2 3 43 5
5 4 2 1 0 1 2 3 43 55 4 2 1 0 1 2 3 43 55 4 2 1 0 1 2 3 43 5
5 4 2 1 0 1 2 3 43 55 4 2 1 0 1 2 3 43 55 4 2 1 0 1 2 3 43 5
5 4 2 1 0 1 2 3 43 55 4 2 1 0 1 2 3 43 55 4 2 1 0 1 2 3 43 5
5 4 2 1 0 1 2 3 43 55 4 2 1 0 1 2 3 43 55 4 2 1 0 1 2 3 43 5
Fig. 3.3. Questionnaire for the interview with test persons (Part 2).

3.2 Corpus Collection 37
One hour later the first candidate is going to finish the experiment. It is a quarter to fivein the morning. Jan closed his eyes. The rules are strong: if he does not open his eyes after30 seconds, he has to quit. After 44 hours the experiment is finished for Jan. Funda andMax are allowed to awake him.
Funda and Max are now alone and are without sleep for 52 hours. Now every means areused not to fall asleep. 54 hours without sleep. Funda and Max must park a car. Twonights without sleep have the same influence as ten glasses of wine - extremely dangerousin traffic. Even if they can mobilise their strength to perform this test.
Max and Funda have been without sleep for fifty eight hours. They have laid down on thesofa. Is it a mistake? Actually they would like to keep moving. But now they cannot anymore. The blood pressure is down, the energy reserves are over. They both are freezing despitethe fire-place and the jackets. The question is who closes the eyes first. It is Max. Fundawins. She stays awake a few minutes longer. But without the support from Max she fallsasleep too, after 58 hours. Next day Funda and Max slept for ten hours.
Fig. 3.4. Excerpts from the film.
Okay, so it was an experiment on how long one can stay awake without sleep. And therewere three candidates, who had to try to stay awake as long as possible... And they werenot practically allowed to close their eyes for longer than 30 seconds. And in between theyalso had to repeatedly make tests to check how fit they- they are... and if they were able tobe concentrated. One has already noti- noticed... one had already noticed that after the firstnight, which was already difficult, everything was still good. And during the second night itwas getting heavier and heavier. And one candidate fell asleep, I think, after 40 hours. Andthe others could not stay awake any longer after 58 hours and then fell asleep and... It wasalso noticed, before they had to play a memory game and had to stop it because they werenot able to concentrate any longer. Afterwards they told they were so happy that they werefinally able to sleep again. And then also... two of them slept for ten hours and said that:yes, they were quite happy that it was finally over, that they were finally able to sleep again.
Fig. 3.5. Excerpts from the monologue of a test person with a higher verbal intelligencelevel.
So I found the second Galileo report actually not as exciting as the first- as the first one.Hm, it was about that it was tested on three candidates... uh how long... uh, they can stayawake without sleep. They were a DJ, a Galileo reporter and a woman. And uh, the Galileoreporter already quit after 42 hours and... Uh uh, uh the woman won, she fell asleep shortlyafter the second man. And eh and it was also about determining the concentration andcondition through various activities, precisely through um, sports or something else... orthrough playing memory or driving a car. And um, so is there anything else to say? Yeah,well, that is, the- the maximum duration was 58 hours, for which the woman and the manstayed awake uh almost simultaneously. It was also very cold for them and um, yes, thatwas actually the whole point of, investigation.
Fig. 3.6. Excerpts from the monologue of a test person with an average verbal intelligencelevel.

38 3 Verbal Intelligence Corpus
After 44 hours Jan had to quit because he was too tired. This means that there were onlytwo candidates left. Funda and Max. For the following game... hm for the following testthey were 54 hours without sleep. This was a parking test with a car. Also this was veryexhausting. All four... hm all three participants had problems.
Afterwards they both were lying near the fireplace, ahm wrapped up in warm clothes,ahm jackets. Although it was relatively warm there inside, I think more than 20 degrees, 23degrees. They were freezing. After about 58 hours Max fell asleep. And then Funda fell asleep.
Fig. 3.7. Excerpts from the monologue of a test person with a lower verbal intelligencelevel.
P1/ I think that teachers work very hard. They have their lessons, but they have to preparesomething for them. And after the lessons they have to check everything. It takes a lot oftime. I think, they are paid for these hours.P2/ Hmm.P1/ So, the children have to go home and to learn their lessons with their parents.P2/ Yes, it is very often.P1/ But, it doesn’t work!P2/ Yes, it is not possible.P1/ Because their parents are at work!P2/ Yes.P1/ Because they have to earn a living, their children need money.P2/ Yes, the parents are very busy.P1/ Do you have children?P2/ Yes, I have a son. When he went to school I saw that he wasn’t very busy, he didn’thave much homework.P1/ They have to do a lot of homework! It is better than playing computer games. And thelessons have to be more interesting.P2/ And they have to learn for themselves.P1/ Yes, you are right.
Fig. 3.8. Excerpt from one of the recorded dialogues.
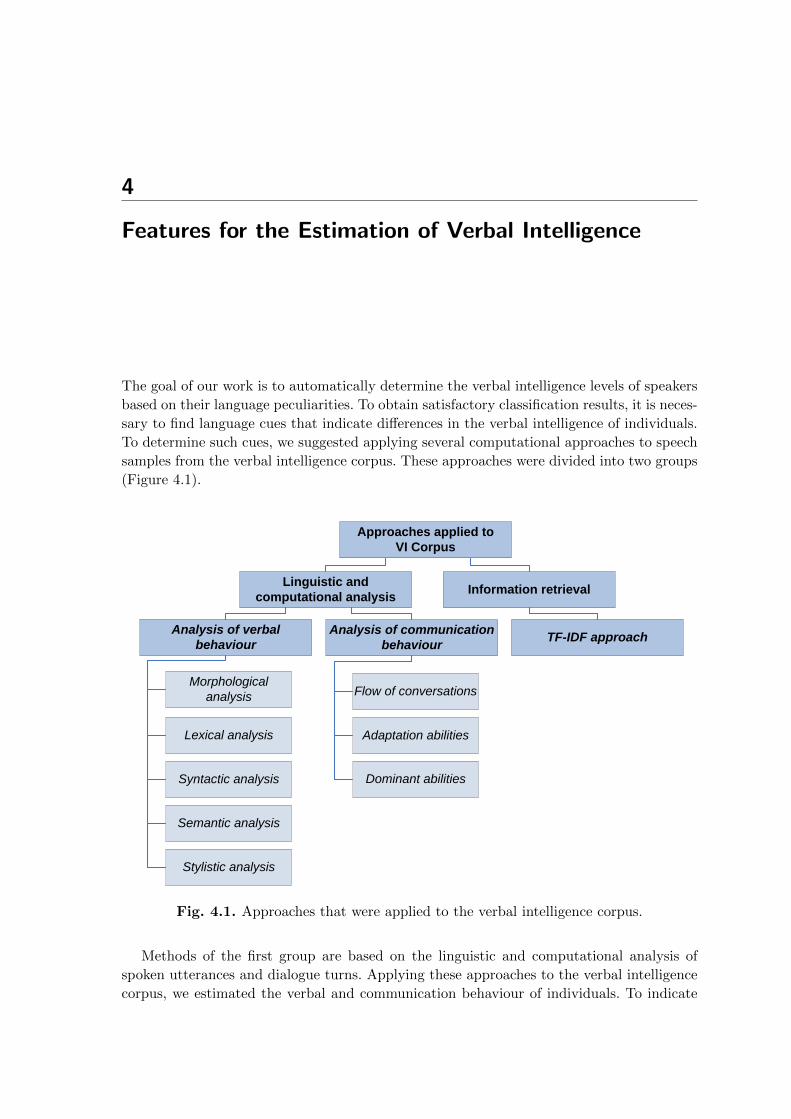
4
Features for the Estimation of Verbal Intelligence
The goal of our work is to automatically determine the verbal intelligence levels of speakers
based on their language peculiarities. To obtain satisfactory classification results, it is neces-
sary to find language cues that indicate differences in the verbal intelligence of individuals.
To determine such cues, we suggested applying several computational approaches to speech
samples from the verbal intelligence corpus. These approaches were divided into two groups
(Figure 4.1).
Approaches applied to
VI Corpus
Linguistic and
computational analysisInformation retrieval
Analysis of verbal
behaviour
Analysis of communication
behaviourTF-IDF approach
Morphological
analysis
Lexical analysis
Syntactic analysis
Semantic analysis
Stylistic analysis
Flow of conversations
Adaptation abilities
Dominant abilities
Fig. 4.1. Approaches that were applied to the verbal intelligence corpus.
Methods of the first group are based on the linguistic and computational analysis of
spoken utterances and dialogue turns. Applying these approaches to the verbal intelligence
corpus, we estimated the verbal and communication behaviour of individuals. To indicate

40 4 Features for the Estimation of Verbal Intelligence
the verbal behaviour of the speakers, we analysed their speech at the morphological, lexical,
syntactic, semantic, and stylistic levels. For the analysis, dialogues and monologues from the
corpus were used (with the exception of one approach called Lexical entrainment, which was
applied only to the monologues). To investigate the communicative behaviour of individuals,
we analysed the flow of their conversations, and their ability to adapt to each other and to
dominate when engaged in a discussion. For this type of analysis, only dialogues between
test persons were taken into account.
The second group consists of information retrieval (IR) approaches. For these methods,
each text file should be represented as a feature vector that further may be used for the
classification task. To obtain such a representation of the text files, we used the TF-IDF
weighting scheme. This method also was applied to the monologues and dialogues of speakers
with different verbal intelligence.
The main difference between these two categories is the representation of extracted fea-
tures. Each cue from the first group is a certain indicator of the verbal or communication
behaviour of individuals: for example, the number of turns in a dialogue, the length of sen-
tences, the occurrence of pronouns, etc. When calculating, for example, the number of verbs
in a text file, we take into account only the frequency of occurrence of this part of speech
and ignore the others. In contrast, IR approaches consider each text file as a computational
unit (feature vector).
In this chapter we describe the approaches from the groups Linguistic and computational
analysis and Information retrieval. When describing the methods from the first group, we
explain what each feature indicates and provide necessary examples from the German lan-
guage (Sections 4.1-4.2). The TF-IDF weighting scheme is presented in Section 4.3.
4.1 Analysis of Verbal Behaviour
It has been acknowledged that simple linguistic measures may provide more information
about the personality of individuals than sophisticated computational approaches. That
is why we first suggested analysing monologues and dialogues at several linguistic levels:
morphological, lexical, syntactic, semantic, and stylistic. Cues that were extracted at these
levels are described in this section.
Features extracted at the morphological level (Section 4.1.1) were divided into two cat-
egories: word formation and word length.
Derivation, compounding, conversion, and inflection are cues suggested what the word
formation category consists of. They show how individuals form words during conversations.
The category word length includes such cues as the average length of words, length of
different parts of speech, number of long words (longer than six letters), abbreviations, and
acronyms.
For the analysis of text files at the lexical level (Section 4.1.2), we measured the occur-
rence of different parts of speech in the sentences of our candidates, estimated the complexity
of their vocabulary by calculating the type/token ratio, the usage of frequent and rare words,
and the appearance of abstract words. By measuring the degree of similarity between the
monologues and the film transcript, we estimated to what degree our candidates reused
words and phrases from the film when describing it. This approach is called Lexical entrain-

4.1 Analysis of Verbal Behaviour 41
ment. We also extracted several features that indicate the lexical peculiarities of spoken
language (e.g., occurrence of particles).
Syntactic features that were extracted from the monologues and dialogues include sub-
ordinate clause, passive voice, genitive case, es-extraposition, and some other peculiarities
that show how individuals construct their sentences when expressing their thoughts and feel-
ings. Each feature is described in detail using examples from the German language (Section
4.1.3).
For the semantic analysis, we compared monologues and dialogues with a special dic-
tionary that consists of several linguistic categories. The occurrence of these categories in
speech may be considered as certain topics that individuals are talking about. In Section
4.1.4, we describe the structure of the dictionary and explain the meaning of each linguistic
category.
For the stylistic analysis of speech samples, we estimated the formality of language,
stylistic diversity of our candidates, and the degree to which their personality is revealed in
their speech. A detailed description of each category is presented in Section 4.1.5.
4.1.1 Morphological Analyses
As mentioned above, the morphological cues extracted from the monologues and dialogues
of the speakers with different verbal intelligence may be divided into two groups: word
formation and word length. In the following sections, the features from each category are
described in detail.
Word Formation
Word formation is one of the major processes of morphological analysis. In the German
language, there exist many words that are composed of several parts (e.g., prefix, stem) or
derived from other parts of speech (e.g., verbs, adjectives). For example, the word Freund-
schaft (friendship) consists of the stem Freund (friend) and the postfix shaft; another word
Rede (speech) is derived from the word reden (speak)1.
Word formation is a morphological theory that studies and explains the construction of
such words. The word formation process may be divided into the following types:2
• Derivation;
• Compounding;
• Conversion;
• Inflection.
All these types are described in the following.
Derivation
Derivation is a type of word formation where a new word is created by combining a
primary word (or primary morpheme) with an affix (prefix or postfix) [Clahsen et al., 2002].
For example, Schonheit (beauty) consists of two parts: the primary word schon (beautiful)
and the postfix heit. The main difference of Derivation from other word formation types is
1 In this case (and for many other German words) the morphology does not give the exact answer whether
Rede is derived from reden or vice versa.2 Word formation categorisation may differ depending on different morphological theories.
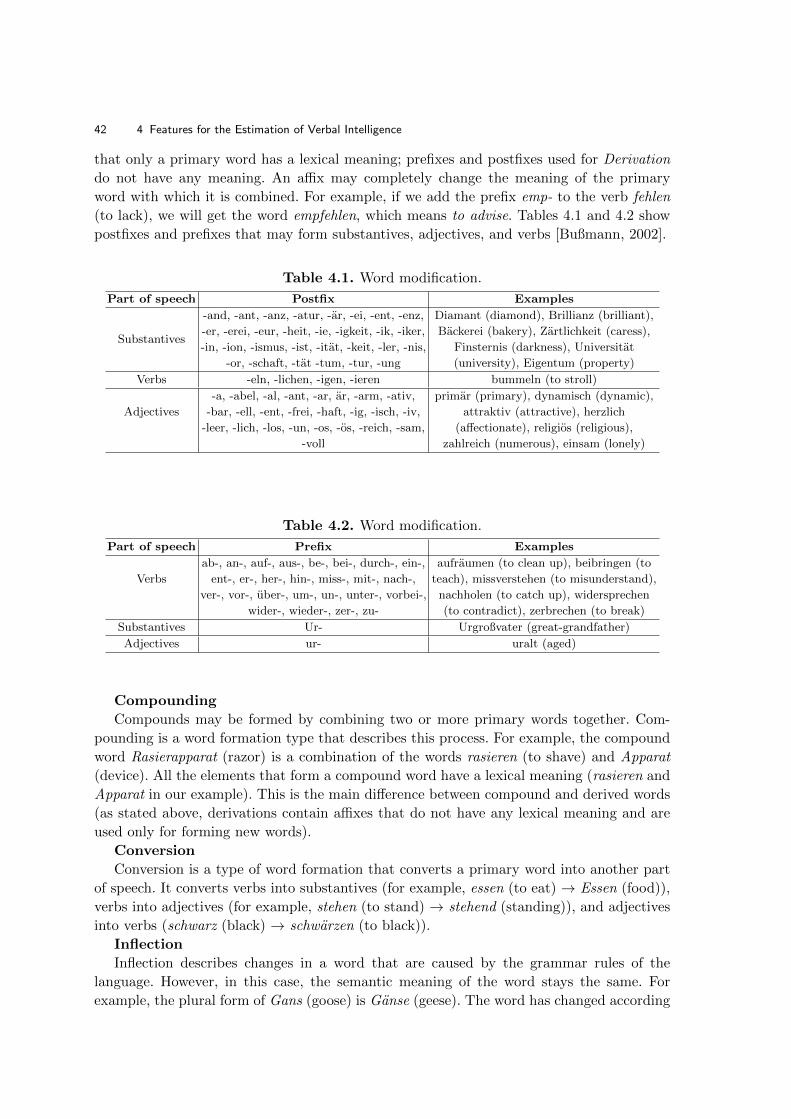
42 4 Features for the Estimation of Verbal Intelligence
that only a primary word has a lexical meaning; prefixes and postfixes used for Derivation
do not have any meaning. An affix may completely change the meaning of the primary
word with which it is combined. For example, if we add the prefix emp- to the verb fehlen
(to lack), we will get the word empfehlen, which means to advise. Tables 4.1 and 4.2 show
postfixes and prefixes that may form substantives, adjectives, and verbs [Bußmann, 2002].
Table 4.1. Word modification.
Part of speech Postfix Examples
Substantives
-and, -ant, -anz, -atur, -ar, -ei, -ent, -enz,
-er, -erei, -eur, -heit, -ie, -igkeit, -ik, -iker,
-in, -ion, -ismus, -ist, -itat, -keit, -ler, -nis,
-or, -schaft, -tat -tum, -tur, -ung
Diamant (diamond), Brillianz (brilliant),
Backerei (bakery), Zartlichkeit (caress),
Finsternis (darkness), Universitat
(university), Eigentum (property)
Verbs -eln, -lichen, -igen, -ieren bummeln (to stroll)
Adjectives
-a, -abel, -al, -ant, -ar, ar, -arm, -ativ,
-bar, -ell, -ent, -frei, -haft, -ig, -isch, -iv,
-leer, -lich, -los, -un, -os, -os, -reich, -sam,
-voll
primar (primary), dynamisch (dynamic),
attraktiv (attractive), herzlich
(affectionate), religios (religious),
zahlreich (numerous), einsam (lonely)
Table 4.2. Word modification.
Part of speech Prefix Examples
Verbs
ab-, an-, auf-, aus-, be-, bei-, durch-, ein-,
ent-, er-, her-, hin-, miss-, mit-, nach-,
ver-, vor-, uber-, um-, un-, unter-, vorbei-,
wider-, wieder-, zer-, zu-
aufraumen (to clean up), beibringen (to
teach), missverstehen (to misunderstand),
nachholen (to catch up), widersprechen
(to contradict), zerbrechen (to break)
Substantives Ur- Urgroßvater (great-grandfather)
Adjectives ur- uralt (aged)
Compounding
Compounds may be formed by combining two or more primary words together. Com-
pounding is a word formation type that describes this process. For example, the compound
word Rasierapparat (razor) is a combination of the words rasieren (to shave) and Apparat
(device). All the elements that form a compound word have a lexical meaning (rasieren and
Apparat in our example). This is the main difference between compound and derived words
(as stated above, derivations contain affixes that do not have any lexical meaning and are
used only for forming new words).
Conversion
Conversion is a type of word formation that converts a primary word into another part
of speech. It converts verbs into substantives (for example, essen (to eat) → Essen (food)),
verbs into adjectives (for example, stehen (to stand) → stehend (standing)), and adjectives
into verbs (schwarz (black) → schwarzen (to black)).
Inflection
Inflection describes changes in a word that are caused by the grammar rules of the
language. However, in this case, the semantic meaning of the word stays the same. For
example, the plural form of Gans (goose) is Ganse (geese). The word has changed according
4.1 Analysis of Verbal Behaviour 43
to the rules of the plural form, but the semantic meaning stays without changes (we may use
both words when we are talking about this bird). Changes in the ending of a verb are another
example of inflection. For instance, in the sentence Sie geht spazieren (She goes for a walk)
the ending of the verb gehen (go) must be changed to geht (goes) (third person singular).
When analysing derivations, compoundings, conversions, and inflections, we investigated
whether higher and lower verbal intelligence individuals differ in how they form their words.
Word Length
Features that are included in the category Word length are:
• Average word length;
• Average length of nouns;
• Average length of verbs;
• Average length of adjectives;
• Average length of adverbs;
• Number of long words;
• Number of abbreviations and acronyms.
The feature Average word length is calculated as the sum of letters in each word
divided by the number of words in the text. In the German language, several nouns may
be combined together to form a new word. For example, the words Haus (house) and Tier
(animal) may form a new word Haustier, which means domestic animal or a word Tier-
haus, which means an open-air cage. Such compound words may consist of two or more
nouns. Some researchers “created” a German word containing 101 letters (Krankenkassen-
kostendampfungsgesetzbeschlussvorlagenberatungsprotokolluberprufungsausschussvorsitzende).
Of course, such a word will not occur in spoken or written language. However, a few German
words may reach the length of 63 letters, for example Rindfleischetikettierungsuberwachungs-
aufgabenubertragungsgesetz (the law on transfer of control duties over beef marks). Not only
nouns may be used for forming a new word. The word Altpapierabgabe (delivery of recy-
cling paper) contains the adjective alt (old); the word Dreizimmerwohnung (three-room
apartment) contains the numeral drei (three). Such words frequently occur in the German
spoken language.
Average length of nouns
This feature is calculated as the sum of letters of nouns divided by the total number of
nouns in the analysed text. (To determine the parts of speech in text files, a parsing program
Morphy was used. A detailed explanation of this program may be found in Section 4.1.2).
If a speaker uses several long substantives in his or her speech, the feature Average word
length may be relatively small because of a significant number of words containing a few
letters (articles, prepositions, conjunctions, etc). These words are called function words.
They do not convey any content meaning but may indicate speech style differences between
individuals. The Average length of nouns may show us whether speakers with a higher verbal
intelligence level use longer words than lower verbal intelligence speakers.
Average length of other parts of speech
For a detailed investigation of the word length of speakers with different verbal intel-
ligence levels, each part of speech was separately analysed. The following parts of speech
were used:

44 4 Features for the Estimation of Verbal Intelligence
• Verbs;
• Adjectives;
• Adverbs.
By calculating the Average word length, we analysed whether speakers with a higher
verbal intelligence level were better able to combine several words together to express their
thoughts and feelings than lower verbal intelligence speakers. If this statement is true, the
average word length of higher verbal intelligence speakers should be greater.
Number of Long Words
To analyse whether speakers with a higher verbal intelligence level tend to use longer
words than speakers with a lower verbal intelligence level, the following features were also
extracted from their spoken utterances:
• Number of words longer than 6 letters;
• Number of words longer than 7 letters;
• Number of words longer than 8 letters;
• Number of words longer than 9 letters;
• Number of words longer than 10 letters.
Abbreviations and Acronyms
This feature is calculated as the ratio of Abbreviations and Acronyms to the number of
all words in the text. Abbreviations and acronyms may reflect the richness of vocabulary
and show a higher verbal intelligence level of a speaker.
4.1.2 Lexical Analyses
In this section, we describe lexical features that were extracted from the monologues and
dialogues.
At first, we report on a parsing program that was used for the linguistic tagging of the
text files. Then, we give a detailed description of each lexical feature extracted from the
monologues and dialogues. Analysing the spoken utterances of test persons at the lexical
level, we took into account which parts of speech they used and estimated the complexity
of their vocabulary by measuring the type/token ratio and the frequency of occurrence of
abstract and rare words in their phrases and sentences. These features are presented in the
sections “Parts of Speech” and “Complexity of Vocabulary”. Then we describe an approach
for determining to what degree the monologues of speakers with different verbal intelligence
were similar to the film transcript (section “Lexical Entrainment”).
At the end of this section, we present cues that reflect differences between the spoken
and the written language. They were also extracted from the text files in order to determine
which type of language individuals with different verbal intelligence use in their everyday
life (section “Lexical Peculiarities of Spoken Language”).
Parts of Speech
Linguistic Tagging
For the linguistic analysis of speech of our test persons, their monologues were linguis-
tically tagged using a parsing program Morphy [Lezius, 1999]. This program may analyse
separate sentences or text files using special dictionaries and linguistic rules. Morphy returns

4.1 Analysis of Verbal Behaviour 45
the initial form of each word and its lexical category. Figure 4.2 shows the results of the
program for a sentence taken from one of the monologues.
Initial sentence:In dieser Galileo-Sendung geht es um Schlaflosigkeit. (This Galileo-Program is aboutsleeplessness)Results of the program:inin PRP DATdieserdieser DEM NOM SIN MAS ATTGalileo-SendungGalileo-Sendung SUB NOM SIN MASgehtgehen VER 3 SINesich PER NOM SIN NEU 3umum PRP AKKSchlaflosigkeitSchlaflosigkeit SUB AKK PLU FEM.. SZE
Fig. 4.2. Results of the program Morphy.
Each abbreviation implies a certain morphological function, for example SUB means
Noun (Substantiv), RPR is a preposition (Praposition), PLU means plural, etc. A more
detailed description of the program and its abbreviations may be found in [Lezius, 1999].
The results of the tagging were taken as a basis for extracting linguistic features described
in the following.
Table 4.3 shows parts of speech that may be extracted from any text file using Morphy.
Corresponding Morphy abbreviations are also presented in this table.
Among the features mentioned above, one feature needs additional explanation because
it plays an important role in the German language. This feature is Conjunctions. In the
following section, we describe three types of conjunctions that may be relevant to ver-
bal intelligence: subordinating conjunctions, coordinating conjunctions, and conjunctions of
place.
Conjunctions
Subordinating conjunctions are used to connect a subordinate clause with the main part
of the sentence.
According to the syntactic rules of the German language, the verb of a subordinate clause
must occur at the end of it. For example, in a sentence Er weiss dass ich spat komme (He
knows that I will come late) the verb komme (come) must be placed at the end of the sentence
to avoid a syntactic mistake and to be correctly understood by a native German speaker.
This peculiarity forces speakers to memorize the verb while speaking a subordinate clause.

46 4 Features for the Estimation of Verbal Intelligence
Table 4.3. Parts of speech.
Parts of speech Morphy abbreviations Examples
Substantives
Common nouns SUB Schule (school)
Proper nouns EIG Max, Funda, Galileo
Abbreviations ABR WG (apartment-sharing community)
Verbs
Inflected verbs VER arbeitet (works), schlaft (sleeps)
Infinitives INF arbeiten (to work), schlafen (to sleep)
Adjectives
Common adjectives ADJ lang (long), ehrgeizig (ambitious)
Participle 1 PA1 entsprechend (correspondent)
Participle 2 PA2 gegangen (gone), regiert (governed)
Adverbs
Common adverbs ADV immer (always), gleich (immediately)
Pronouns
Personal PER ich (I), du (you)
Indefinite IND nichts (nothing), alle (everybody)
Possessive POS mein (my), sein (his)
Demonstrative DEM dies (this), der (this)
Interrogative INR wer (who), was (what)
Reflexive REF sich (itself), mir (mich)
Relative REL was (what), welche (which)
Prepositions
Common prepositions PRP in (in), auf (on)
Additional prepositions SKZ, SKN zu, nicht
Verb additions ZUS richtig (right), mit (with)
Conjunctions KON und (and), dass (so that)
Numerals ZAL eins (one), acht (eight)
Articles ART ein (a), der (the)
Interjections INJ okay, na
Subordinating conjunctions allow a speaker to express his or her thoughts constructing
longer and deeper sentences with several sub-clauses that may reflect the verbal intelligence
of a speaker. To calculate this feature, the number of subordinating conjunctions in the text
files were divided by the total number of words. German subordinating conjunctions are
listed in Table 4.4 ([Nutting, 2007]).
Table 4.4. Subordinating Conjunctions.
Subordinating Conjunctions
als (when, as), als ob (as if, as though), ausgenommen wenn (except when), bevor (before), bis (till, until),
da (since, as (i.e., giving the reason for something)), damit (so that (i.e., a purpose)), dass (that),
nachdem (after), ob (whether), obwohl (although), ohne dass (without (+ -ing)),
seitdem/seit (since (re: time)), sobald (as soon as), so dass (so that (re: resulting in...)),
solange (as long as), wahrend (while), weil (because), wenn (when, if, whenever),
auch wenn (even if, even when), wie (as, how (i.e., way of doing))
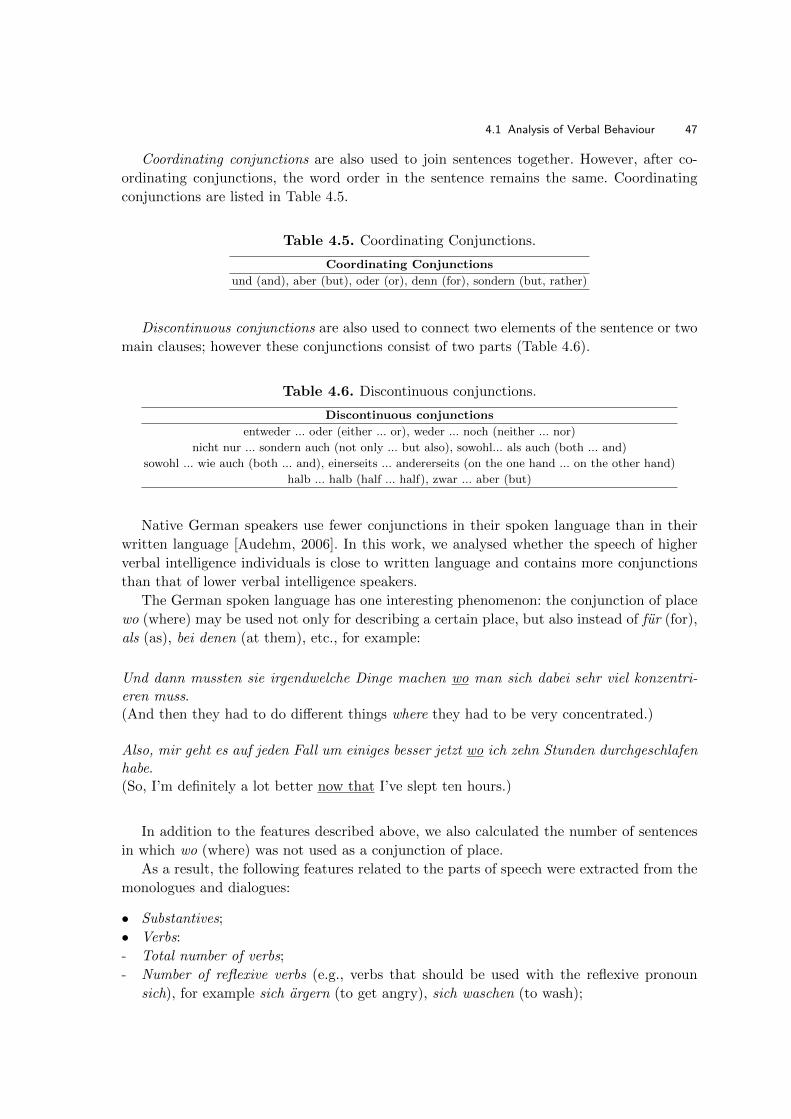
4.1 Analysis of Verbal Behaviour 47
Coordinating conjunctions are also used to join sentences together. However, after co-
ordinating conjunctions, the word order in the sentence remains the same. Coordinating
conjunctions are listed in Table 4.5.
Table 4.5. Coordinating Conjunctions.
Coordinating Conjunctions
und (and), aber (but), oder (or), denn (for), sondern (but, rather)
Discontinuous conjunctions are also used to connect two elements of the sentence or two
main clauses; however these conjunctions consist of two parts (Table 4.6).
Table 4.6. Discontinuous conjunctions.
Discontinuous conjunctions
entweder ... oder (either ... or), weder ... noch (neither ... nor)
nicht nur ... sondern auch (not only ... but also), sowohl... als auch (both ... and)
sowohl ... wie auch (both ... and), einerseits ... andererseits (on the one hand ... on the other hand)
halb ... halb (half ... half), zwar ... aber (but)
Native German speakers use fewer conjunctions in their spoken language than in their
written language [Audehm, 2006]. In this work, we analysed whether the speech of higher
verbal intelligence individuals is close to written language and contains more conjunctions
than that of lower verbal intelligence speakers.
The German spoken language has one interesting phenomenon: the conjunction of place
wo (where) may be used not only for describing a certain place, but also instead of fur (for),
als (as), bei denen (at them), etc., for example:
Und dann mussten sie irgendwelche Dinge machen wo man sich dabei sehr viel konzentri-eren muss.(And then they had to do different things where they had to be very concentrated.)
Also, mir geht es auf jeden Fall um einiges besser jetzt wo ich zehn Stunden durchgeschlafenhabe.(So, I’m definitely a lot better now that I’ve slept ten hours.)
In addition to the features described above, we also calculated the number of sentences
in which wo (where) was not used as a conjunction of place.
As a result, the following features related to the parts of speech were extracted from the
monologues and dialogues:
• Substantives;
• Verbs:
- Total number of verbs;
- Number of reflexive verbs (e.g., verbs that should be used with the reflexive pronoun
sich), for example sich argern (to get angry), sich waschen (to wash);
48 4 Features for the Estimation of Verbal Intelligence
- Modal verbs, for example, mussen (must), sollen (schould);
- Verbs with prepositions, e.g., verbs that should always be used with a certain preposition,
for example sich bewerben bei (to apply to), fragen nach (to ask about);
• Adjectives;
• Adverbs:
- Total number of adverbs;
- Adverbs with prepositions, e.g., verbs that should always be used with a certain preposi-
tion, for example bekannt fur (known for);
• Pronouns;
• Prepositions;
• Conjunctions:
- Total number of conjunctions;
- Subordinating conjunctions;
- Coordinating conjunctions;
- Discontinuous conjunctions;
- Coordinating conjunction wo (where) when it was not used as a conjunction of place;
• Numerals;
• Articles;
• Interjections;
• Verb-adjective ratio.
Complexity of Vocabulary
The complexity of vocabulary may be reflected by the following features:
• Vocabulary or Type/Token Ratio;
• Word Frequency;
• Abstract Words.
A detailed description of these features is presented in the following.
Vocabulary
There are two types of vocabulary: passive and active. Passive vocabulary is the number
of words that a speaker understands. But “understand” does not mean “use”. That is why
active vocabulary (or the number of unique words that a speaker uses in his or her everyday
conversations) is a more important feature for this investigation. Active vocabulary may be
calculated as Type/Token Ratio using lemmas:
Type/Token Ratio lemmas =unique lemmas
all lemmas,
and Type/Token Ratio using words:
Type/Token Ratio words =unique words
all words.
Word Frequency
When we read a scientific book or a novel, we may encounter a significant number of words
that hardly ever occur in everyday life. On the other hand, frequently used words are always
associated with spoken language. According to our hypothesis, speakers with a higher verbal

4.1 Analysis of Verbal Behaviour 49
intelligence level are better able to use rare words to express their thoughts and feelings
than lower verbal intelligence speakers. To accept or reject this hypothesis, monologues and
dialogues from the corpus were compared with frequency lists for the German language
[Kupietz et al., 2010]. The list contains 40,000 German words with an index from 0 to 17;
the higher the index the rarer the word occurs in speech. Several words from the frequency
list with corresponding indexes are shown in Table 4.7. If a certain word from a monologue
cannot be found in the frequency list, its index was set to 18.
Table 4.7. Words with their frequency values according to the dictionary [Kupietz et al.,2010].
Word Frequency Word Frequency
der (the) 0 Menschen (people) 6in (in) 1 Schulprojekt (school project) 15nicht (no) 2 Medienhaus (media company) 15wird (will) 3 Hugelland (hilly country) 16wenn (if) 5 Futtersuche (foraging) 17
Abstract Words
Abstract words are words or concepts that cannot be grasped by the human senses
and that do not provoke a corresponding image in the mind. In the German language,
abstract words may be constructed from adjectives and verbs with an emotional tone, for
example argern - Arger (to make angry - anger), hassen - Hass (to hate - hatred), blod -
Blodheit (foolish - foolishness), dumm - Dummheit (stupidly - stupidity). Usually these words
have suffixes -heit, -keit, -ung (Schonheit (beauty), Zartlichkeit (tenderness), Tauschung
(deception)).
The number of abstract words is an important feature in psychological studies [Walter,
2008; Mergenthaler, 1996]. For instance, the proportion of abstract and emotion words
during psychotherapeutic sessions reflects the psychic state of a patient and may show the
effectiveness of therapy [Mergenthaler, 1998b, 2000]. Abstract words are frequently used by
individuals with a high “strength of their need for achievement” [McClelland et al., 1953].
Individuals with a low need of achievements used more negations and dependent clauses.
In this work, the number of abstract words in monologues and dialogues were measured
using a program CM [Mergenthaler, 1998a]. A more detailed description of this tool is
presented in Section 4.2.2.
Lexical Entrainment
In this section we describe an approach for estimating the verbal behaviour of speakers
talking about the same event. For the analysis, the monologues from the verbal intelligence
corpus were compared with the film transcript. This allowed us to analyse to what degree
our test persons tended to repeat certain words and phrases from the film when describing
it. Lexical entrainment is the only approach from the group Analysis of verbal behaviour

50 4 Features for the Estimation of Verbal Intelligence
that was not applied to the dialogues. A detailed description of this method is presented in
the following.
Furnas et al. (1987), in their study of command languages, concluded that a short com-
mand to the computer consisting just of a few words may be expressed in different ways.
For example, if a user wants to create a new folder, he or she may say: “create a new folder”,
“new folder”, “put a new folder”, “design a folder”, etc. According to Furnas, the probabil-
ity that two users perform the same command with the same combination of terms varies
from 0.07 to 0.18. If two users may choose between a number of synonyms for a certain
command, the likelihood of this event is about 80% [Furnas et al., 1987].
If two speakers talk about a certain event (for example, about an accident that happened
this morning on their way to work), they will probably use completely different phrases and
sentences. However, if we compare such stories to each other, we will certainly find a number
of words that occur in both cases. These could be words specific for this particular situation
(car, traffic jam, traffic light, etc.) or words specific for a particular social class. If two
speakers talk about the same event that they heard on the radio or on TV, they may reuse
a number of words from this report. Repeating or reusing words by different speakers when
they discuss the same situation or problem may be called lexical entrainment [Brennan and
Clark, 1996].
To analyse the vocabulary of people with different verbal intelligence when describing
the same event, we compared the monologues from the corpus with the film transcription.
Figure 4.3 shows excerpts from the film and from one of the monologues3.
Excerpt from the film
Max and Funda have been without sleep for fifty eight hours. They have laid down on
the sofa. Is it a mistake? Actually they would like to move. But now they cannot any
more. The blood pressure is down, the energy reserves are over. They both are freezing
despite the fire-place and the jackets. The question is who closes the eyes first. It is
Max. Funda wins. She stays awake a few minutes longer.
Excerpt from a corresponding monologue
After fifty eight hours, they were really tired. And, they had frozen. Despite they had
very warm clothes. And then the man fell asleep and then the woman.
Fig. 4.3. Excerpts from the film and one of the recorded monologues.
For the comparison, the following features were extracted:
• Number of reused words - the number of words which a test person “reused” from the
film. For the example in Figure 4.3 the reused words are: fifty, eight, hours, they, and,
they, despite, they, and, the, and, the.
• Number of unique reused words. It includes the number of reused words without repeti-
tions. In Figure 4.3, the unique reused words are fifty, eight, hours, they, and, despite,
the.
• Number of all reused lemmas. This feature has been calculated as the Number of all
reused words with the difference that lemmas were considered.
• Number of unique reused lemmas. This feature has been calculated as the Number of
unique reused words with the difference that unique lemmas were taken into account.
3 As the conversation language is German, the example was directly translated into English.

4.1 Analysis of Verbal Behaviour 51
• Cosine similarity between the film and a kth monologue using lemmas. For this feature
extraction, we created a matrix consisting of all unique lemmas from the film, including
the frequency of these lemmas within the film and within the kth monologue. Table 4.8
shows this matrix for the texts from the example (Figure 4.3).
Table 4.8. Matrix for lemma frequency.
Lemmas from film Frequency (film) Frequency (monologue)
Max 2 0and 1 3
Funda 1 0have 2 2be 6 1
without 1 0sleep 1 0for 1 0fifty 1 1eight 1 1hour 1 1
The frequencies were normalized by the total amount of words in the corresponding text;
the cosine similarity between the two normalized vectors (lemma frequencies within the
film and lemma frequencies within the kth monologue) was calculated as:
similarity =
∑ni=1 aibi∑n
i=1 ai2∑n
i=1 bi2 ,
where n is the number of unique lemmas in the film, ai - frequency of ith lemma in the
film, bi - frequency of ith lemma in the monologue.
• Number of reused lemma n-grams. For this feature we have calculated the number of
lemma n-grams (n = 2, 10) that were used in the film and then reused by a test-person
in his or her monologue. In our example, the Number of reused lemma 2-grams equals to
2 (reused 2-grams are fifty eight and eight hour), the Number of reused lemma 3-grams
equals to 1 (fifty eight hour), etc.
• Cosine similarity using lemma n-grams. The cosine similarity was calculated from a
feature vector composed by the counts of different lemma n-grams for each monologue.
• We also determined the number of lemmas that were used by the candidates but were
not used in the film. For each monologue, the following features were calculated:
Own lemmas1 =
n∑i=1
frequency(lemmai) ∗ count(lemmai)
and
Own lemmas2 =
n∑i=1
frequency(lemmai),
where n is the number of unique lemmas that were used by a test person but were not
used in the film; count(wordi) shows how many times lemmai was used in the monologue;

52 4 Features for the Estimation of Verbal Intelligence
frequency(lemmai) shows the frequency of lemmai according to a frequency dictionary
of the German language [Kupietz et al., 2010]. The dictionary is described above (fea-
ture Word frequency). If a word from a monologue was not found in the dictionary, its
frequency was set to 20.
Lexical Characteristics of Spoken Language
Differences between Spoken and Written Language
Every day we are “surrounded” by spoken and written language. When we are talking
to our family, friends, and colleagues or listening to small talk in a shop or in a bus, our
words and sentences may be regarded as spoken language. Writing e-mails, reading books,
newspapers, or short advertisements are examples of written language. In our everyday
life, we automatically choose the appropriate words for each situation: we use simple and
frequent words when making remarks about the weather and abstract or rare terms when
preparing a presentation. We notice the difference between these two forms of language only
when somebody starts mixing them, for example when a child says “Das ist krass” (it is
crazy).
One of the first studies of differences between spoken and written language was performed
in the second half of the 19th century. Blankenship (1962) compared published materials
and lectures of well-known persons and analysed such syntactic features as sentence length
and the use of passive voice. In her further studies, Blankenship took into consideration
the use of different parts of speech and type-token ratio [Blankenship, 1962, 1974]. Lexical
and syntactic differences of spoken and written language were also analysed in [Chafe, 1982;
Chafe and Danielewicz, 1986]. Tannen compared spoken and written language at the dis-
course level, analysing the complicated conversational structure of spontaneous interactions
[Tannen, 1982].
There are lots of differences between spoken and written language. If we compare two
sentences that describe the same topic but refer to different types of language, we will see
how different they are. For example,
Written language:That Sunday, clouds spilled down from the sky and swamped the streets with a hot mist.Spoken language:It was very cloudy and oppressive that Sunday.
As we all know, in written language grammar rules should be strictly followed; spoken
language has its own rules, too. Written sentences always have the same structure and may
always be “revived” and reread again and again. The author has an opportunity to correct
and improve his or her texts, and the reader always sees the final product.
Spoken language is fluent and cannot be exactly repeated. In the best case, we may recall
from our memory the exact word order of several phrases or sentences. In spoken language,
the speaker may correct himself only by repeating certain words or phrases. It this case, the
listener or the dialogue partner is a witness of these corrections and may follow the flow of
thoughts of the speaker.
In spoken language, the speaker and the listener share the same space and time. A speaker
has an opportunity to use words such as here, now, one year before, etc. A speaker does not

4.1 Analysis of Verbal Behaviour 53
have to describe the environment at the moment of speaking. The listener is already aware
of this information. If a speaker says for example, this, she, it, the listener will understand
what the speaker is talking about. If a speaker says yesterday, next week, he or she does
not need to explain which day he or she means. The listener may ask questions if he or
she has lost the chain of thought of the speaker. Written language does not have such an
opportunity. The writer does not exactly know when his or her “dialogue partner” reads his
or her sentences and may only imagine his or her reaction. He or she has to exactly describe
his or her thoughts to be correctly understood. Only sufficiently described details make a
text comprehensible to the reader.
In spoken language, nonverbal communication (for example, gestures) plays an important
role. One sentence may have different meanings depending on the intonation or mimic
with which it was pronounced. Spoken language must describe emotions using words and
sentences. It directly “shows” a reader which feelings he or she should have when reading a
certain part of text.
Spoken language may contain grammatical errors and use dialect, slang, and words that
reflect emotions but do not encode any semantic meaning (ah, hm).
In this section, we have collected several features that reflect the peculiarities of spoken
language and, at the same time, may be automatically extracted from the monologues.
These features allow us to analyse which type of language speakers with different verbal
intelligence tend to use more frequently. These features are:
• Number of incomplete words. These are words that a speaker has not completed, for
example stud- (student), educ- (education). In this case a speaker may continue his or
her thoughts using more appropriate words or start his or her sentence with another
word choice.
• Number of complete words. These are words that were completely pronounced by a
speaker and convey a certain semantic meaning.
• Ratio of incomplete words to complete words.
• Paralinguistic expressions. Paralinguistic expressions are words like hm, oh, aha, etc.
They do not carry any syntactical meaning but may frequently be used in spoken lan-
guage. They may be used for filling undesired pauses, help a speaker to express emotions
about a certain item in a conversation or to find appropriate expressions.
• Fillers. Fillers are words that could be pronounced in a conversation; however, these
words are useless in a sentence and may be excluded from it without any sequences. They
could appear in speech just because a speaker is used to them in his or her everyday
conversations. The most common fillers in German are: und (and) (if it is not used as a
conjunction), das heisst (it means), zum Beispiel (for example), also (so), oder so (or so),
sozusagen (as it were), einfach (just), total (complete), und so weiter (and so on), ein
bisschen (a little bit), naturlich (of course), ja (yes), dann (then), etwas (some), sogar
(even), halt (just). In this research we investigated whether more intelligent people used
a smaller amount of fillers in their descriptions.
Particles
When we are expressing our thoughts and feelings, we try to be correctly understood
and to logically order our phrases and sentences. However, spoken language is frequently
inconsequential. Speakers may express several ideas in the same sentence, suddenly switch

54 4 Features for the Estimation of Verbal Intelligence
the topic or make remarks on something irrelevant. For making such thoughts and feelings
comprehensible to the listener, speakers frequently use modal particles. Modal particles help
a listener to understand the structure of a sentence, especially if this sentence is complex:
it consists of several sub-clauses or combines a number of phrases with different meanings.
Modal particles are listed in Table 4.9.
Table 4.9. Modal particles.
Modal particles
aber, auch, bloss, denn, doch, eben, eigentlich, einfach, etwa
halt, ja, mal, nicht, noch, nun mal, nur, ruhig, schon, vielleicht, wohl
According to [Talmy, 1985], languages may be divided into two large categories: verb-
framed and satellite-framed languages. Satellite-framed languages use directional and per-
spectival particles for motion events in comparison with verb-framed languages that use
standard verbs for motions. German is a satellite-framed language. For example, such verbs
as aufstehen (to stand up), einziehen (to move in), ausgehen (to go out) consist of verb
stems and directional particles that indicate the direction of the motion. English is also
a satellite-framed language. However, German particles have a specific contrast that make
them different from English. This peculiarity may be described in the following.
All directional and perspectival particles may be divided into 5 categories [Behrens,
2009]:
Category 1: General particles: uber (over), unter (under), auf (on), and so on. For
example:
Er geht zur Brucke.(He goes to the bridge.)
Other directional and perspectival particles are shown in Tables 4.10.
Table 4.10. Directional and perspectival particles.
Question Particle
Wohin?bis, durch, entlang, gegen, um, nach, zu, an, auf, hinter, in, neben,
uber, unter, vor, zwischen
Wo?an, entlang, um, herum, ab, bei, gegenuber, von, aus, zu, außerhalb,
innerhalb, an, auf, hinter, in, neben, uber, unter, vor, zwischen
Woher? aus, von
Category 2: Hin (thither) and her (hither). These two particles can “encode the per-
spective of the direction” [Behrens, 2009]. For example:
Most German children acquire the difference between these particles when they are two
years old [Behrens, 2009]; however, it may cause difficulties for people learning German as
a second language.

4.1 Analysis of Verbal Behaviour 55
Er geht zur Brucke hin.(He goes to the bridge thither.)
Er geht von der Brucke her.(He goes from the bridge hither.)
Category 3: Combination of hin and her with particles from Category 1. For a better
understanding, let’s analyse the following situations between a speaker (S) and a listener
(L):
1. S and L are both in a house and S wants L to go outside, for example to the yard; S
should say: Geh hinaus (go out thither).
2. S is outside and L is in the house; if S wants L to join him, S should say Komm heraus
(come out hither, come to me, come to the position where I am now).
3. S is in the house, but L is out of the house. S wants L to be near him and says Komm
herein (come into hither, enter the house where I am now).
4. S and L are both out of the house in the yard. S wants L to enter the house and says
Geh hinein (go into thither).
As we may see, the context should give enough information about the goal or the source
of the movement. Only in this case the prepositional phrase may be replaced by the corre-
sponding particle.
Category 4: Combination of directional and perspectival particles (Category 1) with
r- or n- (r-uber, r-unter, r-auf, n-auf, n-ein, etc.). Prefixes r- and n- are used as shortened
forms instead of hin- and her-. The prefix r- is common in Northern Germany, n- is usually
used in Southern Germany. If hin/her are replaced by r-/n-, the distinction in their meaning
doesn’t exist any more (hin-auf (on thether) and her-auf (on hither) becomes rauf (onto)).
Category 5: Combination of particles from Category 1 with da (or dr as a short form).
In this case da tells us about the final position of a movement. For example:
Er hat den Kugelschreiber auf den Tisch drauf gelegt.(He has put the pen onto the table.)
Particle or prefix verbs account for about 20% of the total verb tokens [Behrens, 1998,
2003]. These particle verbs are more often used in spoken than in written German [Engelen,
1995]. According to Eichinger, native German speakers use her more often than hin in their
everyday speech [Eichinger, 1989]. In [Behrens, 2009], it was found out that children use
hin-verbs more frequently than her-verbs. It should be noted that the active vocabulary of
children is not that large. That is why the variability of verb stems is not significant. It
means that children use a certain number of verbs for describing their thoughts but more
often combine these verbs with hin than with her. Another interesting conclusion of this
research is that verbs with r-particles occur two or three times more often than verbs with
hin- or her-particles. Anyway, all children were able to feel the difference in meaning between
verbs with different directional particles. There are some other studies that analyse certain
peculiarities of German directional particles; however, detailed investigations of their usage
is lacking.

56 4 Features for the Estimation of Verbal Intelligence
In this work, we analysed the occurrence of modal and directional particles in speech of
people with different verbal intelligence. All experiment participants were native German
speakers; it is no doubt that they all have no difficulties in using modal and directional
particles in their speech. However, as described above, directional particles tend to more
frequently appear in spoken language, and modal particles may often be used in sentences
with a complex structure. For the analysis, the following features were extracted:
• Verb tokens;
• Particle verb tokens;
• R-Tokens;
• Hin/her tokens;
• Modal particles.
4.1.3 Syntactic Analysis
In [Pine, 1964], it was proposed that the syntactic structure of spoken utterances may
reflect the psychological state of a speaker. According to [Dahl et al., 1978; Virginia and
Dahl, 1995], the feelings of individuals, being unconscious or warded-off, may be reflected by
the syntactic structures of spoken utterances. The syntactic structures of a speaker express
his or her “countertransference, which the rule of abstinence prevents him from expressing
directly” [Holland, 2001]. In this work, we analysed whether or not syntactic structures may
also reflect verbal intelligence differences of individuals.
Some features discussed in this section also reflect differences in spoken and written
language. Spoken German may be grammatically incorrect, there are many slang and dialect
expressions, some words may be missing or be in the wrong positions, thoughts could be
broken or corrected by the speaker. A speaker may refer to things around him or her using
fewer words (sometimes one gesture is enough) than a writer who always has to describe
details if he wants a reader to correctly understand him or her [Horowitz and Samuels, 1987].
Nonverbal communication makes sense only in spoken language. Another difference between
a speaker and a writer is that the former has time for thinking about his or her expressions
and for making corrections and improvements. In contrast, spoken language exists “here
and now”, and a speaker cannot change the phrase that he or she has already pronounced
[Horowitz and Samuels, 1987]. Our hypothesis is that the speech of individuals with a higher
verbal intelligence level should be more complicated and may contain peculiarities of written
language.
In this section, we describe syntactic features that were extracted from the monologues
and dialogues of speakers with different verbal intelligence. The following peculiarities and
sentence structures were taken into account:
• Sentence length;
• Different types of clauses;
• Passive voice;
• Genitive case;
• Present and perfect participles;
• Pluperfect;
• Subjunctive mode;
• Es-Extraposition;

4.1 Analysis of Verbal Behaviour 57
• Pre-prefield position;
• Sentences with a junk word “and”;
• Past tense;
• Illogical construction.
For a better understanding, each cue is explained using examples from the German language.
Sentence Length
Sentence length may be a valuable measure that may reflect the levels of verbal intelligence
of individuals. We may suggest that speakers with higher verbal abilities try to make their
utterances more informative and construct longer sentences using additional adjectives or
adverbs than other speakers. On the other hand, lower verbal intelligence participants, when
expressing their ideas and thoughts, may interrupt and correct themselves trying to find
appropriate words and expressions. This may also be a reason that lower verbal intelligence
speakers construct longer sentences.
As we may see, sentence length is a promising feature that should be used for analysing
the verbal behaviour of individuals. However, this measure is difficult to obtain when working
with spoken utterances. Spoken language does not often include such cues that may clearly
indicate the end of each sentence. Moreover, if a speaker is not able to express his or her
feelings without breaking his or her chain of thought, clarifying some ideas, or repeating
certain words or phrases, then determining the thresholds between sentences becomes a
challenging task.
In this work, the sentence segmentation was done based on Kindt’s sentence defini-
tion [Kindt, 1994]. According to Kindt, a sentence is the smallest independent linguistic
unit that can freely appear in texts. The free appearance must be empirically checked with
the “movement procedure” for the concerning part of a text. This means that a text frag-
ment is a sentence if it can be moved from its position and put before or after any sentence
in the same text or in any other text without the linguistic correctness of the text being
lost.
All the monologues were manually divided into sentences using this rule. As a results,
the following features were extracted:
• Number of the sentences in each document;
• Average length of the sentences.
Temporal Clauses
Temporal clauses may help a speaker to describe chronological events in a sentence. For
example:
Sobald die ihre Augen langer als 30 Sekunden eben zu hatten war das Experiment aus.(Once their eyes were closed for longer than 30 seconds, the experiment was cancelled.)
Table 4.11 gives a list of adverbs that may be used for constructing temporal clauses.

58 4 Features for the Estimation of Verbal Intelligence
Table 4.11. Adverbs used for constructing temporal clauses.
Adverbs used in temporal clauses
als (as), bevor (before), bis (to), ehe (before), indem (by), indes (however),
indessen (while), kaum (hardly), kaum dass (hardly that), nachdem (after), seit (since),
seitdem (since), so oft (as often), sobald (once), solange (as long as), sowie (and),
wahrend (while), wenn (when), wie (such)
Relative Clauses
Relative clauses may be used by a speaker for giving additional information about a person
or a thing he or she is talking about. Relative clauses in German may be constructed using
the following elements:
• Using relative pronouns in nominative case (der, die, das), accusative case (den, die, das),
dative case (dem, der, denen), and genitive case (dessen, deren):
Ein weiterer Test, den sie dann noch durchgefuhrt haben, war mit einem Auto fahren.(Another test, which they have carried out, was to drive a car.)
• Using was, wer and wo:
Die beiden anderen, haben es letztens Endes geschafft bis achtundfunfzig Stunden, was eineganz lange Zeit ist.(The other two have finally managed fifty-eight hours, which is quite a long time.)
Infinitive Clauses
Infinitive clauses are sentences that contain the “zu + infinitive” construction. Infinitive
clauses occur in spoken and written language and were also frequently used by the experi-
mental participants:
In dem Galileo-Bericht geht es um einen Journalisten, einen Reporter und noch eine Frau,die versuchen so lange wie moglich wach zu bleiben.(The Galileo report is about a journalist, a reporter, and another woman, who try to stayawake as long as possible.)
Passive Voice
Passive voice in the German language is formed by adding the verb werden (become) to the
past participle form of the main verb, for example:
Passive voice may frequently be found in German newspapers, books, official documents
and letters. However, it may also occur in spoken language and may be an informative
indicator of higher verbal intelligence levels of speakers.
4.1 Analysis of Verbal Behaviour 59
Der Experte hat dann erzahlt dass einige Experimente mit Mausen gemacht wurden.(Then the expert had told that some experiments with mice were made.)
Genitive Case
Genitive case in the German language is used for showing possession of a certain object:
Der Schlafforscher hat uber die Ergebnisse der Tierexperimente geredet.(The sleep researcher talked about the results of the experiments with animals.)
On the other hand, the possessive may also be expressed using the preposition von and
the subject in the Dative Case:
Der Schlafforscher hat uber die Ergebnisse von Tierexperimenten geredet.
(The sleep researcher talked about the results of the experiments with animals.)
Dative Case is more frequently used in spoken language whereas Genitive is an indicator
of written language. In this work we analysed which of these cases is preferred by higher
and lower verbal intelligence individuals.
Present Participles
The present participle is formed by adding “d” to the infinitive form of a verb. As a result,
an adjective (das spielende Kind (the playing child)) or an adverb (er antwortete lachelnd
(he replied smiling)) may be constructed:
Und da hat er den Puls uberpruft, auf so einem stehenden Fahrrad.(And there he had checked the pulse, using such a standing bike.)
Perfect Participles
According to the German grammar, perfect participles may be used as adjectives. For a
better understanding how perfect participles are formed, let us analyse the verb machen (to
make). The perfect participle of this verb gemacht (made) may be added to a substantive
(gemachte Aufgabe (made task)). This construction does not frequently occur in spoken
language, however it may sometimes be found in speech samples from the verbal intelligence
corpus:
Sie sollten nicht langer als 30 Sekunden mit den geschlossenen Augen sein.(They should not be longer than 30 seconds with their eyes closed.)

60 4 Features for the Estimation of Verbal Intelligence
Pluperfect
The pluperfect in German is used when talking about past events. It is similar to the past
perfect tense in English (Ich hatte gemacht (I had done)). Pluperfect is formed by using the
simple past tense of the auxiliary verb and the past participle form of the main verb:
Max war eingeschlafen kurz bevor die Funda ihre Augen zugemacht hat.(Max had fallen asleep shortly before Funda closed her eyes.)
Subjunctive Mode (der Konjunktiv)
The subjunctive mode of a verb is used in sentences describing possible situations or situ-
ations that are not real. Such sentences are constructed using the subjunctive form of the
verb, e.g., hatte (would have), ware (were), etc.:
Ich wurde nie an solchem Experiment teilnehmen.(I would never participate in such an experiment.)
es-Extraposition
In [Gunthner, 2007], it is noted that the grammar rules of written language have their
own nuances in spoken language. In her research study much attention is given to “extra-
position”. Having analysed the results of similar investigations [Collins, 1994; Kay, 2007;
Couper-Kuhlen and Thompson, 2006], she suggests her own concept of extraposition and
its occurrence in the German language.
Let us analyse the following sentences:
Example 1:Es ist klar dass die Schule heute geschlossen ist.(It is clear that the school is closed today.)Example 2:Es ist schon dass du nachste Woche Urlaub hast.(It is nice that you have holidays next week.)
As we may see, the left part of each sentence contains es (it) and the right part begins
with dass (that) and describes the main idea of the sentences. Such constructions may be
called extraposition [Gunthner, 2007]; the left part of sentences with an extraposition may
be called A-part and the right part may be called B-part. Extrapositions are most common
for spoken language and may frequently occur in everyday conversations. The left part of
extrapositions may often contain modal particles that are also explicit peculiarities of spoken
language.
As mentioned above, sentences with extrapositions frequently occur in spoken language.
In this work we analysed the monologues and dialogues of the verbal intelligence corpus

4.1 Analysis of Verbal Behaviour 61
and investigated whether speakers with different verbal intelligence differ in their usage of
extrapositions or not. For this purpose, the following features were extracted:
• Number of sentences with es;
• Number of sentences with es-Extraposition.
Pre-Prefield Position
Written language has its own rules that usually should be followed. In the German language
one important rule is placing a verb in second place. Let us consider two sentences: Ich
arbeite morgen (I work tomorrow) and Morgen arbeite ich (Tomorrow I work).
As we may see, the words ich and morgen may change their positions depending on the
sentence construction; but the main verb arbeite stays always in second place.
If the sentence construction contains several verbs (for example, in the passive form or
with modal verbs), they must be placed at the end of the sentence:
Ich kann mir vorstellen dass ...(I can imagine that ...)
If a verb consists of a stem and a separable prefix, the former stays in second place
whereas the latter is placed at the end:
Ich stelle mir vor dass ...(I imagine that ...)
Depending on the construction of the sentence, three positions of the verb may be dis-
tinguished: pre-field, main field, and post-field positions.
Let’s analyse the following sentence4:
(1) Ich weiss: Kaffee hilft uberhaupt nicht.( I know: coffee does not help at all.)
The component Kaffee (coffee) is in the prefield position. The sentence cannot be finished
after the underlined part; this component refers to the following syntagma and forms the
complete expression with it. The position of this component is called pre-prefield [Auer,
1997]. Adverbs, adverbial expressions, conjunctions, vocatives, particles, and some other
structures can stay in the pre-prefield position. They are widely used in the German spoken
language and usually help a speaker to make his or her thoughts more understandable to
the listener [Strumr, 1998].
For example, in sentence (2) the speaker used an adverbial expression oder anderes
gesagt (in other words) to show that he was going to talk about the same thing using other
words and making his thoughts more understandable. Such adverbial expressions are used
to explain the meaning of the following syntagma. Other adverbial expressions (irgendwie
4 As the examples are given in German, they were directly translated into English.

62 4 Features for the Estimation of Verbal Intelligence
(somehow), gut (good), ehrlich (to be honest)) in the pre-prefield position could express the
speaker’s opinion about some previous ideas or about the listener.
(2) Es ging um ein Experiment in dem drei Personen so wenig wie moglich schlafen sollen.Oder anderes gesagt: sie sollten so lange wie moglich nicht schlafen.(It was about an experiment in which three people had to sleep as little as possible.In other words: they had to stay awake as long as possible.)
Adverbial sentences may help a speaker to interrupt his dialogue partner (sentence (3)) or
show that he is not sure about his thoughts (sentence (4)); “free themes” in the pre-prefield
position pay the listeners’ attention to a new aspect of the topic (sentence (5));
(3) Wenn ich jetzt reingehen darf: das war ein wissenschaftliches Experiment.(If I’m allowed to talk now: it was a scientific experiment.)
(4) Wenn ich mich nicht irre: drei Probanden haben an dem Experiment teilgenommen.(If I do not make a mistake: three candidates took part in the experiment.)
(5) Der Mann, der Jan war das, der ist dann nach zirka 48 Stunden eingeschlafen.(The man, Jan, he was asleep in about 48 hours.)
Other important functions of the pre-prefield position are described in [Auer, 1997]. Table
4.12 lists a number of adverbial expressions that may occur in the pre-prefield position.
In this work, we analysed the transcriptions of the monologues and dialogues and com-
pared the usage of different expressions in the pre-prefield position of people with higher
and lower verbal intelligence levels.
Sentences with a Junk Word “And”
In grammatically correct sentences, the conjunction und (and) is used to connect two clauses
or join several members of a sentence together:
Drei Personen Jan, Funda und Max haben versucht so lange wie moglich wach zu bleiben.(Three persons Jan, Funda and Max tried to stay awake as long as possible.)
However, in spoken German und may occur as a junk-word: it does not join any sentences
but is very often used by a speaker while expressing his or her thoughts or talking about a
sequence of events. In this case the sentences would not sound incorrect and would not lose
their semantic meaning if they are pronounced without und:
In this work, the number of sentences with and as a junk word were calculated and
compared with the verbal intelligence of speakers.

4.1 Analysis of Verbal Behaviour 63
Table 4.12. Adverbial expressions in pre-prefield.
Adverbial expressions
abgesehen davon (apart from), allerdings (though), also (so), anderes ausgedruckt (in other words)
anderes gefragt (another asked), angeblich (supposedly), apropos (apropos), außer (except)
außerdem (also), bekanntlich (known), besser (better), bloß (just), dennoch (yet)
dann (then), deswegen (so), ehrlich (honestly), ehrlich gesagt (to be honest), gewiß (certainly)
eigentlich (actually), einerseits ... andererseits (on the one hand ... on the other hand),
einfach ausgedruckt (simply phrased), erstaunlich (amazing), erstens (first), ferner (furthermore)
ganz eindeutig (clearly), genauer (precisely), gut (good), hoffentlich (hopefully)
im Gegenteil (on the contrary), im Klartext (in plain text), immerhin (after all), insgesamt (total)
irgendwie (somehow), ja (yes), jedoch (but), klar (clearly), kurz (short), kurzum (short)
mehr noch (more), meinetwegen (in my behalf), mit anderen Worten (in other words)
mit einem Wort (in a word), moglicherweise (perhaps), namlich (that), naturlich (of course)
nicht zu vergessen (not to forget), noch einmal (once again), noch uberraschender (even more surprising)
nur (just), offen gesagt (frankly), offen gestanden (quite frankly), offenbar (probably)
offensichtlich (obviously), richtiger (right), schließlich (finally), schlimmer noch (worse)
selbstverstandlich (naturally), sicher (sure), stattdessen (instead), tatsachlich (actually)
trotz allem (after all), uberhaupt (at all), ubrigens (by the way), und noch (and yet)
vermutlich (probably), vielleicht (perhaps), von mir aus (by me), vorab (in advance)
wahrscheinlich (probably), wie gesagt (as I said), weiters (further), zugegeben (added)
zum Beispiel (for example), zwar (while), zweitens (secondly), -weisefurther (as)
Und schlußendlich hat Max dann das Spiel sogar abgebrochen.(And finally, Max then has even cancelled the game.)
Subordinate Clauses
Spoken language and written language have more differences as it seems at first glance.
Grammar rules of spoken language are weaker than those of written language. For example, if
a sentence contains a subordinating conjunction, for example weil (because), the conjugated
verb must be placed at the post position (e.g., at the end of the subordinate clause). For
example:
Ich gehe schlafen weil ich mude bin.(I go to bed because I am tired.)
The same rules must be followed in sentences with other subordinating conjunctions (see
Table 4.4). However, in spoken language this rule is often ignored. The same sentence may
sound like:
Ich gehe schlafen weil ich bin mude.(I go to bed because I am tired.)
In this case, we may say that the sentence is constructed with the “normal” word order
(e.g., substantive + verb + other members of the sentence). In this work, we analysed
whether speakers with a higher and lower verbal intelligence level differ in using the normal
word order constructing subordinate clauses in their spoken language. For this purpose, the
following features were calculated:

64 4 Features for the Estimation of Verbal Intelligence
• The total number of sentences with subordinate clauses;
• The number of subordinate clauses with the conjugated verb at the end of the clause;
• The number of subordinate clauses with the “normal” word order;
• The length (number of words) of the subordinate clauses.
Past Tense
The German language uses the simple past tense (Imperfekt) and the present perfect tense
(Perfekt) to talk about past events. The simple past tense is more formal and may frequently
occur in books and newspapers:
Alle durften dann zunachst einmal 10 Stunden schlafen und trafen sich beim Fruhstuck mit
dem Professor, der sie nun befragte wie sie sich mittlerweile fuhlten.
(All of them could sleep for 10 hours and then met each other for breakfast with the pro-
fessor who asked them how they felt.)
The present perfect tense is frequently used in spoken language:
Diese Woche habe ich die Galileo-Sendung gesehen.(This week I have watched the Galileo-program.)
In this work, we have compared the usage of Imperfekt and Perfekt in spoken language
of the test persons when they were talking about past events.
Repetitions, Interruptions, Corrections, and Illogical Constructions
When a person is talking about something and is trying to find a suitable expression, he or
she may repeat some words, break his or her thoughts, correct some sentences, and explain
the same idea with other words, for example:
Und der ah der Letzte der hat es dann probiert mit Kaffee.(And the hm the last one tried it with coffee.)
As we may see, in this sentence the speaker repeated der (the) twice and constructed
the sentence illogically. According to the German grammar rules, mit Kaffee (with coffee)
should have been placed before probiert (tried). This sentence was grammatically incorrect.
Let us analyse one other example:
Zwei Manner und eine Frau haben verschiedene Methoden, jeder fur sich, ausprobiert wasam besten funktioniert, fur sich selbst.(Two men and a woman have tried out different methods, each for himself, to determinewhat works best for each of them.)
As we may see, the speaker corrected himself repeating the expression fur sich (for
himself) and trying to better explain the details of the film.
4.1 Analysis of Verbal Behaviour 65
To investigate corrections in spoken utterances of individuals with different verbal in-
telligence, we took into account such sentences where the speaker repeats a certain word
(or a combination of words) wishing to improve his or her spoken utterances. The following
features were extracted:
• Number of phrases and sentences that were corrected by the speaker;
• Correction distance. Correction distance is the distance between a word or a phrase and
its repetition in sentences corrected by the speaker. If we analyse the previous example,
the phrase ausprobiert was am besten funktioniert is placed between fur sich and its
repetition: Correction distance equals to 5;
• Number of sentences with a short correction distance (Correction distance <= 5);
• Number of sentences with a long correction distance (Correction distance > 5).
4.1.4 Semantic Analysis
In this section, we describe a linguistic dictionary that consists of psychological and semantic
categories and was used for the analysis of the monologues and dialogues of speakers with
different verbal intelligence. We describe how the dictionary was created, what its categories
consist of, and explain how it was used for our task.
Working with individuals with a deeply emotional experience, Pennabaker et al. (1986)
found that writing about problems and undesirable situations is somehow related to health
improvements. For a better understanding of this phenomenon, it was necessary to analyse
written samples of such individuals and to find out features that may reflect their emotions
and feelings and to predict the desired psychological state. Manual processing of a significant
number of text samples was time-consuming and required judges’ ratings for obtaining
reliable results. It was necessary to create a software tool for the automatic assessment
of emotional stories along psychology-relevant dimensions. In 1986, Linguistic Inquiry and
Word Count (LIWC) was created [Pennebaker and Beall, 1986].
The English version of LIWC consists of 72 linguistic categories and more than 2300
words (including categories such as pronouns, negations, positive and negative emotion
words, causation, etc.) (Table 4.13).
All the categories from the dictionary may be divided into two large groups consisting
of content words and consisting of style words. Content words (Categories Family, School,
Sport) show what a speaker is talking about; style words (Categories Articles, Prepositions,
Pronouns) show how an individual constructs his or her speech. In the English language,
there are about 500 style words, which is about 0.05% of the whole vocabulary. Each word
from the dictionary may refer to several categories. For example, the word traurig (sad)
refers to the categories Affective processes, Negative emotions, and Sadness.
Wolf et al. (2008) adapted the English version of LIWC for the German language. First,
the authors analysed the equivalence of linguistic categories for the LIWC dictionary trans-
lated into German [Brand et al., 2003]. The authors then collected a corpus of texts presented
in the English and German languages. If the original language of a text was German, it was
translated into English. As a result, the corpus contained 32,278 German and 35,619 English
words. Analysing the text files, the authors found several interesting differences between the
constructions of German and English phrases. For example, German sentences are about
one word shorter than English sentences, contain a greater number of long words (27% vs.

66 4 Features for the Estimation of Verbal Intelligence
Table 4.13. LIWC categories with examples.
LIWC Category Abbreviation Example
Standard linguistic dimensions
Total pronouns Pronouns ich (I), sie (she), ihr (you)
Total first person Self ich (I), wir (we), mich (me)
Total first person singular I ich (I), mich (me), mein (my)
Total first person plural We wir (we), uns (us), unser (our)
Total second person You du (you), Sie (you), dein (your)
Total third person Other sie (she), er (he), sie (they)
Negations Negate nicht (not), ne (no), nein (no)
Assents Assent ja (yes), ok, jaha (yes)
Psychological Processes
Affective or Emotional Processes Affect neidisch (envious), nett (nice)
Positive Emotions Positive aktiv (activ), angenehm (pleasant)
Positive Feelings Posfeel frohlich (bright), Gefuhl (feeling)
Optimism/Energy Optimism gewinner (winner), glauben (to believe)
Negative emotions Negative hassen (to hate), hilfloss (helpless)
Anxiety or fear Anxiety verschreckt (scared), befurchten (to fear)
Anger Anger geargert (angry), lacherlich (ridiculous)
Sadness or depression Sad mude (tired), nutzlos (useless)
Cognitive Processes Cogmech deshalb (bacause), deutlich (clear)
Causation Cause Ergebnis (result), folgen (to follow)
Insight Insight Grund (reason), herausfinden (to find out)
Discrepancy Discrep mussen (must), soll (should), wenn (if)
Inhibition Inhib Aufgabe (task), blockieren (to block)
Tentative Tentative angeblich (supposedly), eigentlich (actually)
Certainty Certain erscheinen (to appear), etwa (circa)
Social Processes Social außern (to express), Leute (people)
Communication Comm Meeting (meeting), meinen (to mean)
Other references to people Othref sein (his), sie (she), uns (us)
Friends Friends Bekannte (acquaintance), freund (friend)
Family Family Vater (father), Großmutter (grandmother)
Humans Humans Individuum (individual), Kind (child), Kerl (guy)
Relativity
Time Time kurz (short), letztens (lately), Mai (may)
Past tense verb Past war (was), machte (made), arbeitete (worked)
Present tense verb Present ist (is), macht (makes), arteitet (works)
Future tense verb Future morgen (tomorrow), werden (will), bald (soon)
Space Space Bezirk (district), breit (wide), dort (there)
Up Up hoch (high), oben (above), auf (on)
Down Down niedrig (low), abwarts (downward)
Inclusive Incl auch (also), zusammen (together)
Exclusive Excl aber (but), ansonsten (otherwise)
Motion Motion gehen (to go), tanzen (to dance)
Personal Concerns
Occupation Occup Sitzung (meeting), Stadtrat (city council)
School School Absolvent (graduate), Akademie (academy)
Job or work Job administrativ (administrative), Angestellter (Staff)
Achievement Achieve Abschluss (completion), Ergebnis (result)

4.1 Analysis of Verbal Behaviour 67
LIWC Category Abbreviation Example
Leisure activity Leisure Fahrrad (bicycle), Fernseher (TV)
Home Home Haus (house), Kuche (kitchen)
Sports Sports Mannschaft (team), Radfahrer (cyclist)
Television and movies TV Reklame (advertising), Schauspieler (actor)
Music Music Schlagzeug (drums), Singer (singer)
Money and financial issues Meney sparen (to save), Steuern (taxes)
Metaphysical issues Metaph Tod (death), traurig (sad), verbrennen (to burn up)
Religion Relig Kirche (church), Kommunion (communion)
Death and dying Death gestorben (dead), vernichten (to destroy)
Physical states and functions Physcal wehtun (to hurt), Wirbelsaule (spine)
Body states, symptoms Body Arm (arm), Bauch (belly), Hand (hand)
Sex and sexuality Sexual kussen (to kiss), Leidenschaft (passion)
Eating, drinking, dieting Eating Snack (snack), Teller (plate), trinken (to drink)
Sleeping, dreaming Sleep aufwachen (to wake up), schlafen (to sleep)
Grooming Groom Haare (hair), makeup (makeup), rasieren (to shave)
Other dimensions
Swear words Swear Bastard (bastard), blod (stupid), dumm (stupid)
Nonfluencies Nonfl hm, mhm, tss
Fillers Fillers sozusagen (so to say), naja (well), tja (tja)
23%), more articles (11% vs. 9%), and fewer prepositions (10% vs. 14%) [Wolf et al., 2008].
While adapting the linguistic categories, the German language peculiarities were taken into
account [Becker, 1988; Schmidt-Atzert and Strohm, 1983]. For example, instead of trans-
lating English prepositions into German, they were directly taken from German linguistic
dictionaries, German lists of emotion words were added to the category Affectation, etc.
In this work, we calculated the number of linguistic categories that occurred in each
monologue and dialogue from the Verbal Intelligence Corpus and analysed whether the
occurrence of these categories may reflect the verbal intelligence levels of speakers.
4.1.5 Stylistic Analysis
In this section, we describe several approaches to analyse the language style of speakers.
These methods are:
• Formality of language;
• Verbal immediacy;
• Cognitive complexity;
• Rationalization;
• Femininity;
• Depression;
• Age;
• Presidentiality;
• Honesty.
We describe the approaches in detail, present lexical peculiarities of each type of style, and
show how these measures may be empirically estimated.

68 4 Features for the Estimation of Verbal Intelligence
Formality of Language
Communications (dialogues between two or more dialogue partners or interactions between
a writer and a reader) may be divided into two categories: high-context and low-context
[Hall, 1976]. Heylighen and Dewaele (1998) provided an example that clearly explains what
these types of communication mean:
“Twins who have grown up together will be able to make themselves understood with a
minimum of explicit communication (high-context), while lawyers in a courtroom need to
formally state all their assumptions, arguments and inferences (low-context)” [Heylighen
and Dewaele, 1998].
High-context communication is also called contextual. Contextual expressions are often
difficult to understand without some additional information (or context) from the previous
sentences of a story or previous pages of a book. This type of communication is possible
when both dialogue partners know each other very well (as in the example with twins) or
have sufficient information about the topic. Contextual expressions usually contain personal
pronouns (he, she, they) and adverbs of time and place (here, there, tomorrow, next week).
When a speaker says I will meet her there, the words her and there have a certain semantic
meaning for a listener.
Low-context communication is called formal. Formal expressions include all information
that is necessary for a reader or a listener to comprehend a story (the 1st of August instead
of today, Ms.Smith instead of she, etc.). Formal language may be indicated by the frequent
use of nouns that requires the richness of the active vocabulary of a speaker.
When deciding which type of language to choose, a speaker should take into account how
much information the listener has about this particular situation. Formal language decreases
possible misunderstanding between a speaker and a listener (writer and reader), and it may
be easier “spread over different groups and cultures”[Heylighen and Dewaele, 1998]. On the
other hand, it is complex and rigid. Contextual sentences are more flexible and shorter than
formal ones. This type of language is frequently used in everyday interactions.
Heylighen and Dewaele (1998) suggested the following empirical measure of formality in
spoken utterances:
F = (Substantives + Adjectives + Prepositions + Articles + Pronouns − V erbs −Adverbs− Interjections+ 100)/2.
Each component of this formula is a relative frequency of the corresponding linguistic
category. For example,
Substantives =Number of substantives
Number of words in the text.
The higher the value F is, the more formal the communication is. For example, in
[Dewaele, 1995] it is shown that the F -measure of informal conversations equals to 44,
the formality of oral examinations is 54, and the formality of written examination is 56.
It was also found that dialogue partners who have a close relationship usually use con-
textual language when communicating with each other.
In this work, the degrees of formality of speakers with different verbal intelligence were
compared with each other.
4.1 Analysis of Verbal Behaviour 69
Verbal Immediacy
According to Mehrabian, verbal immediacy is the “degree of directness and intensity of
interaction between the communicator and referent in a communicator’s linguistic mes-
sage” [Mehrabian, 1966]. Mottet and Richmond (1998) introduced verbal immediacy as
“communication behaviours that reduce psychological distance between people” and “ver-
bal communication that causes us to feel “close” to another person”. The authors inves-
tigated verbal strategies that may be used by speakers for achieving immediate behaviour
in their communications. They asked 355 students to answer questions such as “What
do your friends/peers say that make you feel “closer” to them?” “What do you say that
probably makes others feel more “distant” or “removed” from you?” etc. The students’
answers were classified into 12 verbal categories or “approach/avoidance verbal strategies”
(Personal Recognition, Humour, Ritualistic, Closeness/Inclusiveness, Self-Disclosure, Char-
acter, Willingness to Communicate, Language Appropriateness, Honesty, Complimentary,
Responsiveness, Caring/Appreciation) [Mottet and Richmond, 1998].
According to [Pennebaker and King, 1999; Biber, 1988], verbal immediacy is reflected by
a high level of first-person singular pronouns (ich (I), mich (me)), present tense (geht (goes),
macht (does)), and discrepancies (soll (should), will (want)) and a low level of articles (ein
(a), das (the)) and long words (Sehenswurdigkeit (sightseeing)).
In [Pennebaker and King, 1999], the following linguistic measure of verbal immediacy
was suggested:
Verbal Immediacy = z(I) + z(Present) + z(Discrepancy)− z(Article)− z(LongWords).
Z-score of each feature F is calculated in the following way:
z(Fi) =Fi − µ(F )
σ(F ),
where Fi - is a value of feature F in i-th text file (i = 1, n), n - number of text files taken
for the analysis, µ(F ) = 1n
∑nk=1 Fk, σ(F ) =
√1
n−1
∑nk=1(Fi − µ(F ))2. This formula should
also be used for calculating the z-score for other measures described in this section.
Cognitive Complexity
Cognitive complexity is the ability of individuals to analyse an event or a problem as a com-
bination of simple elements and to identify possible relationships and dependences between
them [Slatcher et al., 2007]. The simpler the elements are and the clearer the connections
between them are, the better solution of a problem may be found. Individuals with higher
cognitive complexity are more flexible in making decisions because of their ability to see
unusual and unstandardised ways and opportunities.
Cognitive complexity was first introduced by [Biery, 1955] in his personal construct
theory. Further, this concept was applied to investigations of personal conversations and
human-computer interactions.
We may conclude that individuals with a high cognitive complexity use simple and clear
words for explaining their thoughts and feelings. Even an inexperienced listener may quickly

70 4 Features for the Estimation of Verbal Intelligence
understand what his or her dialogue partner wants to say independent of the complexity of
the problem under discussion.
According to Pennebaker, cognitive complexity is reflected by a high level of exclusive
words (aber (but), ansonsten (otherwise)), tentative words (eventuell (possibly), hoffen (to
hope)), negations (nein (no), nicht (not)), discrepancies (konnte (could), soll (should)), and
a low level of inclusion words (auch (also), ebenso (alike)).
The cognitive complexity of speech samples may be measured in the following way:
Cognitive complexity = z(Excl) + z(Tentative) + z(Negate) + z(Discrep)− z(Incl).
The calculation of z is shown in the Section Formality of language.
Rationalization
Researchers often consider rationalization as one of the defence mechanisms. It allows indi-
viduals to find an explanation for their behaviour, thus to protect themselves from excepting
difficult situations and making painful decisions. On the other hand, rationalization may
be a positive capability of individuals that helps them to see the core of a problem and
to find a proper solution. This happens when individuals have a positive approach to life
and use their rationalization ability for finding new ideas and applying it to solving real
problems. This ability may also help individuals to participate in discussions: they may find
appropriate explanations or arguments for a certain problem and to be more convincing
than other dialogue participants.
Rationalization includes more causation words (argumentieren (to argue), basis (basis)),
insight words (beenden (to finish), befristen (to restrict)) and fewer negative emotion words
(Arger (anger), aggressiv (aggressive)). It may be measured in the following way:
Rationalization = z(Cause) + z(Insight)− z(Negative),
where z is calculated as shown in the section Formality of language.
Femininity of Language
This linguistic measure was suggested in [Newman et al., 2008]. The authors analysed dif-
ferences between the spoken utterances of men and women using about 14,000 text samples.
The authors found out that women tend to use more references to others and more words
related to positive feelings. On the other hand, negations, prepositions, articles, swear words,
words related to such semantic category as “Money”, numbers, and long words (longer than
six letters1) frequently occur in the speech samples of men. Using these findings, they ob-
tained a measure of the femininity of language. Based on these results, the following measure
of femininity in speech was suggested:
Femininity = z(Other) + z(PositiveFeeling)− z(LongWords)− z(Negate)−
−z(Article)− z(Prepositions)− z(Swear)− z(Money)− z(Numbers).
1 This threshold-value was determined for the English language.
4.1 Analysis of Verbal Behaviour 71
In this work, we considered femininity of language as a peculiarity of speech style. We
extracted this feature from the spoken utterances of both male and female individuals and
analysed whether it is related to their verbal intelligence.
Depression
Rude et al. (2004) investigated whether it is possible to determine individuals who are cur-
rently depressed by analysing their spoken utterances. To find language cues that may reflect
depression, they collected speech samples of 124 students, extracted a number of linguistic
features, and analysed the occurrence of these features for the following groups: individuals
who have already had depression symptoms in their life, who are currently depressed and
have never been depressed [Rude et al., 2004]. Another investigation of depression cues in
language use was made by [Stirman and Pennebaker, 2001]. For their study, they chose
18 poets (nine of them committed suicide) and analysed their poems. They compared the
language style of the texts with the periods of life of the poets when these poems were
written and tried to determine the language peculiarities of individuals who were bent on
self-destruction.
Analysing the results of these investigations, Slatcher et al. (2007) suggested the following
measure of depression:
Depression = z(I) + z(Physical) + z(NegativeEmotions)− z(PositiveEmotions).
It should be noted that our goal was not to determine the psychological and emotional
states of our candidates. We used this feature for analysing the speech style of individuals
with different verbal intelligence.
Age
Analysing speech samples of 3280 speakers, Pennebaker and Stone (2003) found which
linguistic features tend to occur in speech samples of individuals of different ages. Using
these features, they suggested the following measure for determining to what degree the
spoken utterances of an individual are those of a younger or an older person [Pennebaker
and Stone, 2003]:
Age = z(PositiveEmotions) + z(LongWords) + z(CognitiveMechanism) + z(Future)−
−z(I)− z(Past)− z(Time)− z(NegativeEmotions)− z(Social).
We applied this formula to our monologues and dialogues and compared the results with
the verbal intelligence scores of the speakers. Using this measure, we investigated whether
the spoken utterances of higher verbal intelligence speakers are similar to the language of
older individuals.
Presidentiality
In [Slatcher et al., 2007], the authors analysed the language of American presidents in order
to find linguistic features that reflect their presidentiality. The language use of presidents

72 4 Features for the Estimation of Verbal Intelligence
like Franklin D. Roosevelt, Bill Clinton, etc. was compared with the speech samples of males
and females of different ages, social status and educational background. It was found that
presidents tend to use a greater number of articles, prepositions, positive emotions, and
words that are longer than 6 letters:
Presidentiality = z(Articles) + z(Prepositions) + z(PosotiveEmotions) + z(LongWords).
In this work, we investigated whether individuals with a higher verbal intelligence level
have a greater level of presidentiality in their speech than lower verbal intelligence partici-
pants.
Honesty
Honesty is one more feature that was used for analysing the speech style of individuals
with different verbal intelligence. This measure was created by [Newman et al., 2003] after
investigating the speech samples of “liars” and “truth-tellers”:
Honesty = z(Self)+z(Other)+z(ExclusiveWords)−z(NegativeEmotions)−z(Motion).
In this work, we analysed whether this linguistic feature may be related to the verbal
intelligence of speakers and may further be used for classification.
4.2 Analysis of Communication Behaviour
In this sections, we describe approaches that were used for the estimation of the conver-
sational behaviour of individuals. For this purpose, we analysed the flow of dialogues from
the verbal intelligence corpus, the ability of dialogue partners to adapt to each other, and
to control the flow of conversations by demonstrating their dominant behaviour.
In Section 4.2.1, we describe methods that were used for the analysis of the flow of
conversations. These techniques were divided into two groups. The first group includes
measures that indicate the dialogue structure (e.g., sound-silent ratio, number of short and
long pauses, etc.). The second group contains methods for the analysis of dialogue content
(e.g., number of topics initiated by each dialogue partner).
When engaged in a conversation, individuals may change some attributes of their speech
(e.g., vocabulary, sentence structure, speech style, etc.) in order to adapt to the dialogue
partner. This phenomenon was investigated in this work. We analysed how speakers with
different verbal intelligence adapt to each other, by which linguistic and behavioural cues
the adaptation is reflected and how this information may further be used for the classifi-
cation task. For the analysis of adaptation behaviour, we applied the following methods to
the dialogues from the verbal intelligence corpus: Sharing Space in Discussions, Emotion-
Abstraction Patterns and Influence Diffusion Model. We also measured the similarity be-
tween the speech style of dialogue partners (Speech Style Similarity) and the similarity
between their spoken utterances at the conversational and turn-by-turn level. Additionally,
we compared the frequency distributions of certain language cues of dialogue partners. All
these methods are described in detail in Section 4.2.2.

4.2 Analysis of Communication Behaviour 73
For the analysis of the dominant behaviour of dialogue participants, we determined who
among them was the most central and prestigious speaker in the conversations using ap-
proaches from Social Network Analysis. Additionally, the dominant abilities of test persons
were estimated by several judges. The obtained scores were compared with the verbal intel-
ligence of speakers. These techniques are presented in Section 4.2.3.
4.2.1 Flow of Conversations
When engaged in a conversation, speakers may behave in a completely different way. They
may ask questions in order to find a new topic for the discussion, talk about themselves or
some happenings, attentively listen to the other or defend their own position. Depending
on the personality of speakers and its serving purposes, each conversation has its own flow.
For analysing the flow of conversations from the verbal intelligence corpus, we suggest
investigating their structure and content.
The dialogue structure was estimated by measuring the duration of spoken utterances
of individuals and comparing the silent and filled fragments of conversations (for exam-
ple, number of pauses, average length of each turn, etc.). For the analysis of the dialogue
content, we suggested measuring the occurrence of different topics in the discussion (topic
density), their distribution through the dialogue turns (sequential structure), and the ability
of speakers to keep the conversation going by finding new subjects to talk about (partic-
ipation structure). These approaches are described in detail in the following sections. We
also provide several examples in order to explain how these features were extracted from
our conversations.
Dialogue Structure
In this section, we describe features that were used to estimate the structure of the dialogues
from the verbal intelligence corpus. These measures were chosen after becoming acquainted
with investigations of such research studies by Siegman, Pope, Ramsay, Helfrich, and Dahme.
According to the conclusions made by [Siegman and Pope, 1965; Ramsay, 1968], a larger
number of filled and silent pauses usually reflects the introvert behaviour of speakers. Some
other studies connect pauses in speech with the emotional state of speakers: for example,
with anxiety or emotional stability [Siegman and Pope, 1965; Helfrich and Dahme, 1974]. On
the other hand, the number and duration of unvoiced periods may characterize the ability
of individuals to find appropriate words for describing their ideas and thoughts.
To estimate the fluency of conversations between speakers with different verbal intelli-
gence, the following cues were measured:
• Dialogue Length (DL). Dialogue length is calculated by measuring the total duration
of each conversation, including the spoken utterances of both dialogue partners and silent
fragments (pauses).
• Total Speaking Time of each dialogue partner Pi (TSTPi). This measure takes into
account speech fragments of each dialogue partner excluding pauses. Total speaking time
of each participant was normalized by the length of the corresponding conversation.
• Number of Turns. This feature is useful for comparing the dialogues of speakers with
different verbal intelligence to each other.

74 4 Features for the Estimation of Verbal Intelligence
• Average Length of Each Utterance may be calculated by measuring the total du-
ration of a conversation (DL) divided by the number of turns.
• Total Silent Time. This feature is calculated by measuring the length of silent segments
in a conversation. For normalization, it is divided by the total speaking time.
• Number of Short Pauses. We assume that a pause is short if it is shorter than two
seconds. The number of short pauses was calculated not for each dialogue participant
but for each conversation. When two speakers are engaged in a conversation, they both
are responsible for its dynamic. If one of them makes a pause and is thinking about
how to better express his or her ideas and thoughts, the other has an opportunity to
“grab the floor” and to continue the conversation. In this work, the number and the
duration of pauses was compared for different groups of dialogues (for example, for a
group of dialogues between lower verbal intelligence speakers and a group of dialogues
between higher verbal intelligence speakers). A detailed description of such division is
presented in Section 4.4.1. For normalization, the number of short pauses was divided
by the following measures: total speaking time, number of turns, and number of words
in each dialogue.
• Number of Long Pauses. In this work long pauses are silent fragments that are longer
than or equal to two seconds. Long pauses were also used for comparing different dialogues
between each other. We defined that short and long pauses are features extracted at the
dialogical level. As described for the previous measure, the number of long pauses was
also normalized by the total speaking time, number of turns and number of words in
each dialogue.
• Sound-Silent Ratio. This feature is calculated as the total duration of spoken utter-
ances without pauses divided by the duration of all silent pauses in the text.
• Speech Rate. This feature may also be called Speech tempo. It is calculated as the
number of words in the text divided by the total time of speaking.
For a better understanding of each measure, let us have a look at Figure 4.4. In this
figure, a short conversation that consists of 50 words is represented by four rectangle blocks
(one block for each turn). Each block is divided into two parts that correspond to a filled
and silent fragment of the dialogue turn.
Features described in this section are calculated in the following way:
Dialogue Length = 3,5+1,5+3+7+3+6+1 = 25 (sec)
Total Speaking Time of P1 = 3,5+7 = 10,5 (sec)
Total Speaking Time of P2 = 3+6 = 9 (sec)
Average Length of Each Utterance = 25/4 = 6,25 (sec)
Total Silent Time = 1,5+3+1=5,5 (sec)
Number of Short Pauses = 2
Number of Long Pauses = 1
Sound-Silent Ratio = (10,5+9)/5,5 = 3,54
Speech Rate = 50/25 = 2 (word/sec)
Dialogue Content
As described in Chapter 3, our test persons were asked to discuss the education system
in Germany and to express their own opinion about it. However, for many individuals

4.2 Analysis of Communication Behaviour 75
1,5 sec 3 sec1 sec
P1
Turn 1 Turn 2 Turn 3 Turn 4
P2 P1 P2
Filled
fragments
3,5 sec
3 sec
7 sec6 sec
Silent
fragments
Fig. 4.4. Representation of a short conversation between two dialogue partners consistingof four turns.
who participated in our experiment, this topic was just a starting point. In a few minutes,
they began to talk about some other subjects: for example, about new hobbies of their
children or a negative influence of computer games on school performance. These subjects
were somehow related to the main topic (the education system). However, they may be
considered as new themes that occur in a discussion. In this work, we analysed the variety
of topics in a conversation and determined whether it depends on the verbal intelligence
levels of dialogue participants.
A set of topics that were chosen by individuals for a discussion forms the dialogue content.
In this work, we took into account such indicators of the dialogue content as topic density,
sequential structure, and participation structure [Linell and Korolija, 1997]. These cues reflect
such abilities of individuals as keeping the conversation going and finding various topics for
the discussion. In this section, we describe these indicators in detail and explain how they
were extracted from our conversations.
Topic density. The occurrence of different themes in a conversation is called topic
density. It is calculated by measuring the number of topics that were discussed by a dialogue
participant P and dividing it by the number of P ’s words. For calculating the occurrence
of topics in a conversation, we suggested using the LIWC dictionary (which is described in
Section 4.1.4). Each category from the dictionary was considered as a certain theme. If at
least one word from phrases and sentences of a dialogue partner P was found in a linguistic
category A, we assumed that topic A appeared in the conversation.
Sequential structure. This indicator shows how each topic is “distributed” through
the dialogue. For example, one theme may occur at the beginning of a conversation and
lasts two or three turns; in contrast, another theme may appear in almost every turn of
the discussion. For each linguistic category from the LIWC dictionary, we calculated the
number of turns the category was carried over and divided it by the total number of turns.
Participation structure. This measure determines whether each dialogue partner is
engaged in a conversation and tries to find new themes for the discussion. Participation
structure is calculated by measuring the number of topics that were initiated by each dia-
logue participant. In this case, we take into account only new topics that did not occur in
previous turns of the conversation. This measure was divided by the number of words.

76 4 Features for the Estimation of Verbal Intelligence
For a better understanding of each indicator, let us analyse Figure 4.5. In this figure we
show a short conversation between two speakers that consists of four turns. Each turn is
represented by a rectangle block. For each block we show the number of words it consists
of (e.g., the first turn consists of 10 words, the second turn contains 12 words, etc.). Let A,
B, C, D, E and F be linguistic categories that occurred in this conversation.
Dialogue turns
10 wordsP1
12 wordsP2
8 wordsP1
6 wordsP2
Linguistic categories
A
B
C
D
E
F
Fig. 4.5. Representation of a short conversation between two dialogue partners consistingof four turns.
Features described in this section are calculated in the following way:
Topic density of P1 = (4 + 3)/(10 + 8) = 0,38;
Topic density of P2 = (3 + 5)/(12 + 6) = 0,44;
Sequential structure of A = 2 / 4 = 0,5;
Sequential structure of B = 3 / 4 = 0,75;
Sequential structure of C = 2 / 4 = 0,5;
Sequential structure of D = 2 / 4 = 0,5;
Sequential structure of E = 2 / 4 = 0,5;
Sequential structure of F = 1 / 4 = 0,25;
Participation structure of P1 = 5 / 18 = 0,27;
Participation structure of P2 = 1 / 18 = 0,05.
4.2.2 Adaptation Ability
When two speakers are talking to each other, they try to adapt to their dialogue partner and
synchronize their verbal behaviours. The adaptation may occur at different levels: lexical
[Garrod and Anderson, 1987; Brennan and Clark, 1996], syntactic [Reitter et al., 2006],
acoustic [Ward and Litman, 2007], articulation [Bard et al., 2000], comprehension [Levelt
and Kelter, 1982], etc. Moreover, synchronization of dialogue partners at one level may

4.2 Analysis of Communication Behaviour 77
cause the adaptation process at any other level [Pickering and Garrod, 2004; Cleland and
Pickering, 2003].
There exist different approaches for measuring the adaptation of dialogue partners. Reit-
ter et al. (2006) used regression models to show that a speaker in human-human interactions
aligns his or her syntactic structures with those of his or her dialogue partner. Ward and
Litman (2007) modified the measures of convergence offered by Reitter. For their investiga-
tions, a corpus of tutorial dialogues (discussions between a tutor and a student on a certain
problem) was used. According to this modification, “prime words” of the first dialogue part-
ner were determined. To measure lexical convergence, the use of prime words by the second
dialogue partner for each turn was calculated. This approach was also adopted for measuring
acoustic convergence. It was shown that a speaker tends to adjust his vocabulary and the
loudness of his speech to those of his dialogue partner. In [Stenchikova and Stent, 2007], the
prevalence and strength of adaptation were measured using the frequency of occurrence of
different features in a document. In [Nenkova et al., 2008], the measurements of adaptation
between dialogue partners were based on the usage of high-frequency words. Stoyanchev and
Stent (2009) analysed adaptation calculating the number of reused verbs and prepositions
by a speaker that occurred in his or her dialogue partner’s turns.
In this work to estimate to what degree dialogue partners may adapt to each other
when engaged in a conversation, we analysed the co-occurrence rate of certain pronouns
(Sharing Space approach), the proportion of emotion and abstract words in their spoken
utterances (Emotion-Abstraction Patterns), the number of words that were reused from
previous turns (Influence diffusion model) and differences in language style (Speech Style
Similarity approach). The adaptation of individuals to each other was also estimated as
the degree of similarity between their spoken utterances. For this purpose, we compared
their phrases and sentences at the conversational and turn-by-turn levels and calculated
the frequency distributions of certain verbal cues. These approaches are described in the
Sections Similarity at Conversation and Turn-by-Turn Level and Frequency Distributions.
Applying these approaches to the dialogues from the verbal intelligence corpus, we wanted
to check the following hypothesis: both lower and higher verbal intelligence speakers are able
to adapt to their dialogue partners; however, this adaptation is reflected by different linguistic
features.
Sharing Space in Discussions
The method Sharing Space in Discussions determines to what degree individuals engaged
in a conversation are close to each other and estimates “the nature of the relationship”
between two dialogue partners [Spence et al., 1994]. The main idea of this approach is that
if certain pronouns (for example, you and me) are often pronounced in an interaction, the
dialogue partners consider each other in their thoughts and “share” the communicational
space. This means that they are ready to listen to each other and take into account other
opinions and points of view.
Spence at al. (1994) proposed to use the following pairs of pronouns to estimate the
space sharing:
• you and me
• me and you

78 4 Features for the Estimation of Verbal Intelligence
• you and I
• I and you
• us and we
• us and them
• my and yours
Examples of sentences with co-occurring pronouns you - I and me - you are shown in
the following.
Example 1 (you - I): As you mentioned earlier, I also think it’s important to frequently goto the museum.Example 2 (me - you): It is clear to me that you do not like our school system.
The number of such pairs should be divided by the total number of words of the cor-
respondent speaker. This feature is called the co-occurrence rate, CORtrans, and may be
considered as the degree of closeness of speakers engaged in a conversation.
This method was used for the analysis of psychotherapeutic sessions. CORtrans were
calculated for each analytic hour and compared with the patient and analyst behaviour. It
was found that, when a patient uses an increased number of shared pronouns, he or she
feels more understood and the psychotherapist’s interventions become more effective.
For the analysis of CORtrans in [Spence et al., 1994], English speech samples were used.
For our work, we needed an adaptation of this method to our corpus with German texts. In
the German language, pronouns are declined in different cases. For example, ich (I) changes
to mich (me) and mir (me) in the accusative and dative cases respectively. This peculiarity
should be taken into account when measuring CORtrans in our work.
Table 4.14 shows pairs of pronouns that were used in this work to analyse the degree of
closeness of our speakers.
Table 4.14. Pairs of German pronouns that were used for measuring to what degree dialoguepartners were close to each other.
English pairs German pairs
you - me du/ihr/Sie/dir/euch/Ihnen/dich - mich/mirme - you mich/mir - du/ihr/Sie/dir/euch/Ihnen/dichyou - I du/ihr/Sie/dir/euch/Ihnen/dich - ichI - you ich - du/ihr/Sie/dir/euch/Ihnen/dichus - we uns - wirus - them uns - sie/Ihnenmy - yours mein/meins/meine/meiner/meinen/meinem - dein/deins/deine/deiner/
deinen/deinem/Ihr/Ihre/Ihrer/Ihren/Ihrem/Ihres/eure/eures/eurer/euren/eurem
In this work, CORtras were calculated for dialogue partners from different verbal intel-
ligence groups. We also took into account whether speakers who were engaged in a conver-
sation knew each other very well (for example, were relatives or friends) or had not met
each other previously. We refer to such speakers as strangers. We analysed whether verbal

4.2 Analysis of Communication Behaviour 79
intelligence may help speakers who did not know each other very well to feel free during
their conversations and to be open to their dialogue partners. Friendship implies emotional
closeness. When two friends are talking to each other, they are usually responsive to the
thoughts and feelings of each other. This means that CORtrans of dialogue partners who
knew each other very well should be high and not depend on their verbal intelligence scores.
Emotion-Abstraction Patterns
The approach Emotion-Abstraction Patterns was developed for the analysis of conversations
between a psychotherapist and a patient. It was found that the occurrence of emotion and
abstract words in psychotherapeutic dialogues is an indicator of a successful treatment
[Mergenthaler, 1996; Walter, 2008].
The occurrence of emotion words in the spoken utterances of a patient is important
because talking about positive and negative feelings is a central point in psychotherapy.
Moreover, emotion words in speech (or emotional tone (ET) of a text [Anderson and Mc-
Master, 1986]) may help to indicate whether a patient is open enough for further therapy.
On the other hand, successful psychotherapeutic dialogues should also be constructive. This
may be indicated by the frequent occurrence of abstract words in a conversation. A detailed
description of abstract words (AW) is given in Section 4.1.2.
The proportions of emotion and abstract words in a psychotherapeutic session is called
emotion-abstraction patterns. They reflect different psychological states of a patient and
may characterize the course of therapy (Figure 4.6) [Lepper and Mergenthaler, 2007]. The
emotion-abstraction patterns are:
Time
Emotion Tone
Abstraction
Relaxing Experiencing Connecting Reflecting Relaxing
Therapeutic Cycle
Fig. 4.6. Emotion-abstraction patterns ([Mergenthaler, 1996]).
• Pattern Relaxing (low ET and low AW): a phase where a patient is relaxed and may
describe some events preparing himself for a deeper conversation.

80 4 Features for the Estimation of Verbal Intelligence
• Pattern Reflecting (low ET and high AW): a patient is reflecting his or her own experience
using logic and intellect.
• Pattern Experiencing (high ET and low AW): a patient is talking about difficult or
negative situations that may be painful for him or her.
• Pattern Connecting (high ET and high AW): this phase is a ’key moment’ of a psy-
chotherapeutic session. A patient understands his or her emotions and is able to reflect
his or her own experience.
Emotion-abstraction pattern is a method that was used in a number of studies for de-
termining key moments of psychotherapeutic sessions [Mergenthaler, 1996, 1998b, 2000;
Walter, 2008].
In this work, we also analysed emotion-abstraction patterns in dialogues between our
test persons. We hypothesized that individuals with a higher verbal intelligence level were
open to each other when discussing a certain problem and tried to make their conversations
constructive. This may be indicated by a frequent usage of emotion and abstract words
(connecting pattern).
For the analysis of discussions, we used the software tool CM (Cycle Model) (Figure
4.7). CM splits analysed texts into short segments. By default, each segment consists of 200
words, but CM allows a user to change this value to any preferable one. The tool calculates
the number of emotion and abstract words, analyses their proportion, and determines an
emotion-abstraction pattern for each text segment. CM may analyse texts in English and
German languages [Mergenthaler, 1998a].
Fig. 4.7. CM Software.
For the analysis, the following features were extracted:

4.2 Analysis of Communication Behaviour 81
• Number of blocks: Number of text segments of 200 words;
• Emotion words: Number of emotion words in each text segment divided by the number
of all words;
• Abstract words: Number of abstract words in each text segment divided by the number
of all words;
• Emotion-Abstraction patterns: For each word block it was determined whether it
has a Relaxing, Reflecting, Experiencing or Connecting pattern.
Influence Diffusion Model
The Influence diffusion model (IDM) estimates to what degree the choice of words of a
speaker is influenced by other participants in a conversation. Ohsawa et al. (2002) suggested
the following definition of IDM: “The influence of a subject (a comment, person, or term)
to the community is measured by the sum of influence diffused from the subject to all other
members of the community”. Influence “diffuses along the comment-chain by medium of
terms, i.e., words or phrases” [Ohsawa et al., 2002].
In a conversation, each turn may be considered as a reply or a comment of a speaker
to previous turns. In other words, each turn is influenced by thoughts and ideas that have
already been expressed during the dialogue. The degree of this influence is measured as the
averaged number of words that were reused from the previous turn. The influence diffusion
measure is the sum of influence degrees for each turn.
For a better understanding of the influence diffusing process, let’s analyse a short con-
versation between two dialogue partners P1 and P2 (Figure 4.8).
P1: What do you think about our school system?
P2: I don’t know. I think it is not that good.
P1: Why?
P2: Why? Because if a child is in the fourth grade, one cannot exactly estimate hisabilities... ahm... at so young ages.
P1: But children always may change to secondary school if their abilities become better.
Fig. 4.8. Influence diffusing process.
As we may see, P2 reuses 1 word think in his first turn and 1 word why in his second turn.
The measure of his influence diffusion is: 1/10 + 1/21 = 0.14. Then, the influence diffusion
measure of P1 is 1/13 = 0.07.
We hypothesize that the spoken utterances of higher verbal intelligence individuals are
less affected by the speech of other dialogue partners than of lower verbal intelligence speak-
ers. If higher verbal intelligence speakers are involved in a conversation, they choose words
from their own active vocabulary instead of repeating those that were pronounced by the
others in previous turns.

82 4 Features for the Estimation of Verbal Intelligence
In this work, we also used a slightly modified measure of the influence diffusion model.
It was calculated as the number of repeated nouns and adjectives by a speaker P1 from his
or her dialogue partner P2 divided by the total number of P1’s words [Sillars et al., 1997].
Speech Style Similarity
Measuring speech style similarity for estimating the adaptation abilities of individuals was
suggested in [Ireland and Pennebaker, 2010]. The researchers asked a number of college
students to write down their answers to some questions, analysed the obtained text samples,
and investigated to what degree the writing style of individuals was similar to the style of
questions. They showed that students followed the language styles of written questions,
determined linguistic categories that reflect differences in the speech style of individuals
(e.g., pronouns, auxiliary verbs, conjunctions, etc.) and suggested measuring “language style
matching” (LSM) for each linguistic category in the following way:
LSM(Ci) = 1− |Ci1 − Ci
2|(Ci
1 + Ci2 + 0.001)
,
where Ci is a ith linguistic category that was chosen for the analysis, i = 1,K; Ci1 is the
percentage of the ith category (for example, percentage of pronouns) in the first text file
and Ci2 is the percentage of the ith category in the second text file.
The final LSM measure was calculated as the average value among the LSM(Ci) scores:
LSM =
∑Ki=1 LSM(Ci)
K.
In this work, we suggested applying the Speech Style Similarity approach to the conver-
sations from our corpus for measuring to what degree dialogue participants with different
verbal intelligence adapted to each other. For this purpose, the similarity between speech
styles of dialogue participants using the LSM measure was calculated. Linguistic categories
that were chosen for the analysis are presented in Table 4.15 ([Ireland and Pennebaker,
2010]).
Table 4.15. Linguistic categories that were used for LSM calculations.
Category Examples
Personal pronouns ich (I), ihr (her), sein (his)Impersonal pronouns es (it), man (it)Auxiliary verbs werden (will), habe (have), sein (be)Adverbs with high-frequency sehr (very), nur (just), etwas (some)Prepositions in (in), auf (on), zwischen (between)Conjunctions und (and), weil (bacause), aber (but)Negations nicht (no), nie (never)Quantifiers viel (many), wenig (few)Articles der (the), ein (a)

4.2 Analysis of Communication Behaviour 83
Similarity at Conversational and Turn-by-Turn Level
This approach was suggested by [Niederhoffer and Pennebaker, 2002] for measuring to what
degree each dialogue partner reuses words and expressions of the other. The authors in-
vestigated different dyadic conversations and presented a statistical evidence of linguistic
adaptation of speakers to each other. The analysis was performed at the conversational and
turn-by-turn level. In this work, we applied these methods for the analysis of conversations
between speakers with different verbal intelligence.
Conversational Level
For the analysis of the adaptation of dialogue partners to each other at the conversational
level, all the features extracted from the conversations (features that reflect complexity of
texts at different linguistic levels, speech style measures, topic coherence indicators, etc.)
were used. Let P1 and P2 be dialogue partners that were engaged in a conversation j. Let
F be a vector of features that were extracted from the dialogues. Then Fij(P1) is a feature
i that was extracted from the spoken utterances of the first speaker of a dialogue j and
Fij(P2) is a feature i that was extracted from speech of the second dialogue participant.
Adaptation at the conversational level was estimated by calculating the Pearson correlation
coefficient between linguistic cues of the dialogue partners across the dialogues.
Turn-by-Turn Level
In this type of analysis, we took into account the occurrence of linguistic features (de-
scribed in this work) in each conversational turn. The Pearson correlation coefficient was
calculated between the k − th dialogue turn of P1 and the k − th dialogue turn of P2 and
also between the k− th dialogue turn of P1 and the (k+ 1)− th dialogue turn of P2, where
k = 1,K, K - number of turns in the dialogue. Let us denote by R1 and R2 these two cor-
relation coefficients. Using R1 and R2, the following measures were calculated [Niederhoffer
and Pennebaker, 2002]:
Mean Turn R =R1 +R2
2,
Max Turn R = max{R1, R2}.
Mean Turn R and Max Turn R were calculated for each linguistic category used in this
work and compared with each other for the dialogues from different verbal intelligence
groups.
Frequency Distributions
Applying this approach to the dialogues from the verbal intelligence corpus, we again as-
sumed that if two dialogue partners adapt to each other during a conversation, the similarity
between their utterances should be high. For measuring the similarity between phrases and
sentences of individuals engaged in a conversation, we suggested comparing the frequency
distributions of certain linguistic features (tokens) extracted from the dialogue.
For comparing the frequency distributions, the chi-square test was chosen because it does
not require the normality of distributions and is easy to implement. A detailed explanation
of this method may be found in [Vogel and Lynch, 2007; Straker, 2012].

84 4 Features for the Estimation of Verbal Intelligence
Let Fi and Fj be two text files containing ni and nj tokens correspondingly. If Fi and Fj
have the same language style, we consider the texts to be taken from the same population
and the distributions of tokens from the two files should not be significantly different (null
hypothesis). The chi-square statistic is calculated based on the observed and expected values
of tokens in both text-files. If the chi-value χ2i is less than a certain significance threshold c2i
(based on the degrees of freedom and significance level), the null hypothesis is accepted and
the two files may be considered as having a similar language style (making an assumption
that the language style is reflected by tokens of this type). For estimating the degree to
which the two texts are similar, we calculate the distance between these two values:
Similarityi = Si = χ2i − c2i .
If −c2i <= Si <= 0, the similarity between the texts is significant. If Si > 0, the null
hypothesis is rejected: the analysed texts have different language styles.
In this work four different types of tokens were used:
• Letter n-gram distributions.
• Word n-gram distributions.
• Lemma n-gram distributions. At first we analysed all the lemmas which occurred in the
dialogue turns of the test persons. In the following chapter we refer to this feature as
Lemma (Type 1). For taking into account that we work with spoken language, which may
contain broken words, unfinished phrases, and paralinguistic expressions (like ah, hmm,
etc.), for dialogue analysis we used only lemmas which correspond to the following parts
of speech: nouns, pronouns, verbs, adverbs, prepositions, conjunctions, interjections, and
articles. Such lemmas may be more important for reflecting language style matching.
Let’s refer to this feature as Lemma (Type 2).
• Part-of-speech n-gram distributions. At first we analysed n-gram distributions of all parts
of speech that occurred in the dialogues (Part-of-speech (Type 1)). Secondly, n-grams
were calculated only for parts of speech mentioned in the previous item (Part-of-speech
(Type 2)).
4.2.3 Ability to Dominate
When engaged in a conversation and trying to keep it going, one of the dialogue partners
may show a higher level of engagement than the other. For example, he or she may suggest
more interesting topics for the discussion or find more convincing arguments than other
participants. Such speakers are usually able to construct a dynamic conversation, find ap-
propriate questions, and “invite” other participants to more actively express their ideas and
thoughts. In other words, we may say that one of the dialogue partners may demonstrate
his or her leadership position and dominant behaviour in a discussion.
Dominance is a typical social behaviour explicitly shown by humans in group conversa-
tions, meetings, and gatherings [Dunba and Burgoon, 2005]. Psychologists describe dom-
inance as a behavioural expression to seek attention, influence the others, and to assert
authority. Dominance may be viewed as either a personality trait, i.e., the personal ten-
dency to influence the others, or it may also be used to describe the role of a person in a
group, i.e., group hierarchy [Mast, 2002]. A person is dominant when his or her attempts to
assert control and authority are accepted by the partners in an interaction [Rogers-Millar
4.2 Analysis of Communication Behaviour 85
and Millar, 1979]. Such kinds of situations may contribute either positively or negatively to
the discussion. Positive contributions comprise of actions such as keeping the conversation
going, task orientation, taking quick decisions, making conclusions, etc. Negative contribu-
tions may include not giving enough space to others to express their ideas, disturbing the
team work, not being open to criticism, expressing power verbally or physically, which may
be found offensive and unjustified by other interaction partners.
Many approaches exist for identifying dominant behaviour in social interactions. In a
conversation, dominance can be conveyed through verbal and nonverbal behaviour. Nonver-
bal cues include, for example, facial expression, gaze, smiling frequency, body intensity/re-
laxation, shifting posture, body composure, relative percentages of looking while speaking
and looking while listening, etc. [Buller et al., 1984; Dovidio and Ellyson, 1982; Dunba
and Burgoon, 2005]. Several studies showed that nonverbal cues such as speaking dura-
tion, speaking intensity, pitch and voice control are important factors in the perception of
dominance [Cashdan, 1998; Burgeon and Hoobler, 2002].
Verbal cues include criticism, suggestions, demands, reasoning, ignoring, etc. However, it
is very difficult to automatically measure such features, and their perception highly depends
on the context of the interaction. That’s why most investigations of dominance are based
on nonverbal features. For example, Rienks and Heylen (2006) used nonverbal features
such as number of interruptions, number of questions asked, number of words spoken, etc.,
to estimate the dominance in conversations and reached an accuracy of 75% [Rienks and
Heylen, 2005a]. Jayagopi et al. (2009) showed that, by using nonverbal audio and video cues,
it is possible to estimate the dominant behaviour of individuals in groups [Jayagopi et al.,
2009]. They used features such as total speaking energy, visual activity, total visual activity
length, total visual activity turns, etc. They concluded that, by using different combinations
of these features, it is possible to estimate dominant behaviour in conversations with up to
91.2% using supervised models for classification and 85.3% using unsupervised models.
In [Goethals et al., 2004], it was concluded that “leaders are likely to be more intelligent,
but not much more intelligent than the people they lead.” A leader has the ability to
communicate effectively, to get dialogue partners round to his or her way of thinking, and
make them think that he or she is right. These abilities are based on language proficiency
and accuracy related to a high verbal intelligence.
In this section, we present methods that were used in this work for the analysis of the
dominant behaviour of individuals with different verbal intelligence. At first, we described
an approach for determining “centrality” and “prestige” of each individual engaged in a
conversation. This approach is based on representing each dialogue as a directed graph and
investigating its dependencies using the graph theory. Applying this method to our con-
versations, we assumed that dominant speakers should be the most central and prestigious
persons in a conversation. The greater the value of centrality and prestige of a speaker,
the better he or she may demonstrate the leadership position and influence the flow of the
dialogue.
Another approach presented in this section is based on dominance estimations by human
judges. Three judges were asked to listen to the dialogues from the verbal intelligence cor-
pus and to estimate the dominance of each dialogue participant using a special scale. The
obtained scores were compared with the verbal intelligence of the dialogue participants.

86 4 Features for the Estimation of Verbal Intelligence
Centrality and Prestige
Methods described in this section are taken from Social Network Analysis. Social Network
Analysis may be applied to any group of objects, e.g., participants in a conversation, work-
ers at a firm, departments at a university, collaborating companies, etc. Its main idea is
representing such a group as a directed or undirected graph and applying different methods
of graph theory to it in order to understand dependencies between the objects and processes
inside the group. In such a graph the nodes correspond to the objects and the ties show the
relationships between them.
In this work, Social Network Analysis was applied to the dialogues of the verbal intel-
ligence corpus. Features that were extracted from the conversations were Centrality and
Prestige. These features helped us estimate the importance of each dialogue participant in
a discussion and his or her role in keeping it going.
For applying Social Networks, each conversation was presented as a directed graph. The
nodes of the graph correspond to the dialogue participants (or “actors”, as defined in the
Social Network theory). Ties between the nodes represent communication of the partic-
ipants with each other. For example, if a speaker P1 addresses another speaker P2, the
corresponding nodes of the graph are connected by a directed tie that comes from P1 to P2.
For a better understanding, let us analyse the following dialogue (Figure 4.9).
P1/ I am not sure about advantages of our school system. I think disadvantages are that wehave three different types of school.P2/ HmmP3/ I also see it as a disadvantage that we have this separation.P2/ YesP1/ Junior high school, high school...P3/ Yes, you never know which criteria they use for selecting the children. This means thatonly the teacher makes the decision.P2/ No, the teacher makes only a recommendation.P1/ He makes a recommendation, exactly.P2/ It looks like that.
Fig. 4.9. An example of a dialogue between three actors.
Taking into account the order of the speakers, we may present the dialogue as a directed
graph (Figure 4.10). From the dialogue we may see that P2 starts talking twice after P3 and
twice after P1. This order is represented in Figure 4.10 by two ties directed from P1 to P2
and two ties directed from P3 to P2. Analogically, ties directed to P1 and P3 represent the
order of these dialogue partners in the communication. This communication may also be
represented by a sociomatrix shown in Table 4.16.
We will further refer to this matrix to explain the measures of actor degree centrality,
actor closeness centrality, group degree centrality and actor degree prestige.
Actor Degree Centrality
Centrality is a measure that shows to what degree each dialogue partner is involved in a
conversation. A dialogue partner is “central” in a conversation if he or she is “extensively
involved in relationships with other actors” (or dialogue partners). The measure of centrality

4.2 Analysis of Communication Behaviour 87
P1 P2
P3
Fig. 4.10. The three dialogue partners (actors) and the directed lines between them thatrepresent the order of the actors in the communication.
Table 4.16. The sociomatrix for the communication represented in Figure 4.9.
P1 P2 P3
P1 0 2 1P2 2 0 1P3 0 2 0
reflects the importance of each participant in a conversation and shows whether he or she
is active when talking to the others. In terms of graph theory, the centrality index of a
dialogue partner Pi is the sum of the ties that are sent from Pi. We may say that the central
speaker is represented by the node with the greatest number of ties directed from it. The
Degree Centrality is measured in the following way [Proctor and Loomis, 1951; Shaw, 1954]:
CD(Pi) =
∑g−1j=1 xij
g − 1,
where xij is an element of the sociomatrix, g is the number of dialogue participants.
If we analyse the graph in Figure 4.10 and its sociomatrix, we will see that CD(P1) = 1.5,
CD(P2) = 1.5 and CD(P3) = 1, e.g., the first and the second speakers have the highest value
of centrality and are the most active participants of the conversation.
Group Degree Centralisation
Using the centrality measure of each dialogue participant, we may obtain the degree
of graph centralization. Using this measure, we were able to compare the conversations
between each other and to determine the level of verbal intelligence of speakers of the most
centralized dialogues.
This measure is calculated in the following way
CD =
∑gi=1[CD(P ∗)− CD(Pi)]
max∑g
i=1[CD(P ∗)− CD(Pi)],
where CD(Pi) is the degree centrality of an actor i, CD(P ∗) is the largest measure of the
actor degree centrality in the conversation.
Prestige
A dialogue partner is prestigious if he or she is frequently addressed by other partici-
pants of the conversation [Wasserman and Faust, 1994]. Prestige of a dialogue partner Pi

88 4 Features for the Estimation of Verbal Intelligence
is measured as the sum of the ties that are received by Pi. In Figure 4.10, PD(P1) = 2,
PD(P2) = 4 and PD(P3) = 2.
Prestige shows how often a dialogue partner P is being addressed by other dialogue
participants (for example, is being asked a question or being referred to during the con-
versation). In this case, it does not matter how many times P addresses the others. This
measure shows whether P is considered to be prestigious by the other participants of the
conversation:
PD(Pi) =
∑g−1j=1 xji
g − 1.
All the features described above were extracted from the dialogues. As shown in Chap-
ter 3, all the conversations collected during the study were dyadic, e.g., two dialogue partners
were engaged in it. In this case, the social network analysis does not make any sense. The
dialogue partners talk after each other and the measures of centrality and prestige will be
equal. That is why we decided to consider the dyadic conversations as a communication
between three participants: the first dialogue partner, the second dialogue partner, and the
pause. It does not matter whether a pause occurs between dialogue turns or one of the
speakers stops talking in order to find appropriate words for expressing his or her ideas. If
we represent such a dialogue as a directed graph, we would obtain three nodes: two for the
speakers and one for the pause. Each time when a silent fragment appears in the conver-
sation, we assume that the third dialogue partner, the Pause, “is talking” at this moment
and should put a tie directed to the corresponding node.
Such a representation of the dialogues allowed us to extract all the features described in
this section and compare them to the verbal intelligence scores of the speakers.
Dominance Estimation
Adaptation of individuals engaged in a conversation may happen at different levels: verbal,
nonverbal, emotional, etc. If dialogue partners are interested in keeping the conversation
going, they try to understand the point of view of the other and react in a certain way.
On the other hand, trying to influence the opinion of the other and to find convincing
arguments, speakers may demonstrate their leadership position in a conversation.
Appropriate phrases may help a person to start a smooth conversation with his or her
dialogue partner and to keep it going for a long time. Life experience, educational back-
ground, richness of vocabulary, and the ability to clearly express thoughts and feelings allow
a speaker to be a leader in a conversation. According to [Goethals et al., 2004], the verbal
intelligence of a speaker and his or her dominant behaviour in a conversation depend on
each other.
For the analysis of dominance of our test persons, three judges were asked to estimate
the dominant behaviour of each dialogue partner using a 10-point scale (1 means that a
test person wasn’t dominant at all, 10 means that a test person was very dominant). For
this purpose, each judge was asked to listen to the conversations from the verbal intelligence
corpus and to fill in a questionnaire. The questionnaire is presented in Figures 4.11 and 4.12.
As we may see, the questionnaire consists of seven questions. It also contains the first
phrases of the dialogue partners so that a judge may determine who of them is the first
speaker (P1) and the second speaker (P2). The judges were asked to estimate who of the

4.2 Analysis of Communication Behaviour 89
Dialogue (10_18.wav)
P1: okay so I think our school system is very good
P2: me not
….
Q 1- Please choose the best answer according to your observations.
P1 has dominance
in the conversation
P1 is a little bit more active
in the conversation
P1 and P2 are both active
in the conversation
P2 is a little bit more active
in the conversation
P2 has dominance in
the conversation
Q 2- Please indicate how confident you feel estimating the dominance.
0 means not confident at all, 10 means very confident.
Q 3- Please give a dominance score for each dialogue participant (choose the appropriate number):
P1:
0 means not dominant at all, 10 means very dominant
P2:
0 means not dominant at all, 10 means very dominant.
Q 4- Please choose the best answer according to your observation.
The participants do not know each other at all.
The participants know each other a little bit.
The participants know each other very well (Friends, Relatives).
0 1 3 4 5 6 7 8 92 1 00 1 3 4 5 6 7 8 92 1 0
0 1 3 4 5 6 7 8 92 1 00 1 3 4 5 6 7 8 92 1 0
0 1 3 4 5 6 7 8 92 1 00 1 3 4 5 6 7 8 92 1 0
Fig. 4.11. Questionnaire for dominance estimation (Part 1).
dialogue participants was more active in the conversation, to what degree each of them
expressed dominant behaviour (using a 10-point scale) and by which verbal and nonverbal
cues this behaviour was reflected. The obtained information was compared with the verbal

90 4 Features for the Estimation of Verbal Intelligence
Q 5- Please choose the forms of behavior by each dialogue participant that you observed.
You may choose more than one feature.
P1 P2
Talkative
Silent
Active/Dynamic
Less Active/ Passive
Aggressive
Meek
Q 6- Please write down any other attributes of the speakers you observed or noticed (if possible).
E.g., if a person is sad, happy, warm, sounds to be more involved in the conversation, talks a lot but
not to the point, talks little but to the point, is open for criticism on his ideas, does not like to be
criticized, etc.
Q 7- Please mention some criteria on basis of which you think a certain person dominated the ranking,
i.e., he/she is more intelligent, sounds more confident than the other person, etc.
Fig. 4.12. Questionnaire for dominance estimation (Part 2).
intelligence of speakers. The experiments that were performed for the analysis of dominance
of the candidates are described in Section 5.2.1.
4.3 Information Retrieval Approaches
Information retrieval (IR) research suggests that words work well as representation units.
The applicability of such a sub-area of IR as text categorization (TC) techniques has sig-
nificantly grown in recent years. Organizing news by subject topics (e.g., to disambiguate
information and to provide readers with greater search experiences) or papers by research
domains (e.g., for large databases of information that need indexing for retrieval) are just
some of the most popular examples. Moreover, Security (e.g., analysis of plain text sources
such as Internet news), Biomedical (e.g., indexing of patient reports in health care organiza-
tions according to disease categories) or Software (e.g., for tracking and monitoring terrorist
activities) domains also have benefit from these techniques.

4.3 Information Retrieval Approaches 91
New domains, like Marketing (e.g., analytical customer relationship management) or
Sentiment analysis (e.g., analysis of movie reviews), start using text mining solutions. In
this work we applied these techniques to the estimation of speakers’ verbal intelligence.
For TC, every document has to be transformed into a representation which could be
suitable for learning algorithms and classification tasks. As reviewed in [Miao and Kamel,
2011], most TC algorithms are based on the vector space model (VSM). TC state-of-the-art
systems widely apply the VSM approach [Baeza-Yates and Ribeiro-Neto, 1999; Vinciarelli,
2005; Miao and Kamel, 2011].
In this work we used TF-IDF measures of each word for representing each monologue as
a feature vector suitable for further classification. In this section we describe this approach.
4.3.1 TF-IDF based Approaches
In VSM, each document in a corpus is represented by a list of words (i.e., bag of words).
Each word is considered as a feature; the value of the feature is a weight transformation
of the number of times the word occurs in the document (i.e., word’s frequency). Thus, a
document is represented as a feature vector and its relevance to a query submitted by a user
is measured through appropriate matching functions.
These matching functions are typically based on statistical measures, like TF-IDF, that
basically weight the importance of each word. The importance of a word increases propor-
tionally to its frequency within a document but is offset by its frequency within a corpus.
Variations of this TF-IDF weighting scheme are often used by search engines as a central
tool in scoring and ranking a document’s relevance given a user query.
TF-IDF is a common feature transforming or weighting function. The term count, ni,j ,
denotes the frequency of a given term ti in a given document dj . This count is usually
normalized to prevent a bias towards longer documents. Thus, the term frequency tfi,jmeasures the importance of a term ti within a document dj and is defined as follows:
tfi,j =ni,j∑k nk,j
, (4.1)
where the denominator is the number of words in a document dj , that is, the size of the
document |dj |.The inverse document frequency idfi is a measure of the general importance of a term:
idfi = log|D|
{j : ti ∈ dj}, (4.2)
where |D| is the total number of documents in the corpus, {j : ti ∈ dj} is the number of
documents where the term ti appears (i.e., documents for ni,j 6= 0).
The feature weighting function is then computed by using the following formula:
tfidfi,j = tfi,j · idfi. (4.3)
These weights show the importance of the words in each document. As we may see, more
frequent terms in a document are more representative and, if the number of documents in
which this term occurs increases, this term becomes less discriminative.

92 4 Features for the Estimation of Verbal Intelligence
At this point, we may view each document as a vector that contains terms and their
corresponding weights. For those terms from the vocabulary that do not occur in a docu-
ment this weight equals to zero. In the following sections we show the advantage of such a
document representation.
4.4 Feature Selection
In this chapter, we have described approaches that were applied to the monologues and
dialogues for verbal intelligence estimation. These approaches were divided into two groups.
Methods of the first group (linguistic and computational analysis) were used to investigate
the verbal and communication behaviour of speakers. Methods of the second group are
based on IR approaches. According to these methods, each text file is represented as a
feature vector where each term is a feature. The value of each feature is calculated using
the TF-IDF weighting scheme. As a result, a certain number of cues that may indicate
the verbal intelligence of individuals were extracted. For obtaining satisfactory classification
results, only the most informative cues should be used for the classification. In this section,
we describe approaches that were applied to the extracted features in order to determine
the most informative ones (e.g., features that reflect the verbal intelligence of speakers).
At first all speakers from the corpus were divided into several clusters according to their
verbal intelligence levels. These clusters are presented in Section 4.4.1. Features from the
first group that indicate the verbal and communication behaviour of speakers were compared
with each other using a one-way analysis of variance (ANOVA) (Section 4.4.2). Based on
the ANOVA results, we investigated to what degree each linguistic and communication
cue reflects the verbal intelligence of speakers. For determining the optimal combination
of features that provides satisfactory classification results, we applied the following feature
selection methods to the extracted features: Information gain ratio (IGR), V2-Test and
Genetic algorithm (GA) [Grimbleby, 1999; Wasserman and Faust, 1994]. In Section 4.4.3, we
present methods that were applied to the monologues and dialogues that were represented as
feature vectors. We selected the most representative terms based on their TF-IDF measures
and used them for the classification task.
4.4.1 Clustering of Text Files
For the analysis of features that were extracted from the monologues and dialogues, our test
persons were divided into several groups. Each group (or cluster) contains individuals with
similar verbal intelligence levels. To obtain these clusters, the k-means algorithm, which is
frequently used for data clustering in machine learning, was applied on the scaled scores of
the test persons (Figure 4.13).
Clusters that were used in this work are described in detail in this section.
Clustering 1
Using the k-means algorithm (k = 2), the verbal intelligence scores of the test persons
were partitioned into two clusters:
• L is a cluster that consisted of test persons with a lower verbal intelligence level;
• H is a cluster that contained candidates with a higher verbal intelligence level.

4.4 Feature Selection 93
K-means
1PCluster
2PCluster
KPCluster
K
...
Sum of Scaled Scores6
11
i
ix
6
12
i
ix
6
1i
iNx
Fig. 4.13. The K-means algorithm.
Clustering 2
The k-means algorithm was also used to partition the test persons into three clusters
(k = 3). In this case, it was taken into account that there may exist one more cluster which
may contain test persons with average verbal intelligence scores:
• L - lower verbal intelligence cluster;
• A - average verbal intelligence cluster;
• H - high verbal intelligence cluster.
Clustering 3
Using the two clusters L and H, all the dialogues were partitioned into the following
groups:
• L-L is a group of dialogues where both partners had lower verbal intelligence scores;
• H-H is a group of dialogues where both partners had higher verbal intelligence scores;
• L-H is a group of all the other dialogues.
Clustering 4
Using the information about the level of acquaintance of the dialogue partners, the
following groups were created:
• F-F is a group of dialogues with dialogue partners who were friends or relatives;
• S-S is a group of dialogues with dialogue partners who had not met each other before
the experiment (were strangers).
Clustering 5
In this type of clustering, we used only information about the levels of verbal intelligence
of dialogue partners (H and L from Clustering 1) to obtain new groups or subclusters (these
new groups will be denoted by Type A, B, C or D as shown in Figure 4.14):
• Type A: the first subcluster contains test persons with a higher verbal intelligence level
if they talked to lower verbal intelligence test persons; the second subcluster contained
participants with a higher verbal intelligence level if they carried out discussions with
higher verbal intelligence participants. Let us denote these groups by H(L)-H(H).
• Type B: the first subcluster contained test persons with a lower verbal intelligence level
if they talked to test persons with a lower verbal intelligence level; the second subcluster
contained participants with a lower verbal intelligence level if they were engaged in a
discussion with higher verbal intelligence participants. Let us denote these subclusters
by L(L)-L(H).

94 4 Features for the Estimation of Verbal Intelligence
Experiment 1
lower VI lower VI lower VI Experiment 2
higher VI higher VI
Experiment 3 lower VI higher VI
Experiment 4 lower VI higher VI higher VI
Variable 1 Variable 2
ANOVA
lower VI
lower VI lower VI
higher VI
higher VI
higher VI
Type A
lower VI lower VI lower VI Type B
higher VI higher VI
Type C lower VI higher VI
Type D lower VI higher VI higher VI
Sub-Cluster 1 Sub-Cluster 2
ANOVA
lower VI
lower VI lower VI
higher VI
higher VI
higher VI
Fig. 4.14. ANOVA experiments.
• Type C: the first subcluster consists of higher verbal intelligence test persons if their
dialogue partners were lower verbal intelligence speakers; the second subcluster consists
of lower verbal intelligence test persons if their dialogue partners were lower verbal in-
telligence speakers (H(L)-L(L)).
• Type D: the first subcluster consists of lower verbal intelligence participants if they talked
to higher verbal intelligence partners; the second subcluster consists of higher verbal
intelligence speakers if they talked to higher verbal intelligence partners (L(H)-H(H)).
4.4.2 Determining the Significance of Linguistic Features
In the previous section, we presented different types of clusters that were used in this work to
determine to what degree the extracted features reflect the verbal intelligence of individuals.
Monologues and dialogues of speakers from these clusters were compared with each other
using a one-way analysis of variance (ANOVA).
ANOVA is used to find out whether there is a difference between the mean values of two
or more groups. The null hypothesis is that data from the groups have a common mean and
the difference does not exist. The F -statistics is used to do a hypothesis test. If p < 0.05,
the null hypothesis is rejected. Figure 4.15 and Figure 4.16 show this procedure for two and
three clusters.
lower VI
higher VI ANOVA
Significance if p<0,05 and F>>1
Fig. 4.15. ANOVA for two clusters.
For some features extracted from the monologues and dialogues we used the Kruskal-
Wallis one-way analysis of variance. The Kruskal-Wallis test is a nonparametric equivalent
of ANOVA. It may be used for the analysis of data samples that are not normally distributed.
For performing the test, the analysed data should be ranked without taking into account

4.4 Feature Selection 95
lower VI
higher VI
ANOVA
Significance if p<0,05 and F>>1
average VI
Fig. 4.16. ANOVA for three clusters.
which group the samples belong to. The rank values are used to calculate the K-statistic.
If the statistic is significant, the null hypothesis is rejected.
4.4.3 Feature Selection for TF-IDF Approach
Term Selection
Typical TC approaches make use of different feature selection techniques to further reduce
the dimensionality of the data space by removing irrelevant features that make no contri-
bution to category discrimination.
Different feature selection techniques through information theory were well studied
in [Yang and Pedersen, 1997]. As a result of this study, information gain (IG) and V2-
Test were reported to be the top performing methods out of five methods under test in
terms of feature removal aggressiveness and classification accuracy improvement. However,
the document frequency thresholding approach, the simplest method with the lowest cost
in computation, was reported to perform similarly.
The Document Frequency (DF) is the number of documents in which a term occurs. As
described in [Yang and Pedersen, 1997], it is possible to compute the document frequency
for each unique term in the training corpus and to remove from the feature space those
terms whose document frequency is less than a certain predefined threshold. By doing so
we are adopting a basic assumption: rare terms are either non-informative for the category
prediction (i.e., intelligence estimation in our case) or not influential in global performance.
In either case, removal of rare terms contributes to the reduction of dimensionality of the
feature space and improves the classification accuracy (i.e., if rare terms happen to be noise
terms).
If we try to summarize both pros and cons of using the document frequency thresholding
approach, we may say that positive aspects are:
• It is the simplest technique for vocabulary reduction (easily scalable to very large cor-
pora).
• Computational complexity is approximately linear with the number of documents.
while on the other hand, negative aspects are:
• The technique is usually considered as an ad-hoc approach to improve the efficiency
instead of a principled criterion for a predictive feature selection.
• The technique is typically considered, from an IR point of view, as a non-appropriate
approach for aggressive term removal (low-DF terms are assumed to be relatively infor-
mative and therefore should not be removed aggressively).
96 4 Features for the Estimation of Verbal Intelligence
In this work a slightly modified version of this DF thresholding approach was applied
to the data: TF-IDF measures instead of DF measures were used. As another remarkable
difference, we did not remove the lowest TF-IDF terms but just selected the highest TF-IDF
terms. In particular, instead of defining a threshold for TF-IDF measures, we defined a fixed
number of terms to be selected (i.e., N). Therefore, we first sorted all the terms according
to their TF-IDF measures. Then, we selected the top N most representative or indicative
terms according to their TF-IDF weights. The remaining terms were removed as stop or
common words that did not add any meaningful content. By observing the evolution of the
classification accuracy with an increasing N value, we determined the minimum size of the
vocabulary (i.e., dimensionality) required to achieve the optimum performance.
Class-based vs Corpus-based
As stated above, in our framework each word is considered as a feature and each document is
represented as a feature vector. In [Ozgur et al., 2005] two alternative ways for implementing
the selection of these keywords or features are presented.
In the first one, the so-called corpus-based keyword selection, a common keyword or
feature set that reflects the most important words for all classes (i.e., highest TF-IDF
terms) in all documents is selected.
In the alternative approach, named as class-based keyword selection, the keyword selec-
tion process is performed separately for each class. In this way, the most important and
specific words for each class are determined.
Word Lemmatisation
Word lemmatisation is often applied in the area of IR, where the goal is to enhance the
system performance and to reduce the number of unique words [Solka, 2008]. Particularly,
word lemmatisation is part of the data pre-processing required to convert a natural language
document to the feature space. Formally, it is the process for reducing inflected (or sometimes
derived) words to their lemmas. For example, as a result of lemmatisation, different words
like “play”, “plays”, “playing”, and “played” are related to the same feature identification
(i.e., lemma) “play”.
Word lemmatisation was applied to our monologues to assess its impact on performance
(i.e., classification accuracy). Like removing stop words, lemmatisation also contributed to
the reduction of the size of the lexicon, thus saving on computational resources.

5
Empirical and Classification Results
In the previous chapter, we presented several approaches that were used in this work for
investigating verbal and communication behaviour of speakers (Sections 4.1 and 4.2). These
methods were applied to the monologues and dialogues from the verbal intelligence corpus.
As a result, a number of linguistic and conversational cues were extracted from the text
files. Additionally, each monologue and dialogue was represented as a list of words with
corresponding weights that were calculated using the TF-IDF approach (Section 4.3).
In this chapter, we investigate to what degree extracted features reflect the verbal in-
telligence of speakers and which of them may provide a satisfactory classification accuracy
and should be used for the classification task.
At first, only monologues were used for the analysis. Linguistic cues that were extracted
at the morphological, lexical, syntactic, semantic, and linguistic levels were investigated us-
ing ANOVA. This allowed us to obtain a list of features that reflect the verbal intelligence of
speakers. However, we cannot claim that only those features (that were significant accord-
ing to ANOVA) are indicators of speakers’ verbal intelligence. There may exist indicators
that are not informative if we analyse them separately, without taking into account the oc-
currence of other linguistic cues in speech. However, in combination with certain linguistic
peculiarities, these features may be able to predict the verbal intelligence of individuals.
To obtain such combinations, we applied several feature selection approaches (Information
gain ratio, V2-Test, and Genetic algorithm) to the extracted cues. Features that were deter-
mined to be informative were used for the classification task. Additionally, several classifiers
were trained using the feature vectors with the TF-IDF weights. The classification results
were compared with each other. As a result, we determined the most promising approach
for estimating the verbal intelligence of individuals. This procedure may be represented as
shown in Figure 5.1.
Section 5.1.1 shows features (extracted from the monologues) that were significant ac-
cording to ANOVA. In Section 5.1.2, we apply the feature selection algorithms to the ex-
tracted cues and use the obtained combinations of indicators for the classification task.
In Section 5.1.3, we train several classifiers using the TF-IDF approach and analyse the
obtained results.
The investigation of dialogues was performed in the same way. At first, the methods
of linguistic and computational analysis were applied to the conversations. Features that
reflect the verbal and communication behaviour of individuals and that were significant
according to ANOVA are presented in Section 5.1.1. Applying IGR, V2-Test, and GA to the
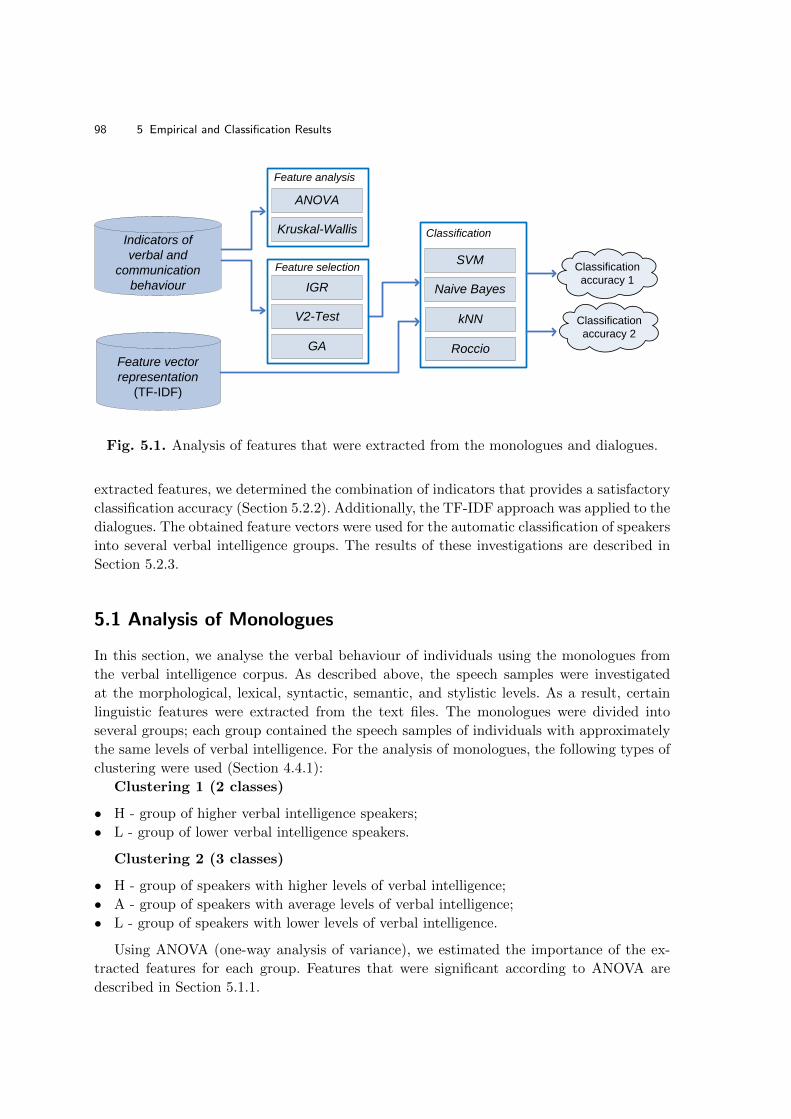
98 5 Empirical and Classification Results
Indicators of
verbal and
communication
behaviour
Feature vector
representation
(TF-IDF)
ANOVA
Kruskal-Wallis
Feature analysis
Feature selection
Classification
IGR
V2-Test
GA
Classification
accuracy 1
Classification
accuracy 2
SVM
Naive Bayes
kNN
Roccio
Fig. 5.1. Analysis of features that were extracted from the monologues and dialogues.
extracted features, we determined the combination of indicators that provides a satisfactory
classification accuracy (Section 5.2.2). Additionally, the TF-IDF approach was applied to the
dialogues. The obtained feature vectors were used for the automatic classification of speakers
into several verbal intelligence groups. The results of these investigations are described in
Section 5.2.3.
5.1 Analysis of Monologues
In this section, we analyse the verbal behaviour of individuals using the monologues from
the verbal intelligence corpus. As described above, the speech samples were investigated
at the morphological, lexical, syntactic, semantic, and stylistic levels. As a result, certain
linguistic features were extracted from the text files. The monologues were divided into
several groups; each group contained the speech samples of individuals with approximately
the same levels of verbal intelligence. For the analysis of monologues, the following types of
clustering were used (Section 4.4.1):
Clustering 1 (2 classes)
• H - group of higher verbal intelligence speakers;
• L - group of lower verbal intelligence speakers.
Clustering 2 (3 classes)
• H - group of speakers with higher levels of verbal intelligence;
• A - group of speakers with average levels of verbal intelligence;
• L - group of speakers with lower levels of verbal intelligence.
Using ANOVA (one-way analysis of variance), we estimated the importance of the ex-
tracted features for each group. Features that were significant according to ANOVA are
described in Section 5.1.1.

5.1 Analysis of Monologues 99
To determine the combination of linguistic peculiarities of individuals that may be used
for the classification task, we applied Information gain ratio, V2-Test, and Genetic algorithm
to the extracted cues. We trained the kNN, Naive Bayes, and Support vector machines
classifiers using the most informative indicators and analysed the obtained classification
results (Section 5.1.2).
Additionally, the monologues from the different verbal intelligence groups were repre-
sented as feature vectors using the TF-IDF approach. These feature vectors were used for
training the kNN, Naive Bayes, and Roccio classifiers. A detailed description of this proce-
dure and the analysis of classification results are presented in Section 5.1.3.
5.1.1 Feature Analysis
Morphological Cues
First, let us analyse whether morphological cues extracted from the monologues reflect the
verbal intelligence of individuals. Table 5.1 presents the morphological features that were
significant according to ANOVA.
Table 5.1. Mean values of the morphological features that were significant according toANOVA for the different verbal intelligence groups.
Extracted features 2 clusters 3 clusters
Low High Low Average High
Compoundings 0.027** 0.034** 0.027* 0.033* 0.034*Length of nouns 7.270* 7.575* 7.251 7.522 7.593Words longer than 9 letters 1.129* 1.260* 1.123 1.234 1.270Words longer than 10 letters 0.913* 1.034* 0.904 1.014 1.041
Note: **p≤0.01, *p≤0.05 (ANOVA)
Compoundings were determined to be a significant feature that may reflect the verbal
intelligence of individuals. Speakers with higher verbal abilities more frequently combine
primary words together to construct a new term. To calculate this feature, we took into
account all words that occurred in the monologues. Additionally, we measured the num-
ber of compound nouns for different verbal intelligence groups. ANOVA did not show any
significant results for this indicator. This means that, when analysing speakers’ ability to
construct new words, we should take into account not only nouns (e.g., Konzentrationsspiel
(Konzentration - concentration, Spiel - game), Tiefschlaf (Tief - deep, Schlaf - sleep)), but
also other parts of speech such as adverbs (minutenweise (minute by minute)), adjectives
(kontraproduktiv (kontra - very, produktiv - productive), nachtaktiv (Nacht - night, aktiv -
activ), etc.
If speakers with a higher verbal intelligence level more frequently combine two or more
words together to construct new terms, this should influence the average length of these
terms in their speech. On the other hand, articles (der, ein), prepositions (auf, nach, von),
and conjunctions (und, aber) often occur in spoken utterances and usually consist of three
or four letters. Such parts of speech may have an influence on the average word length in

100 5 Empirical and Classification Results
a text. To avoid this, we calculated the average length of each part of speech separately
(nouns, adjectives, adverbs, etc.) and the average length of words consisting of at least six
or more letters. ANOVA showed a significant difference for the following features: Length of
nouns, Words longer than 9 letters, and Words longer than 10 letters.
As stated above, ANOVA did not show any significant results for compound nouns.
Speakers from both higher and lower verbal intelligence groups construct new nouns by
combining several terms together. However, nouns of the higher verbal intelligence speakers
are longer than those of the lower verbal intelligence speakers.
Lexical Cues
Table 5.2 presents the significant ANOVA results for lexical features. As we may see, speak-
ers with a higher verbal intelligence level used more adjectives in their speech than lower
verbal intelligence individuals. The same conclusion was made by [Gleser et al., 1959], who
found that adjectives (along with auxiliary verbs, prepositions, and articles) reflect speakers
with higher cognitive abilities. ANOVA also showed that higher verbal intelligence speakers
used more modal verbs and fewer conjunctions and coordinate conjunctions in their speech.
The verb-adjective ratio, which was determined to be an indicator of the sociability and
agreeableness of native German speakers [Borstel, 1977], was greater for participants with
a lower verbal intelligence level. It was also revealed that speakers with a lower verbal intel-
ligence level tend to choose frequent words (e.g., words with high indexes in the frequency
dictionary for the German language [Kupietz et al., 2010]).
Table 5.2. Mean values of the lexical features that were significant according to ANOVAfor different verbal intelligence groups.
Extracted features 2 clusters 3 clusters
Low High Low Average High
Modal verbs 0.057* 0.071* 0.060 0.071 0.063Adjectives 0.065* 0.073* 0.064 0.073 0.071Conjunctions 0.086** 0.075** 0.087* 0.077* 0.075*Verb-adjective ratio 0.016* 0.010* 0.017 0.012 0.009Coordinate conjunctions 0.057* 0.048* 0.058* 0.049* 0.048*Word frequency 8.877 9.124 8.794** 9.091** 9.210**Cosine similarity 0.823* 0.845* 0.820* 0.838* 0.856*Reused lemma 3-grams 0.024* 0.030* 0.023 0.030 0.029Cosine similarity (repeated n-grams) 0.142** 0.158** 0.141** 0.151** 0.166**
Note: **p≤0.01, *p≤0.05 (ANOVA)
ANOVA also determined Number of reused 3-grams, Cosine similarity using lemmas
and Cosine similarity using repeated n-grams to be significant features. As we may see,
participants with a higher verbal intelligence level used more words from the film and
the similarity between their descriptions and the film was higher than the similarity of
participants with an average and a lower verbal intelligence level. This may be explained as
follows. One of the verbal subtests of HAWIE is Memory. A high memory score relates to a

5.1 Analysis of Monologues 101
high verbal intelligence score of a test person. Also, people with a good memory were better
able to recall many details of the film and to use words which they heard when watching it.
We may conclude that the vocabulary of people with different verbal intelligence is different
when they talk about the same event even taking into account that they were asked to talk
about this film just after they had watched it.
Syntactic Cues
Among the features extracted at the syntactic level only subjunctive mode was found to be
significant (Table 5.3).
Table 5.3. Mean values of the syntactic features that were significant according to ANOVAfor the different verbal intelligence groups.
Extracted features 2 clusters 3 clusters
Low High Low Average High
Subjunctive mode 0.0003* 0.0012* 0.0003 0.0011 0.0011
Note: **p≤0.01, *p≤0.05 (ANOVA)
The frequent use of the subjunctive mode (wurde (would), hatte (would have)) shows that
higher verbal intelligence participants not only described the film but also expressed their
own opinion about it or helped themselves when talking about some details. For example:
Es hat sich herausgestellt dass ah ah ah dass der ja dass der ah dass der maximale Pulsgesunken ist um so knapp zehn Prozent, wurde man sagen.(It has been found that uh uh uh uh that yes that the maximum pulse has dropped byalmost ten percent, I would say.)
Ich wurde sowas nie in meinem Leben machen.(I would never do something like that in my life).
As we may see, ANOVA did not show any significant difference for the other syntactic
features that were extracted from the monologues. This may happen for several reasons.
First, speech samples may be too short (not longer than three minutes). This may prevent
us from finding differences in the sentence structures of speakers with different verbal in-
telligence. Second, such a genre of spoken language as retelling a story did not give our
candidates enough opportunity to show their ability to construct complex and sophisti-
cated utterances. When analysing the monologues, we noticed that the extracted syntactic
features occurred in the speech of candidates of both higher and lower verbal intelligence
groups. This means that all of them, independent of their verbal intelligence levels, are able
to use complex syntactic structures when talking about a certain event. The third reason
may be that extracted syntactic features are not informative indicators of differences in
spoken language. These features may be relevant if we work with scientific reports or the
written language of individuals. In this case, they may better reflect differences in the verbal
intelligence of speakers. These syntactic cues were nevertheless used for the classification

102 5 Empirical and Classification Results
task. We investigated whether feature selection algorithms (genetic algorithm, information
gain ratio, and V2-Test) determined these features as informative ones. The results of the
investigation are presented in Section 5.1.2.
Semantic Cues
Table 5.4 presents the LIWC features that were ANOVA significant. As we may see, the
higher verbal intelligence speakers used more emotional words and words from the cate-
gory Communication than the lower verbal intelligence ones. An interesting result is that
speakers with average verbal intelligence levels were more optimistic and self confident than
individuals from other groups. Let us have a look at the categories Humans and Television.
Words from these categories were suitable for descriptions of the film (for example, when
talking about the actors or their interactions with each other). According to ANOVA, they
more frequently occurred in the speech of candidates with a lower verbal intelligence level.
Table 5.4. Mean values of LIWC features that were significant according to ANOVA fordifferent verbal intelligence groups.
Extracted features 2 clusters 3 clusters
Low High Low Average High
Affective or emotional processes 0.029* 0.035* 0.029 0.034 0.035Positive emotion 0.018* 0.023* 0.017* 0.023* 0.022*Optimism 0.005 0.007 0.004* 0.008* 0.005*Certainty 0.021 0.022 0.018* 0.025* 0.019*Communication 0.0086* 0.0116* 0.009 0.010 0.012Humans 0.014 0.012 0.015* 0.014* 0.009*Inclusive 0.070* 0.062* 0.071 0.063 0.0618Television 0.004** 0.002** 0.0057** 0.0027** 0.0025**
Note: **p≤0.01, *p≤0.05 (ANOVA)
As described in Chapter 3, the actors of the film were asked to be awake as long as
possible and to perform different physical exercises. After such exercises, their concentration,
attention, pulse, and other factors were measured. For the description of these facts, our
test persons used words from such categories as Sports and Sleep. As we may see, ANOVA
did not determine these categories as being significant. This means that candidates from
different verbal intelligence groups made detailed descriptions of the film and were able to
mention lots of peculiarities.
Stylistic Cues
Among the speech style features, presidentiality was determined to be significant according
to ANOVA for two and three classes (Table 5.5).
As we may see from the table, the level of presidentiality in speech increases with the level
of verbal intelligence of speakers. Lower verbal intelligence participants have even negative
measures of presidentiality.

5.1 Analysis of Monologues 103
Table 5.5. Mean values of speech style features that were significant according to ANOVAfor different verbal intelligence groups.
Extracted features 2 clusters 3 clusters
Low High Low Average High
Presidentiality -0.94* 0.63* -0.95* -0.12* 1.43*
Note: **p≤0.01, *p≤0.05 (ANOVA)
5.1.2 Training Classifiers Using Linguistic Features
In the previous section, we used ANOVA to determine language peculiarities that may
reflect the verbal intelligence of speakers. In this section, we applied several feature selection
approaches to obtain a combination of cues that provides a satisfactory verbal intelligence
classification with HAWIE as a benchmark. As mentioned above, for the experiments with
monologues, the following types of clustering were used: Clustering 1 (two classes) and
Clustering 2 (three classes). The experiments were performed using the leave-one-out cross-
validation approach.
First, we trained the classifiers using all the linguistic features extracted from the mono-
logues without applying any feature selection methods. For each feature set (morphological,
lexical, syntactic, semantic and stylistic), we presented the results of those classifiers that
achieved the highest classification accuracy in comparison with the others. The classification
results are presented in Table 5.6.
Table 5.6. Classification results without feature selection.
Feature set Classifier Class Recall Precision Accuracy
Morphological SVM High 88.33% 63.10% 62.00%Low 22.50% 56.25%
Lexical Naive Bayes High 45.00% 75.00% 58.00%Low 77.50% 48.44%
Syntactic Naive Bayes High 66.67% 59.70% 53.00%Low 32.50% 39.39%
Semantic SVM High 91.67% 61.80% 61.00%Low 15.50% 54.55%
Stylistic SVM High 96.67% 59.18% 58.00%Low 0.00% 0.00%
All Features SVM High 81.67% 62.03% 59.00%Low 25.00% 47.62%
As we may see from the table, SVM was able to achieve the highest accuracy for four
different feature sets compared with the other classifiers. Naive Bayes was able to outperform
SVM twice using the lexical and syntactic features for training. The morphological feature
set also provides the highest classification accuracy (62%) in comparison with the other
feature sets used in this experiment.
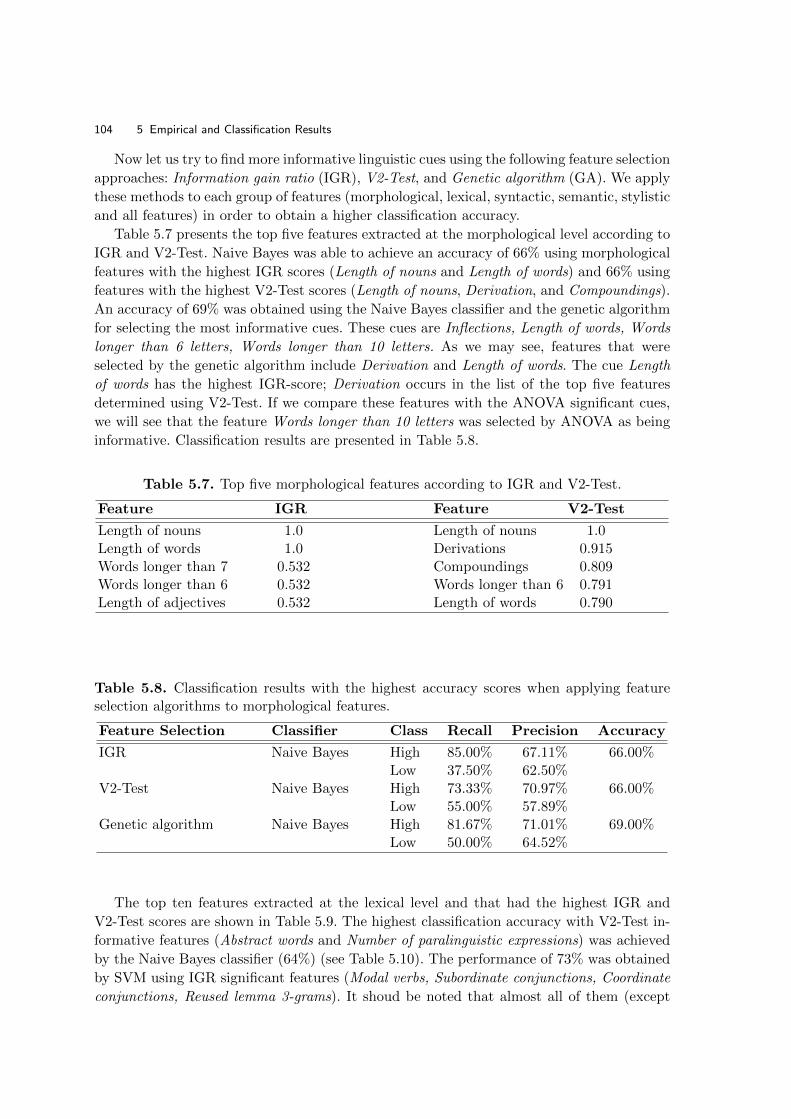
104 5 Empirical and Classification Results
Now let us try to find more informative linguistic cues using the following feature selection
approaches: Information gain ratio (IGR), V2-Test, and Genetic algorithm (GA). We apply
these methods to each group of features (morphological, lexical, syntactic, semantic, stylistic
and all features) in order to obtain a higher classification accuracy.
Table 5.7 presents the top five features extracted at the morphological level according to
IGR and V2-Test. Naive Bayes was able to achieve an accuracy of 66% using morphological
features with the highest IGR scores (Length of nouns and Length of words) and 66% using
features with the highest V2-Test scores (Length of nouns, Derivation, and Compoundings).
An accuracy of 69% was obtained using the Naive Bayes classifier and the genetic algorithm
for selecting the most informative cues. These cues are Inflections, Length of words, Words
longer than 6 letters, Words longer than 10 letters. As we may see, features that were
selected by the genetic algorithm include Derivation and Length of words. The cue Length
of words has the highest IGR-score; Derivation occurs in the list of the top five features
determined using V2-Test. If we compare these features with the ANOVA significant cues,
we will see that the feature Words longer than 10 letters was selected by ANOVA as being
informative. Classification results are presented in Table 5.8.
Table 5.7. Top five morphological features according to IGR and V2-Test.
Feature IGR Feature V2-Test
Length of nouns 1.0 Length of nouns 1.0Length of words 1.0 Derivations 0.915Words longer than 7 0.532 Compoundings 0.809Words longer than 6 0.532 Words longer than 6 0.791Length of adjectives 0.532 Length of words 0.790
Table 5.8. Classification results with the highest accuracy scores when applying featureselection algorithms to morphological features.
Feature Selection Classifier Class Recall Precision Accuracy
IGR Naive Bayes High 85.00% 67.11% 66.00%Low 37.50% 62.50%
V2-Test Naive Bayes High 73.33% 70.97% 66.00%Low 55.00% 57.89%
Genetic algorithm Naive Bayes High 81.67% 71.01% 69.00%Low 50.00% 64.52%
The top ten features extracted at the lexical level and that had the highest IGR and
V2-Test scores are shown in Table 5.9. The highest classification accuracy with V2-Test in-
formative features (Abstract words and Number of paralinguistic expressions) was achieved
by the Naive Bayes classifier (64%) (see Table 5.10). The performance of 73% was obtained
by SVM using IGR significant features (Modal verbs, Subordinate conjunctions, Coordinate
conjunctions, Reused lemma 3-grams). It shoud be noted that almost all of them (except

5.1 Analysis of Monologues 105
for Subordinate conjunctions) were determined to be significant according to ANOVA. The
genetic algorithm in combination with SVM achieved a classification accuracy of 80% (Table
5.10). Features that were selected for the classification were: Verbs, Reflexive verbs, Modal
verbs, Adjectives, Adverbs, Pronouns, Conjunctions, Interjections, Type/Token ratio lemma,
Abstract words, Number of reused lemma 3-grams, Number of reused lemma 4-grams, Num-
ber of reused lemma 5-grams, Number of reused lemma 7-grams, Cosine similarity (lemma
n-grams), Own lemmas2, Incomplete words, Complete words, Paraverbal expressions, Verb
tokens, r-Words, Modal particles. As discussed above, ANOVA determined eight lexical cues
to be informative; 60% of these cues may be found among the features that were selected
by GA for the classification task.
Table 5.9. Top ten lexical features according to IGR and V2-Test.
Feature IGR Feature V2-Test
Number of reused lemma 3-grams 1.0 Abstract words 1.0Cosine similarity 0.908 Paralinguistic expressions 0.709Cosine similarity (lemma n-grams) 0.908 Number of unique lemmas 0.696Abstact words 0.908 Total number of conjunctions 0.694Verb-Adjective ratio 0.908 Cosine similarity (lemma n-grams) 0.639Coordinating conjunctions 0.908 Verb tokens 0.609Subordinating conjunctions 0.908 Number of verbs 0.609Modal verbs 0.908 Cosine similarity 0.603Modal particles 0.788 Number of adjectives 0.519
Table 5.10. Classification results with the highest accuracy scores when applying featureselection algorithms to lexical features.
Feature Selection Classifier Class Recall Precision Accuracy
IGR SVM High 85.00% 73.91% 73.00%Low 55.00% 70.97%
V2-Test Naive Bayes High 91.67% 63.95% 64.00%Low 22.50% 64.29%
Genetic algorithm SVM High 88.33% 80.30% 80.00%Low 67.50% 79.41%
Let us analyse the classification results obtained using the syntactic features. As described
above, only one syntactic cue was significant according to ANOVA. Features that were
selected by IGR and V2-Test did not show any satisfactory classification accuracy (Table
5.12). However, the genetic algorithm outperformed the other feature selection approaches
and found several informative syntactic cues that were used for training the classifiers.
The kNN classifier achieved an accuracy of 77%. The feature set that was selected for the
classification by GA includes: Temporal clause, Present participle, Perfect participle, Es-

106 5 Empirical and Classification Results
Extraposition, Number of es, Pre-Prefield position. The top five syntactic features with the
highest IGR and V2-Test coefficients are shown in Table 5.11.
Table 5.11. Top five syntactic features according to IGR and V2-Test.
Feature IGR Feature V2-Test
Passive voice 1.0 Passive voice 1.0Distance 0.876 Genetive case 0.980Sentence length 0.876 Sentence length 0.852And as a junk word 0.733 Es-extraposition 0.799Infinitive clause 0.733 Distance 0.736
Table 5.12. Classification results with the highest accuracy scores when applying featureselection algorithms to syntactic features.
Feature Selection Classifier Class Recall Precision Accuracy
IGR Naive Bayes High 90.00% 60.00% 58.00%Low 10.00% 40.00%
V2-Test Naive Bayes High 86.67% 64.20% 63.00%Low 27.50% 57.89%
Genetic algorithm kNN High 86.67% 77.61% 77.00%Low 62.50% 75.76%
For the LIWC categories, GA again outperformed the other feature selection algorithms.
The GA-significant feature set enabled us to obtain higher classification results (using SVM)
compared with those obtained using IGR and V2-Test. The categories chosen by the genetic
algorithm are Up, Down, Inclusive, Exclusive, Motion, Occupation, School, Job, Achieve-
ment, Leisure, Home, Sports, Television, Music, Money, Metaphor, Religion, Death, Phys-
ical, Body, Eat, Sleep, Grooming, Swear, Non-fluency, Fillers. As we may see, only two of
the ANOVA significant features (Inclusive and Television) are among the cues that were
selected by GA.
The top five features that were selected by IGR and V2-Test are presented in Table 5.13.
The classification results with the highest accuracy scores for the semantic cues are presented
in Table 5.14. Some of them (Affectation, Communication, Inclusive, Television) were also
determined to be informative using ANOVA.
For the stylistic feature set, an accuracy of 66% was achieved by kNN using cues that
were selected by GA (Table 5.16). These cues were Verbal immediacy, Rationalization, De-
pression, Age. The top five stylistic features with the highest IGR and V2-Test scores are
presented in Table 5.15.
Now let us apply the IGR, V2-Test, and genetic algorithm to the complete feature set.
SVM in combination with the genetic algorithm showed a classification accuracy of 84% for
the two classes (Table 5.17). Sixty-eight linguistic cues out of 151 were chosen by GA for
the classification.

5.1 Analysis of Monologues 107
Table 5.13. Top five semantic features according to IGR and V2-Test.
Feature IGR Feature V2-Test
Communication 1.0 Negative emotions 1.0Sports 0.711 Communication 0.876Inclusive 0.711 Job 0.838Causation 0.711 Inclusive 0.732Affectation 0.711 TV 0.732
Table 5.14. Classification results with the highest accuracy scores when applying featureselection algorithms to semantic features.
Feature Selection Classifier Class Recall Precision Accuracy
IGR Naive Bayes High 83.33% 64.63% 64.00%Low 27.50% 61.11%
V2-Test Naive Bayes High 83.33% 66.25% 66.00%Low 32.50% 65.00%
Genetic algorithm SVM High 98.33% 75.64% 80.00%Low 52.50% 95.45%
Table 5.15. Top five stylistic features according to IGR and V2-Test.
Feature IGR Feature V2-Test
Rationalization 1.0 Cognitive complexity 1.0Cognitive complexity 1.0 Presidentiality 0.964Verbal immediacy 1.0 Formality 0.846Presidentiality 0.661 Depression 0.782Femininity 0.661 Femininity 0.667
Table 5.16. Classification results with the highest accuracy scores when applying featureselection algorithms to speech style features.
Feature Selection Classifier Class Recall Precision Accuracy
IGR kNN High 70.00% 65.62% 60.00%Low 45.00% 50.00%
V2-Test kNN High 61.67% 63.79% 56.00%Low 47.50% 45.24%
Genetic algorithm kNN High 70.00% 72.41% 66.00%Low 60.00% 57.14%
For the three classes, the highest classification accuracy of 63% was also obtained using
the GA informative features to train Naive Bayes. The results are shown in Table 5.18.
The results presented above show that Naive Bayes performed better on features selected
by IGR and V2-Test compared with SVM and kNN. The kNN classifier in combination with
GA showed higher accuracy scores than SVM and Naive Bayes for the syntactic and stylistic

108 5 Empirical and Classification Results
Table 5.17. Classification results obtained using SVM and GA-informative features for twoclasses.
Feature Selection Classifier Class Recall Precision Accuracy
IGR Naive Bayes High 83.33% 70.42% 69.00%Low 47.50% 65.52%
V2-Test Naive Bayes High 85.00% 64.56% 63.00%Low 30.00% 57.14%
Genetic algorithm SVM High 95.00% 81.43% 84.00%Low 67.50% 90.00%
Table 5.18. Classification results obtained using Naive Bayes and GA-informative features.
Feature Selection Classifier Class Recall Precision Accuracy
High 80.00% 46.51%Genetic algorithm Naive Bayes Average 55.81% 77.42% 63.00%
Low 59.38% 73.08%
feature sets. As we may see, the lexical and semantic feature sets were the most promising
ones that resulted in 80% of classification accuracy. This was the highest score compared
with the other groups of features (morphological, syntactic, and stylistic). This result was
obtained using SVM and GA to select the most informative features. SVM in combination
with GA was able to obtain an accuracy of 84% for two classes using all the features that
were extracted from the monologues.
Cues determined by ANOVA to be significant were not always chosen by GA, IGR, and
V2-Test for the classification and vice versa: some of the linguistic cues selected by GA,
IGR, and V2-Test were not significant according to ANOVA. Such features do not reflect
the verbal intelligence of individuals if they are analysed without taking into account other
linguistic peculiarities of speakers. However, in combination with certain cues, they are able
to provide satisfactory classification results.
As described above, we also applied the TF-IDF approach to the monologues and repre-
sented each text file as a computational unit. These units were further used for the classifica-
tion task. In the following section, we analyse the results of this representation and describe
the obtained classification results. We determine which approach is the most promising for
the classification of speakers into several verbal intelligence groups.
5.1.3 Training Classifiers Using TF-IDF Approach
As stated above, the vector space model represents each document as a vector with one real-
valued component (i.e., TF-IDF weight) for each term. Therefore, we need text classification
methods that can operate on real-valued vectors. In this work, we used three well-known
vector space classification methods: Naive Bayes (NB), Rocchio and Nearest Neighbour
classification (kNN).
Naive Bayes is often used as a baseline in text classification research as it combines
efficiency (training and classification can be accomplished with one pass over the data)
and good accuracy (particularly if there are many equally important features that jointly

5.1 Analysis of Monologues 109
contribute to the classification decision). The Rocchio algorithm is a very simple and efficient
text categorization method for applications like web searching, on-line query, etc. because of
its simplicity in both training and testing [Vinciarelli, 2005]. The kNN requires no explicit
training and can use the unprocessed training set directly in classification. However, it is
less efficient than the other classification methods.
Rocchio and Naive Bayes are linear classifiers whereas kNN is an example of a nonlinear
one. Generally speaking, if a problem is nonlinear and its class boundaries cannot be ap-
proximated well with linear hyperplanes, nonlinear classifiers are often more accurate than
linear classifiers (particularly, if the training set is large, then kNN can handle complex
classes better than Rocchio and NB). On the other hand, if a problem is linear, then it is
better to use a simpler linear classifier. However, this needs to be taken with a little bit of salt
since the previous assertion is always conditioned by the well-known bias-variance trade-off
(i.e., with limited training data, a more constrained model tends to perform better). These
approaches are described in more detail in this section.
Experimental Set-up
Our main goal is to identify the algorithm that optimally computes class boundaries and
obtains the highest classification accuracy. In our experiments for comparing the perfor-
mance of different approaches, a Leave-One-Out cross validation (LOO-CV) method was
used. The idea of this method is to use N-1 observations for training (where N is the number
of data points) and only 1 data point for testing. This procedure is repeated N times and
each observation is used once as the testing data.
Baseline Approach: Class-Based vs Corpus-Based Feature Selection
As introduced in Section 4.4.3, our experiments covered the comparison of the class-based
and corpus-based keyword selection approaches.
The corpus-based approach implies the selection of a common feature set for all classes
with the top N most representative or indicative terms. The class-based approach instead
implies the selection of the most important words for each particular class. In this case,
to preserve the balance between classes, N/M words for each specific class were selected,
where M is the number of classes. For our classification task M = 2, where the first class
contained test persons with a lower verbal intelligence level, the second class contained
participants with a higher verbal intelligence level. Then, we composed our feature vector
by concatenating all the class-specific features, thus resulting in a vector comparable to the
N -dimensional vector corresponding to the corpus-based approach.
However, when using the class-based approach, a particular word may be included in
various class-specific subsets (i.e., a word that is important to not only one single class but
to several classes). To avoid duplicate features, we only used the intersection between all
the class-specific subsets. Therefore, the dimension of the resulting feature vector in these
cases had to be necessarily lower than N. For simplicity, we will better refer to the number
of features per class (i.e., F = N/2) rather than to the final dimensions of the vectors.
Consequently, if we report, for instance, about 50 words or features per class, this means
that we are using a 100-dimensional corpus-based vector. In this case for the class-based
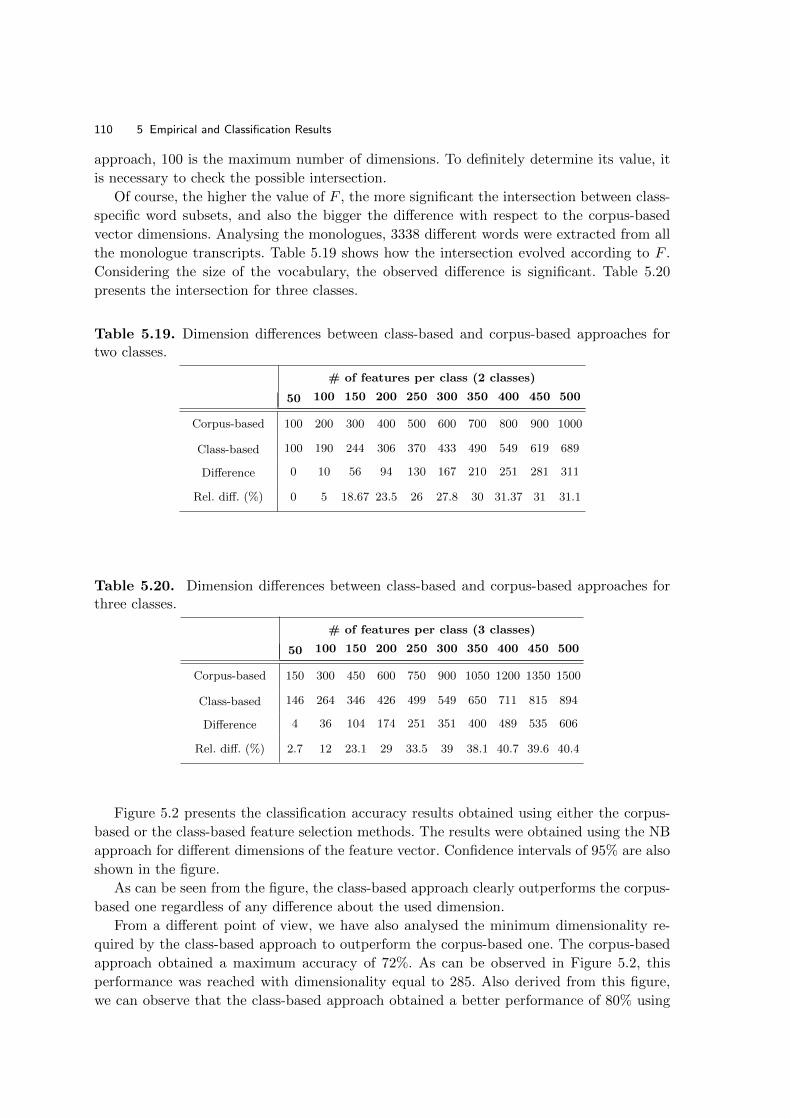
110 5 Empirical and Classification Results
approach, 100 is the maximum number of dimensions. To definitely determine its value, it
is necessary to check the possible intersection.
Of course, the higher the value of F , the more significant the intersection between class-
specific word subsets, and also the bigger the difference with respect to the corpus-based
vector dimensions. Analysing the monologues, 3338 different words were extracted from all
the monologue transcripts. Table 5.19 shows how the intersection evolved according to F .
Considering the size of the vocabulary, the observed difference is significant. Table 5.20
presents the intersection for three classes.
Table 5.19. Dimension differences between class-based and corpus-based approaches fortwo classes.
# of features per class (2 classes)
50 100 150 200 250 300 350 400 450 500
Corpus-based 100 200 300 400 500 600 700 800 900 1000
Class-based 100 190 244 306 370 433 490 549 619 689
Difference 0 10 56 94 130 167 210 251 281 311
Rel. diff. (%) 0 5 18.67 23.5 26 27.8 30 31.37 31 31.1
Table 5.20. Dimension differences between class-based and corpus-based approaches forthree classes.
# of features per class (3 classes)
50 100 150 200 250 300 350 400 450 500
Corpus-based 150 300 450 600 750 900 1050 1200 1350 1500
Class-based 146 264 346 426 499 549 650 711 815 894
Difference 4 36 104 174 251 351 400 489 535 606
Rel. diff. (%) 2.7 12 23.1 29 33.5 39 38.1 40.7 39.6 40.4
Figure 5.2 presents the classification accuracy results obtained using either the corpus-
based or the class-based feature selection methods. The results were obtained using the NB
approach for different dimensions of the feature vector. Confidence intervals of 95% are also
shown in the figure.
As can be seen from the figure, the class-based approach clearly outperforms the corpus-
based one regardless of any difference about the used dimension.
From a different point of view, we have also analysed the minimum dimensionality re-
quired by the class-based approach to outperform the corpus-based one. The corpus-based
approach obtained a maximum accuracy of 72%. As can be observed in Figure 5.2, this
performance was reached with dimensionality equal to 285. Also derived from this figure,
we can observe that the class-based approach obtained a better performance of 80% using

5.1 Analysis of Monologues 111
0 50 100 150 200 250 300 350 400 450 500
50
55
60
65
70
75
80
85
90
NB approach (2 classes)
Dimensionality (# of features per class)
Acc
urac
y (%
)
Corpus−based Corpus−based − confidence boundaries Class−based Class−based − confidence boundaries
Fig. 5.2. Baseline approach: Class-Based vs Corpus-Based feature selection.
“only” 60 features per class. The class-based feature selection, by definition, focuses on find-
ing the most crucial or indicative class keywords. On the other hand, the corpus-based one
simply tends to find general keywords concerning all classes. This clearly tips the balance in
favour of the class-based approach particularly when we use a reduced set of features. This
is important as there may be a significant gain in classification time when a small number
of features is used.
By confirming these differences with additional statistical evidence (i.e., more data), we
may also conclude that the class-based feature selection improved the performance of the
corpus-based one for the NB approach not only in terms of accuracy but also in terms of
time. Similar results were already reported in [Ozgur et al., 2005].
When using the corpus-based approach, most features (i.e., words) tend to be selected
from the prevailing classes so that rare classes are not well represented. In contrast, when
using the class-based approach all the classes are represented equally as for their represen-
tation class specific features are used. Thus, the class-based approach achieved consistently
higher accuracies than the corpus-based approach.
Similar differences between the class-based and corpus-based methods have been observed
throughout all of our experiments. Therefore, in the next sections we will only focus on the
class-based versions.
Comparison between Approaches: Rocchio “Wins”
In this section, we compare the results that were obtained using different approaches. Before
proceeding with this comparison, we need first to assign the optimal configuration (i.e., k
value) for the kNN approach.
Figure 5.3 presents classification results corresponding to several k values. As expected,
1NN was found to be not very robust. Optimal performance may be reached by using k = 2
in combination with dimensionality of 130. However, if we keep increasing the value of k,
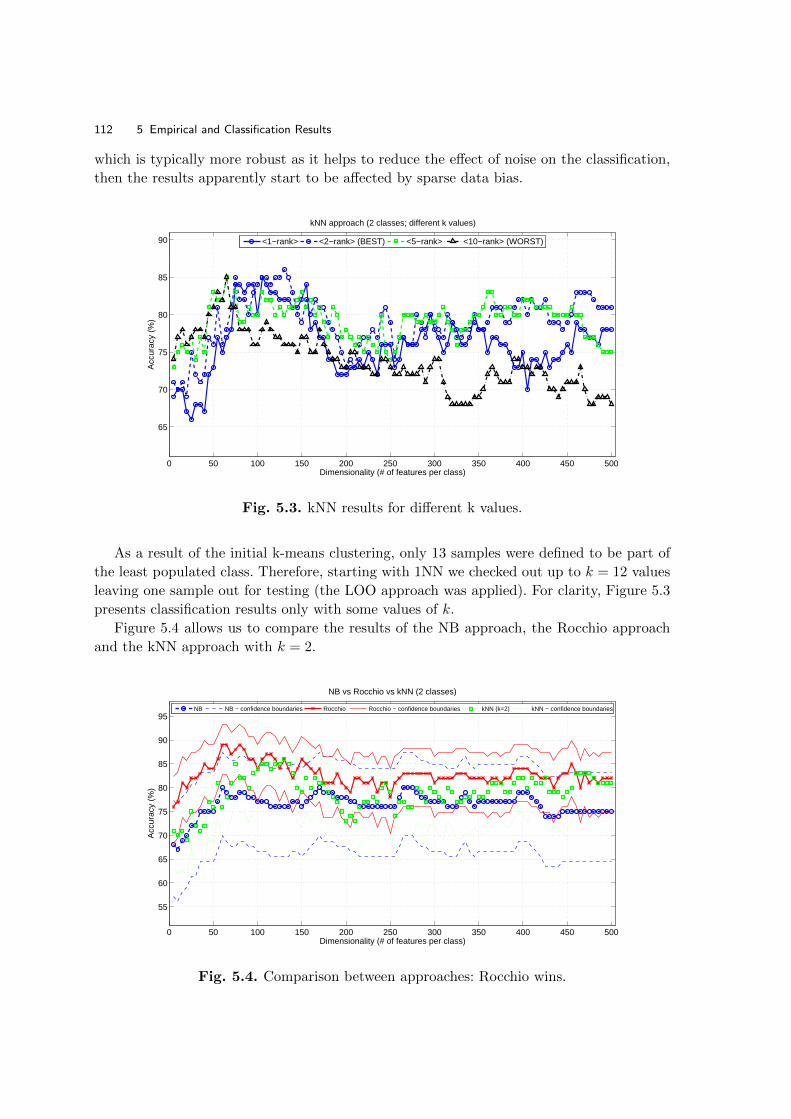
112 5 Empirical and Classification Results
which is typically more robust as it helps to reduce the effect of noise on the classification,
then the results apparently start to be affected by sparse data bias.
0 50 100 150 200 250 300 350 400 450 500
65
70
75
80
85
90
kNN approach (2 classes; different k values)
Dimensionality (# of features per class)
Acc
urac
y (%
)
<1−rank> <2−rank> (BEST) <5−rank> <10−rank> (WORST)
Fig. 5.3. kNN results for different k values.
As a result of the initial k-means clustering, only 13 samples were defined to be part of
the least populated class. Therefore, starting with 1NN we checked out up to k = 12 values
leaving one sample out for testing (the LOO approach was applied). For clarity, Figure 5.3
presents classification results only with some values of k.
Figure 5.4 allows us to compare the results of the NB approach, the Rocchio approach
and the kNN approach with k = 2.
0 50 100 150 200 250 300 350 400 450 500
55
60
65
70
75
80
85
90
95
NB vs Rocchio vs kNN (2 classes)
Dimensionality (# of features per class)
Acc
urac
y (%
)
NB NB − confidence boundaries Rocchio Rocchio − confidence boundaries kNN (k=2) kNN − confidence boundaries
Fig. 5.4. Comparison between approaches: Rocchio wins.

5.1 Analysis of Monologues 113
A first important result that we can derive from Figure 5.4 is that both Rocchio and
kNN are clearly outperforming the NB approach, although the top performance is defined
for different dimensionalities in each case. The kNN performance had a maximum accuracy
of 86% for 130-dimensionality, while Rocchio just required 60 features per class to improve
it up to 89%. The NB top performance was 80% for the same dimensionality (60 features
per class).
As typically occurs in TC tasks, most of the learning takes place with a small yet crucial
portion of features (i.e., keywords) for a class. This is evident in the steeper learning curves
that reach the top performance at relatively low dimensionality. Therefore, we may conclude
that the class-based feature selection approach is shown to be successful in quickly finding
the most crucial or indicative class keywords.
Another visible result in Figure 5.4, common to all the tested approaches, is the perfor-
mance decrease as the value of F increases (particularly beyond a 200-dimensional value).
As we already introduced in Section 5.1.3 and proved in Tables 5.19 and 5.20, the higher
the value of F , the more significant the intersection between class-specific word subsets. If
we expand this interpretation, the more significant the intersection, the less discriminative
the class-specific subsets, the more likely to include words that are not really indicative of
any of the classes, and so the performance decreases.
Using Words vs Lemmas
As we introduced in Section 4.4.3, we also tried a word lemmatisation strategy (i.e., to group
together those words that are in different forms but with the same lemma). This strategy
was implemented as part of the data pre-processing stage during the classification task.
Figure 5.5 shows the results with and without word lemmatisation for our top performing
approach: the Rocchio one.
0 50 100 150 200 250 300 350 400 450 50055
60
65
70
75
80
85
90
95
Rocchio approach: words vs stems (2 classes)
Dimensionality (# of features per class)
Acc
urac
y (%
)
Using words Word confidence boundaries Using stems Stem confidence boundaries
Fig. 5.5. Classification results using words vs lemmas.

114 5 Empirical and Classification Results
The main advantage of word lemmatisation is to reduce the dimensionality of the data
space. In a TC task, it is basically applied under the assumption that all the documents
belonging to the same category or topic may include these lemmas appearing in different
forms, and of course, it makes sense to use them as they refer to words with similar meanings.
TC tasks typically rely on this. However, to be successful and thus really enhance system
performance, there is another important hypothesis that also needs to be confirmed: each
topic or class to be distinguished should be fairly represented by only some class-specific
lemmas.
While the former one happens to be true for most of the cases, the latter one, though also
successfully applied in typical TC tasks, may reasonably not be true in our case. The main
reason for this would be that, from this point of view, all the documents (i.e., monologues)
could be regarded as belonging to the same category according to their topic or content: all
the documents are about the film which the participants watched. Consequently, we could
expect an important number of lemmas to be shared among the participants as they all
were talking about the same topic.
This is an important difference with conventional TC tasks where, normally, the topics or
classes are well separated according to their conceptualization. In contrast, in our domain
we may expect the participants to be identifiable among others not by the concepts or
ideas themselves but by the way they express these ideas. Therefore, in this particular case,
we may expect lemmas not to have much contribution to category discrimination but the
different endings and forms instead. Hence, missing this discriminative information because
of lemmatisation (simplifying words with different forms into their more common roots)
could have some undesirable consequences in classification and clustering.
Lemmatisation of compound words would simply reduce them to their more common
lemmas thus losing this discriminative information.
To what extent this argument could be either true or false is something that can be
derived from Figure 5.5. In fact, the word-based approaches systematically outperform the
lemma-based ones. Confidence boundaries for both cases are also shown in this figure.
Tempted to Use More Classes
Although the two-classes scheme can be found entirely suitable from a practical implementa-
tion point of view (i.e., participants with a lower, an average and a higher verbal intelligence
level), we were also interested in analysing the performance of the suggested approaches for
a higher number of classes. This would enable a better granularity for the verbal intelligence
classification.
Figure 5.6 presents benchmarking results for three classes instead of two (as shown in
Figure 5.4). In this case, kNN showed the best performance by using k = 10 compared with
other k-values. As we may see, Rocchio again outperformed the other approaches. Its top
accuracy was 87% for 65-dimensionality.
In this regard it seems to be important to remark that working with a higher number
of classes, like 4 or more, was practically infeasible because of sparse data problems (i.e.,
k-means resulted in unpopulated classes).

5.2 Analysis of Dialogues 115
0 50 100 150 200 250 300 350 400 450 50040
50
60
70
80
90
NB vs Rocchio vs kNN (3 classes)
Dimensionality (# of features per class)
Acc
urac
y (%
)
NB NB − confidence boundaries Rocchio Rocchio − confidence boundaries kNN (k=10) kNN − confidence boundaries
Fig. 5.6. Tempted to use more classes: three classes.
5.2 Analysis of Dialogues
As stated above, methods of linguistic and computational analysis and the TF-IDF approach
were also applied to the dialogues from the verbal intelligence corpus. In the following
sections, we present the results of this investigation. In Section 5.2.1, we present linguistic
and conversational cues that were determined to be significant according to ANOVA and
the Kruskal-Wallis test and that reflect the verbal intelligence of speakers when they are
engaged in a conversation. In Section 5.2.2, we apply feature selection algorithms (IGR, V2-
Test and GA) to the extracted cues and train kNN, Naive Bayes, and SVM. The performance
of these classifiers was compared with each other for different feature sets. As a result, we
determined a combination of indicators that provides a satisfactory classification accuracy.
Additionally, we represented each dialogue as a feature vector using the TF-IDF approach.
The obtained vectors were used for the classification task. The classification results are
discussed in Section 5.2.3.
5.2.1 Feature Analysis
In this section, we investigated the verbal and communication behaviour of speakers when
they are engaged in a conversation and found linguistic and conversational cues that may
reflect the verbal intelligence of dialogue partners.
The approaches that were described in Chapter 4 were applied to the dialogues of speakers
with different verbal intelligence. As a result, we obtained linguistic cues that indicate the
complexity of dialogues at the morphological, lexical, syntactic, semantic, and stylistic levels.
Additionally, we analysed the flow of conversations, ability of dialogue partners to adapt to
each other, and to express their dominant position during a dialogue. To determine features
that reflect the verbal intelligence of dialogue participants, ANOVA was applied to the
extracted cues. For the analysis, we used the clusters described in Section 4.4.1. In this
section, we present only significant ANOVA results.

116 5 Empirical and Classification Results
Linguistic Analysis at the Morphological, Lexical, Syntactic, Semantic and Stylistic
Levels
In Table 5.21, we may see the ANOVA significant results for two and three verbal intelli-
gence clusters (Clustering 1 and 2). In Table 5.22, we may see significant results for groups
from Clustering 5 (Type A, B, C, D). For the analysis, we used the spoken utterances of
individuals without taking into account the influence of dialogue partners on the language
use of these speakers. In other words, we created separate text files that contained the spo-
ken utterances of only one dialogue participant. Essentially, we performed the same analysis
with dialogues as was done with monologues.
Table 5.21. Mean values of significant features extracted from the dialogues.
Extracted features 2 clusters 3 clusters
Low High Low Average High
Morphological Level
Compoundings 0.039** 0.046** 0.039** 0.043** 0.049**
Length of adjectives 6.962* 7.280* 6.963** 7.099** 7.505**
Words longer than 8 letters 1.309 1.400 1.303* 1.342* 1.482*
Words longer than 9 letters 1.022* 1.135* 1.020** 1.072** 1.213**
Lexical Level
Numbers 0.006 0.007 0.005* 0.006* 0.008*
Interjections 0.0033* 0.0055* 0.002 0.005 0.004
Syntactic Level
Present participle 0.0006** 0.0013** 0.0006** 0.0009** 0.0019**
Sentences with short correction distance 3.303 3.328 3.297* 3.282* 3.110*
Semantic Level
Physical 0.003** 0.005** 0.003 0.005 0.004
Body 0.001* 0.001* 0.0011 0.0016 0.002
Sleep 0.0001* 0.0004* 0.0001 0.0003 0.0004
Fillers 0.0002** 0.0008** 0.0002** 0.0005** 0.0012**
Note: **p≤0.01, *p≤0.05 (ANOVA)
One may expect that the ANOVA significant features for the dialogues should be the
same as for the monologues. However, many of the linguistic cues that possibly reflect
the verbal intelligence of speakers (according to ANOVA for the monologues) were not
determined to be significant for the dialogues. We propose that this may happen because
of the adaptation of speakers to each other during their conversations. For example, lower
verbal intelligence speakers may automatically use other syntactic forms when they talk
to higher verbal intelligence speakers or frequently choose abstract words for expressing
their thoughts. In this chapter, we attempted to determine at which linguistic level this
adaptation happens.
Let us have a look at the morphological features that were determined to be significant.
These features are Compoundings, Length of adjectives, Words longer than 8 letters, and
Words longer than 9 letters. In the German language, it is possible to create new words
by combining two or more stems together (compoundings). Such words frequently consist
of ten or more letters and, according to our definition, are long words. Spoken utterances
with several compoundings may significantly increase the average number of long words in

5.2 Analysis of Dialogues 117
Table 5.22. Mean values of significant linguistic cues extracted from the dialogues.
Extracted feature Type A Type B Type C Type D
H(L) H(H) L(L) L(H) L(L) H(L) L(H) H(H)
Morphological Level
Length of adjective 7.038 7.308 7.132 6.855 7.132 7.038 6.855* 7.308*
Lexical Level
Verb-Adj. Ratio 0.005 0.005 0.003* 0.005* 0.003 0.005 0.005 0.006
Type/Token Lemma 0.304 0.305 0.267* 0.315* 0.267 0.304 0.315 0.305
Type/Token Words 0.387 0.382 0.343* 0.398* 0.343* 0.387* 0.398 0.382
Frequency 8.336 8.609 8.831** 8.280** 8.831** 8.336** 8.280 8.609
Hin/Her words 0.001 0.001 0.002 0.001 0.002* 0.001* 0.001 0.002
r-words 0.003 0.002 0.003 0.004 0.003 0.003 0.003 0.002
Syntactic Level
Passive Voice 0.009 0.009 0.010* 0.006* 0.010 0.009 0.006 0.009
Correction distance 5.375* 5.055* 5.315 5.358 5.315 5.375 5.357 5.055
Present participles 0.001 0.001 0.001 0.001 0.0007* 0.0015* 0.001 0.001
Semantic Level
Positive Feeling 0.0001 0.0005 0.0007 0.0006 0.0007* 0.0001* 0.0006 0.0005
Anxiety 0.0008 0.0005 0.001** 0.0002** 0.0011 0.0008 0.0002 0.0005
Exclusive 0.031 0.035 0.031 0.029 0.031 0.031 0.029* 0.035*
Sleep 0.0003* 0.0001* 0.00 0.0001 0.00* 0.0003* 0.0001 0.0001
Future 0.008 0.007 0.007* 0.004* 0.007 0.008 0.004* 0.007*
Achievement 0.030 0.033 0.033* 0.027* 0.033 0.030 0.027 0.033
Sports 0.002 0.002 0.002* 0.003* 0.002 0.002 0.003 0.002
Money 0.004 0.006 0.006 0.004 0.006 0.004 0.004 0.006
Swear 0.0004 0.0004 0.0004* 0.0001* 0.0004 0.0004 0.0001 0.0004
Stylistic Level
Verbal Immediacy -0.895 -0.023 0.444* -0.937* 0.444* -0.895* -0.937 -0.023
Cogn. Complexity -1.915* -0.124* 0.314** -2.082** 0.314* -1.915* -2.082* -0.124*
Rationalization -0.416 -0.223 0.240** -0.959** 0.240 -0.416 -0.958* -0.223*
Femininity 1.768 -0.018 -1.118** 2.959** -1.118* 1.768* 2.958* -0.018*
Presidentiality -1.767 -0.262 0.999** -2.082** 0.999* -1.767* -2.081 -0.262
Honesty -0.352 0.115 0.481** -0.728** 0.048 -0.352 -0.727* 0.115*
Depression -0.584 0.319 0.085 -0.443 0.085 -0.584 -0.443 0.319
Note: **p≤0.01, *p≤0.05 (ANOVA)
the text file. This may explain the significant occurrence of this feature in the dialogues
and confirm that higher verbal intelligence users more frequently combine several words
together in their everyday speech. Compoundings and Long words were also determined to
be significant for the monologues. We may conclude that these features are robust indicators
of speakers’ verbal intelligence and are not influenced by the language of other dialogue
participants.
As we may see from Table 5.21, no significant difference in the occurrence of such reg-
ular parts of speech as nouns, verbs, adjectives, and adverbs was found. However, ANOVA
determined that Numbers occurred in the speech samples of higher verbal intelligence speak-
ers more frequently than of individuals with lower and average levels of verbal intelligence.
When discussing the education system in Germany, higher verbal intelligence speakers more
frequently talked about tuition fees, wages of teachers and professors, provided research and
statistical information related to the education system, etc. To express their ideas, they used

118 5 Empirical and Classification Results
numbers in their speech (e.g., “4500 vacancies for the new semester”, “500 students”, “25%
of all the universities”, etc.). Interjections were also found to be significant for two classes
according to ANOVA.
ANOVA also showed that higher verbal intelligence speakers more frequently construct
sentences with the present participle in their dialogues than individuals with lower and av-
erage verbal intelligence levels. In contrast, lower and average verbal intelligence speakers
correct themselves more frequently than their dialogue partners with a higher verbal intel-
ligence level. In Table 5.21, we may also see several semantic categories that were found to
be significant. Interestingly, higher verbal intelligence individuals used more fillers in their
speech than other speakers who participated in our experiment.
Let us have a look at Table 5.22 which shows features that were found to be significant
for each group of speakers from Clustering 5 (Section 4.4.1). Analysing these results, we
may see that dialogue partners from different verbal intelligence groups always adapted to
each other during their conversations. For example, ANOVA did not show any significant
difference for Compoundings and Long words, although these features were found to reflect
the verbal intelligence levels of speakers with different verbal intelligence. This means that
the dialogue partners adapted to each other during their conversations. Higher verbal intel-
ligence speakers used fewer compoundings and shorter words to express their thoughts and
feelings; lower verbal intelligence individuals tried to match the speech style of their higher
verbal intelligence partners and more frequently compound new words. However, Length of
adjectives was found to be significant for Type D. The occurrence of this cue in speech sam-
ples of higher and lower verbal intelligence speakers was significantly different when they
were talking to higher verbal intelligence dialogue partners.
When lower verbal intelligence speakers talked to higher verbal intelligence dialogue
partners, their type-token ratio for words and lemmas and verb-adjective ratio became sig-
nificantly greater than when talking to lower verbal intelligence dialogue partners (Type
B). Interestingly, ANOVA showed that lower verbal intelligence speakers in conversations
with lower verbal intelligence partners used rarer words (terms with higher indexes in the
frequency dictionary that was used in this work) than when talking to higher verbal in-
telligence speakers. In conversations with lower verbal intelligence dialogue partners, lower
verbal intelligence speakers used more sentences with a passive voice and expressed more
words that are related to anxiety, future, and achievements. Such speakers typically used
more swear words in their conversations (Type B). Additionally, several stylistic indicators
of these speakers had significantly greater values according to ANOVA. We may also see the
significant difference in lexical, syntactic, semantic, and stylistic indicators for other groups
of this clustering. However, it is still difficult to conclude at which linguistic levels speakers
with different verbal intelligence adapt to each other. For this purpose, we analysed the
communication behaviour of dialogue participants and applied ANOVA to the extracted
features. The results of this analysis are presented in the following.
Flow of Conversations
Features that were extracted to measure the fluency of conversations were described in Sec-
tion 4.2.1. As mentioned above, some of these features reflect the communication behaviour
of dialogue partners (e.g., Total speaking time and Speech rate) and the others indicate the
flow of conversations (e.g., Total silent time, Number of short pauses, Number of long pauses,
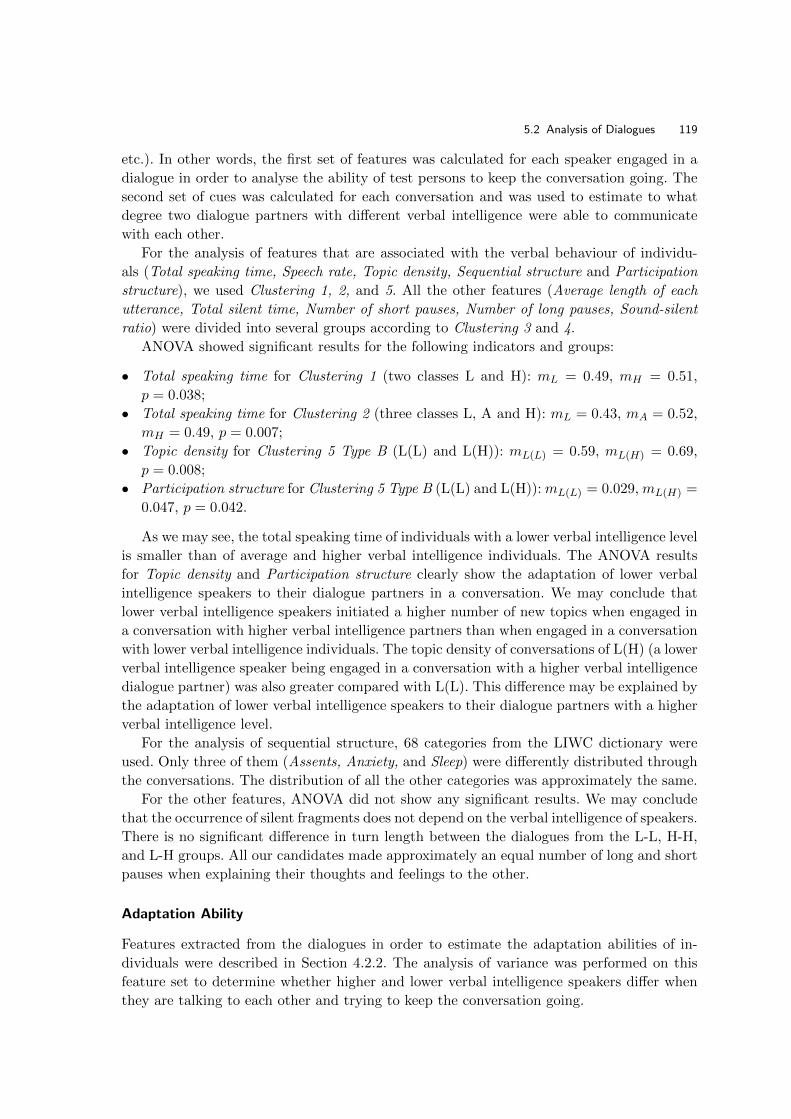
5.2 Analysis of Dialogues 119
etc.). In other words, the first set of features was calculated for each speaker engaged in a
dialogue in order to analyse the ability of test persons to keep the conversation going. The
second set of cues was calculated for each conversation and was used to estimate to what
degree two dialogue partners with different verbal intelligence were able to communicate
with each other.
For the analysis of features that are associated with the verbal behaviour of individu-
als (Total speaking time, Speech rate, Topic density, Sequential structure and Participation
structure), we used Clustering 1, 2, and 5. All the other features (Average length of each
utterance, Total silent time, Number of short pauses, Number of long pauses, Sound-silent
ratio) were divided into several groups according to Clustering 3 and 4.
ANOVA showed significant results for the following indicators and groups:
• Total speaking time for Clustering 1 (two classes L and H): mL = 0.49, mH = 0.51,
p = 0.038;
• Total speaking time for Clustering 2 (three classes L, A and H): mL = 0.43, mA = 0.52,
mH = 0.49, p = 0.007;
• Topic density for Clustering 5 Type B (L(L) and L(H)): mL(L) = 0.59, mL(H) = 0.69,
p = 0.008;
• Participation structure for Clustering 5 Type B (L(L) and L(H)): mL(L) = 0.029, mL(H) =
0.047, p = 0.042.
As we may see, the total speaking time of individuals with a lower verbal intelligence level
is smaller than of average and higher verbal intelligence individuals. The ANOVA results
for Topic density and Participation structure clearly show the adaptation of lower verbal
intelligence speakers to their dialogue partners in a conversation. We may conclude that
lower verbal intelligence speakers initiated a higher number of new topics when engaged in
a conversation with higher verbal intelligence partners than when engaged in a conversation
with lower verbal intelligence individuals. The topic density of conversations of L(H) (a lower
verbal intelligence speaker being engaged in a conversation with a higher verbal intelligence
dialogue partner) was also greater compared with L(L). This difference may be explained by
the adaptation of lower verbal intelligence speakers to their dialogue partners with a higher
verbal intelligence level.
For the analysis of sequential structure, 68 categories from the LIWC dictionary were
used. Only three of them (Assents, Anxiety, and Sleep) were differently distributed through
the conversations. The distribution of all the other categories was approximately the same.
For the other features, ANOVA did not show any significant results. We may conclude
that the occurrence of silent fragments does not depend on the verbal intelligence of speakers.
There is no significant difference in turn length between the dialogues from the L-L, H-H,
and L-H groups. All our candidates made approximately an equal number of long and short
pauses when explaining their thoughts and feelings to the other.
Adaptation Ability
Features extracted from the dialogues in order to estimate the adaptation abilities of in-
dividuals were described in Section 4.2.2. The analysis of variance was performed on this
feature set to determine whether higher and lower verbal intelligence speakers differ when
they are talking to each other and trying to keep the conversation going.
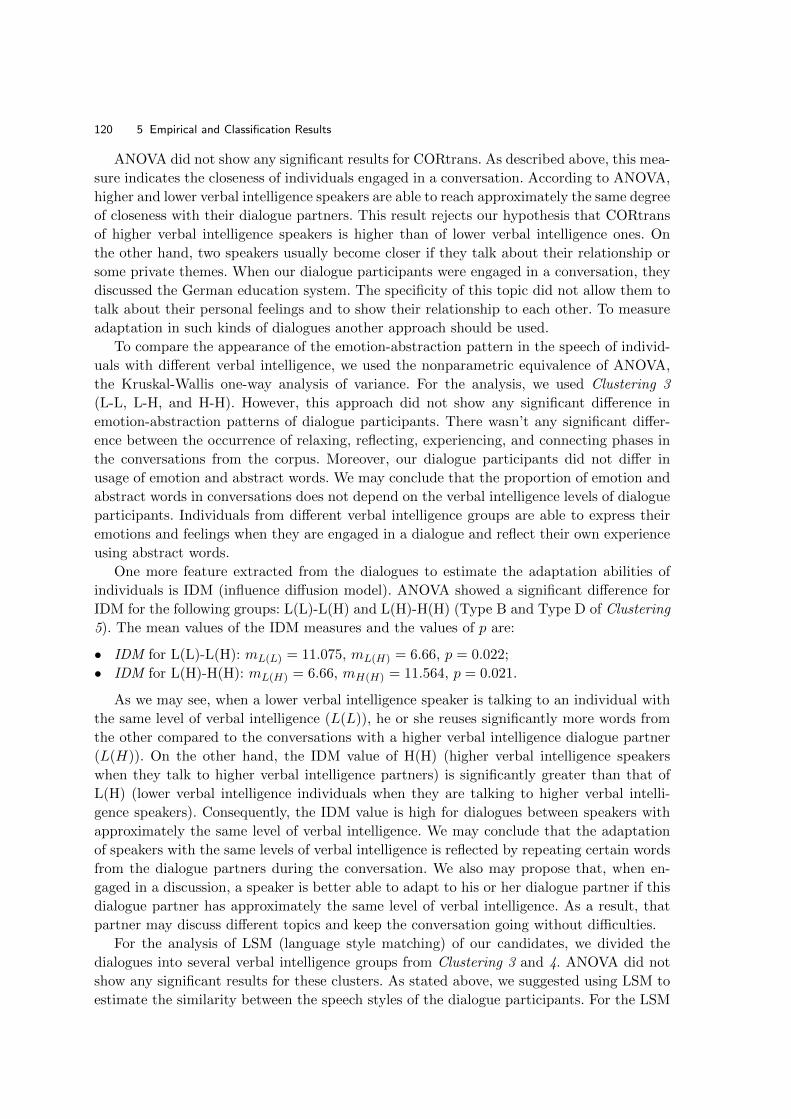
120 5 Empirical and Classification Results
ANOVA did not show any significant results for CORtrans. As described above, this mea-
sure indicates the closeness of individuals engaged in a conversation. According to ANOVA,
higher and lower verbal intelligence speakers are able to reach approximately the same degree
of closeness with their dialogue partners. This result rejects our hypothesis that CORtrans
of higher verbal intelligence speakers is higher than of lower verbal intelligence ones. On
the other hand, two speakers usually become closer if they talk about their relationship or
some private themes. When our dialogue participants were engaged in a conversation, they
discussed the German education system. The specificity of this topic did not allow them to
talk about their personal feelings and to show their relationship to each other. To measure
adaptation in such kinds of dialogues another approach should be used.
To compare the appearance of the emotion-abstraction pattern in the speech of individ-
uals with different verbal intelligence, we used the nonparametric equivalence of ANOVA,
the Kruskal-Wallis one-way analysis of variance. For the analysis, we used Clustering 3
(L-L, L-H, and H-H). However, this approach did not show any significant difference in
emotion-abstraction patterns of dialogue participants. There wasn’t any significant differ-
ence between the occurrence of relaxing, reflecting, experiencing, and connecting phases in
the conversations from the corpus. Moreover, our dialogue participants did not differ in
usage of emotion and abstract words. We may conclude that the proportion of emotion and
abstract words in conversations does not depend on the verbal intelligence levels of dialogue
participants. Individuals from different verbal intelligence groups are able to express their
emotions and feelings when they are engaged in a dialogue and reflect their own experience
using abstract words.
One more feature extracted from the dialogues to estimate the adaptation abilities of
individuals is IDM (influence diffusion model). ANOVA showed a significant difference for
IDM for the following groups: L(L)-L(H) and L(H)-H(H) (Type B and Type D of Clustering
5). The mean values of the IDM measures and the values of p are:
• IDM for L(L)-L(H): mL(L) = 11.075, mL(H) = 6.66, p = 0.022;
• IDM for L(H)-H(H): mL(H) = 6.66, mH(H) = 11.564, p = 0.021.
As we may see, when a lower verbal intelligence speaker is talking to an individual with
the same level of verbal intelligence (L(L)), he or she reuses significantly more words from
the other compared to the conversations with a higher verbal intelligence dialogue partner
(L(H)). On the other hand, the IDM value of H(H) (higher verbal intelligence speakers
when they talk to higher verbal intelligence partners) is significantly greater than that of
L(H) (lower verbal intelligence individuals when they are talking to higher verbal intelli-
gence speakers). Consequently, the IDM value is high for dialogues between speakers with
approximately the same level of verbal intelligence. We may conclude that the adaptation
of speakers with the same levels of verbal intelligence is reflected by repeating certain words
from the dialogue partners during the conversation. We also may propose that, when en-
gaged in a discussion, a speaker is better able to adapt to his or her dialogue partner if this
dialogue partner has approximately the same level of verbal intelligence. As a result, that
partner may discuss different topics and keep the conversation going without difficulties.
For the analysis of LSM (language style matching) of our candidates, we divided the
dialogues into several verbal intelligence groups from Clustering 3 and 4. ANOVA did not
show any significant results for these clusters. As stated above, we suggested using LSM to
estimate the similarity between the speech styles of the dialogue participants. For the LSM

5.2 Analysis of Dialogues 121
measure, the following linguistic categories were taken into account: personal and imper-
sonal pronouns, auxiliary verbs, adverbs with a high frequency, prepositions, conjunctions,
negations, quantifiers and articles. These categories may also be called function words, which
show how speakers combine their words together when expressing their thoughts and feel-
ings. When adapting to each other, individuals automatically change the usage of these
categories in their speech. However, this adaptation does not depend on their levels of ver-
bal intelligence. Both higher and lower verbal intelligence speakers are able to match the
language style of the other when they are engaged in a conversation.
Let us analyse the similarity between the language use of the dialogue partners at the
conversational and turn-by-turn levels. To measure the similarity at the conversational level,
we calculated the Pearson correlation coefficient between the extracted verbal and commu-
nication cues of the dialogue partners across the dialogues. The results were analysed for
the groups of conversations from Clustering 3 (groups L-L, H-H, and L-H).
For participants from the group L-L, 18.51% of the features showed a significant corre-
lation. For participants from the group H-L this value was 16.29%, for H-H this value was
25.92%. Table 5.23 shows the percentage of features with significant correlation coefficients
for each linguistic group.
Table 5.23. Percentage of linguistic categories with significant correlation coefficients atthe conversational level.
Groups of features L-L H-H H-L
Morphological 2.22% 0.74% 0.74%Lexical 3.70% 7.40% 7.40%Syntactic 2.22% 0.74% 0.74%Semantic 5.92% 6.66% 4.44%Stylistic 1.48% 3.70% 0.74%Communication 2.96% 6.66% 2.22%
As we may see, individuals from different verbal intelligence groups showed adaptation
at each linguistic level. The highest percentage values were obtained for the lexical and
semantic feature sets. We may conclude that higher and lower verbal intelligence speakers
tend to adapt at the lexical and semantic levels. Let us compare the results for the groups
of dialogues L-L, L-H, and H-H. Higher verbal intelligence speakers showed the highest
adaptation abilities when talking to higher verbal intelligence individuals. Interestingly, the
level of adaptation in dialogues between lower verbal intelligence speakers (L-L) is higher
than in dialogues between higher and lower verbal intelligence dialogue partners (L-H). We
again may conclude that speakers, when talking to individuals with approximately the same
levels of verbal intelligence, are better able to adapt to them than when communicating with
individuals from other verbal intelligence groups.
Let us analyse the similarity between the speech samples of dialogue partners using the
frequency distribution approach. ANOVA was performed for the groups from Clustering 3
and 4.
Features with significant ANOVA results are:
• Word 3-gram for F-F and S-S: mF−F = −52.04, mS−S = −40.46, p = 0.011;

122 5 Empirical and Classification Results
• Lemma (Type 1) 3-gram for F-F and S-S: mF−F = −44.37, mS−S = −34.34, p = 0.032;
• Part-of-speech (Type 1) 4-gram for H-H, L-L and H-L: mH−H = −12.72, mL−L = 24.03,
mH−L = −25.37, p = 0.004;
• Part-of-speech (Type 2) 4-gram for H-H, L-L and H-L: mH−H = −16.98, mL−L = 18.72,
mH−L = −29.18, p = 0.009.
As we may see, the similarities of word and lemma 3-grams between friends or rel-
atives were greater than between participants who had not met each other before. The
part-of-speech 4-gram similarity was greater for H-L dialogues compared to L-L and H-H
conversations.
We may conclude that speakers with a higher and lower verbal intelligence level, when
engaged in a conversation, adapt to their dialogue partners. However, this adaptation takes
place at different linguistic and communication levels depending on the verbal intelligence
of the other. Speakers with approximately the same level of verbal intelligence (in L-L and
H-H dialogues) adapt to each other by re-using certain words from their dialogue part-
ners. Individuals from different verbal intelligence groups (in L-H dialogues) adapt to each
other by matching their syntactic structures (part-of-speech n-grams) to the language use of
their conversation partners. However, higher verbal intelligence speakers are better able to
adapt to each other. The similarity between their dialogue turns (that is calculated as the
correlation coefficient between certain linguistic cues) is greater than that of lower verbal
intelligence speakers.
Let us analyse the abilities of higher and lower verbal intelligence speakers to dominate
in a conversation.
Ability to Dominate
As described in the previous chapter, for the analysis of the dominant behaviour of indi-
viduals engaged in a conversation, we measured the centrality and prestige of each dialogue
partner and asked several judges to estimate the dominance using a 10-point scale.
ANOVA did not show any significant difference for the centrality and prestige measures
for different groups of dialogues (Clustering 4 and 5). However, we may not conclude that
higher and lower verbal intelligence speakers have the same importance in their conversa-
tions. As stated above, social networks should be applied to dialogues between three or
more participants. For the analysis of our dialogues, we suggested calculating the duration
of pauses and considered them as turns of the third dialogue partner. To make certain con-
clusions about centrality and prestige of speakers with different verbal intelligence when
they are engaged in a conversation, further investigations are necessary.
For the analysis of the dominance measures (that were obtained using a 10-point scale),
we performed a number of experiments that are described in the following.
• Experiment 1. For each group (H-H, L-L and L-H) we analysed the percentage of dis-
cussions in which a candidate with a greater verbal intelligence coefficient dominated his
or her dialogue partner. Let’s name these values XH−H , XL−L and XL−H . According to
our results, XH−H = 52%, XL−L = 72% and XL−H = 85%.
• Experiment 2. Let D(A1) and D(B1) be dominance scores of the dialogue partners from
the first dialogue, D(A2) and D(B2) be dominance scores of the dialogue partners from
the second dialogue, etc. For each dyadic conversation the differences |D(A1)−D(B1)|,

5.2 Analysis of Dialogues 123
|D(A2)−D(B2)|, etc. were calculated. The averaged values of the differences |D(A1)−D(B1)|, |D(A2)−D(B2)|, etc. for each group L-L, H-H, and L-H were compared with each
other using the one-way analysis of variance (ANOVA) and its nonparametric equiva-
lence, the Kruskal-Wallis one-way analysis of variance. However, these tests did not show
any significant results.
• Experiment 3. Let D = (|D(A1) − D(B1)|, |D(A2) − D(B2)|, ..., |D(AN ) − D(BN )|) be
a vector containing differences between the dominance scores of the dialogue partners,
VI = (|V I(A1)− V I(B1)|, |V I(A2)− V I(B2)|, ..., |V I(AN )− V I(BN )|) be a vector con-
taining differences between the verbal intelligence scores of the dialogue partners, N is
the number of dialogues in the corpus. The Pearson correlation coefficient was calculated
to measure statistical dependence between D and VI. However, the value of the correla-
tion coefficient was not statistically significant. Then we decided to calculate the Pearson
correlation coefficient between D and VI separately for each group (L-L, H-H, and L-
H). For the group with lower verbal intelligence dialogue partners, L-L, the correlation
coefficient was 0.75.
As we may see from the results, speakers with a higher verbal intelligence level were able
to dominate in the conversations independently of the verbal intelligence of their dialogue
partners. When test persons with a lower verbal intelligence level were talking to dialogue
partners with approximately the same verbal intelligence levels, in 72% of dialogues they
were able to dominate and influence the opinion of the dialogue partner. When lower verbal
intelligence participants talked to higher verbal intelligence partners, it was not always easy
for the former to dominate in the discussions (only in 15% of the dialogues). The correlation
coefficient between the dominance and verbal intelligence differences (D and VI) for L-H
was not significant. This means that when the distance between the verbal intelligence scores
of the dialogue partners was getting greater, their dominance difference stayed the same. A
strong positive correlation between D and VI may be seen only for the group L-L (lower
verbal intelligence participants).
5.2.2 Training Classifiers using Linguistic Features
In the previous section, we analysed differences in language use and communication be-
haviour of speakers with different verbal intelligence. In this section we use features ex-
tracted from the dialogues for the classification task. As we know, these features may be
divided into the following groups: morphological, lexical, syntactic, semantic, stylistic, and
adaptation. The first five groups include features that correspond to different linguistic lev-
els. The group Adaptation consists of cues that reflect the flow of conversations and indicates
the adaptation of dialogue partners to each other. Our goal is to determine the dialogue
feature set that provides the highest classification accuracy.
Analysis of the classification results in Section 5.1.2 showed that the genetic algorithm
always outperformed the other feature selection methods (Information gain ratio and V2-
Test). That is why we decided to apply only the genetic algorithm to the features extracted
from the dialogues and to train the k-NN, Naive Bayes, and SVM classifiers.
Table 5.24 presents the classification accuracy values for the different feature sets. The
classification was performed for the two groups: higher and lower verbal intelligence dialogue
partners.

124 5 Empirical and Classification Results
Table 5.24. Classification accuracy values for the dialogues. Classes: higher and lowerverbal intelligence speakers.
Feature Set kNN Naive Bayes SVM
Morphological 76.99% 70.80% 70.80%Lexical 68.14% 66.37% 67.26%Syntactic 69.03% 69.91% 71.00%Semantic 79.65% 81.42% 82.30%Stylistic 66.37% 74.34% 66.37%Adaptation 74.34% 73.45% 68.14%All features 72.57% 78.76% 83.20%
Using the morphological feature set, kNN in combination with GA showed a classifica-
tion accuracy of 76.99%. Features that were selected for the classification are Derivations,
Compoundings, Inflections, Length of adverbs, Words longer than 8 letters, Words longer
than 10 letters. As we may see, almost all the features that were significant according to
ANOVA (with the exception of Words longer than 9 letters) were chosen by GA for the
classification.
The kNN classifier showed an accuracy of 68.14% for the lexical features. Cues that
were used for the classification are Nouns, Verbs, Prepositions, Discontinuous conjunctions,
Numbers, Articles, Interjections. If we compare these indicators to features that were found
to be informative according to ANOVA, we will see that all of them are among the cues
selected by GA for the classification.
For the semantic feature set, SVM was able to obtain an accuracy of 82.30%. GA selected
22 semantic cues for the classification. Again, almost all of the ANOVA informative cues
(with the exception of the category Sleep) were chosen by GA for the classification. As
described above, SVM in combination with GA obtained an accuracy of 80% using semantic
features for the classification of monologues into two classes. As we may see, the appearance
of certain LIWC categories in speech may reflect the verbal intelligence of individuals. If we
compare semantic features that were selected by GA for the classification of monologues and
dialogues to each other, we will see that only six of them may be found in both feature sets.
As we know, semantic categories reflect what a speaker is talking about. The topics of the
monologues and dialogues were completely different: the Galileo program for the monologues
and the school system in Germany for the dialogues. This explains the difference between
semantic categories chosen for the classification by GA.
As we may see from the table, the highest accuracy achieved by the classifiers for the
syntactic, stylistic, and adaptation feature sets does not exceed 75%. If we have a look at
ANOVA significant features, we will see that most of them were selected by GA for the
classification.
Applying GA to all the cues extracted from the dialogues of our test persons, we obtained
the combination of features that may reflect the verbal intelligence of speakers when they are
engaged in a conversation. Using them for the classification task, we were able to obtain a
classification accuracy of 83.20% for two classes. For three classes (higher, average, and lower
verbal intelligence speakers), the highest classification accuracy of 73.30% was achieved by
SVM. Let us compare these results with those obtained using the TF-IDF approach.

5.2 Analysis of Dialogues 125
5.2.3 Training Classifiers using the TF-IDF Approach
For the comparison, the TF-IDF approach was applied to the conversations to determine
the verbal intelligence levels of speakers. For this purpose each dialogue was represented as
a feature vector, that contains terms and their weights. The feature selection was performed
in the same way as shown in the previous chapter: we selected N terms with the highest
TF-IDF measures for the classification. All the other words were removed as stop words. As
presented in this chapter, the class-based approach clearly outperformed the corpus-based
one for the monologues. That is why for the classification of the conversations into several
verbal intelligence groups we used only the class-based keyword selection method.
Before comparing the performance of the classifiers that were used in this work (kNN,
Rocchio, and Naive Bayes), we determined the optimal k value for the kNN approach.
Figures 5.7 and 5.8 present classification results with several k-values for two and three
classes.
50 100 150 200 250 300 350 400 450 500
70
75
80
85
90
kNN approach (2 classes; different k values)
Dimensionality (# of features per class)
Acc
urac
y (%
)
<1−rank> <3−rank> (BEST) <5−rank> <10−rank>
Fig. 5.7. kNN results for different k values. Classification of dialogues into two classes.
As we may see, for the two classes the optimal performance (86.73%) was reached by
using k = 3 and dimensionality of 55. For the three classes, kNN obtained an accuracy of
76.11% using k = 9 and 40 features per class.
Figures 5.9 and 5.10 present the classification results obtained by the NB, Rocchio, and
kNN approaches for two and three classes.
As we may see, the kNN and Rocchio approaches significantly outperformed Naive Bayes.
The same conclusion was made in the previous chapter when we used monologues for the
classification task. The Rocchio approach for the two classes (lower and higher verbal in-
telligence speakers) had a maximum accuracy of 91.15% using 50 features per class. For
the classification of monologues into two groups, the Rocchio approach required 60 features
per class and reached 89%. For the three classes, the maximum accuracy of 81.42% was ob-
tained using 65-dimensionality. When using monologues for the classification, the Rocchio
top performance was 87% for the same dimensionality.

126 5 Empirical and Classification Results
50 100 150 200 250 300 350 400 450 50045
50
55
60
65
70
75
80
kNN approach (3 classes; different k values)
Dimensionality (# of features per class)
Acc
urac
y (%
)
<1−rank> <5−rank> <9−rank> (BEST) <10−rank>
Fig. 5.8. kNN results for different k values. Classification of dialogues into three classes.
50 100 150 200 250 300 350 400 450 500
50
55
60
65
70
75
80
85
90
95
NB vs Rocchio vs kNN (2 classes)
Dimensionality (# of features per class)
Acc
urac
y (%
)
NB NB − confidence boundaries Rocchio Rocchio − confidence boundaries kNN (k=3) kNN − confidence boundaries
Fig. 5.9. Comparison between approaches for two classes.
Figure 5.11 shows the difference in the classification performance for word-based and
lemma-based approaches (three classes). As we may see, for a small dimensionality the
lemma-based approach was able to obtain better classification results. Its top performance
is 79.65% using 35 features per class. However, the word-based approach outperforms the
lemma-based one starting with 40-dimensionality.
In this chapter, we described several approaches that were used for the analysis of the
dialogues of speakers with different verbal intelligence. At first the dialogues were analysed
at the morphological, lexical, and semantic levels; additionally, the speech style of dialogue
participants was estimated. Measuring the proportion of speech and silent fragments and the
occurrence of linguistic categories in the discussions, we estimated the fluency of conversa-
tions, topic coherence, and the importance of each speaker in the dialogues. The adaptation

5.2 Analysis of Dialogues 127
50 100 150 200 250 300 350 400 450 500
30
40
50
60
70
80
90
NB vs Rocchio vs kNN (3 classes)
Dimensionality (# of features per class)
Acc
urac
y (%
)
NB NB − confidence boundaries Rocchio Rocchio − confidence boundaries kNN (k=9) kNN − confidence boundaries
Fig. 5.10. Comparison between approaches for three classes.
50 100 150 200 250 300 350 400 450 500
55
60
65
70
75
80
85
90
Rocchio approach: words vs stems (3 classes)
Dimensionality (# of features per class)
Acc
urac
y (%
)
Using words Word confidence boundaries Using stems Stem confidence boundaries
Fig. 5.11. Classification results using words vs lemmas for three classes.
of dialogue participants to each other was estimated using such approaches as sharing space
in discussions, influence diffusion model, and the analysis of similarity between spoken ut-
terances of individuals. All the extracted features were used for the classification of dialogue
participants into several verbal intelligence groups.
For the feature selection, the genetic algorithm was applied to the extracted features.
The kNN, NB, and SVM classifiers were trained. The highest classification accuracy score
for the two classes was obtained by SVM (83.20%). The corresponding feature set consisted
of 69 cues. Such indicators of communication behaviour as actor degree centrality and actor
closeness (from social network analysis) were also determined to be informative features.
For the three classes, the SVM top performance was 73.3%.

128 5 Empirical and Classification Results
Using the TF-IDF approach that takes into account only the vocabulary of dialogue
participants, we were able to improve the classification results. The Rocchio top performance
for the two classes was 91.15% using 50 features per class; for the three classes the achieved
accuracy was 81.42% using 65 features per class.
As we may see, using the vocabulary of dialogue participants for the classification task
is a more promising strategy than the analysis of linguistic and adaptation peculiarities.
Moreover, the second approach (using the TF-IDF measures) may be implemented into
an SDS more easily than the first one (estimating the complexity of sentences at different
linguistic levels and analysing the adaptation behaviour of speakers). In this case the system
may use only words of individuals to determine their verbal intelligence levels and should not
analyse any other language peculiarities. Additionally, this approach will also allow SDSs to
re-estimate the verbal intelligence of users after each turn taking into account terms from
new phrases and sentences.
5.3 Conclusion
In this chapter we showed that verbal intelligence may be recognized by computers through
language cues. For the investigation we used monologues and dialogues of speakers with
different verbal intelligence. First, we analysed the text files at different linguistic levels
such as morphological, lexical, and syntactic, measured the occurrence of certain semantic
categories (LIWC), calculated the similarity values between the monologues and the film
transcript, and took into account the speech style of the test persons. Additionally, we
estimated the flow of conversations and the adaptation abilities of dialogue participants.
The importance of the extracted features was analysed using such feature selection methods
as Information gain ratio, V2-Test, and Genetic algorithm. The most significant features
were used for training and testing several classification algorithms. As a result, the genetic
algorithm was found to be the most effective feature selection algorithm.
In the second part of this chapter, each monologue was presented as a feature vector
using the TF-IDF approach. Some of the most popular TC algorithms were applied to the
classification task: NB, Rocchio and kNN. The NB models are typically expected to perform
well for TC tasks despite the conditional independence and the positional independence
assumptions. However, the performance of the NB approach was significantly worse than the
performance of the other approaches: kNN and Rocchio. This suggests that this probabilistic
classifier was more sensitive to a low number of examples available, mainly resulting in
inaccurate probability estimates compared with the vector space ones (computing distances
to some relevant members or to a prototype of each defined class seems to be more robust
against sparse data).
The achieved classification accuracy can be deemed as satisfactory for a number of classes
that is reasonably high enough to enable its integration into SDSs.
On the other hand, and related to those independence assumptions, it is well known that
conditional independence does not really hold for text data (even worse considering that our
features are highly correlated). Furthermore, we firmly believe that, for this specific task, the
position of a term in a document by itself could carry more information about the class than
expected, mainly because of the above mentioned peculiarities of our classification task (i.e.,
it is not only about the words that participants used to denote their intelligence, but also

5.3 Conclusion 129
the way they combined them). Therefore, our data somehow violates these independence
assumptions, thus finally explaining why the NB approach performed so poorly. In this
regard, it would be very interesting to test a LM based TC approach to better validate this
argument.
Using the class-based feature selection approaches has proven to be an essential factor,
not only to achieve a better inference performance but also to reduce its computational cost.
Despite being typically successful when applied to TC tasks, word lemmatisation was
not really helpful for our task. The word-based approaches systematically outperformed
the lemma-based approaches, thus pointing to some peculiarities of the classification task.
Particularly, these results were found to be mainly explained by two different factors: the
same topic for collecting monologues and dialogues and the use of the German language.


6
Conclusions and Future Work
Nowadays, many users still try to avoid communicating with SDSs and prefer to obtain
information or solve their problems with the help of real individuals. They doubt that
automatic dialogue systems may completely understand what users require and are able
to perform all the necessary tasks with a satisfactory quality. They often assume that the
information obtained from SDSs is very restricted and refers to specific domains.
These problems motivate researchers and developers to continue working on the flexibility
and reliability of dialogue systems. Significant contributions to improve this situation have
already been made. Systems have been developed that help travelers to obtain information
about flights and public transportation, to find a certain place in a city, to book a hotel,
etc.
One of the main properties of a reliable dialogue system is the high quality of speech
recognition. If a system is not able to completely understand certain phrases or sentences,
such a communication will be frustrating and annoying for individuals. Moreover, each
module of an SDS should perform its tasks at high speed in order to give the user an
appropriate answer or to construct informative utterances. Ideally, users should have the
feeling that they are communicating with a real dialogue partner and may express their
needs and preferences using any words and expressions. Adaptive dialogue systems should
constantly analyse the verbal and communication behaviour of individuals and be ready
to change the dialogue strategy at any moment. They may determine the age and gender
of speakers, estimate whether users have enough knowledge about the topic of interactions
and avoid explaining unnecessary details. An adaptive system may allow a user to take the
initiative in their conversations or to actively ask questions in order to keep the dialogue
going. When recognizing the negative emotions of a user, an SDS may understand that a
user is not happy with its functioning and switch to another dialogue strategy at the right
time.
In this work we suggest that an SDS may increase its user-friendliness if it automatically
estimates the verbal intelligence of users. Verbal intelligence is the ability to effectively use
language to accomplish certain goals, e.g., participating in conversations, finding appropri-
ate words and expressions for proving an individual position in discussions, talking about
certain events, etc. An adaptive SDS may change the level of interaction depending on the
verbal intelligence of its users, for example to find simpler words or to construct shorter sen-
tences for individuals with lower verbal abilities or to avoid detailed explanations for higher
verbal intelligence speakers. Figure 1.2 (Section 1.1) presents a possible adaptation scheme.

132 6 Conclusions and Future Work
According to this process, the system may start its conversation assuming that a speaker
has an average level of verbal intelligence. The system analyses each user’s turn in order
to re-estimate his or her verbal intelligence. In Figure 1.2 the system has three different
strategies that correspond to users with lower, average, and higher verbal intelligence levels.
During the dialogue, the system may switch to another strategy after any conversational
turn.
In this work we concentrated on determining those language peculiarities that indicate
differences in the verbal intelligence of speakers and, at the same time, may be automatically
extracted from spoken utterances. Only in this case will an SDS be able to measure these
features after each turn. Instead of estimating the verbal intelligence scores of speakers, we
suggest determining to which verbal intelligence group (for example, higher, average, and
lower verbal intelligence) each speaker belongs. The classification module will re-train the
classifier after each turn taking into account the features extracted from the new spoken
utterances and will pass this information on to the dialogue manager. The dialogue manager
will choose a proper strategy for generating its response to the user.
When we talk to an individual for the first time, we may approximately estimate his or
her level of verbal abilities using our intuition and perception. Our task was to understand
which language peculiarities (for example, long words, complex syntactic structures, and
rich vocabulary) are indicators of individuals with higher verbal abilities. These peculiarities
should not depend on the speech topic and should provide satisfactory classification results.
In this work we proposed a number of hypotheses about dependencies between certain
linguistic cues and the verbal intelligence of individuals. Based on these hypotheses, we
described a number of features that were extracted from the spoken utterances of individuals
(Chapter 4) in order to prove or reject our suggestions.
6.1 Language Cues that Reflect the Verbal Intelligence of
Speakers
Using ANOVA, we were able to determine linguistic cues that may reflect the verbal in-
telligence of speakers. As shown in Section 5.1.1, higher verbal intelligence speakers more
frequently combine several terms together in order to form a new word. This not only applies
to nouns but also to other parts of speech, e.g., verbs, adverbs, and adjectives. This also
influences the length of words in spoken utterances of higher verbal intelligence individuals.
It was found that they use longer nouns and more words containing nine or more letters than
lower verbal intelligence speakers. Higher verbal intelligence speakers more frequently use
modal verbs and adjectives in their monologues. Comparing monologues with a frequency
dictionary showed that lower verbal intelligence speakers tend to pick up frequent words to
express their thoughts and feelings compared to higher verbal intelligence ones. Addition-
ally, the occurrence of conjunctions in the speech of lower verbal intelligence individuals is
higher compared to speakers with a higher verbal intelligence level. Only one semantic cue,
the subjunctive mode, was found to be significant according to ANOVA. All the other syn-
tactic features were not determined to be important. This might happen for several reasons.
First of all, our monologues might be too short to investigate the syntactic peculiarities of
speakers. Secondly, for the analysis of syntax it would be better to use written language
instead of spoken utterances. When our candidates were asked to repeat the story, they were

6.2 Adaptation of Speakers to Each Other 133
not able to show their ability to construct complex and sophisticated sentence structures.
Thirdly, we analysed each feature separately, independently from other linguistic peculiari-
ties. It might be that our syntactic features may reflect the verbal intelligence of individuals
only when they are considered in combination with some other cues.
It was also found that the similarity between the film transcript and the descriptions
of higher verbal intelligence speakers was greater compared to the descriptions of speakers
with a lower verbal intelligence level. This shows that test persons with higher memory
scores (and consequently with higher verbal intelligence levels) were better able to recall
the details of the film and reused more words and phrases from it.
6.2 Adaptation of Speakers to Each Other
For the analysis of the adaptation of speakers to each other, we investigated their conversa-
tions. First, we analysed the dialogues at different linguistic levels (morphological, lexical,
etc.) without taking into account that some language cues may be changed as a result of the
style matching of the dialogue participants. ANOVA showed that the following linguistic
cues reflect higher verbal intelligence: compoundings, long adjectives, words longer than 9
letters, numbers, interjections, rare words, present participle, and a number of linguistic
categories (Section 5.2.1). Compoundings and long words were also determined to be signif-
icant for monologues. We may conclude that these features are robust indicators of verbal
intelligence and do not depend on the adaptation of speakers engaged in a conversation.
ANOVA did not show any dependencies between the flow of conversations (e.g., duration
of pauses, speech rate, etc.) and the verbal intelligence of speakers. Speakers from both verbal
intelligence groups were able to use different topic categories in their speech and did not differ
in the number of turns each category was carried over. However, lower verbal intelligence
speakers initiated more new topics when they were talking to higher verbal intelligence
speakers than when communicating with lower verbal intelligence dialogue participants.
Other ANOVA results showed that it was difficult for the candidates to linguistically
show their closeness when discussing the education system in Germany. However, the simi-
larity of utterances in dialogues between friends was greater than the similarity in dialogues
between strangers. Lower verbal intelligence speakers repeated nouns and adjectives from
their dialogue partners and used words from the same linguistic dimensions more often than
higher verbal intelligence speakers. We may conclude that both lower and higher verbal
intelligence speakers are able to adapt to their dialogue partners; however, this adaptation
is reflected by different linguistic cues. The results also showed that speakers with a lower
verbal intelligence level are better able to adapt to the other if they are relatives or friends.
Speakers with a higher verbal intelligence level were able to dominate in the conversations
independently of the verbal intelligence of their dialogue partners. When test persons with
a lower verbal intelligence level were talking to dialogue partners with approximately the
same verbal intelligence levels, in 72% of dialogues they were able to dominate and influence
the opinion of the dialogue partner.
Higher verbal intelligence test persons interrupted their dialogue partners more often
if these dialogue partners also had a higher verbal intelligence level. This may happen
because, when two higher verbal intelligence dialogue partners are talking to each other,
expressing their opinions and trying to persuade each other, the discussion may be more

134 6 Conclusions and Future Work
lively, exciting and contradictory. Also, when talking to lower verbal intelligence dialogue
partners, test persons with a higher verbal intelligence level more often started talking after
long pauses in the discussions.
6.3 Estimation of Users’ Verbal Intelligence
In this work we suggested two approaches for the automatic estimation of speakers’ verbal
intelligence. When engaged in a conversation, an individual (very often intuitively) tries
to adapt to his or her dialogue partner. As a result, some attributes of his or her speech
(e.g., vocabulary, sentence structure, language style, etc.) may be changed. If we use certain
linguistic cues to train a classifier without taking into account this adaptation process, the
classification results may not be reliable. That is why in the first approach we analysed
the complexity of monologues and dialogues at different linguistic levels and estimated to
what degree the dialogue participants adapt to each other in the discussions. The extracted
features were combined together for the classification task. In the second approach we only
analysed the vocabulary of our candidates. For this purpose, each monologue and dialogue
was represented as a feature vector using the TF-IDF weighting scheme. Both approaches
were compared with each other for two and three verbal intelligence classes.
In particular, instead of defining the threshold for the TF-IDF measures we defined a
fixed number of terms to be selected. Therefore, we first sorted all the terms according
to their TF-IDF weights. Then, we selected the top N most representative or indicative
terms according to their TF-IDF measures. The remaining terms were removed as stop or
common words that did not add any meaningful content. By observing the evolution of the
classification accuracy with an increasing N value, we determined the minimum size of the
vocabulary (i.e., dimensionality) required to achieve the optimum performance.
The class-based keyword selection approach was performed separately for each class
[Ozgur et al., 2005]. This allowed us to determine the most important words from each
class. The obtained feature sets were used for the classification of candidates into several
verbal intelligence classes.
For the monologues, SVM in combination with the genetic algorithm achieved an accu-
racy of 84% for the two classes (higher and lower verbal intelligence speakers) and 63% for
the three classes (higher, average, and lower verbal intelligence individuals).
For the dialogues, SVM was able to reach a classification accuracy of 83.20%. The cor-
responding feature set consisted of 69 cues. Indicators of communication behaviour such
as actor degree centrality and actor closeness (from social network analysis) were also de-
termined to be informative cues. For the three classes (higher, average, and lower verbal
intelligence speakers), the highest classification accuracy of 73.30% was achieved by SVM.
In our second approach, only the vocabulary of the dialogue participants was used for the
classification. The kNN, Naive Bayes and Rocchio approaches were used for the classification
of speakers into several verbal intelligence groups.
For the classification of monologues into two classes with an accuracy of 89%, the Rocchio
approach required 60 features per class. For the three classes scheme, the Rocchio approach
showed an accuracy of 87% for 65-dimensionality.
Using the dialogues for the classification, the kNN reached a maximum accuracy of
86.72% for 40 features per class. The Rocchio approach was able to improve these results
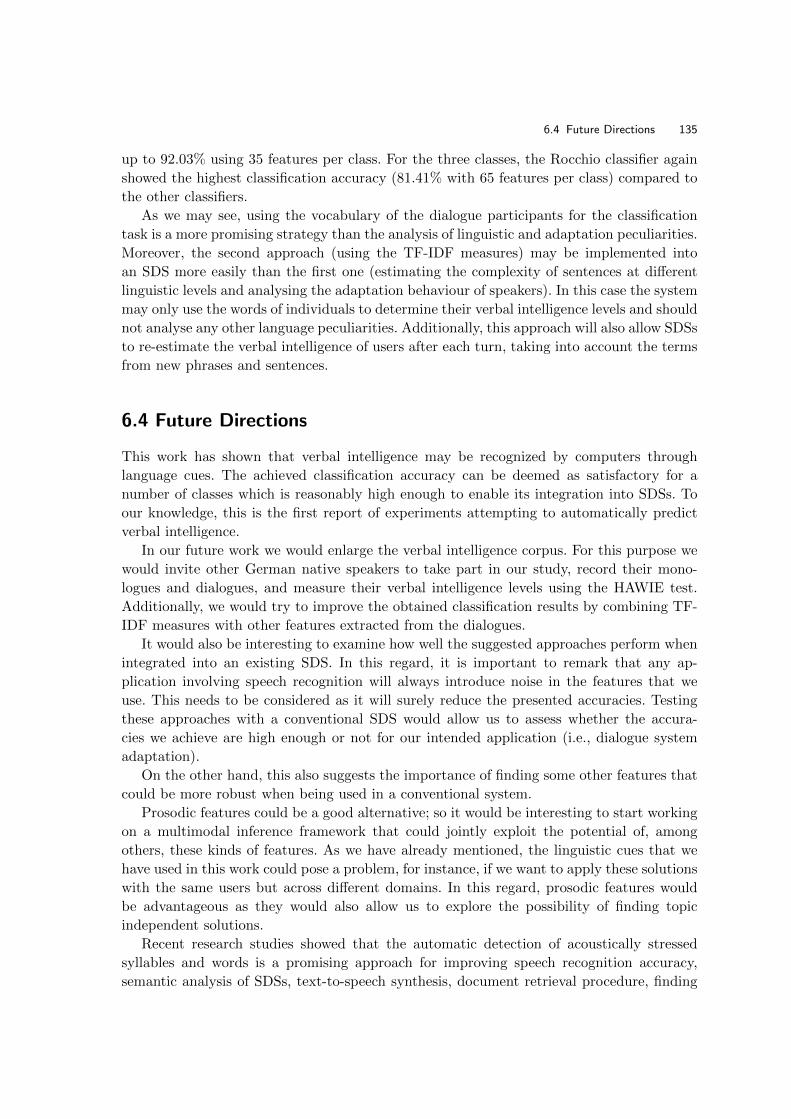
6.4 Future Directions 135
up to 92.03% using 35 features per class. For the three classes, the Rocchio classifier again
showed the highest classification accuracy (81.41% with 65 features per class) compared to
the other classifiers.
As we may see, using the vocabulary of the dialogue participants for the classification
task is a more promising strategy than the analysis of linguistic and adaptation peculiarities.
Moreover, the second approach (using the TF-IDF measures) may be implemented into
an SDS more easily than the first one (estimating the complexity of sentences at different
linguistic levels and analysing the adaptation behaviour of speakers). In this case the system
may only use the words of individuals to determine their verbal intelligence levels and should
not analyse any other language peculiarities. Additionally, this approach will also allow SDSs
to re-estimate the verbal intelligence of users after each turn, taking into account the terms
from new phrases and sentences.
6.4 Future Directions
This work has shown that verbal intelligence may be recognized by computers through
language cues. The achieved classification accuracy can be deemed as satisfactory for a
number of classes which is reasonably high enough to enable its integration into SDSs. To
our knowledge, this is the first report of experiments attempting to automatically predict
verbal intelligence.
In our future work we would enlarge the verbal intelligence corpus. For this purpose we
would invite other German native speakers to take part in our study, record their mono-
logues and dialogues, and measure their verbal intelligence levels using the HAWIE test.
Additionally, we would try to improve the obtained classification results by combining TF-
IDF measures with other features extracted from the dialogues.
It would also be interesting to examine how well the suggested approaches perform when
integrated into an existing SDS. In this regard, it is important to remark that any ap-
plication involving speech recognition will always introduce noise in the features that we
use. This needs to be considered as it will surely reduce the presented accuracies. Testing
these approaches with a conventional SDS would allow us to assess whether the accura-
cies we achieve are high enough or not for our intended application (i.e., dialogue system
adaptation).
On the other hand, this also suggests the importance of finding some other features that
could be more robust when being used in a conventional system.
Prosodic features could be a good alternative; so it would be interesting to start working
on a multimodal inference framework that could jointly exploit the potential of, among
others, these kinds of features. As we have already mentioned, the linguistic cues that we
have used in this work could pose a problem, for instance, if we want to apply these solutions
with the same users but across different domains. In this regard, prosodic features would
be advantageous as they would also allow us to explore the possibility of finding topic
independent solutions.
Recent research studies showed that the automatic detection of acoustically stressed
syllables and words is a promising approach for improving speech recognition accuracy,
semantic analysis of SDSs, text-to-speech synthesis, document retrieval procedure, finding

136 6 Conclusions and Future Work
keywords, etc. Acoustically stressed syllables is another language peculiarity that may be
useful for the classification task.
To determine other informative language peculiarities, Kelly’s Theory of Constructs may
be applied to the speech samples. Kelly’s Theory of Constructs describes individuals’ per-
ception of the world. Each individual studies the environment and its rules, compares new
information with what he or she already knows and tries to find appropriate explanations
for the situations and events around him or her. For the perception of the environment and
events he or she uses his or her system of constructs (or system of values in other words).
The simplest examples of personal constructs are good - bad, fast - slow, strong - weak,
etc. During the process of word acquisition and communication with the environment, in-
dividuals may create new constructs and change old ones. Kelly suggested a method for
determining the personal constructs of speakers. This method may be applied to the analy-
sis of the conversations of individuals. When an individual is involved in a conversation, he
or she automatically adapts to his or her dialogue partner. It may seem that dialogue part-
ners intuitively adapt to each other; however, both of them unconsciously use their systems
of constructs (with intricate connections and dependencies) that govern their reaction and
adaptation abilities. Analysing personality constructs may show how individuals estimate
the intelligence of their dialogue partners, how they determine a speaker with good verbal
skills, which factors influence their choice of words and phrases, which dialogue strategies
they use and how they adapt to their dialogue partner, etc. More informative constructs may
become features that possibly increase the results of the classification of verbal intelligence.
It is also important to determine a proper dialogue strategy for each verbal intelligence
group. Only in this case an SDS with the automatic estimation of verbal intelligence may
show a high level of adaptation to its users and become a competent dialogue partner for
them.

A
Documents used for Corpus Collection
Document was removed for copyright reasons.


B
References
Agostini, F. and De Carlo, N. A. (2012). Intelligence Games. Fireside.
Anderson, C. and McMaster, G. (1986). Modeling emotional tone in stories using tension levels and cate-
gorical states. Computer and the Humanities, 20, 3–9.
Audehm, B. (2006). Wort- und Satzgliedstellung im Mittelfeld des gesprochenen Deutsch. Eine korpusbasierte
Untersuchung. Doktorarbeit.
Auer, P. (1997). Formen und Funktionen der Vor-Vorfeldbesetzung im gesprochenen Deutsch. In P. Schlobin-
ski (Ed.), Syntax des gesprochenen Deutsch (pp. 53–91).
Baeza-Yates, R. A. and Ribeiro-Neto, B. (1999). Modern Information Retrieval. Boston, MA, USA: Addison-
Wesley Longman Publishing Co., Inc.
Bard, E. G., Anderson, A., Sotillo, C., Aylett, M., Doherty-Sneddon, G., and Newlands, A. (2000). Con-
trolling the intelligibility of referring expressions in dialogue. Journal of Memory and Language, 42,
1–22.
Barlow, C. M. (2000). Guilford’s Structure of the Intellect. http://www.cocreativity.com/handouts-
/guilford.pdf.
Becker, K. (2003). History of the Stanford-Binet Intelligence Scales: Content and Psychometrics. (Stanford-
Binet Intelligence Scales, Fifth Edition Assessment Service Bulletin No. 1). Itasca, IL: Riverside Pub-
lishing.
Becker, P. (1988). Skalen fur Verlaufsstudien der emotionale Befindlichkeit. Zeitschrift fur Experimentelle
und Angewandte Psychologie, 35, 345–369.
Behrens, H. (1998). How difficult are complex verbs: Evidence from German, English and Dutch. Linguistics,
36, 679–712.
Behrens, H. (2003). Verbal prefixation in German child and adult language. Acta Linguistica Hungarica, 50,
37–55.
Behrens, H. (2009). Direction and perspective in German child language. In Crosslinguistic Approaches
to the Psychology of Language. Research in the Tradition of Dan Isaac Slobin (pp. 55–68). Psychology
Press, Taylor and Francis Group, LLC.
Biber, D. (1988). Variations Across Speech and Writing. New York: Cambridge University Press.
Biery, J. (1955). Cognitive complexity-simplicity and predictive behavior. Abnormal and Social Psychology,
51, 143–150.
Binet, A. and Simon, T. A. (1905). Methode nouvelle pour le diagnostic du niveau intellectuel des anormaux.
L’Annee Psychologique, 11, 191–244.
Blankenship, J. (1962). A linguistic analysis of oral and written style. Quarterly Journal of Speech, 48,
419–422.
Blankenship, J. (1974). The influence of mode, submode, and speaker predilection on style. Speech Mono-
graphs, 41, 85–118.
Borstel, S. (1977). Sprachstill und Personlichkeit. Analyse des Zusammenhangs von Variablen des Sprachstils
und der Personlichkeit. Diplomathesis, University of Giessen.

140 B References
Bradley, R., Caldwell, B., Rock, S., Barnard, K., Gray, C., Hammond, M., Mitchell, S., Siegel, L., Ramey, C.,
Gottfried, A., and Johnson, D. (1989). Home environment and cognitive development in the first 3 years
of life: A collaborative study involving six sites and three ethnic groups in North America. Developmental
Psychology, 25, 217–235.
Brand, C., Horn, A., Mehl, M., and Pennebaker, J. (2003). German LIWC 2003: Ein deutsches Diktionar zu
den basislinguistischen, psychologischen Prozess- and Relativitatskategorien des LIWC. Technical report,
Austin: University of Texas, Department of Psychology.
Brennan, S. and Clark, H. (1996). Conceptual pacts and lexical choice in conversation. Journal of Experi-
mental Psychology: Learning, Memory, and Cognition, 22, 1482–1493.
Buller, D., Hale, J., deTruck, M., and Burgoon, J. (1984). Relational messages associated with nonverbal
behaviours. Human Communication Research, 10 (3), 351–378.
Burgeon, J. and Hoobler, G. (2002). Nonverbal Signals. Handbook of Interpersonal Communication. Third
Edition. Sage Publications, Inc.
Burlatchuk, L. (1997). Introduction in Projective Psychology. Nica-Center, Kiev.
Busemann, A. (1925a). Die Sprache der Jugend als Ausdruck der Entwicklungsrhythmik. Verlag von Gustav
Fischer, Jena.
Bußmann, H. (2002). Lexikon der Sprachwissenschaft. (Third ed.). Kroner, Stuttgart.
Buzan, T. (2002). The Power of Verbal Intelligence. PerfectBound.
Carroll, J. and Casagrande, J. (1958). The function of language classifications in behavior. In E. Maccoby,
T. Newcomb, and E. Hartley (Eds.), Readings in Social Psychology (pp. 18–31). New York: Holt, Rinehart
& Winston.
Cashdan, E. (1998). Smiles, speech and body posture: How women and men display sociometric status and
power. Journal of Nonverbal Behaviour, 22 (4), 209–228.
Cattell, J. (1890). Mental tests and measurements. Mind, 15, 373–381.
Chafe, W. L. (1982). Integration and Involvement in Speaking, Writing, and Oral Literature (D. Tannen
ed.). ABLEX Pub. Corp.
Chafe, W. L. and Danielewicz, J. (1986). Properties of spoken and written language. In R. Horowitz and
S. J. Samuels (Eds.), Comprehending oral and written language (pp. 82–113). New York: Academic Press.
Chan, A. S., Ho, Y.-C., and Cheung, M.-C. (1998). Music training improves verbal memory. Nature, 396,
128.
Chomsky, N. (1968). Language and Mind. Harcourt Brace Jovanovich, Inc.
Cianciolo, A. T. and Sternberg, T. J. (2004). Intelligence: a Brief History. Blackwell Publishing.
Clahsen, H., Sonnenstuhl, I., and Blevins, J. P. (2002). Derivational morphology in the German mental
lexicon: A dual mechanism account. In H. Baayean and R. Schreuder (Eds.), Morphological Structure in
Language Processing (pp. 125–155). Mouton de Gruyter: Berlin.
Cleland, A. A. and Pickering, M. J. (2003). The use of lexical and syntactic information in language
production: Evidence from the priming of noun-phrase structure. Journal of Memory and Language, 49,
214–230.
Collins, P. (1994). Extraposition in English. Functions of Language, 1 (1), 724.
Couper-Kuhlen, E. and Thompson, S. A. (2006). You know, it’s funny: Eine Neubetrachtung der “Extra-
position” im Englischen. In S. Gunthner and W. Imo (Eds.), Konstruktionen in der Interaktion (pp.
23–58). Berlin/New York: de Gruyter.
Dahl, H., Teller, V., Moss, D., and Trujillo, M. (1978). Countertransference examples of the syntactic
expression of warded-off contents. Psychoanalytic Quarterly, 47 (3), 339–363.
Dewaele, J.-M. (1995). Style-shifting in oral interlanguage: Quantification and definition. In L. Eubank,
L. Selinker, and M. S. Smith (Eds.), The Current State of Interlanguage (pp. 231–238). John Benjamins,
Amsterdam-Philadelphia.
Doll, E. (1953). The Measurement of Social Competence: A Manual for the Vineland Social Maturity Scale.
Minneapolis: Educational Test Bureau.
Doob, L. (1958). Behaviour and grammatical style. Journal of Abnormal and Social Psychology, 56, 398–401.

B References 141
Dovidio, J. and Ellyson, S. (1982). Decoding visual dominance: Attributions of power based on relative
percentages of looking while speaking and looking while listening. Social Psychology Quarterly, 45 (2),
106–113.
Dunba, N. and Burgoon, J. (2005). Perceptions of power and interactional dominance in interpersonal
relationships. Journal of Social and Personal Relationships, 22 (2), 207–233.
Eichinger, L. (1989). Raum und Zeit im Verbwortschatz des Deutschen: Eine valenzgrammatische Studie
[Space and Time in the Verb Lexicon of German: A Study from a Valency Grammar Perspective].
Tubingen: Niemeyer.
Engelen, B. (1995). Hinunter versus darunter. Beobachtungen und Uberlegungen zu den Direktionaladverbien
[Downwards versus under: Observations and thoughts on directional adverbials]. In L. M. Eichinger and
H. W. Eroms (Eds.), Dependenz und Valenz [Dependency and valency] (pp. 243–258). Hamburg: Buske.
Eysenck, H. (1971). Readings in Extraversion-Introversion: Volume II. New York: Wiley-Interscience.
Eysenck, H. (1979). The Structure and Measurement of Intelligence. New York: Springer-Verlag.
Eysenck, M. W. and Keane, M. T. (2005). Cognitive Psychology. A Student’s Handbook. Psychology Press.
Fancher, R. (1985). The Intelligence Men: Makers of the IQ Controversy. New York: W.W. Norton and
Company.
Flynn, J. R. (1998). IQ gains over time: Toward finding the causes. In U. Neisser (Ed.), The Rising Curve:
Long-Term Gains in IQ and Related Measures (pp. 25–66). Washington (DC): American Psychological
Association.
Funk, W. J. and Lewis, N. (1942). 30 Days to a More Powerful Vocabulary. W. Funk, Inc.
Furnas, G. W., Landauer, T., Gomez, L., and Dumais, S. (1987). The vocabulary problem in human-system
communications. Communications of the ACM, 30, 964–971.
Galton, F. (1896). Hereditary Genius: An Inquiry into its Laws and Consequences. London, UK: MacMillan.
Gardner, H. (1983). Frames of Mind: The Theory of Multiple Intelligences. New York: Basic.
Garrod, S. and Anderson, A. (1987). Saying what you mean in dialogue: A study in conceptual and semantic
co-ordination. Cognition, 27, 181–218.
Geary, D. (2005). The Origin of Mind: Evolution of Brain, Cognition, and General Intelligence. American
Psychological Association.
Giachin, E. (1997). Spoken language dialogue. In R. Cole, J. Mariani, H. Uszkoreit, A. Zaenen, and V. Zue
(Eds.), Survey of the State of the Art in Human Language Technology (pp. 241–244). Jambridge: Cam-
bridge University Press.
Gleser, G. C., Gottschalk, L. A., and John, W. (1959). The relationship of sex and intelligence to choice of
words: A normative study of verbal behavior. Journal of Clinical Psychology, 15 (2), 182–191.
Goddard, H. (1913). Standard method for giving the Binet test. TSB, 10 (2), 23–30.
Goethals, G., Sorenson, G., and Bruns, J. (2004). Encyclopedia of Leadership. Sage Publications (CA).
Goodenough, F. (1926). Measurement of Intelligence by Drawings. Yonkers, N.Y.: World Book Company.
Goodman, N. (1968). Languages of Art: An Approach to a Theory of Symbols. Hackett Publishing.
Gottfredson, L. S. (1997b). Mainstream science on intelligence: An editorial with 52 signatories, history, and
bibliography. Intelligence, 24, 13–23.
Graesser, A., Gernsbacher, M., and Goldman, S. (1997). Cognition. In T. van Dijk (Ed.), Discourse as
Structure and Process (pp. 292–319). London: Sage.
Graesser, A., McNamara, D., Louwerse, M., and Cai, Z. (2004). Coh-metrix: Analysis of text on cohesion
and language. Behavior Research Methods, Instruments & Computers, 36 (2), 193–202.
Grice, H. (1975). Logic and conversation. In P. Cole and J. Morgan (Eds.), Syntax and Semantics. Academic
Press, New York, NY.
Grimbleby, J. (1999). Hybrid genetic algorithms for analogue network synthesis. IEE/IEEE International
Congress on Evolutionary Computation(CEC99), 3, 1781–1787.
Griol, D., Callejas, Z., and Lopez-Cozar, R. (2011). Integration of statistical dialog management techniques to
implement commercial dialog systems. In Proceedings of the Paralinguistic Information and its Integration
in Spoken Dialogue Systems Workshop, (pp. 227–239).
Guilford, J. (1956). The structure of intellect. Psychological Bulletin, 53 (4), 267–293.
142 B References
Gunthner, S. (2007). Extrapositionen mit es im gesprochenen Deutsch. Zeitschrift fur Germanistische
Linguistik (ZGL), 37, 15–47.
Gutman, L., Sameroff, A., and Cole, R. (2003). Academic growth curve trajectories from 1st grade to 12th
grade: Effects of multiple social risk factors and preschool child factors. Developmental Psychology, 39 (4),
777–790.
Hall, E. (1976). Beyond Culture. Garden City, N.Y., Anchor Press.
Harrell, T. and Harrell, M. (1945). Army general classification test scores for civilian occupations. Educational
and Psychological Measurement, 5, 229–239.
Heilbron, J. L. (2003). The Oxford Companion to the History of Modern Science. Oxford University Press.
Helfrich, H. and Dahme, G. (1974). Sind Verzogerungsphanomene beim spontanen Sprechen Indikatoren
personlichkeitsspezifischer Angstverarbeitung. Zeitschrift fur Sozialpsychologie, 5, 55–65.
Heylighen, F. and Dewaele, J.-M. (1998). Variation in the contextuality of language: An empirical measure.
In Context in Context, Special issue of Foundations of Science, (pp. 293–340).
Hirt, M. (1959). Use of the general aptitude test battery to determine aptitude changes with age and to
predict job performance. Journal of Applied Psychology, 43 (1), 36–39.
Hoijer, H. (1971). The Sapir-Whorf-Hypothesis. In H. Hoyer (Ed.), Language in Culture. Conference on
the Interrelations of Language and Other Aspects of Culture, volume 7 (pp. 92–105). Chicago University
Press, Chicago.
Holland, N. N. (2001). The barge she sat in: Psychoanalysis and diction. Psychoanalytic Studies, 3 (1), 79–94.
Horn, J. and Cattell, R. (1966). Refinement and test of the theory of fluid and crystallized general intelli-
gences. Journal of Educational Psychology, 57, 253–270.
Horowitz, R. and Samuels, S. (1987). Comprehending Oral and Written Language: Critical Contrasts for
Literacy and Schooling. In R. Horowitz and S. Samuels (Eds.), Comprehending oral and written language
(pp. 1–52). New York: Academic.
Ireland, M. and Pennebaker, J. (2010). Language style matching in writing: Synchrony in essays, correspon-
dence, and poetry. Journal of Personality and Social Psychology, 99 (3), 549–571.
Jayagopi, D., Hung, H., Yeo, C., and Gatica-Perez, D. (2009). Modeling dominance in group conversations
using nonverbal activity cues. IEEE Transactions on Audio, Speech and Language processing, 17 (3),
501–513.
Jensen, A. (1998). The g-factor. The Science of Mental Ability. Westport: Praeger.
Jokinen, K., Kerminen, A., Kaipainen, M., Jauhiainen, T., Wilcock, G., Turunen, M., Hakulinen, J., Kuusisto,
J., and Lagus, K. (2002). Adaptive dialogue systems - interaction with interact. In Proceedings of the
Third SIGdial Workshop on Discourse and Dialogue, Philadelphia, (pp. 64–73).
Jurafsky, D. and Martin, J. H. (2009). Speech and Language Processing: An Introduction to Natural Language
Processing, Speech Recognition, and Computational Linguistics (Second ed.). Prentice-Hall.
Kamphaus, R. (2005). Clinical Assessment of Child and Adolescent Intelligence. Springer Science & Business
Media.
Kaufman, A. and Kaufman, N. (1990). Kaufman Brief Intelligence Test (K-BIT). Circle Pines, MN: Amer-
ican Guidance Service.
Kaufman, A. and Kaufman, N. (1993). Kaufman Adolescent and Adult Intelligence Test (KAIT). Circle
Pines, MN: American Guidance Service.
Kaufman, J., Pumaccahua, T., and Holt, R. (2013). Personality and creativity in realistic, investigative,
artistic, social, and enterprising college majors. Personality and Individual Differences, 54, 913–917.
Kay, P. (2007). IT-Extraposition. Manuskript. University of California at Berkeley.
http://www.icsi.berkeley.edu/kay/bcg/extrap.html. (5.6.2007).
Kindt, W. (1994). Satzbegriff und gesprochene Sprache. Lingua, 94 (1), 25–48.
Klein, G., Calderwood, R., and MacGregor, D. (1989). Critical decision method for eliciting knowledge.
IEEE Transactions on Systems, Man, and Cybernetics, 19, 462–472.
Komatani, K., Adachi, F., Ueno, S., Kawahara, T., and Okuno, H. G. (2003). Flexible spoken dialogue
system based on user models and dynamic generation of VoiceXML scripts. In Proceedings of the 4th
SIGdial Workshop on Discourse and Dialogue, (pp. 87–96).

B References 143
Krapelin, E. (1895). Der psychologische Versuch in der Psychiatrie. Psychologische Arbeiten, 1, 191.
Kupietz, M., Belica, C., Keibe, H., and Witt, A. (2010). The German reference corpus DeReWo: A primordial
sample for linguistic research. In Proceedings of the 7th Conference on International Language Resources
and Evaluation (LREC 2010), (pp. 1848–1854).
Lee, C., Kawahara, T., and Rudnicky, A. (2011). Combining slot-based vector space model for voice book
search. In Proceedings of the Paralinguistic Information and its Integration in Spoken Dialogue Systems
Workshop, (pp. 31–39).
Lepper, G. and Mergenthaler, E. (2007). Therapeutic collaboration: How does it work? Psychotherapy
Research, 17 (5), 576–587.
Levelt, W. and Kelter, S. (1982). Surface form and memory in question answering. Cognitive Psychology,
14, 78–106.
Lezius, W. (1999). MORPHY fur Windows. Ein Tool zur Deutschen Morphologie. Benutzerhandbuch. IMS,
Universitat Stuttgart.
Linell, O. and Korolija, N. (1997). Coherence in multi-party conversation: Episodes and contexts in interac-
tion. In T. Givon (Ed.), Conversation: Cognitive, Communicative and Social Perspectives (pp. 167–205).
Amsterdam: John Benjamins.
Litman, D. J. and Pan, S. (2000). Predicting and adapting to poor speech recognition in a spoken dialogue
system. In Proceedings of the 17th National Conference on Artificial Intelligence (AAAI 2000), (pp.
722–728).
Logsdon, A. (2013). Learning disabilities, http://www.learningdisabilities.about.com/.
Mast, M. S. (2002). Dominance as expressed and inferred through speaking time: A meta-analysis. Human
Communication Research, 28 (3), 420–450.
McClelland, D., Atkinson, J., Clark, R., and Lowell, F. (1953). The Achievement Motive. New York.
Mehrabian, A. (1966). Immediacy: A indicator of attitudes in linguistic communication. Journal of Person-
ality, 34, 26–34.
Mergenthaler, E. (1993). Transkriptionsregeln. Ulm.
Mergenthaler, E. (1996). Emotion-abstraction patterns in verbatim protocols: A new way of describing
psychotherapeutic processes. Journal of Consulting and Clinical Psychology, 64 (6), 1306–1315.
Mergenthaler, E. (1998a). CM - the Cycles Model software. (Version 1.0) Universitat Ulm, Ulm, Germany.
Mergenthaler, E. (1998b). Cycles of emotion-abstraction patterns: A way of practice oriented process re-
search? The British Psychological Society Psychotherapy Section Newsletter, 24, 16–29.
Mergenthaler, E. (2000). The therapeutic cycle model in psychotherapy research: Theory, measurement, and
clinical application. Ricerche sui Gruppi, 5, 34–40.
Miao, Y.-Q. and Kamel, M. (2011). Pairwise optimized Rocchio algorithm for text categorization. Pattern
Recognition Letters, 32, 375–382.
Militello, L., Hutton, R., Pliske, R., Knight, B., and Klein, G. (1997). Applied cognitive task analysis (ACTA)
methodology. Technical Report NPRDC-TN-98-4, Fairborn, OH: Klein Associates.
Mottet, T. and Richmond, V. (1998). An inductive analysis of verbal immediacy: Alternative conceptualiza-
tion of relational verbal approach/avoidance strategies. Communication Quarterly, 46 (1), 25–40.
Nenkova, A., Gravano, A., and Hirschberg, J. (2008). High frequency word entrainment in spoken dialogue. In
Proceedings of the 46th Annual Meeting of the Association for Computational Linguistics, (pp. 169–172).
Newman, M., Pennebaker, J., Berry, D., and Richards, J. (2003). Lying words: Predicting deception from
linguistic styles. Personality and Social Psychology Bulletin, 29, 665–675.
Newman, M. L., Groom, C. J., Handelman, L. D., and Pennebaker, J. W. (2008). Gender differences in
language use: An analysis of 14,000 text samples. Discourse Processes, 45, 211–236.
Niederhoffer, K. and Pennebaker, J. (2002). Linguistic style matching in social interaction. Journal of
Language and Social Psychology, 21 (4), 337–360.
Nutting, D. (2007). German conjunctions. Examples and practice. http://www.germanlinx.vic.edu.au.
Oberlander, J. and Gill, A. (2004). Individual difference and implicit language: personality, parts-of-speech
and pervasiveness. In Proceedings of the 26th Annual Conference of the Cognitive Science Society, (pp.
1035–1040).

144 B References
O’Connor, J. (1944). Aptitudes and the Languages (First ed.). Human engineering laboratory, inc.
Ohsawa, Y., Matsumura, N., and Ishizuka, M. (2002). Influence diffusion model in text-based communication.
In Proceedings of the Eleventh World Wide Web Conference.
Ozgur, A., Ozgur, L., and Gungor, T. (2005). Text categorization with class-based and corpus-based keyword
selection. In International Symposium on Computer and Information Sciences, (pp. 606–615).
Paris, C. L. (1988). Tailoring object descriptions to a user’s level of expertise. Computational Linguistics,
14 (3), 64–78.
Pennebaker, J. and Stone, L. (2003). Words of wisdom: Language use over the lifespan. Journal of Personality
and Social Psychology, (85), 291–301.
Pennebaker, J. W. and Beall, K. S. (1986). Confronting a traumatic event: Toward an understanding of
inhibition and disease. Journal of Abnormal Psychology, 95, 274–281.
Pennebaker, J. W. and King, L. A. (1999). Linguistic styles: Language use as an individual difference.
Journal of Personality and Social Psychology, 77 (6), 1296–1312.
Pickering, M. and Garrod, S. (2004). Toward a mechanistic psychology of dialog. Behavioral and Brain
Sciences, 27, 169–190.
Pine, F. (1964). The bearing of psychoanalytic theory on selected issues in research on marginal stimuli.
Journal of Nervous and Mental Diseases, 138, 68–75.
Porteus, S. (1959). The Maze Test and Clinical Psychology. Palo Alto, Calif.: Pacific Books.
Proctor, C. and Loomis, C. (1951). Analysis of sociometric data. In M. Jahoda, M. Deutsch, and S. Cook
(Eds.), Research Methods in Social Relations (pp. 561–586). New York: Dryden Press.
Ramsay, R. (1968). Speech patterns and personality. Language and Speech, 11, 54–63.
Raven, J. (1941). Standardization of progressive matrices, 1938. British Journal of Medical Psychology,
19 (1), 137–150.
Reitter, D., Keller, F., and Moore, J. (2006). Computational modelling of structural priming in dialogue.
In Proceedings of the Conference of the North American Chapter of the Association for Computational
Linguistics: Human Language Technologies 2006, (pp. 121–124).
Rienks, R. and Heylen, D. (2005a). Automatic dominance detection in meetings using easily obtainable
features. In 2nd Joint Workshop on Multimodal Interaction and Related Machine Learning Algorithms,
MLMI 2005, Edinburgh, Scotland.
Rogers-Millar, E. L. and Millar, F. E. (1979). Domineeringness and dominance: A transactional view. Human
Communication Research, 5 (3), 238–246.
Roid, G. (2003). Stanford-Binet Intelligence Scales: Fifth Edition, Examiner’s Manual. Itasca, IL: Riverside.
Rude, S., Gortner, E.-M., and Pennebaker, J. (2004). Language use of depressed and depression-vulnerable
college students. Cognition and Emotion, (18), 1121–1133.
Saucier, G. (1997). Effects of variable selection on the factor structure of person descriptors. Journal of
Personality and Social Psychology, 73 (6), 1296–1312.
Saville-Troike, M. (1982). The Ethnography of Communication: An Introduction. Baltimore: University Park
Press.
Schiffrin, D. (1987). Discourse Markers. Cambridge: Cambridge Universtiy Press.
Schmidt-Atzert, L. and Strohm, W. (1983). Ein Beitrag zur Taxonomie der Emotionsworter. Psychologische
Beitrage, 25, 126–141.
Semin, G. R. and Fiedler, K. (1988). The cognitive functions of linguistic categories in describing persons:
Social cognition and language. Journal of Personality and Social Psychology, 54, 558–568.
Shaw, M. (1954). Group structure and the behavior of individuals in small groups. Journal of Psychology,
38, 139–149.
Siegman, A. and Pope, B. (1965). Effects of question specificity and anxiety-producing messages on verbal
fluency in the initial interview. Journal of Personality and Social Psychology, 2, 522–530.
Sillars, A., Shellen, W., McIntosh, A., and Pomegranate, M. (1997). Relational characteristics of language:
Elaboration and differentiation in marital conversations. Western Journal of Communication, 61, 403–
422.
B References 145
Simmons, R. A., Chambless, D. L., and Gordon, P. C. (2008). How do hostile and emotionally overinvolved
relatives view relationships? What relatives’ pronoun use tells us. Family Process, 47, 405–419.
Simmons, R. A., Gordon, P., and Chambless, D. L. (2005). Pronouns in marital interaction. Psychological
Science, 16, 932–936.
Slatcher, R., Vazire, S., and Pennebaker, J. (2008). Am “I” more important than “we”? Couples’ word use
in instant messages. Personal Relationships, 15, 407–424.
Slatcher, R. B., Chung, C. K., Pennebaker, J. W., and Stone, L. D. (2007). Winning words: Individual
differences in linguistic style among U.S. presidential and vice presidential candidates. Journal of Research
in Personality, 41, 63–75.
Solka, J. (2008). Text data mining: Theory and methods. Statistics Surveys 2008, Vol. 2, 94-112.
Comments: Published in at http://dx.doi.org/10.1214/07-SS016 the Statistics Surveys (http://www.i-
journals.org/ss/) by the Institute of Mathematical Statistics (http://www.imstat.org).
Spearman, C. (1923). The Nature of “Intelligence” and the Principles of Cognition. London: Macmillan.
Spearman, C. (1950). Human Ability. Macmillan, London.
Spence, D. P., Mayes, L. C., and Dahl, H. (1994). Monitoring the analytic surface. Journal of the American
Psychoanalytic Association, 42 (1), 43–64.
Stenchikova, S. and Stent, A. (2007). Measuring adaptation between dialogs. In Proceedings of the 7th
SIGdial Workshop on Discourse and Dialog.
Stenquist, J. (1922). Stenquist Mechanical Aptitude Tests: Manual of Directions. Yonkers-on-Hudson, N.Y.,
World book company.
Sternberg, R. (1977). Intelligence, Information Processing, and Analogical Reasoning: The Componential
Analysis of Human Abilities. Hillsdale, NJ: Erlbaum.
Sternberg, R. (1994). In Search of the Human Mind. New York: Harcourt Brace.
Sternberg, R. J. and Ruzgis, P. (1994). Personality and Intelligence. Cambridge University Press.
Stirman, S. and Pennebaker, J. (2001). Word use in the poetry of suicidal and non-suicidal poets. Psycho-
somatic Medicine, 63, 517–522.
Stoyanchev, S. and Stent, A. (2009). Lexical and syntactic priming and their impact in deployed spoken
dialog systems. In Proceedings of Conference of the North American Chapter of the Association for
Computational Linguistics: Human Language Technologies 2009, (pp. 189–192).
Straker, D. (2012). Changing minds. http://changingminds.org/newblock explanations/research/analysis-
/chi-square.htm.
Strumr, M. (1998). Muendliche Syntax im schriftlichen Text - ein Vorbild? Zum Tageszeitungskommentar
in “Frankfurter Rundschau”, “Rhein-Zeitung” and “BILD”. Interaction and Linguistic Structures, (7).
Sullivan, E., Clark, W., and Tiegs, E. (1937). California Test of Mental Maturity: Pre-primary Series.
California Test Bureau.
Talmy, L. (1985). Lexicalization patterns. In T. A. Shopen (Ed.), Language Typology and Syntactic Descrip-
tion, volume 3 (pp. 57–149). Cambridge: Cambridge University Press.
Tannen, D. (1982). Oral and literate strategies in spoken and written narratives. Language, 58, 1–21.
Terman, L. (1916). The Measurement of Intelligence. Boston, MA: Houghton Mifflin.
Thurstone, L. L. (1938). Primary Mental Abilities. Chicago: University of Chicago Press.
Tomasello, M. (2008). Origins of Human Communication. MIT Press.
Vinciarelli, A. (2005). Application of information retrieval techniques to single writer documents. Pattern
Recognitions Letters, 26, 2262–2271.
Virginia, T. and Dahl, H. (1995). What psychoanalysis needs is more empirical research. In T. Shapiro and
R. Emde (Eds.), Research in Psychoanalysis: Process, Development, Outcome. Madison, CT: Interna-
tional UP.
Vogel, C. and Lynch, G. (2007). Computational stylometry: Who’s in a play? In Proceedings of COST 2102
Workshop, (pp. 169–186).
vor der Bruck, T., Helbig, H., and Leveling, J. (2008). The Readability Checker DeLite. Technical report.
Hagen FernUniversitat.
Vygotsky, L. (1986). Thought and Language (2nd ed.). MIT Press.

146 B References
Walberg, H. (1984). Improving the productivity of America’s schools. Educational Leadership, 41, 19–27.
Walter, S. (2008). Therapeutische Gesprachsfuhrung und Emotions-Abstraktionsmuster des Patienten, Dis-
sertation zur Erlangung des Doktorgrades der Humanbiologie der Medizinischen Fakultat der Universitat
Ulm.
Ward, A. and Litman, D. (2007). Automatically measuring lexical and acoustic/prosodic convergence in
tutorial dialog corpora. In Proceedings of the Workshop on Speech and Language Technology in Education,
(pp. 57–60).
Wasserman, A. S. and Faust, K. (1994). Social Network Analysis: Methods and Applications. Cambridge
University Press.
Wechsler, D. (1939b). Wechsler-Bellevue intelligence scale. New York: The Psychological Corporation.
Wechsler, D. (1949). Wechsler Intelligence Scale for Children. New York: The Psychological Corporation.
Wechsler, D. (1955). Manual for the Wechsler Adult Intelligence Scale. New York: The Psychological
Corporation.
Wechsler, D. (1981). Manual for the Wechsler Adult Intelligence Scale - revised. New York: The Psychological
Corporation.
Wechsler, D. (1982). Handanweisung zum Hamburg-Wechsler-Intelligenztest fur Erwachsene (HAWIE). Sep-
aratdr., Bern; Stuttgart; Wien, Huber.
Wechsler, D. (1989). Wechsler Preschool and Primary Scale of Intelligence - revised. San Antonio, TX: The
Psychological Corporation.
Wechsler, D. (1997). Wechsler Adult Intelligence Scale - third edition. The Psychological Corporation, San
Antonio, TX.
Weizenbaum, J. (1966). Eliza – a computer program for the study of natural language communication
between man and machine. Communications of the ACM, 9 (1), 36–45.
Wilson, P. and Anderson, R. (1986). What they don’t Know will Hurt them: the Role of Prior Knowledge in
Comprehension. Reading Comprehension: From Research to Practice. Erlbaum, Hillsdale, NJ.
Wolf, M., Horn, A. B., Mehl, M. R., Haug, S., Pennebaker, J. W., and Kordy, H. (2008). Computergestutzte
quantitative Textanalyse. Aquivalenz und Robustheit der deutschen Version des Linguistic Inquiry and
Word Count. Diagnostica, 54 (Heft 2), 85–98.
Yang, Y. and Pedersen, J. O. (1997). A comparative study on feature selection in text categorization. In
Fisher, D. H. (Ed.), Proceedings of ICML-97, 14th International Conference on Machine Learning, (pp.
412–420)., Nashville, US. Morgan Kaufmann Publishers, San Francisco, US.
Yekovich, F. R. (1994). Current issues in research on intelligence. Practical Assessment, Research and
Evaluation. From http://PAREonline.net/getvn.asp?v=4n=4, 4 (4).

List of Figures
1.1 Next-Generation Spoken Dialogue System. . . . . . . . . . . . . . . . . . . . . . . . . . . . . . . . . . . . . . . . . . . . . . . 2
1.2 Adaptation to the user. . . . . . . . . . . . . . . . . . . . . . . . . . . . . . . . . . . . . . . . . . . . . . . . . . . . . . . . . . . . . . . 4
2.1 Hierarchical model of intelligence. . . . . . . . . . . . . . . . . . . . . . . . . . . . . . . . . . . . . . . . . . . . . . . . . . . . . . . 11
2.2 Guilford’s “Structure of intellect”. . . . . . . . . . . . . . . . . . . . . . . . . . . . . . . . . . . . . . . . . . . . . . . . . . . . . . 14
2.3 Hierarchical structure of the Stanford-Binet test. . . . . . . . . . . . . . . . . . . . . . . . . . . . . . . . . . . . . . . . . . 15
3.1 Verbal Part of the Hamburg Wechsler Intelligence Test for Adults. . . . . . . . . . . . . . . . . . . . . . . . . . . . 31
3.2 Questionnaire for the interview with test persons (Part 1). . . . . . . . . . . . . . . . . . . . . . . . . . . . . . . . . . 35
3.3 Questionnaire for the interview with test persons (Part 2). . . . . . . . . . . . . . . . . . . . . . . . . . . . . . . . . . 36
3.4 Excerpts from the film. . . . . . . . . . . . . . . . . . . . . . . . . . . . . . . . . . . . . . . . . . . . . . . . . . . . . . . . . . . . . . . . 37
3.5 Excerpts from the monologue of a test person with a higher verbal intelligence level. . . . . . . . . . . . 37
3.6 Excerpts from the monologue of a test person with an average verbal intelligence level. . . . . . . . . . 37
3.7 Excerpts from the monologue of a test person with a lower verbal intelligence level. . . . . . . . . . . . . 38
3.8 Excerpt from one of the recorded dialogues. . . . . . . . . . . . . . . . . . . . . . . . . . . . . . . . . . . . . . . . . . . . . . 38
4.1 Approaches that were applied to the verbal intelligence corpus. . . . . . . . . . . . . . . . . . . . . . . . . . . . . . 39
4.2 Results of the program Morphy. . . . . . . . . . . . . . . . . . . . . . . . . . . . . . . . . . . . . . . . . . . . . . . . . . . . . . . . 45
4.3 Excerpts from the film and one of the recorded monologues. . . . . . . . . . . . . . . . . . . . . . . . . . . . . . . . . 50
4.4 Representation of a short conversation between two dialogue partners consisting of four turns. . . . 75
4.5 Representation of a short conversation between two dialogue partners consisting of four turns. . . . 76
4.6 Emotion-abstraction patterns ([Mergenthaler, 1996]). . . . . . . . . . . . . . . . . . . . . . . . . . . . . . . . . . . . . . 79
4.7 CM Software. . . . . . . . . . . . . . . . . . . . . . . . . . . . . . . . . . . . . . . . . . . . . . . . . . . . . . . . . . . . . . . . . . . . . . . 80
4.8 Influence diffusing process. . . . . . . . . . . . . . . . . . . . . . . . . . . . . . . . . . . . . . . . . . . . . . . . . . . . . . . . . . . . . 81
4.9 An example of a dialogue between three actors. . . . . . . . . . . . . . . . . . . . . . . . . . . . . . . . . . . . . . . . . . . 86
4.10 The three dialogue partners (actors) and the directed lines between them that represent the order
of the actors in the communication. . . . . . . . . . . . . . . . . . . . . . . . . . . . . . . . . . . . . . . . . . . . . . . . . . . . . 87
4.11 Questionnaire for dominance estimation (Part 1). . . . . . . . . . . . . . . . . . . . . . . . . . . . . . . . . . . . . . . . . . 89
4.12 Questionnaire for dominance estimation (Part 2). . . . . . . . . . . . . . . . . . . . . . . . . . . . . . . . . . . . . . . . . . 90
4.13 The K-means algorithm. . . . . . . . . . . . . . . . . . . . . . . . . . . . . . . . . . . . . . . . . . . . . . . . . . . . . . . . . . . . . . . 93
4.14 ANOVA experiments. . . . . . . . . . . . . . . . . . . . . . . . . . . . . . . . . . . . . . . . . . . . . . . . . . . . . . . . . . . . . . . . . 94
4.15 ANOVA for two clusters. . . . . . . . . . . . . . . . . . . . . . . . . . . . . . . . . . . . . . . . . . . . . . . . . . . . . . . . . . . . . . 94
4.16 ANOVA for three clusters. . . . . . . . . . . . . . . . . . . . . . . . . . . . . . . . . . . . . . . . . . . . . . . . . . . . . . . . . . . . . 95
5.1 Analysis of features that were extracted from the monologues and dialogues. . . . . . . . . . . . . . . . . . . 98
5.2 Baseline approach: Class-Based vs Corpus-Based feature selection. . . . . . . . . . . . . . . . . . . . . . . . . . . . 111
5.3 kNN results for different k values. . . . . . . . . . . . . . . . . . . . . . . . . . . . . . . . . . . . . . . . . . . . . . . . . . . . . . . 112
5.4 Comparison between approaches: Rocchio wins. . . . . . . . . . . . . . . . . . . . . . . . . . . . . . . . . . . . . . . . . . . 112
5.5 Classification results using words vs lemmas. . . . . . . . . . . . . . . . . . . . . . . . . . . . . . . . . . . . . . . . . . . . . . 113

148 List of Figures
5.6 Tempted to use more classes: three classes. . . . . . . . . . . . . . . . . . . . . . . . . . . . . . . . . . . . . . . . . . . . . . . 115
5.7 kNN results for different k values. Classification of dialogues into two classes. . . . . . . . . . . . . . . . . . 125
5.8 kNN results for different k values. Classification of dialogues into three classes. . . . . . . . . . . . . . . . . 126
5.9 Comparison between approaches for two classes. . . . . . . . . . . . . . . . . . . . . . . . . . . . . . . . . . . . . . . . . . . 126
5.10 Comparison between approaches for three classes. . . . . . . . . . . . . . . . . . . . . . . . . . . . . . . . . . . . . . . . . 127
5.11 Classification results using words vs lemmas for three classes. . . . . . . . . . . . . . . . . . . . . . . . . . . . . . . . 127

List of Tables
2.1 Adaptive Behaviour Checklist. . . . . . . . . . . . . . . . . . . . . . . . . . . . . . . . . . . . . . . . . . . . . . . . . . . . . . . . . . 16
2.2 Professions and intelligence levels. . . . . . . . . . . . . . . . . . . . . . . . . . . . . . . . . . . . . . . . . . . . . . . . . . . . . . 22
3.1 Statistical details of the monologues and dialogues. . . . . . . . . . . . . . . . . . . . . . . . . . . . . . . . . . . . . . . . 34
4.1 Word modification. . . . . . . . . . . . . . . . . . . . . . . . . . . . . . . . . . . . . . . . . . . . . . . . . . . . . . . . . . . . . . . . . . . 42
4.2 Word modification. . . . . . . . . . . . . . . . . . . . . . . . . . . . . . . . . . . . . . . . . . . . . . . . . . . . . . . . . . . . . . . . . . . 42
4.3 Parts of speech. . . . . . . . . . . . . . . . . . . . . . . . . . . . . . . . . . . . . . . . . . . . . . . . . . . . . . . . . . . . . . . . . . . . . . 46
4.4 Subordinating Conjunctions. . . . . . . . . . . . . . . . . . . . . . . . . . . . . . . . . . . . . . . . . . . . . . . . . . . . . . . . . . . 46
4.5 Coordinating Conjunctions. . . . . . . . . . . . . . . . . . . . . . . . . . . . . . . . . . . . . . . . . . . . . . . . . . . . . . . . . . . . 47
4.6 Discontinuous conjunctions. . . . . . . . . . . . . . . . . . . . . . . . . . . . . . . . . . . . . . . . . . . . . . . . . . . . . . . . . . . . 47
4.7 Words with their frequency values according to the dictionary [Kupietz et al., 2010]. . . . . . . . . . . . 49
4.8 Matrix for lemma frequency. . . . . . . . . . . . . . . . . . . . . . . . . . . . . . . . . . . . . . . . . . . . . . . . . . . . . . . . . . . 51
4.9 Modal particles. . . . . . . . . . . . . . . . . . . . . . . . . . . . . . . . . . . . . . . . . . . . . . . . . . . . . . . . . . . . . . . . . . . . . . 54
4.10 Directional and perspectival particles. . . . . . . . . . . . . . . . . . . . . . . . . . . . . . . . . . . . . . . . . . . . . . . . . . . . 54
4.11 Adverbs used for constructing temporal clauses. . . . . . . . . . . . . . . . . . . . . . . . . . . . . . . . . . . . . . . . . . . 58
4.12 Adverbial expressions in pre-prefield. . . . . . . . . . . . . . . . . . . . . . . . . . . . . . . . . . . . . . . . . . . . . . . . . . . . . 63
4.13 LIWC categories with examples. . . . . . . . . . . . . . . . . . . . . . . . . . . . . . . . . . . . . . . . . . . . . . . . . . . . . . . . 66
4.14 Pairs of German pronouns that were used for measuring to what degree dialogue partners were
close to each other. . . . . . . . . . . . . . . . . . . . . . . . . . . . . . . . . . . . . . . . . . . . . . . . . . . . . . . . . . . . . . . . . . . 78
4.15 Linguistic categories that were used for LSM calculations. . . . . . . . . . . . . . . . . . . . . . . . . . . . . . . . . . 82
4.16 The sociomatrix for the communication represented in Figure 4.9. . . . . . . . . . . . . . . . . . . . . . . . . . . . 87
5.1 Mean values of the morphological features that were significant according to ANOVA for the
different verbal intelligence groups. . . . . . . . . . . . . . . . . . . . . . . . . . . . . . . . . . . . . . . . . . . . . . . . . . . . . . 99
5.2 Mean values of the lexical features that were significant according to ANOVA for different verbal
intelligence groups. . . . . . . . . . . . . . . . . . . . . . . . . . . . . . . . . . . . . . . . . . . . . . . . . . . . . . . . . . . . . . . . . . . 100
5.3 Mean values of the syntactic features that were significant according to ANOVA for the different
verbal intelligence groups. . . . . . . . . . . . . . . . . . . . . . . . . . . . . . . . . . . . . . . . . . . . . . . . . . . . . . . . . . . . . 101
5.4 Mean values of LIWC features that were significant according to ANOVA for different verbal
intelligence groups. . . . . . . . . . . . . . . . . . . . . . . . . . . . . . . . . . . . . . . . . . . . . . . . . . . . . . . . . . . . . . . . . . . 102
5.5 Mean values of speech style features that were significant according to ANOVA for different
verbal intelligence groups. . . . . . . . . . . . . . . . . . . . . . . . . . . . . . . . . . . . . . . . . . . . . . . . . . . . . . . . . . . . . 103
5.6 Classification results without feature selection. . . . . . . . . . . . . . . . . . . . . . . . . . . . . . . . . . . . . . . . . . . . 103
5.7 Top five morphological features according to IGR and V2-Test. . . . . . . . . . . . . . . . . . . . . . . . . . . . . . 104
5.8 Classification results with the highest accuracy scores when applying feature selection algorithms
to morphological features. . . . . . . . . . . . . . . . . . . . . . . . . . . . . . . . . . . . . . . . . . . . . . . . . . . . . . . . . . . . . 104
5.9 Top ten lexical features according to IGR and V2-Test. . . . . . . . . . . . . . . . . . . . . . . . . . . . . . . . . . . . . 105

150 List of Tables
5.10 Classification results with the highest accuracy scores when applying feature selection algorithms
to lexical features. . . . . . . . . . . . . . . . . . . . . . . . . . . . . . . . . . . . . . . . . . . . . . . . . . . . . . . . . . . . . . . . . . . . 105
5.11 Top five syntactic features according to IGR and V2-Test. . . . . . . . . . . . . . . . . . . . . . . . . . . . . . . . . . . 106
5.12 Classification results with the highest accuracy scores when applying feature selection algorithms
to syntactic features. . . . . . . . . . . . . . . . . . . . . . . . . . . . . . . . . . . . . . . . . . . . . . . . . . . . . . . . . . . . . . . . . 106
5.13 Top five semantic features according to IGR and V2-Test. . . . . . . . . . . . . . . . . . . . . . . . . . . . . . . . . . . 107
5.14 Classification results with the highest accuracy scores when applying feature selection algorithms
to semantic features. . . . . . . . . . . . . . . . . . . . . . . . . . . . . . . . . . . . . . . . . . . . . . . . . . . . . . . . . . . . . . . . . 107
5.15 Top five stylistic features according to IGR and V2-Test. . . . . . . . . . . . . . . . . . . . . . . . . . . . . . . . . . . . 107
5.16 Classification results with the highest accuracy scores when applying feature selection algorithms
to speech style features. . . . . . . . . . . . . . . . . . . . . . . . . . . . . . . . . . . . . . . . . . . . . . . . . . . . . . . . . . . . . . . 107
5.17 Classification results obtained using SVM and GA-informative features for two classes. . . . . . . . . . . 108
5.18 Classification results obtained using Naive Bayes and GA-informative features. . . . . . . . . . . . . . . . . . 108
5.19 Dimension differences between class-based and corpus-based approaches for two classes. . . . . . . . . 110
5.20 Dimension differences between class-based and corpus-based approaches for three classes. . . . . . . 110
5.21 Mean values of significant features extracted from the dialogues. . . . . . . . . . . . . . . . . . . . . . . . . . . . . 116
5.22 Mean values of significant linguistic cues extracted from the dialogues. . . . . . . . . . . . . . . . . . . . . . . . 117
5.23 Percentage of linguistic categories with significant correlation coefficients at the conversational level.121
5.24 Classification accuracy values for the dialogues. Classes: higher and lower verbal intelligence
speakers. . . . . . . . . . . . . . . . . . . . . . . . . . . . . . . . . . . . . . . . . . . . . . . . . . . . . . . . . . . . . . . . . . . . . . . . . . . 124

C
List of Own Publications
Fernandez-Martınez, F., Zablotskaya, K., and Minker, W. (2012). Text Categorization Methods for Auto-
matic Estimation of Verbal Intelligence. Expert Systems with Applications, 39 (10), 9807–9820.
Nothdurft, F., Honold, F., Zablotskaya, K., Amr, D., and Minker, W. (2014). Application of Verbal In-
telligence in Dialog Systems for Multimodal Interaction. 10th International Conference on Intelligent
Environments. Best poster award winner.
Zablotskaya, K. (2009). Genetic Programming Application for User Capabilities Determination. In 4th
International Workshop on Artificial Intelligence Techniques for Ambient Intelligence (AITAmI’09), vol-
ume 4.
Zablotskaya, K., Abbas, M., Zablotskiy, S., Walter, S., and Minker, W. (2011). Measuring Verbal Intelligence
using Linguistic Analysis. In The 7th International Conference on Intelligent Environments.
Zablotskaya, K., Ahmed, M., Zablotskiy, S., and Minker, W. (2010). Non-parametric Regression and Ran-
dom Balance Method Modification for Determination of the Most Informative Features. In The 6th
International Conference on Intelligent Environments - IE’10.
Zablotskaya, K., Fernandez-Martınez, F., and Minker, W. (2012a). Estimating Adaptation of Dialogue
Partners with Different Verbal Intelligence. In 13th annual SIGdial Meeting on Discourse and Dialogue.
Zablotskaya, K., Fernandez-Martınez, F., and Minker, W. (2012b). Investigating Verbal Intelligence using the
TF-IDF Approach. In International Conference on Language Resources and Evaluation (LREC 2012).
Zablotskaya, K., Rahim, U., Fernandez-Martınez, F., and Minker, W. (2012). Relating Dominance of Dialogue
Participants with their Verbal Intelligence Scores. In International Conference on Language Resources
and Evaluation (LREC 2012).
Zablotskaya, K., Rahim, U., Zablotskiy, S., Walter, S., and Minker, W. (2011). Conversation Peculiarities of
People with Different Verbal Intelligence. In IWSDS 2011: Workshop on Paralinguistic Information and
its Integration in Spoken Dialogue Systems.
Zablotskaya, K., Walter, S., and Minker, W. (2010). Speech Data Corpus for Verbal Intelligence Estimation.
In International Conference on Language Resources and Evaluation (LREC).
Zablotskaya, K., Walter, S., Zablotskiy, S., and Minker, W. (2010). Determination of Variables Significance
Using Esimations of the First-Oder Partial Derivative. Scientific Journal of Siberian State Aerospace
University named after academician M.F. Reshetnev, 5(31), 30–33.
Zablotskaya, K., Zablotskiy, S., Fernandez-Martınez, F., and Minker, W. (2012). Language Style Matching
and Verbal Intelligence. Bulletin of Siberian State Aerospace University named after academician M.F.
Reshetnev. In Press.
Zablotskaya, K., Zablotskiy, S., Walter, S., and Minker, W. (2011). A Simple One-Way Analysis of Variance as
a Way to Determine More Informative Features for Speech-Based User’s Verbal Intelligence Estimation.
In 14th International Conference on Speech and Computer (SPECOM2011).
Zablotskiy, S., Pitakrat, T., Zablotskaya, K., and Minker, W. (2011). GMM Parameters Estimation by Means
of EM and Genetic Algorithm. In 14th International Conference on Human-Computer Interaction.
Zablotskiy, S., Zablotskaya, K., and Minker, W. (2010). Some Approaches for Russian Speech Recognition.
In The 6th International Conference on Intelligent Environments - IE’10.

152 C List of Own Publications
Zablotskiy, S., Zablotskaya, K., and Minker, W. (2011). Automatic Pre-processing of the Russian Text Cor-
pora for Language Modeling. In 14th International Conference on Speech and Computer (SPECOM2011).