automatic detection of window regions in indoor point clouds using r-cnn
TRANSCRIPT
Automatic Detection of Window Regions in Indoor Point Clouds Using R-CNN
Craig Hiller, David Zhang, Tianhao Zhang, Zihao ZhangUniversity of California Berkeley
{chiller, dzhang, tianhao.z, geraldzhang} @ berkeley.edu
Abstract
In this paper, we propose an algorithm to automaticallyidentify window regions on exterior-facing building facadesin a colored 3D point cloud generated using data capturedfrom an ambulatory backpack sensor system outfitted withmultiple LiDAR sensors and cameras. Our work is basedon a R-CNN-inspired algorithm, on top on which we addedsome filtering and preprocessing technique. We use MCGfor generating region proposals, pass the proposal to a con-volution neural net, and train a random forest with theoutput vectors. With our implementation, we are able toachieve an F1 score of 89.79% and mAP of 96.64%.
1. Introduction3D modeling of building interior is an important applica-
tion in the architecture and civil engineering industry. Forexample, a tool called Energy Plus models and simulatesbuilding energy efficiency [4]. In order to model the energyefficiency of a building, it’s important to accurately measurethe ”window to wall ratio” of the exterior facades. In ourwork, we use data collected by a human-operated backpack-mounted system made of cameras and multi-modal sensors,in order to detect exterior-facing window in the buildings.
Our project branches off of previous work done byZhang et al. [4] who used the same backpack system as wedo. As mentioned in their paper, the task of detecting win-dows from colored 3D point clouds presents a twofold chal-lenge. Firstly, we are limited by the amount of training dataavailable for structured prediction. Secondly, windows aretransparent and are inherently shapeless in 3D space. As aresult, conventional image feature descriptors lack discrim-inative power in identifying windows due to the absence ofvisual cues such as color and texture. Shape descriptorsdeveloped for 3D point clouds are not also applicable [4].However, our approaches differ substantially in the way weaddress the aforementioned difficulties and how we lever-age the multiple modalities of the data acquisition unit.
In Zhang et al’s work, they utilized three features to aidin discriminating between windowed and walled regions.
Firstly, they used grayscale intensity values from the vi-sual imaging modality to capture lighting differences be-tween indoor and outdoor regions. Secondly, they measuredthe proportion of laser-beam returns received by the LiDARscanner to exploit differences in infrared opaqueness (glasstends to absorb infrared light). Finally, they used a heuris-tic to construct an ”occlusion proxy” feature by noting thatoccluded regions are more likely to be wall than window[4].
While the approach proposed by Zhang et al achieveshigh accuracy and F1 score, their method is limited by someon-site constraints. For example, the grayscale intensity andlaser beam reflection feature do not work if the blinds of thewindow are down, or when the lighting outside the windowdoes not have a strong contrast with the indoor lighting. Ourapproach attempts to utilize more visual information, whichis captured by the left and right camera of the backpackduring the data collection.
We applied the a similar approach to R-CNN[2], with ad-ditional processing and fine-tuning, we are able to achievean accuracy of over 90%. For each of the images, we gen-erate region candidates, and then for each region proposal,we pass it through a convolution neural net to generate afeature vector.
This feature vector is then passed through a binary (win-dow or not) classifier that was trained through a similar pro-cess. We experimented different algorithms for classifica-tion, more details about this will follow in later sections.Since we use learnt feature from the convolution neural netin our detection, our algorithm is more robust to differentconditions of indoor and outdoor lighting. Also, we trainour classifier with data points sampled from a variety of dis-tributions(daytime and nighttime, blinds up and down etc.)so we are able to detect windows sampled from different en-vironments, adding robustness to our algorithm. The finalimprovements to our algorithm come from a manual pre-processing of some data in the image set we are classifying.This ”human touch” allows us achieve even better resultswith only a few minutes of human interaction.
1
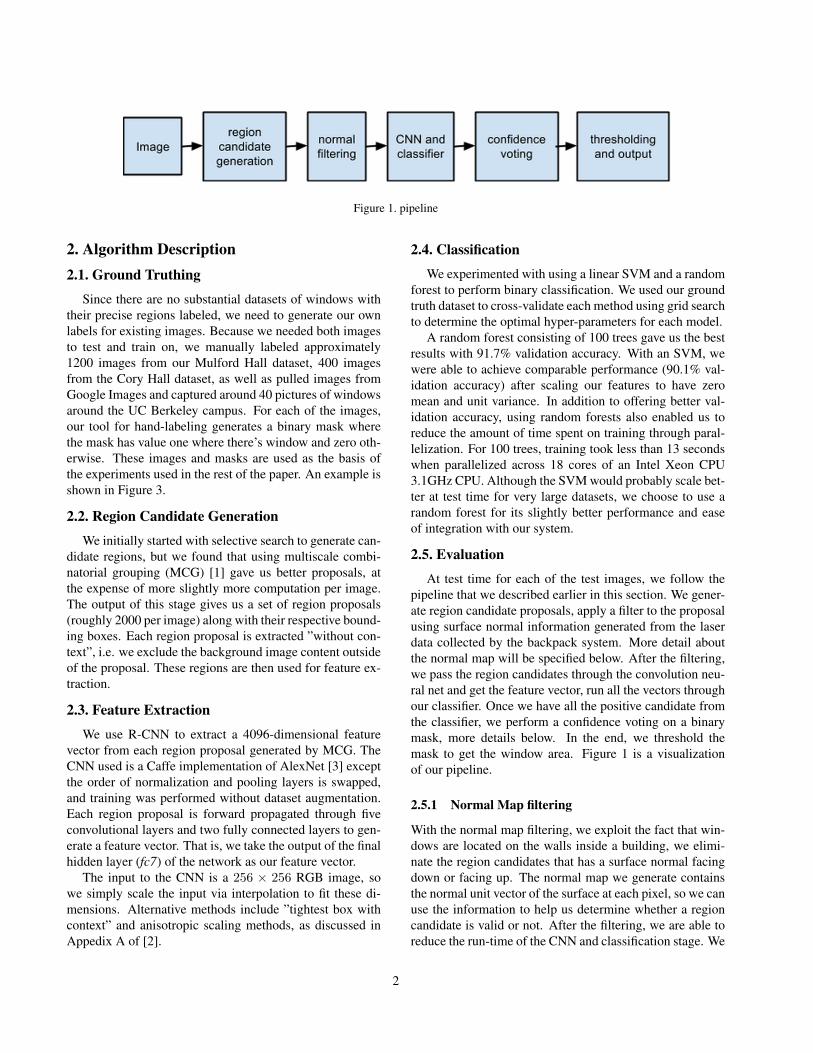
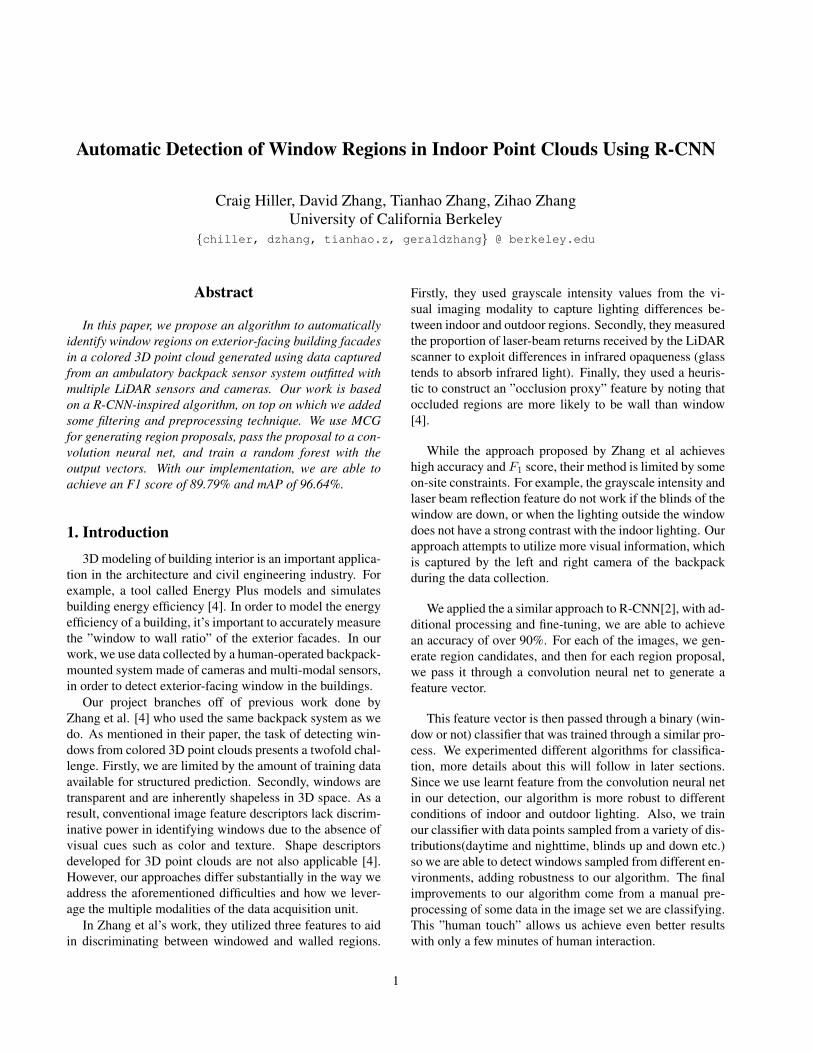
Figure 1. pipeline
2. Algorithm Description2.1. Ground Truthing
Since there are no substantial datasets of windows withtheir precise regions labeled, we need to generate our ownlabels for existing images. Because we needed both imagesto test and train on, we manually labeled approximately1200 images from our Mulford Hall dataset, 400 imagesfrom the Cory Hall dataset, as well as pulled images fromGoogle Images and captured around 40 pictures of windowsaround the UC Berkeley campus. For each of the images,our tool for hand-labeling generates a binary mask wherethe mask has value one where there’s window and zero oth-erwise. These images and masks are used as the basis ofthe experiments used in the rest of the paper. An example isshown in Figure 3.
2.2. Region Candidate Generation
We initially started with selective search to generate can-didate regions, but we found that using multiscale combi-natorial grouping (MCG) [1] gave us better proposals, atthe expense of more slightly more computation per image.The output of this stage gives us a set of region proposals(roughly 2000 per image) along with their respective bound-ing boxes. Each region proposal is extracted ”without con-text”, i.e. we exclude the background image content outsideof the proposal. These regions are then used for feature ex-traction.
2.3. Feature Extraction
We use R-CNN to extract a 4096-dimensional featurevector from each region proposal generated by MCG. TheCNN used is a Caffe implementation of AlexNet [3] exceptthe order of normalization and pooling layers is swapped,and training was performed without dataset augmentation.Each region proposal is forward propagated through fiveconvolutional layers and two fully connected layers to gen-erate a feature vector. That is, we take the output of the finalhidden layer (fc7) of the network as our feature vector.
The input to the CNN is a 256 × 256 RGB image, sowe simply scale the input via interpolation to fit these di-mensions. Alternative methods include ”tightest box withcontext” and anisotropic scaling methods, as discussed inAppedix A of [2].
2.4. Classification
We experimented with using a linear SVM and a randomforest to perform binary classification. We used our groundtruth dataset to cross-validate each method using grid searchto determine the optimal hyper-parameters for each model.
A random forest consisting of 100 trees gave us the bestresults with 91.7% validation accuracy. With an SVM, wewere able to achieve comparable performance (90.1% val-idation accuracy) after scaling our features to have zeromean and unit variance. In addition to offering better val-idation accuracy, using random forests also enabled us toreduce the amount of time spent on training through paral-lelization. For 100 trees, training took less than 13 secondswhen parallelized across 18 cores of an Intel Xeon CPU3.1GHz CPU. Although the SVM would probably scale bet-ter at test time for very large datasets, we choose to use arandom forest for its slightly better performance and easeof integration with our system.
2.5. Evaluation
At test time for each of the test images, we follow thepipeline that we described earlier in this section. We gener-ate region candidate proposals, apply a filter to the proposalusing surface normal information generated from the laserdata collected by the backpack system. More detail aboutthe normal map will be specified below. After the filtering,we pass the region candidates through the convolution neu-ral net and get the feature vector, run all the vectors throughour classifier. Once we have all the positive candidate fromthe classifier, we perform a confidence voting on a binarymask, more details below. In the end, we threshold themask to get the window area. Figure 1 is a visualizationof our pipeline.
2.5.1 Normal Map filtering
With the normal map filtering, we exploit the fact that win-dows are located on the walls inside a building, we elimi-nate the region candidates that has a surface normal facingdown or facing up. The normal map we generate containsthe normal unit vector of the surface at each pixel, so we canuse the information to help us determine whether a regioncandidate is valid or not. After the filtering, we are able toreduce the run-time of the CNN and classification stage. We
2

are able able to reject candidates that are on the ceilings andfloor, but could be confused with windows. In Figure 2, weshow the region candidates generated without filtering, thecorresponding normal map, and the region candidates afterfiltering.
2.5.2 Confidence Voting
Once we have the positive candidates returned from theclassifier, we want to generate a binary mask for denotingthe regions that our algorithm would classify as windows.
We experienced with an naive algorithm such that foreach pixel, if the pixel is contained in any positive re-gion candidate mask, we classify that pixel as windowarea. However, although we have an over 90 percent cross-validation accuracy for our classifier, false positives havesignificant impact on the outcome of the naive algorithm. Aexample is shown in Figure 3.
To overcome this problem, we implemented a votingbased algorithm. We begin with an all-zero gray-scalemask, and then for each region candidate mask, we addsome confidence score to the gray-scale mask. Since win-dow is a continuous-shaped object, we penalize the regionproposals with large bounding boxes but small masks.
For each region candidate
confidence score = er − 1 (1)
where r is the proportion of the bounding box area to maskarea.
Since the result gray-scale image should be invariant tothe number of positive bounding boxes, we normalize thegray-scale mask to [0, 1].
After we apply the confidence voting, the resulting gray-scale map has much better accuracy. A comparison of thenaive result and the confidence voting result is shown infigure 3 below.
2.6. Human Augmented Dataset
Using just images collected from Google Images andtaken around campus, the window regions we detect tendto miss the blinds. This is in part due to a lack of curtainedor blinded image data in that training dataset, and when weenter a new environment, we may encounter a type of win-dow covering we may have not seen before. Having a hu-man label a small fraction of randomly chosen images fromthe images we are trying to classify gives our algorithm astronger sense of the window and blind types in the over-all dataset. This relies on the assumption that in a givenbuilding a general style is preserved and randomly pickingimages should cover most of the variation. In our experi-ment we used 40 images, which took less than ten minutesto classify. The improvement of adding in this new data isshown in Figure 3.
Figure 3. test image with ground truth shaded (upper left), non-human augmented classification with confidence voting (upperright) human-augmented with no confidence voting result (lowerleft) and the confidence voting result with human augmenteddataset (bottom right)
3. Experiment ResultsWe ran our software on the dataset that we collected us-
ing the backpack on the third floor of Cory Hall, The test
Figure 4. precision recall curve
3
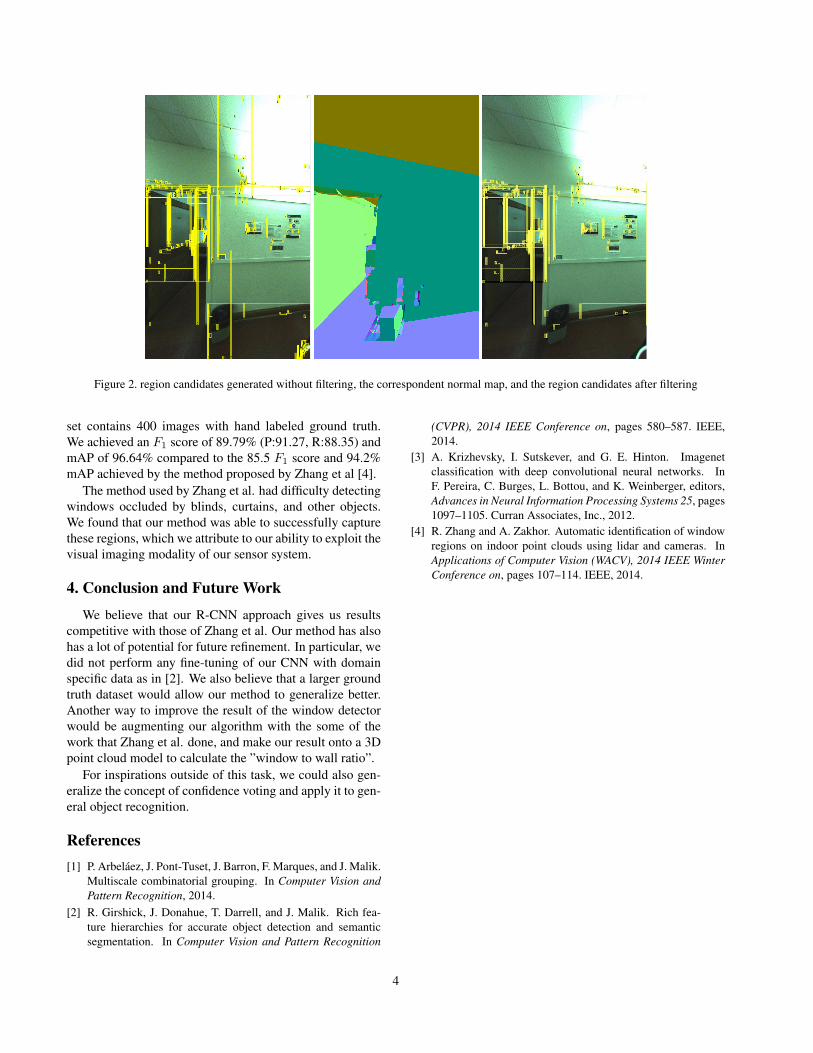
Figure 2. region candidates generated without filtering, the correspondent normal map, and the region candidates after filtering
set contains 400 images with hand labeled ground truth.We achieved an F1 score of 89.79% (P:91.27, R:88.35) andmAP of 96.64% compared to the 85.5 F1 score and 94.2%mAP achieved by the method proposed by Zhang et al [4].
The method used by Zhang et al. had difficulty detectingwindows occluded by blinds, curtains, and other objects.We found that our method was able to successfully capturethese regions, which we attribute to our ability to exploit thevisual imaging modality of our sensor system.
4. Conclusion and Future Work
We believe that our R-CNN approach gives us resultscompetitive with those of Zhang et al. Our method has alsohas a lot of potential for future refinement. In particular, wedid not perform any fine-tuning of our CNN with domainspecific data as in [2]. We also believe that a larger groundtruth dataset would allow our method to generalize better.Another way to improve the result of the window detectorwould be augmenting our algorithm with the some of thework that Zhang et al. done, and make our result onto a 3Dpoint cloud model to calculate the ”window to wall ratio”.
For inspirations outside of this task, we could also gen-eralize the concept of confidence voting and apply it to gen-eral object recognition.
References[1] P. Arbelaez, J. Pont-Tuset, J. Barron, F. Marques, and J. Malik.
Multiscale combinatorial grouping. In Computer Vision andPattern Recognition, 2014.
[2] R. Girshick, J. Donahue, T. Darrell, and J. Malik. Rich fea-ture hierarchies for accurate object detection and semanticsegmentation. In Computer Vision and Pattern Recognition
(CVPR), 2014 IEEE Conference on, pages 580–587. IEEE,2014.
[3] A. Krizhevsky, I. Sutskever, and G. E. Hinton. Imagenetclassification with deep convolutional neural networks. InF. Pereira, C. Burges, L. Bottou, and K. Weinberger, editors,Advances in Neural Information Processing Systems 25, pages1097–1105. Curran Associates, Inc., 2012.
[4] R. Zhang and A. Zakhor. Automatic identification of windowregions on indoor point clouds using lidar and cameras. InApplications of Computer Vision (WACV), 2014 IEEE WinterConference on, pages 107–114. IEEE, 2014.
4