automatic deformation analysis by a tv speckle interferometer using a laser diode
TRANSCRIPT

Automatic deformation analysis by aTV speckle interferometer using a laser diode
Jun-ichi Kato, Ichirou Yamaguchi, and Qi Ping
A phase-shifting TV speckle interferometer is developed by using the frequency modulation capability of alaser diode and is applied to automatic deformation measurements. Temperature modulation is used forgenerating the frequency shift of a laser diode. We store four speckle interferograms with relative phasedifferences of rr/2 in a frame grabber by monitoring a phase-shift signal, which is obtained by integratingthe fringe intensity over a local window. The optimum size of the local window is examinedexperimentally. Then, the optimum processing conditions for reducing the speckle noise in interfero-grams, including an averaging window size, are found. Experimental results of the automaticdeformation analysis indicate a displacement accuracy of better than X/30.
Key words: Electronic speckle pattern interferometry, interferometry, laser diode, frequency modula-tion, deformation measurement.
Introduction
Holographic interferometry and speckle interferome-try have generally been used for measuring displace-ment or amplitude distributions of rough surfaceswith high sensitivity.1 Most of these methods re-quire photographic recording that includes a develop-ment process, preventing real-time measurements.In speckle interferometry, however, an interferencepattern can be formed by electronic storage andprocessing of video images recorded with a normal TVcamera, because the speckle size can be adjusted byan aperture size of the imaging system. This tech-nique, called electronic speckle pattern interferome-try or TV speckle interferometry, can generate fringepatterns in real time with the same sensitivity asholographic interferometry.
For automatic analysis of these fringe images, thephase-shifting method has been applied mainly todelivery of the accurate phase distribution from atleast three phase-shifted fringe patterns. 2 In manycases these phase-shifted patterns are obtained byshifting the phase of the reference wave with apiezoelectric transducer driven mirror3'4 or polariza-
J. Kato and I. Yamaguchi are with the Optical EngineeringLaboratory, The Institute of Physical and Chemical Research, 2-1Hirosawa, Wako-shi, Saitama 351-01, Japan; Q. Ping is with theDepartment of Optical Engineering, Xian Institute of Optics andFine Mechanics, P.O. Box 80, Shanxi, China.
Received 23 September 1991.0003-6935/93/010077-07$05.00/0.© 1993 Optical Society of America.
tion control.5 In these methods, the driving voltagefor the piezoelectric transducer or the rotating angleof a polarizer must be calibrated in advance, and it isalso necessary to maintain the accurate alignment ofthe optical system. Thus the complexity of theoptical systems will cause problems in practical appli-cations.
In this paper we propose a TV speckle phase-shifting interferometer in which a laser diode (LD) isused as the light source with its frequency modula-tion capability. Although applications of LD fre-quency modulation to phase-shifting interferometry,including holographic interferometry have alreadybeen reported,6 -8 its application to speckle interferom-etry cannot yet be found. One of the reasons for thismight be its low temporal coherence and its lowfrequency stability against change in ambient temper-ature. However, because of recent improvements inthe temperature control technique of a LD, thefrequency modulation method has become availableas a practical phase-shifting tool in TV speckle inter-ferometry. When this method is used, the opticalsystem becomes compact and simple because theother phase-shifting tools are not necessary.
Principle and Apparatus
Phase-Shifting by Frequency Modulation
The phase-shifting technique uses intensity modula-tions at each pixel, which are introduced by shiftingthe phase difference of the interferometer with aconstant step. With this technique, we can accu-
1 January 1993 / Vol. 32, No. 1 / APPLIED OPTICS 77

rately derive the phase distribution, even in thepresence of inhomogeneity in the background inten-sity distribution.9
If an object is deformed in the out-of-plane direc-tion by a,(x, y), to yield the intensity distributions ofspeckle patterns before and after the deformation Iaand b, we can express the observed interferencepattern as a spatial average (I) of speckle intensityover an area that contains many speckles, that is,
Ji(x, y) = ((Ia - Ib)2)
= (I)2{1 + _Y cos - az(x,y) + 4o + A(i , (1)
where y is a constant that depends on the speckle sizeand the in-plane displacement, A4i (i = 1, 2, 3, 4) isthe introduced phase shift, and normal incidence onthe object surface is assumed here.' By using thefour phase-shifted fringes, J 1 , J 2 , J 3 , J 4 , with aninterval of rr/2 rad each from an initial phase 4O, wecan derive the displacement as
a.(X,y A 4T[tan J J k (2)
We introduced the phase shift of interference fringesby modulating the wavelength of a light source in thiscase. One can shift the wavelength of a LD bymodulating its injection current or ambient tempera-ture, and this characteristic can be applied to phase-shifting interferometry. 7 The phase shift caused bythe wavelength shift from to + AX is alsoproportional to the optical path difference of interfer-ometer D:
AX+ -2' r- D. (3)
In other words, the phase shift of fringes depends onthe distance of an object, which is not generallyconstant. Therefore it cannot be uniquely decidedonly by the wavelength shift AX. To avoid thisdifficulty we detected the local intensity of interfer-ence fringes through a fixed window as a phase-shiftsignal, where the intensity changes sinusoidally forthe LD wavelength shifts as shown in Fig. 1. Wemonitored this signal to decide the storage time of thephase-shifted fringe patterns.
In our research, the wavelength shift was realizedby changing the input voltage of a temperaturecontroller (a Peltier device) attached to the LD pack-age, because the injection current change causes thelarge alternating bias intensity of the interferogramsand undesirable mode hopping. The alternation ofintensity by temperature change can be suppressedby controlling the LD current independently and doesnot violate the assumption of a constant intensity ofspeckle interferograms for phase-extraction algo-rithms.
Applied Voltagefor a Temperature Controller
Wavelength Shiftof a laser diode
aA l' A'a
F P t t
Fringe Position Shift
ca Area
Integrator
Speckle Interferogram Phase Shift Signal
Cs4-
v)2 3-
: 2v)= 1
Pn
2 4 6 8Time (s)
10 12
Fig. 1. Principle of the phase-shift method using the temperaturemodulation of a LD. The intensity of the interferogram wasaveraged over a small local window for the detection of shiftedphase.
TV Speckle Interferometer
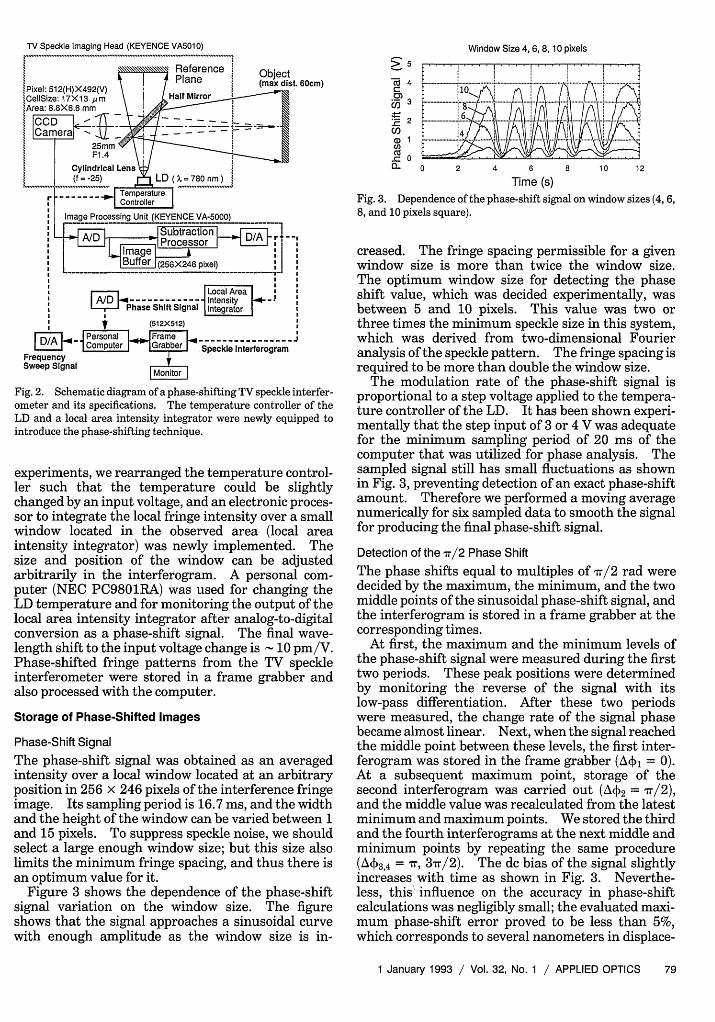
We reconditioned a commercial TV speckle interferom-eter, using a LD that was developed by Keyence, Ltd.,Osaka, Japan. The original system consisted of aninterferometer head (VA-5010) and an image-process-ing unit (VA-5000). A schematic of the recondi-tioned TV speckle interferometer is shown in Fig. 2.
The light emitted from a laser diode (Sharp LT021:X = 0.78 [lm, 12 mW) was corrected to a circularbeam by a cylindrical lens and divided by a half-mirror into two beams. Each beam was diffuselyreflected by a reference surface inside the interferom-eter head and by object. The reflected lights werecoherently combined at an imaging device surface(two-dimensional CCD: 510 H x 492 V) to form aspeckle pattern. An initial pattern was first storedin an image buffer in the processing unit. Afterdeformation, the stored pattern was subtracted fromthe input patterns, and the squared difference wasdisplayed on a video monitor as real-time fringes.The fringes represent the contour lines of change inthe path difference of the interferometer caused byout-of-plane deformation of the object with a sensitiv-ity of X/2. The stored initial image can be refreshedby an outer control signal so that a large amount ofdeformation can be continuously tracked.
We mounted the LD utilized in this system upon aPeltier device to stabilize its temperature and main-tain the best mode condition. We stabilized theoutput power of the laser diode by using an automaticpower controller circuit. For the purpose of our
78 APPLIED OPTICS / Vol. 32, No. 1 / 1 January 1993
4-1- ---.________ I -
-- i 1 - - --:. _ yzLzK-
TV Speckle Imaging Head (KEYENCE VA5010)
Reference Object
Pixel: 512(H)X492(V) Plane (max dist. 60cm)CellSize: 17X13 jum Half MirrorArea: 8.8X6.6 mm
Cylindrical Lens(f = -25) ^ D(X=780 nm )
r .____---_Tem peraturel ~~~Controllerl Image Processing Unit (KEYENCE VA-5000)
l _ --Pearl~~~~~~~~----a I~~~~ubtraction D/A~~~~~*
Local AreaE* I~~~~~~~~~ntensiy .E*E Phas Shift Signal ntegrator
X t ~~~~(512X512) IA I |Personal FrameLB- J Computer _Grabber Speckle Interferogram
FrequencySweep Signal Mnt
Fig. 2. Schematic diagram of a phase-shifting TV speckle interfer-ometer and its specifications. The temperature controller of theLD and a local area intensity integrator were newly equipped tointroduce the phase-shifting technique.
experiments, we rearranged the temperature control-ler such that the temperature could be slightlychanged by an input voltage, and an electronic proces-sor to integrate the local fringe intensity over a smallwindow located in the observed area (local areaintensity integrator) was newly implemented. Thesize and position of the window can be adjustedarbitrarily in the interferogram. A personal com-puter (NEC PC9801RA) was used for changing theLD temperature and for monitoring the output of thelocal area intensity integrator after analog-to-digitalconversion as a phase-shift signal. The final wave-length shift to the input voltage change is 10 pm/V.Phase-shifted fringe patterns from the TV speckleinterferometer were stored in a frame grabber andalso processed with the computer.
Storage of Phase-Shifted Images
Phase-Shift Signal
The phase-shift signal was obtained as an averagedintensity over a local window located at an arbitraryposition in 256 x 246 pixels of the interference fringeimage. Its sampling period is 16.7 ms, and the widthand the height of the window can be varied between 1and 15 pixels. To suppress speckle noise, we shouldselect a large enough window size; but this size alsolimits the minimum fringe spacing, and thus there isan optimum value for it.
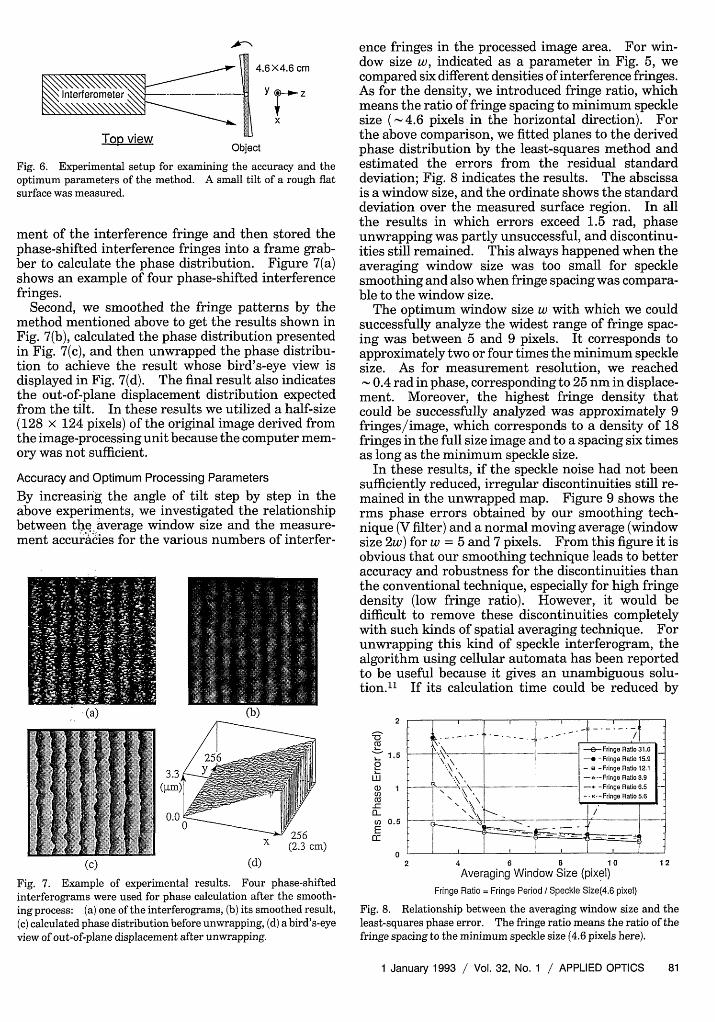
Figure 3 shows the dependence of the phase-shiftsignal variation on the window size. The figureshows that the signal approaches a sinusoidal curvewith enough amplitude as the window size is in-
5 sCit 4c,)j3- 2
C/)U)
CZ=0~n
Window Size 4, 6, 8, 10 pixels
. .. . ... ,.,. .... ,.,.,...I .. . . . . . . .
Of~~~~~~~~~~........ A....
0 2 4 6
Time (s)8 10 12
Fig. 3. Dependence of the phase-shift signal on window sizes (4, 6,8, and 10 pixels square).
creased. The fringe spacing permissible for a givenwindow size is more than twice the window size.The optimum window size for detecting the phaseshift value, which was decided experimentally, wasbetween 5 and 10 pixels. This value was two orthree times the minimum speckle size in this system,which was derived from two-dimensional Fourieranalysis of the speckle pattern. The fringe spacing isrequired to be more than double the window size.
The modulation rate of the phase-shift signal isproportional to a step voltage applied to the tempera-ture controller of the LD. It has been shown experi-mentally that the step input of 3 or 4 V was adequatefor the minimum sampling period of 20 ms of thecomputer that was utilized for phase analysis. Thesampled signal still has small fluctuations as shownin Fig. 3, preventing detection of an exact phase-shiftamount. Therefore we performed a moving averagenumerically for six sampled data to smooth the signalfor producing the final phase-shift signal.
Detection of the 7r/2 Phase Shift
The phase shifts equal to multiples of 7r/2 rad weredecided by the maximum, the minimum, and the twomiddle points of the sinusoidal phase-shift signal, andthe interferogram is stored in a frame grabber at thecorresponding times.
At first, the maximum and the minimum levels ofthe phase-shift signal were measured during the firsttwo periods. These peak positions were determinedby monitoring the reverse of the signal with itslow-pass differentiation. After these two periodswere measured, the change rate of the signal phasebecame almost linear. Next, when the signal reachedthe middle point between these levels, the first inter-ferogram was stored in the frame grabber (v, = 0).At a subsequent maximum point, storage of thesecond interferogram was carried out ( 2 = w/2),and the middle value was recalculated from the latestminimum and maximum points. We stored the thirdand the fourth interferograms at the next middle andminimum points by repeating the same procedure(43,4 = rr, 3rr/2). The dc bias of the signal slightlyincreases with time as shown in Fig. 3. Neverthe-less, this' influence on the accuracy in phase-shiftcalculations was negligibly small; the evaluated maxi-mum phase-shift error proved to be less than 5%,which corresponds to several nanometers in displace-
1 January 1993 / Vol. 32, No. 1 / APPLIED OPTICS 79

ment. Figure 4 shows four phase-shifted interfero-grams plus an example of the phase-shift signaldisplayed on the computer, where the circles indicatethe timing of the image storage.
Our phase-shift detection method has two mainadvantages: (1) no need for preliminary calibrationof the phase-shifting device and (2) the independenceof object distance. For three-dimensional objects,although the second advantage is violated we canneglect this effect if object depth is small comparedwith the path difference of the interferometer.
Image Processing Algorithms
Speckle SmoothingIt is generally difficult to obtain a smooth phasedistribution from the phase-shifted speckle interfero-grams in Eq. (2) directly. Therefore important stepsare both speckle smoothing and phase unwrapping toconnect discontinuous phase jumps of 2rr rad. Sincethe fine speckle structure of the interferogram isbarely changed by the wavelength shift, the regionsalmost covered with dark speckles always remaindark for all the phase-shifted interferograms.Hence the regions carry no information on fringephase. That the regions where the speckle size islarge enough to make the intensity distribution com-parably uniform in averaging windows are a goodrepresentation of smoothed interferograms. Thusthe local variance of the interferogram could beeffective in the smoothing procedure as a weightingparameter.
Taking the above situations into account, weadopted the following tactics in interferogram process-ing with a special averaging window as shown in Fig.5:
(1) Exclude all the unmodulated pixels, whoseintensity change remains lower than a fixed level forall four phase-shifted interferograms, from the phasecalculation.
(2) Carry out special averaging with the weight-ing inversely proportional to the variances of speckleintensity over the surrounding four subsidiary averag-
.0U)._-
Us I l /I 'U)
Fig. 4. Examples of four phase-shifted interferograms (upper)stored by using a phase-shift signal (lower) displayed on thecomputer. The storage in a frame grabber was conducted at thetimes marked by circles.
pi /Li21 ___A_
63 94M3 _ 14
W
Averaging Method UsingIntensity Variances in theAveraging Windows
Ci : Intensity Variance
,-Ii : Intensity Average
W : Window Size (Pixel)
4
4 (Ia -aiz)
j=1
Fig. 5. Smoothing method for speckle noise reduction by usingintensity variances in the averaging windows (V filter). The valueat the central pixel was determined by the equation shown in thefigure.
ing windows. This technique is a modified version ofvariance filtering (V filter).'0
Median filtering was also performed after thesmoothing to suppress the high frequency noisegenerated by step (2). In the smoothing procedurethe averaging window size must be much larger thanthe minimum speckle size, while the maximum size islimited by fringe spacing as well as by the size of thelocal window that was used for the phase-shift signal.
Phase UnwrappingApplying Eq. (2) to the phase-shifted interferogramsafter the smoothing process, we obtained a phasedistribution between -r and r rad at each pixel.When the deformation exceeds this range, we mustapply phase unwrapping to connect the discontinuousphase jump of 2 ,r rad.
The phase unwrapping procedure along an x coordi-nate is given by the following algorithm:
f(m + 1) + 2r (m + 1) - (m) r4'( ) |+(m + 1) -2r (+(m + 1) -+m < -r '
(4)
where m is the pixel position in the x direction and¢(m + 1) and (m) are the phase values at adjacentpixels. The same procedure was repeated along theydirection for two-dimensional unwrapping.
Experimental Results and Considerations
Measurement of the Small Tilt
First, to examine the accuracy of the above method,we measured a small tilt of a rough flat surface.Figure 6 indicates the experimental arrangement.The object is an aluminum plate covered with apowder of MgO2. An initial image was stored in theimage buffer before displacement. As soon as asmall tilt was produced by a stepping motor, parallelinterference fringes of constant spacing appearedalong the axis of the tilt. First we changed thereference voltage to the temperature controller of aLD by 4 V. Then we monitored by computer thechange of the phase-shift signal caused by the move-
80 APPLIED OPTICS / Vol. 32, No. 1 / 1 January 1993
(0) (7c/2) (70 (37C/2)4
, 1
I-;E'
T;__
4.6X4.6 cm
Interferometer % ._. ._ Y z
Top viewObject
Fig. 6. Experimental setup for examining the accuracy and theoptimum parameters of the method. A small tilt of a rough flatsurface was measured.
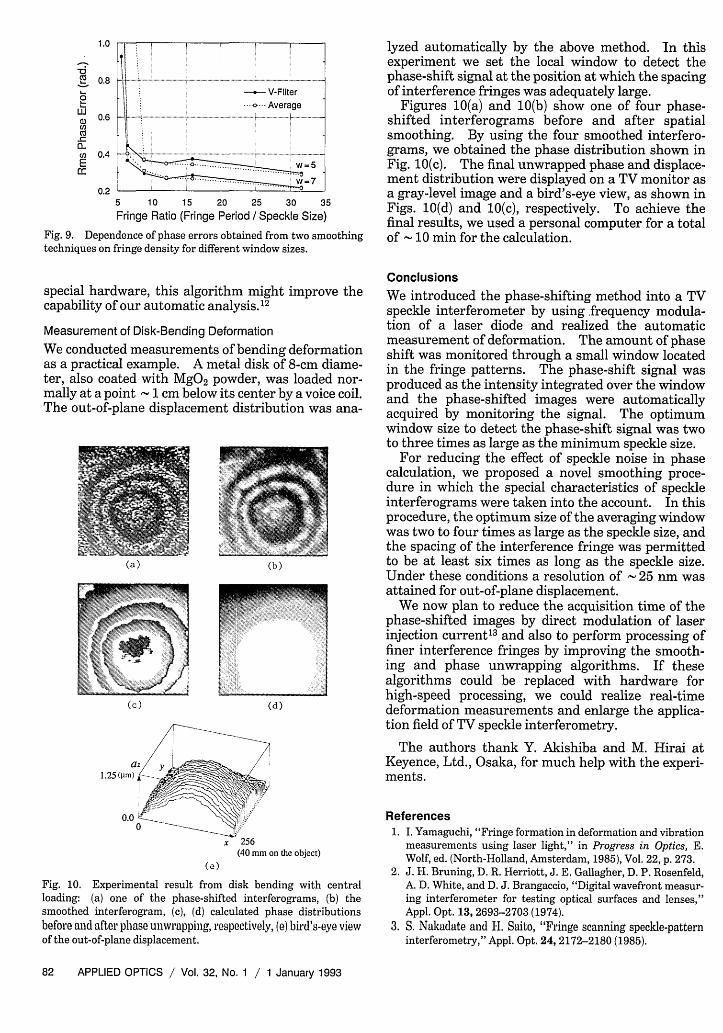
ment of the interference fringe and then stored thephase-shifted interference fringes into a frame grab-ber to calculate the phase distribution. Figure 7(a)shows an example of four phase-shifted interferencefringes.
Second, we smoothed the fringe patterns by themethod mentioned above to get the results shown inFig. 7(b), calculated the phase distribution presentedin Fig. 7(c), and then unwrapped the phase distribu-tion to achieve the result whose bird's-eye view isdisplayed in Fig. 7(d). The final result also indicatesthe out-of-plane displacement distribution expectedfrom the tilt. In these results we utilized a half-size(128 x 124 pixels) of the original image derived fromthe image-processing unit because the computer mem-ory was not sufficient.
Accuracy and Optimum Processing Parameters
By increasing the angle of tilt step by step in theabove experiments, we investigated the relationshipbetween the average window size and the measure-ment accuracies for the various numbers of interfer-
(a) (b)
~~~~.1~ ~ ~ ~ .
( (2.3 cm)
(c) (d)
Fig. 7. Example of experimental results. Four phase-shiftedinterferograms were used for phase calculation after the smooth-ing process: (a) one of the interferograms, (b) its smoothed result,(c) calculated phase distribution before unwrapping, (d) a bird's-eyeview of out-of-plane displacement after unwrapping.
ence fringes in the processed image area. For win-dow size w, indicated as a parameter in Fig. 5, wecompared six different densities of interference fringes.As for the density, we introduced fringe ratio, whichmeans the ratio of fringe spacing to minimum specklesize (- 4.6 pixels in the horizontal direction). Forthe above comparison, we fitted planes to the derivedphase distribution by the least-squares method andestimated the errors from the residual standarddeviation; Fig. 8 indicates the results. The abscissais a window size, and the ordinate shows the standarddeviation over the measured surface region. In allthe results in which errors exceed 1.5 rad, phaseunwrapping was partly unsuccessful, and discontinu-ities still remained. This always happened when theaveraging window size was too small for specklesmoothing and also when fringe spacing was compara-ble to the window size.
The optimum window size w with which we couldsuccessfully analyze the widest range of fringe spac-ing was between 5 and 9 pixels. It corresponds toapproximately two or four times the minimum specklesize. As for measurement resolution, we reached
0.4 rad in phase, corresponding to 25 nm in displace-ment. Moreover, the highest fringe density thatcould be successfully analyzed was approximately 9fringes/image, which corresponds to a density of 18fringes in the full size image and to a spacing six timesas long as the minimum speckle size.
In these results, if the speckle noise had not beensufficiently reduced, irregular discontinuities still re-mained in the unwrapped map. Figure 9 shows therms phase errors obtained by our smoothing tech-nique (V filter) and a normal moving average (windowsize 2w) for w = 5 and 7 pixels. From this figure it isobvious that our smoothing technique leads to betteraccuracy and robustness for the discontinuities thanthe conventional technique, especially for high fringedensity (low fringe ratio). However, it would bedifficult to remove these discontinuities completelywith such kinds of spatial averaging technique. Forunwrapping this kind of speckle interferogram, thealgorithm using cellular automata has been reportedto be useful because it gives an unambiguous solu-tion.11 If its calculation time could be reduced by
2
cc1.50 .
LUa) 1u)co
uo 0.5
EE
02 4 10 12
Averaging Window Size (pixel)
Fringe Ratio = Fringe Period / Speckle Size(4.6 pixel)
Fig. 8. Relationship between the averaging window size and theleast-squares phase error. The fringe ratio means the ratio of thefringe spacing to the minimum speckle size (4.6 pixels here).
1 January 1993 / Vol. 32, No. 1 / APPLIED OPTICS 81
'N, -. -e-~~~~~~~Fge Ratio 31.6 -. ... ...... ..i . l... ....... ..... ... ....... ... . ......... ........ ... . eFig ai3 ........... -. | -Fringo Ratio 15.9
' -> a j -e -Fringe Ratio 12.1
\ \\ |l -a--Fringe Ratio 8.9_._.........~~~~~~~.. . hi...S................................... .................. .................. ..... ........ ..... Fringe R atio 6.5 ...... ._
. \ \ .-.-- -Fring Ratio 65E \ \ \ --- Finge Ratio 5.6
I -I.. ... -- .
1.0
0
a)U)
CL
Ecc
0.8
0.6
0.4
0.2
.... ....... . w = 7. ...... Iw = 5I 1 , I
5 10 15 20 25 30 35Fringe Ratio (Fringe Period / Speckle Size)
Fig. 9. Dependence of phase errors obtained from two smoothingtechniques on fringe density for different window sizes.
special hardware, this algorithm might improve thecapability of our automatic analysis.'2
Measurement of Disk-Bending Deformation
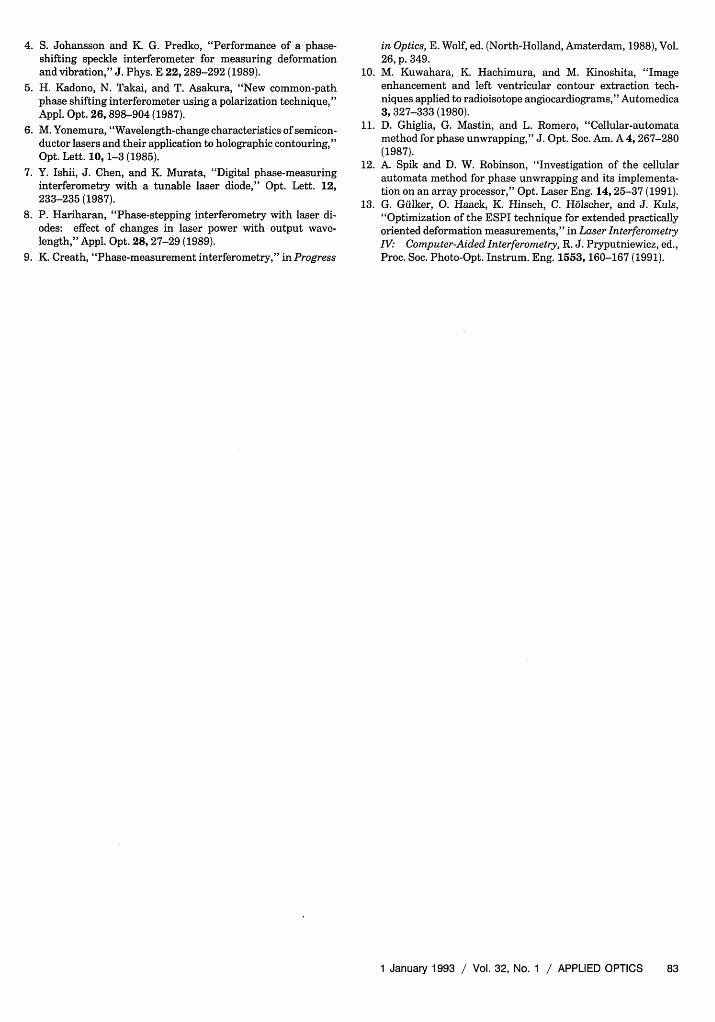
We conducted measurements of bending deformationas a practical example. A metal disk of 8-cm diame-ter, also coated with MgO2 powder, was loaded nor-mally at a point 1 cm below its center by a voice coil.The out-of-plane displacement distribution was ana-
(a) (b)
(c)
1.25 (pill)
0.0
x 256(40 mm on the object)
(e)
Fig. 10. Experimental result from disk bending with centralloading: (a) one of the phase-shifted interferograms, (b) thesmoothed interferogram, (c), (d) calculated phase distributionsbefore and after phase unwrapping, respectively, (e) bird's-eye viewof the out-of-plane displacement.
lyzed automatically by the above method. In thisexperiment we set the local window to detect thephase-shift signal at the position at which the spacingof interference fringes was adequately large.
Figures 10(a) and 10(b) show one of four phase-shifted interferograms before and after spatialsmoothing. By using the four smoothed interfero-grams, we obtained the phase distribution shown inFig. 10(c). The final unwrapped phase and displace-ment distribution were displayed on a TV monitor asa gray-level image and a bird's-eye view, as shown inFigs. 10(d) and 10(c), respectively. To achieve thefinal results, we used a personal computer for a totalof 10 min for the calculation.
Conclusions
We introduced the phase-shifting method into a TVspeckle interferometer by using frequency modula-tion of a laser diode and realized the automaticmeasurement of deformation. The amount of phaseshift was monitored through a small window locatedin the fringe patterns. The phase-shift signal wasproduced as the intensity integrated over the windowand the phase-shifted images were automaticallyacquired by monitoring the signal. The optimumwindow size to detect the phase-shift signal was twoto three times as large as the minimum speckle size.
For reducing the effect of speckle noise in phasecalculation, we proposed a novel smoothing proce-dure in which the special characteristics of speckleinterferograms were taken into the account. In thisprocedure, the optimum size of the averaging windowwas two to four times as large as the speckle size, andthe spacing of the interference fringe was permittedto be at least six times as long as the speckle size.Under these conditions a resolution of 25 nm wasattained for out-of-plane displacement.
We now plan to reduce the acquisition time of thephase-shifted images by direct modulation of laserinjection current13 and also to perform processing offiner interference fringes by improving the smooth-ing and phase unwrapping algorithms. If thesealgorithms could be replaced with hardware forhigh-speed processing, we could realize real-timedeformation measurements and enlarge the applica-tion field of TV speckle interferometry.
The authors thank Y. Akishiba and M. Hirai atKeyence, Ltd., Osaka, for much help with the experi-ments.
References1. I. Yamaguchi, "Fringe formation in deformation and vibration
measurements using laser light," in Progress in Optics, E.Wolf, ed. (North-Holland, Amsterdam, 1985), Vol. 22, p. 273.
2. J. H. Bruning, D. R. Herriott, J. E. Gallagher, D. P. Rosenfeld,A. D. White, and D. J. Brangaccio, "Digital wavefront measur-ing interferometer for testing optical surfaces and lenses,"Appl. Opt. 13, 2693-2703 (1974).
3. S. Nakadate and I-I. Saito, "Fringe scanning speckle-patterninterferometry," Appl. Opt. 24, 2172-2180 (1985).
82 APPLIED OPTICS / Vol. 32, No. 1 / 1 January 1993
V FilterAverage
..W;.......................................... ............................ ............................................................................
II
4. S. Johansson and K. G. Predko, "Performance of a phase-shifting speckle interferometer for measuring deformationand vibration," J. Phys. E 22, 289-292 (1989).
5. H. Kadono, N. Takai, and T. Asakura, "New common-pathphase shifting interferometer using a polarization technique,"Appl. Opt. 26, 898-904 (1987).
6. M. Yonemura, "Wavelength-change characteristics of semicon-ductor lasers and their application to holographic contouring,"Opt. Lett. 10, 1-3 (1985).
7. Y. Ishii, J. Chen, and K. Murata, "Digital phase-measuringinterferometry with a tunable laser diode," Opt. Lett. 12,233-235 (1987).
8. P. Hariharan, "Phase-stepping interferometry with laser di-odes: effect of changes in laser power with output wave-length," Appl. Opt. 28, 27-29 (1989).
9. K. Creath, "Phase-measurement interferometry," in Progress
in Optics, E. Wolf, ed. (North-Holland, Amsterdam, 1988), Vol.26, p. 349.
10. M. Kuwahara, K. Hachimura, and M. Kinoshita, "Imageenhancement and left ventricular contour extraction tech-niques applied to radioisotope angiocardiograms," Automedica3, 327-333 (1980).
11. D. Ghiglia, G. Mastin, and L. Romero, "Cellular-automatamethod for phase unwrapping," J. Opt. Soc. Am. A 4,267-280(1987).
12. A. Spik and D. W. Robinson, "Investigation of the cellularautomata method for phase unwrapping and its implementa-tion on an array processor," Opt. Laser Eng. 14,25-37 (1991).
13. G. Gfilker, 0. Haack, K. Hinsch, C. H6lscher, and J. Kuls,"Optimization of the ESPI technique for extended practicallyoriented deformation measurements," in Laser InterferometryIV: Computer-Aided Interferometry, R. J. Pryputniewicz, ed.,Proc. Soc. Photo-Opt. Instrum. Eng. 1553, 160-167 (1991).
1 January 1993 / Vol. 32, No. 1 / APPLIED OPTICS 83