automatic assessment of sight-reading exercises · by the existence of systems such as sight...
TRANSCRIPT

AUTOMATIC ASSESSMENT OF SIGHT-READING EXERCISES
Jiawen HuangCenter for Music Technology
Georgia Institute of TechnologyAtlanta, Georgia
Alexander LerchCenter for Music Technology
Georgia Institute of TechnologyAtlanta, Georgia
ABSTRACT
Sight-reading requires a musician to decode, process, andperform a musical score quasi-instantaneously and withoutrehearsal. Due to the complexity of this task, it is difficultto assess the proficiency of a sight-reading performance,and it is even more challenging to model its human as-sessment. This study aims at evaluating and identifyingeffective features for automatic assessment of sight-readingperformance. The evaluated set of features comprises task-specific, hand-crafted, and interpretable features designedto represent various aspect of sight-reading performancecovering parameters such as intonation, timing, dynamics,and score continuity. The most relevant features are identi-fied by Principal Component Analysis and forward featureselection. For context, the same features are also appliedto the assessment of rehearsed student music performancesand compared across different assessment categories. Theresults show potential of automatic assessment models forsight-reading and the relevancy of different features as wellas the contribution of different feature groups to differentassessment categories.
1. INTRODUCTION
Sight-reading, also known as prima vista, describes thetask of reading and performing an unknown piece of musicfrom its musical score with little or no preparation. It isa challenge to most students who are learning a musicalinstrument.
Sight-reading performance reflects the player’s abilityin different aspects including reading music, applying fin-gering and playing techniques, and interpreting music in arelatively short time. As an important skill for musicians,sight-reading is often part of school curricula as well asauditions for professional orchestras [6]. The assessment ofsight-reading in auditions and teaching environments facesmultiple difficulties. While there are efforts to make humanassessments comparable and “less subjective,” for exampleby using grading rubrics, the fairness of the assessmentcan be impacted by bias effects (gender, ethnicity, general
c© Jiawen Huang, Alexander Lerch. Licensed under a Cre-ative Commons Attribution 4.0 International License (CC BY 4.0). At-tribution: Jiawen Huang, Alexander Lerch. “Automatic Assessment ofSight-reading Exercises”, 20th International Society for Music InformationRetrieval Conference, Delft, The Netherlands, 2019.
appearance, etc.), fatigue effects after hours of listening andassessing, as well as individual preferences and tolerancesfor various error types. An automatic assessment systemcan potentially provide objective, repeatable, and unbiasedassessments. Thus, it could be helpful both as a tool avail-able to judges to inform their decisions as well as a tutoringsystem for students providing feedback in individual prac-tice sessions. It can also help understand the importantperformance parameters of sight-reading assessment andhow they compare to the assessment of general (student)music performances.
In this study, we create a prototype and investigate thefeasibility of a sight-reading assessment system by design-ing interpretable features for the task and evaluating thesystem on a large database of professionally rated record-ings. We also inspect commonalities and differences offeature sets for the assessment of sight-reading vs. preparedperformances of sheet music. More specifically, we per-form feature selection and detailed feature analysis on ascore-aligned hand-crafted feature set, identify the mosteffective features for sight-reading assessment and observethe difference in the assessment ratings of sight-reading anda rehearsed performance.
The paper is structured as follows: the related workon sight-reading assessment is introduced in Sect. 2 andthe evaluated features are presented in Sect. 3. Section 4explains the experiments and discusses the results of thefeature analysis. The final Sect. 5 gives concluding remarksand outlines future work.
2. RELATED WORK
2.1 Sight-reading skills and parameters
Sight-reading involves coordination of auditory, visual, spa-tial, and kinesthetic systems to produce an accurate andmusical performance [11]. In sight-reading exercises, mul-tiple layers of visual information are processed simultane-ously when reading the score while playing the instrument.Besson et al. has demonstrated distinct processing betweenmelodic and rhythmic information [2]. This indicates thatpitch accuracy and rhythmic accuracy can be treated astwo independent assessment categories. Elliott found astrong positive relationship between wind instrumentalists’general sight-reading ability and the ability to sight-readrhythm patterns [5]. This suggests that features containingrhythmic information are important for assessing a sight-

FeatureExtraction
Audio File
Musical Score
JDTW(Alignment)
Score-aligned Features
Pitch
DTW cost
Tempo Variation
Note Matches
Tempo (Local)
Tempo (IOI)
Dynamics
Figure 1. Feature extraction
reading performance. While intonation, rhythm, and tonequality are typical properties to be assessed, in many casesonly an overall rating is given without details on individualproperties [1, 4].
2.2 Automatic assessment
There is only a limited number of publications for the auto-matic assessment of sight-reading. Cheng et al. developeda real-time system for sight-reading evaluation of piano mu-sic [4]. The real-time system transcribes the polyphonic mu-sic and detects wrong notes. Commercial interest is shownby the existence of systems such as Sight Reading Prac-tice and Assessment 1 and SightReadPlus 2 , which aimsat assessing a student playing and tracking the progress ofsight-reading.
The automatic assessment of sight-reading has many sim-ilarities to the assessment of music performance in general.Therefore, we should expect similar features to be relevantfor both tasks and take advantage of the broader spectrumof publications in general performance assessment. Abeßeret al. designed a feature set consisting of 138 features basedon the pitch contour of students’ vocal and instrumental per-formances, applied feature selection and used the selectedfeatures to train a Support Vector Machine (SVM) [1]. Theyfound that features describing the similarity of score andaudio, and the variability of note durations are the mostimpactful features. Fukuda et al. presented a piano tutoringsystem which applied non-negative matrix factorization fortranscription and DTW for audio-to-score alignment [8].They basically use, similar to Cheng et al. [4], the numberof detected mistakes as core information for performanceassessment. Wu et al. proposed assessing a performanceindependent of the musical score using features based onpitch, amplitude, and rhythm histograms [16]. Vidwans etal. extracted a set of pitch, dynamics, and tempo featuresafter aligning the performance to the score with DynamicTime Warping (DTW) [15]. Their work is followed by Gu-rurani et al., who investigated the impact of hand-crafteddescriptors for the assessment of student alto saxophonetechnical exercises by feature selection [9]. The resultsreveal that score-aligned features have a higher correlationwith human assessments than score-independent features.
More recently, deep learning methods have been ap-plied to automatic performance assessment [14]. Although
1 http://standardassessmentofsightreading.com,Last access: 2019/04/10
2 http://mymusicta.com/products, Last access: 2019/04/10
Trai
ning
Test
ing
Feature ExtractionAudio Files
Training (SVR)Regression Model
Feature ExtractionAudio Files
Testing (SVR)
PredictedAssessment
Figure 2. Flow chart of training and testing
deep learning might be a useful tool to achieve better per-formance for the prediction, the current success of suchapproaches is often impeded by the available dataset sizeswhich are often insufficient to train the models properly. Amaybe even more important drawback of deep learning isthat the interpretability is lost in the hidden layers, so thatsystems based on deep learning might not be able to givemeaningful detailed feedback to a student. This is the mainreason why we focus on hand-crafted, knowledge-basedfeatures in this study.
3. FEATURE EXTRACTION
3.1 Overview
The flow chart of feature extraction process is shown inFigure 1. 3 Given a recording of a student’s sight-readingexercise, the pitch contour is extracted by pYIN [12] fromthe audio signal (sample rate 44.1 kHz, window and hop size1024 and 256 samples, respectively). This pitch contour isthen aligned to the score of that piece using a modified DTWalgorithm which we refer to as Jump-enabled DynamicTime Warping (JDTW), a DTW variant which can accountfor repeated score passages. After the alignment, featuresthat capture pitch, rhythmic, and dynamics properties areextracted. The following sections will introduce JDTW, theextracted features, and the inference model.
3.2 Jump-enabled Dynamic Time Warping
Intuitively, we expect the main difference between sight-reading and the performance of a rehearsed piece of music,besides a higher likelihood of errors and more variabilityin tempo, to be in a higher probability of the student stop-ping and restarting from a preceding score position after apause. The frequent occurrence of these jumps has beenverified through informal dataset analysis. As standardalignment approaches such as DTW cannot properly handlesuch jumps, a modification of the DTW algorithm is neces-sary to properly align the audio sight-reading performanceto the score (in our case in MIDI format). Therefore, wepropose a Jump-enabled Dynamic Time Warping (JDTW)which is able to handle these repetitions in the students’sight-reading performance. The approach is inspired by Fre-
3 Source code can be accessed at https://github.com/jhuang448/FBA_code_2019

Figure 3. Illustration of paths of index pairs for a sequenceX of length N = 9 and a sequence Y of length M = 7. Left:original DTW; Right: JDTW.
merey et al.’s jumpDTW [7] but uses different constraintsin terms of potential jump positions and jump lengths.
Dynamic Time Warping (DTW) is a commonly usedpath finding technique based on dynamic programming tofind an optimal alignment between two time series througha pair-wise distance matrix [13]. It has been widely usedin speech recognition and musical information retrieval. Itonly allows sequential alignment, which means that we canneither walk back in a sequence nor jump in time. Giventhe two sequences X := (x1, x2, ...xN ) (audio) of lengthN ∈ N and Y := (y1, y2, ...yM ) (midi) of length M ∈ N,the recursion formula of the accumulated cost matrix D ofthe classical DTW is as follows:
D(n,m) = min{D(n− 1,m− 1), D(n− 1,m),
D(n,m− 1)}+ c(xn, ym) (1)
for 1 < n ≤ N and 1 < m ≤ M ; c(xn, ym) is a measureof distance between xn and ym.
The modified accumulated cost matrix DJ for JDTWintroduces an additional cost term J(n,m) as follows:
DJ(n,m) = min{DJ(n− 1,m− 1), DJ(n− 1,m),
DJ(n,m− 1), J(n,m)}+ c(xn, ym) (2)
in which J(n,m) is the minimum accumulated cost for apath jumping to point (n,m):
J(n,m) ={mini≤I{DJ(n− 1,m+ i) + p}, pause before n
∞, otherwise(3)
for 1 < n ≤ N and 1 < m ≤ M , where I is the largestdistance in notes allowed for a jump and p is the penalty forjumps. Figure 3 illustrates the paths of the original DTWand the JDTW for an example.
3.2.1 Parametrization and implementation
The adjustment of two JDTW parameters is essential: I ,the maximum length of a jump in notes, and p, the penaltyof the jump itself. The parametrization with the lowestaccumulated cost is found empirically from a simulatedvalidation set of 120 synthesized sound files, leading tothe values of I = 3 and p = 3 · mean(C), in which Cis the cost matrix between X and Y (meaning that the
Index Group Description
1–8 PitchMean and std of pitch dev.(mean, std, max, min)
9–11 DTW costCost of whole path, jumpedpath and correct path
12–14 Tempo var.Slope dev., number anddistance of jumps
15–16 NIR, NDR% of silence inserted% of short notes
17–18 Tempo (local)Inversed tempo per note(mean, std)
19–24 Tempo (IOI)
Crest, bin resolution,skewness, kurtosis,roll-off, power ratio ofthe IOI histogram
25–32 Dynamicsamplitude envelope andamplitude spikes(mean, std, max, min)
Table 1. Overview of extracted features.
penalty depends on the average cost).All other DTW-relatedparametrizations follow standard settings.
Two details are noteworthy in the context of the currentimplementation: (i) after obtaining the pitch contour fromthe audio and before computing the alignment, silent framesare temporarily removed from both pitch contour and MIDIsequence, and (ii) the distance between pitch contour xn
and MIDI pitch ym is computed after tuning frequencyadjustment as the octave-independent wrapped distance toeliminate pYin’s frequent octave errors, however, a smallpenalty of 1 is added for distances equal or higher than 12to account for possible octave jumps in the score. Aftersuccessful application of JDTW, each audio frame is alignedto a note in the MIDI sequence.
3.3 Feature set
The evaluated feature set can be divided into seven cate-gories: pitch, DTW cost, tempo variation (DTW-based),note matches, tempo (local), tempo (Inter-Onset-Interval-based), and dynamics. Table 1 lists all 32 features explainedbelow with their feature indices.• Pitch (d = 8): For each note, the mean and the
standard deviation of the pitch deviation from theMIDI pitch is computed. Then, these features areaggregated over the whole performance using mean,standard deviation, maximum, and minimum of eachseries. The resulting eight features are used to captureintonation accuracy.
• DTW cost (d = 3): As a result of the alignment, wecan compute three cost metrics from the path. Thefirst one is the overall cost of the whole JDTW path.The second cost is the cost of the discarded parts, i.e.,the accumulated cost of all the repeated parts exceptthe last run. The third cost is the overall cost of thepath ignoring these discarded parts. These three costfeatures are normalized by the length of the overall

5 10 15 20 25 30Feature Index
5
10
15
20
25
30
Feat
ure
Inde
x
0.2
0.4
0.6
0.8
1.0
Figure 4. The covariance matrix among features.
path, and are a measure of pitch similarity betweenthe two sequences.
• Tempo variation (DTW-based) (d = 3): In addi-tion to the cost-based features, additional featurescan be extracted from the alignment path. We ex-tract the deviation of the path slope from the diagonalof the matrix, the number of jumps, and the totalaccumulated distance of jumps.
• Note matches (d = 2): The Note Insertion Ratio(NIR) is a feature representing additional notes inthe student performance, and the Note Deletion Ra-tio (NDR) represents the missing notes in the per-formance. As the alignment is performed on pitchcontour after removing all the silent frames, theseframe have to be inserted back. It is possible that anote is split into multiple notes and that very short(less than 3 frames) notes occur. The NIR is the dura-tion ratio of the inserted silence to the total durationof pitched region. The NDR is the duration ratio ofvery short notes to the duration of pitched region.• Tempo (local) (d = 2): The mean and the standard
deviation of the inverse of the tempo per note is anestimate of the overall (inverse) tempo and its vari-ability. For example, an eighth note lasting 1 s resultsin an inverse local tempo of 8 notes
1 s .• Tempo (IOI-based) (d = 6): From the histogram of
Inter-Onset-Intervals, the crest factor, bin resolution,skewness, kurtosis, roll-off, and the peak power ratio(ratio of the sum of the peak values to the sum ofall histogram values) are extracted. These featuresdescribe general tempo characteristics.
• Dynamics (d = 8): For every note, the standard de-viation of the envelope as well as amplitude spikes(number of sharp amplitude changes within a note)is computed. Similar to the pitch features, the mean,standard deviation, maximum, and minimum are ag-gregated over all notes. The resulting eight featuresare used to capture the dynamic properties of theperformance.
4. METHODOLOGY
Our assessment system follows a general machine learningsetup as visualized in Figure 2. Our evaluation aims atnot only investigating the general feasibility of assessing
0 5 10 15 20 25 30Component Index
0.00
0.05
0.10
0.15
0.20
0.25
Exp
lain
ed V
aria
nce
Figure 5. Explained variance for each principle component.
sight-reading automatically, but also an analysis of whichfeatures are most relevant. Furthermore, a general musicperformance assessment is compared with sight-readingassessment in order to identify similarities and differencesbetween the two tasks.
This section first introduces the dataset used. Then, fea-ture analysis is performed with Principal Component Anal-ysis and forward feature selection. Finally, the performanceand features of sight-reading assessment and general musicperformance assessment is studied.
4.1 Dataset
The dataset used for this study is provided by the FloridaBandmasters Association (FBA). It consists of audio record-ings of Florida All-State auditions of middle and highschool students in the three years 2013, 2014, and 2015.Each recording consists of exercises such as etudes, scales,and sight reading and provides one expert assessments perexercise in four categories: musicality, note accuracy, rhyth-mic accuracy, and tone quality. For this study we focus onthe first three categories. Only a subset of this dataset isused: we are focusing on the sight-reading exercise playedby middle school student performers for the instrument AltoSaxophone. The recordings of technical exercise are usedto compare sight-reading assessment with the assessmentof prepared and rehearsed performances. There are a totalof 391 students’ audition recordings in the 3 years. Eachrecording contains technical exercise, sight-reading exer-cise, and other sections. The total lengths of technical andsight-reading exercise recordings are 192 minutes and 344minutes, respectively. As the rating scales differ over yearsand categories (most of the ratings are given within 0–10,others have the ranges 0–5, 0–15, and 0–20), they are alllinearly mapped to our target range [0, 1].
The musical score of the sight-reading exercise has beentranscribed manually after reviewing multiple highly-ratedperformances from the three years.
4.2 Principal Component Analysis
Principal Components Analysis is a method to linearly trans-form a set of possibly correlated variables into a set of uncor-related variables (components). For the presented analysis,we will use both the covariance matrix of the features andthe PCA loading matrix.
5 10 15 20 25 30Feature Index
1st Comp
2nd Comp
3rd Comp
4th Comp
5th Comp
0.0
0.1
0.2
0.3
0.4
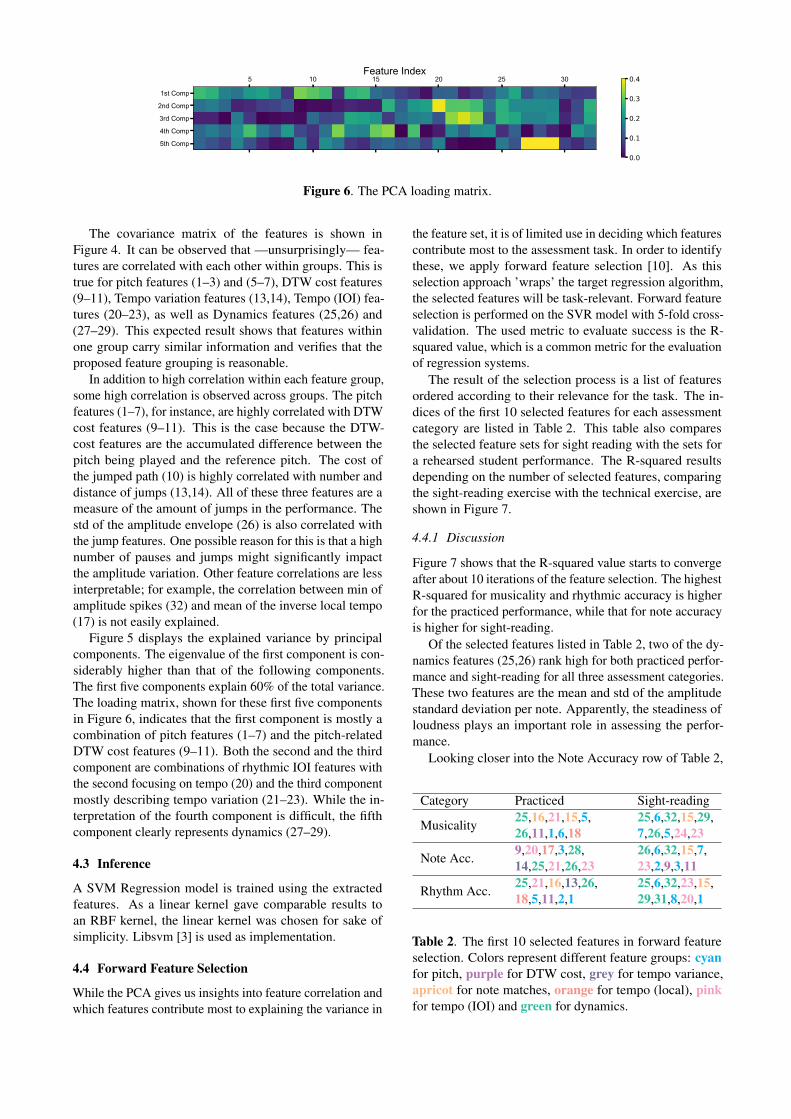
Figure 6. The PCA loading matrix.
The covariance matrix of the features is shown inFigure 4. It can be observed that —unsurprisingly— fea-tures are correlated with each other within groups. This istrue for pitch features (1–3) and (5–7), DTW cost features(9–11), Tempo variation features (13,14), Tempo (IOI) fea-tures (20–23), as well as Dynamics features (25,26) and(27–29). This expected result shows that features withinone group carry similar information and verifies that theproposed feature grouping is reasonable.
In addition to high correlation within each feature group,some high correlation is observed across groups. The pitchfeatures (1–7), for instance, are highly correlated with DTWcost features (9–11). This is the case because the DTW-cost features are the accumulated difference between thepitch being played and the reference pitch. The cost ofthe jumped path (10) is highly correlated with number anddistance of jumps (13,14). All of these three features are ameasure of the amount of jumps in the performance. Thestd of the amplitude envelope (26) is also correlated withthe jump features. One possible reason for this is that a highnumber of pauses and jumps might significantly impactthe amplitude variation. Other feature correlations are lessinterpretable; for example, the correlation between min ofamplitude spikes (32) and mean of the inverse local tempo(17) is not easily explained.
Figure 5 displays the explained variance by principalcomponents. The eigenvalue of the first component is con-siderably higher than that of the following components.The first five components explain 60% of the total variance.The loading matrix, shown for these first five componentsin Figure 6, indicates that the first component is mostly acombination of pitch features (1–7) and the pitch-relatedDTW cost features (9–11). Both the second and the thirdcomponent are combinations of rhythmic IOI features withthe second focusing on tempo (20) and the third componentmostly describing tempo variation (21–23). While the in-terpretation of the fourth component is difficult, the fifthcomponent clearly represents dynamics (27–29).
4.3 Inference
A SVM Regression model is trained using the extractedfeatures. As a linear kernel gave comparable results toan RBF kernel, the linear kernel was chosen for sake ofsimplicity. Libsvm [3] is used as implementation.
4.4 Forward Feature Selection
While the PCA gives us insights into feature correlation andwhich features contribute most to explaining the variance in
the feature set, it is of limited use in deciding which featurescontribute most to the assessment task. In order to identifythese, we apply forward feature selection [10]. As thisselection approach ’wraps’ the target regression algorithm,the selected features will be task-relevant. Forward featureselection is performed on the SVR model with 5-fold cross-validation. The used metric to evaluate success is the R-squared value, which is a common metric for the evaluationof regression systems.
The result of the selection process is a list of featuresordered according to their relevance for the task. The in-dices of the first 10 selected features for each assessmentcategory are listed in Table 2. This table also comparesthe selected feature sets for sight reading with the sets fora rehearsed student performance. The R-squared resultsdepending on the number of selected features, comparingthe sight-reading exercise with the technical exercise, areshown in Figure 7.
4.4.1 Discussion
Figure 7 shows that the R-squared value starts to convergeafter about 10 iterations of the feature selection. The highestR-squared for musicality and rhythmic accuracy is higherfor the practiced performance, while that for note accuracyis higher for sight-reading.
Of the selected features listed in Table 2, two of the dy-namics features (25,26) rank high for both practiced perfor-mance and sight-reading for all three assessment categories.These two features are the mean and std of the amplitudestandard deviation per note. Apparently, the steadiness ofloudness plays an important role in assessing the perfor-mance.
Looking closer into the Note Accuracy row of Table 2,
Category Practiced Sight-reading
Musicality25,16,21,15,5,26,11,1,6,18
25,6,32,15,29,7,26,5,24,23
Note Acc.9,20,17,3,28,14,25,21,26,23
26,6,32,15,7,23,2,9,3,11
Rhythm Acc.25,21,16,13,26,18,5,11,2,1
25,6,32,23,15,29,31,8,20,1
Table 2. The first 10 selected features in forward featureselection. Colors represent different feature groups: cyanfor pitch, purple for DTW cost, grey for tempo variance,apricot for note matches, orange for tempo (local), pinkfor tempo (IOI) and green for dynamics.

0 5 10 15 20 25 30
Number of Features Selected0.20
0.25
0.30
0.35
0.40
0.45
0.50
0.55
0.60
R-S
qure
d
Forward Feature Selection - Technical Exercise
MusicalityNote AccuracyRhythmic Accuracy
0 5 10 15 20 25 30
Number of Features Selected0.20
0.25
0.30
0.35
0.40
0.45
0.50
0.55
0.60
R-S
qure
d
Forward Feature Selection - Sight-reading Exercise
MusicalityNote AccuracyRhythmic Accuracy
Figure 7. The R-squared curves in feature selection.
we can observe that six of the ten selected features(2,3,6,7,9,11) for sight-reading are features which con-tribute highly to the first (pitch-related) PCA component.This is not the case for technical exercise, indicating thatthe pitch features contain more relevant information forsight-reading than for practiced performance. This is alsoindicated by feature 6 ranking highly in all three assess-ment categories for sight-reading but not for practiced per-formance. This feature is one of the aggregated features(standard deviation of absolute differences between playedpitch and reference pitch) and is thus a measure of pitchsteadiness.
For the assessment categories Musicality and RhythmicAccuracy, more dynamics features are selected for sight-reading exercise than for the practiced performance. Thereason for this might be a different expectation for the twoexercises. It might be that, either due to the low complexityof the score or little time for preparation, a dynamicallysteady performance is preferred by the judges.
During feature selection, the R-squared curve reaches itsmaximum at about 10–20 iterations and drops dramaticallywhen nearly all the features are selected. This is unexpectedbehavior for an SVM. A possible reason may be that thedataset is not large enough to train an SVR with all thefeatures or that there might be some ’misleading’ featuresin the feature set.
According to the results above, the automatic assessmentof sight-reading is even more challenging than assessing apracticed performance, which performs in the range that weexpect (compare [9]) but not so well that it could be con-sidered solved. The higher R-squared for Note Accuracyindicates that our features, especially the intonation fea-tures, model this category better for sight-reading than fortechnical exercise. The low R-squared values for Musicalityand Rhythmic Accuracy indicate that we essentially can-not model the human assessments either due to irrelevantfeatures or noisy ground truths. It means that the judgesassess the two kinds of exercises differently for these cat-egories and that our regression model fails to capture theinformation important for sight-reading.
5. CONCLUSION
We presented a feature set of 32 hand-crafted features for theassessment of sight-reading and evaluated them for middleschool alto saxophone performances. The feature analysisincluded PCA and forward feature selection based on theR-squared of the output from an SVR. We can identify therelevant assessment dimensions in the first few principalcomponents and find that the assessment of sight-readingin general is highly influenced by dynamics, and that theassessment of Note Accuracy is mostly focused on pitch-related features. Judging from the absolute results, we cansee that the automatic assessment of sight-reading is stillan unsolved problem and that the presented features canmodel a human assessment only imperfectly. In order tobe usable in a realistic scenario, we need to either identifyadditional, more relevant features or move towards state-of-the-art, uninterpretable feature learning solutions. Ascompared to a practiced and prepared performance, we canidentify some commonalities and some differences in the setof relevant features, but the most striking difference is thegap of model performance between assessment categories.Further work is needed to identify where the cause for thisgap can be found.
It is likely that rehearsed and sight-reading exercises donot share the same assessment criteria even if the categoriesare named identically. The performance, as imperfect asit might be, is not assessed by score deviations alone, sothat our feature might not represent all critical factors. Anadditional complication is that in our dataset, we only havethe assessment from one judge for each performance. Theeffect of possible subjectivity and uncertainty makes arecomplicated task even more challenging. More effort isneeded to be able to explain the logic behind the assess-ment given by judges with quantitative and interpretableindicators before they can be used in music education.
6. ACKNOWLEDGEMENT
We would like to thank the Florida Bandmasters Association(FBA) for providing the dataset used in this work.

7. REFERENCES
[1] J. Abeßer, J. Hasselhorn, A. Lehmann C. Dittmar, andS. Grollmisch. Automatic quality assessment of vocaland instrumental performances of ninth-grade and tenth-grade pupils. In Proc. of the International Symp. onComputer Music Multidisciplinary Research (CMMR),Marseille, 2013.
[2] M. Besson and F. Faïta. An event-related potential (erp)study of musical expectancy: Comparison of musicianswith nonmusicians. Journal of Experimental Psychol-ogy: Human Perception and Performance, 21(6):1278,1995.
[3] C.C. Chang and C.J. Lin. LIBSVM: A Library for Sup-port Vector Machines. ACM Transactions on IntelligentSystems and Technology (TIST), 2(3), 2011.
[4] C.C. Cheng, D.J. Hu, and L.K. Saul. Nonnegative ma-trix factorization for real time musical analysis andsight-reading evaluation. In Proc. of the InternationalConference on Acoustics, Speech and Signal Processing,Las Vegas, 2008. IEEE.
[5] C.A. Elliott. The relationships among instrumentalsight-reading ability and seven selected predictor vari-ables. Journal of Research in Music Education, 30(1):5–14, 1982.
[6] A.L.P. Farley. The Relationship Between Musicians’Internal Pulse and Rhythmic Sight-Reading. PhD thesis,University of Washington, 2014.
[7] C. Fremerey, M. Müller, and M. Clausen. Handling re-peats and jumps in score-performance synchronization.In Proc. of the International Society for Music Informa-tion Retrieval Conference (ISMIR), Utrecht, 2010.
[8] T. Fukuda, Y. Ikemiya, K. Itoyama, and K. Yoshii. Ascore-informed piano tutoring system with mistake de-tection and score simplification. In Proc. of the Sound
and Music Computing Conference (SMC), Maynooth,2015.
[9] S. Gururani, A. Pati, C.W. Wu, and A. Lerch. Analysisof Objective Descriptors for Music Performance Assess-ment. In International Conference on Music Perceptionand Cognition (ICMPC), Toronto, 2018.
[10] I. Guyon and A. Elisseefi. An Introduction to Variableand Feature Selection. Journal of Machine LearningResearch, 3(7-8):1157–1182, October 2003.
[11] C.M. Hayward and J. Eastlund Gromko. Relationshipsamong music sight-reading and technical proficiency,spatial visualization, and aural discrimination. Journalof Research in Music Education, 57(1):26–36, 2009.
[12] M. Mauch and S. Dixon. pyin: A fundamental frequencyestimator using probabilistic threshold distributions. InProc. of the International Conference on Acoustics,Speech and Signal Processing (ICASSP), pages 659–663, Florence, 2014. IEEE.
[13] M. Müller. Dynamic Time Warping. In InformationRetrieval for Music and Motion, pages 69–84. Springer,Berlin, Heidelberg, 2007.
[14] A. Pati, S. Gururani, and A. Lerch. Assessment of Stu-dent Music Performances Using Deep Neural Networks.Applied Sciences, 8(4):507, March 2018.
[15] A. Vidwans, S. Gururani, C.W. Wu, V. Subramanian,R.V. Swaminathan, and A. Lerch. Objective descriptorsfor the assessment of student music performances. InProc. of the AES Conference on Semantic Audio, Erlan-gen, 2017. AES.
[16] C.W. Wu, S. Gururani, C. Laguna, A. Pati, A. Vidwans,and A. Lerch. Towards the Objective Assessment ofMusic Performances. In Proc. of the International Con-ference on Music Perception and Cognition (ICMPC),pages 99–103, San Francisco, 2016.