automated screening of children with obstructive sleep...
TRANSCRIPT
1
Automated screening of children with obstructive sleep apnea using nocturnal
oximetry: An alternative to respiratory polygraphy in unattended settings
Running head (short title/subtitle): At-home automated screening of childhood OSAHS
Daniel Álvarez, Ph.D.1,2; María L. Alonso-Álvarez, M.D.3; Gonzalo C. Gutiérrez-Tobal,
Ph.D.2; Andrea Crespo, M.D.1; Leila Kheirandish-Gozal, M.D., M.Sc.4; Roberto Hornero,
Ph.D.2; David Gozal, M.D., M.B.A.4; Joaquín Terán-Santos, M.D.3; Félix Del Campo,
M.D., Ph.D.1,2
1Sleep-Ventilation Unit, Pneumology Service, Río Hortega University Hospital, c/ Dulzaina 2, 47012 Valladolid, Spain. 2Biomedical Engineering Group, University of Valladolid, Paseo de Belén 15, 47011 Valladolid, Spain. 3Unidad Multidisciplinar de Sueño, CIBER Respiratorio, Hospital Universitario de Burgos, Burgos, Spain. 4Section of Sleep Medicine, Dept. of Pediatrics, Pritzker School of Medicine, Biological
Sciences Division, The University of Chicago, Chicago, IL, 60637, USA
Funding. This research has been partially supported by the project 153/2015 of the
Sociedad Española de Neumología y Cirugía Torácica (SEPAR), the project RTC-2015-
3446-1 from the Ministerio de Economía y Competitividad and the European Regional
Development Fund (FEDER), and the project VA037U16 from the Consejería de
Educación de la Junta de Castilla y León and FEDER. L. Kheirandish-Gozal is supported
by NIH grant 1R01HL130984-01. D. Álvarez was in receipt of a Juan de la Cierva grant
from the Ministerio de Economía y Competitividad.
Conflicts of interest. No potential conflicts of interest exist with any
companies/organizations whose products or services may be discussed in this article.
Corresponding author. Dr. Daniel Álvarez, Unidad de Sueño-Ventilación, Servicio de
Neumología, Hospital Universitario Río Hortega de Valladolid, c/ Dulzaina 2, 47012 –
Valladolid, España. Tlfn.: +34983420400-85776. E-mail: [email protected],

2
Abstract
Study Objectives: Nocturnal oximetry has emerged as a simple, readily available, and
potentially useful diagnostic tool of childhood obstructive sleep apnea-hypopnea
syndrome (OSAHS). However, at-home respiratory polygraphy (HRP) remains the
preferred alternative to polysomnography (PSG) in unattended settings. The aim of this
study was two-fold: (1) to design and assess a novel methodology for pediatric OSAHS
screening based on automated analysis of at-home oxyhemoglobin saturation (SpO2),
and (2) to compare its diagnostic performance with HRP.
Methods: SpO2 recordings were parameterized by means of time, frequency, and
conventional oximetric measures. Logistic regression (LR) models were optimized using
genetic algorithms (GAs) for 3 cutoffs for OSAHS: 1, 3, and 5 events per hour (e/h). The
diagnostic performance of LR models, manual obstructive apnea-hypopnea index
(OAHI) from HRP, and the conventional oxygen desaturation index ≥3% (ODI3) were
assessed.
Results: For a cutoff of 1 e/h, the optimal LR model significantly outperformed both
conventional HRP-derived ODI3 and OAHI: 85.5% Accuracy (HRP 74.6%; ODI3 65.9%)
and 0.97 AUC (HRP 0.78; ODI3 0.75) were reached. For a cutoff of 3 e/h, the LR model
achieved 83.4% Accuracy (HRP 85.0%; ODI3 74.5%) and 0.96 AUC (HRP 0.93; ODI3
0.85) whereas using a cutoff of 5 e/h, oximetry reached 82.8% Accuracy (HRP 85.1%;
ODI3 76.7) and 0.97 AUC (HRP 0.95; ODI3 0.84).
Conclusions: Automated analysis of at-home SpO2 recordings provide accurate
detection of children with high pre-test probability of OSAHS. Thus, unsupervised
nocturnal oximetry may enable a simple and effective alternative to HRP and PSG in
unattended settings.
Keywords: childhood obstructive sleep apnea-hypopnea syndrome; at-home respiratory
polygraphy; nocturnal oximetry; blood oxygen saturation; automated pattern recognition;
genetic algorithms
Brief Summary box
Current Knowledge/Study Rationale. Increasing accessibility to the diagnosis of
childhood obstructive sleep apnea-hypopnea syndrome (OSAHS) by means of simplified
as well as effective techniques is a challenging task. Unattended nocturnal oximetry has
emerged as a potentially useful tool even if well-validated algorithms are still sorely
needed.
Study impact. We show that automated analysis of at-home blood oxygen saturation
(SpO2) from nocturnal oximetry is a reliable and accurate alternative to home-based
respiratory polygraphy in the identification of OSAHS in children with high pre-test
probability. Therefore, unattended oximetry could be an essential approach in order to
develop abbreviated diagnostic tools for childhood OSAHS.
3
Introduction
In the last decades, pediatric obstructive sleep apnea-hypopnea syndrome (OSAHS) has
emerged as a highly prevalent sleep-related disorder that may lead to major long-term
adverse consequences in neurocognitive and behavioral development and in
cardiovascular and metabolic function, reducing overall health and quality of life,1,2 while
increasing healthcare use and associated costs.3 In-lab nocturnal polysomnography
(PSG) is the current recommended test to reach a definitive diagnosis of OSAHS.2,4
However, in most countries the availability of pediatric sleep laboratories is too limited to
enable generalized implementation of PSG to match clinical needs.4,5 Moreover, several
factors decrease PSG effectiveness and utility as the gold standard for young children
and infants, particularly due to the inconvenience it imposes for both parents and children
who need to spend the whole night in a sleep laboratory, and the high aversion
manifested by a proportion of children when multiple attached sensors are placed.4,6
Accordingly, the major question is whether simplified techniques may be explored to
increase the accessibility to OSAHS diagnosis while still preserving overall effectiveness.
In this context, there is ever growing research efforts on development and validation of
cost-effective diagnostic methodologies, which include history and physical examination,
sleep quality questionnaires, nocturnal oximetry, respiratory polygraphy (RP), daytime
(nap) PSG, and ambulatory PSG.2,4,7-11 The American Academy of Pediatrics reported in
2012 that these methods are helpful when patients test positive, but have a poor
predictive value if results are negative.2 Nevertheless, more recently published
guidelines11 for the diagnosis and management of childhood OSAHS still point out the
importance of conducting an objective diagnostic test in every symptomatic child, de
facto highlighting that further research is still needed to effectively simplify pediatric
OSAHS diagnosis.
Despite robust published evidence showing that the apnea-hypopnea index is inherently
underestimated,12 RP is rapidly becoming a widely implemented alternative to PSG in
clinical settings.8,9,11 Furthermore, ambulatory RP at home (HRP) has been suggested
as a valid approach in low resource settings when in-lab PSG is not available.11 In this
context, a recent study demonstrated the feasibility of HRP to evaluate children with
OSAHS at home.13 Similarly, nocturnal oximetry has long been proposed as a screening
tool for pediatric OSAHS in high-risk patients due to its reliability, simplicity, and suitability
for children.14-16 In this regard, recent systematic reviews have reported that oximetry can
provide essential information about OSAHS when PSG is not accessible.11,17
Nevertheless, most of available studies have in fact analyzed the blood oxygen
saturation (SpO2) profiles that were recorded during attended in-lab PSG.14,18-21
Therefore, there is still little if any evidence supporting the reliability of unattended
oximetry. Moreover, further research is needed to compare the diagnostic performance
of the 2 principal simplified diagnostic approaches, namely oximetry and HRP. In the
present study, we hypothesized that single-channel SpO2 from nocturnal oximetry will
provide a non-inferior alternative to HRP in the diagnosis of childhood OSAHS when
recorded at home without supervision of trained personnel.
Well-validated algorithms for the interpretation of oximetric recordings are essential to
achieve both high positive and negative predictive values, especially for low cutoffs such
as the ones traditionally employed in the PSG-based diagnosis of pediatric OSAHS.17
Signal processing techniques provide useful tools to gain not only insights into the
pathological mechanisms influencing biological recordings, but also to improve the
diagnostic ability of single-channel recordings when searching for simplified approaches.
In this study, we propose to apply genetic algorithms (GAs) in order to compose an
4
optimum model derived from oximetry data in childhood OSAHS diagnosis. GAs are
optimization procedures from the field of evolutionary computation that are able to
construct optimum models composed of the most relevant features characterizing the
problem under study.22 Previous studies have assessed their usefulness and applicability
in the context of OSAHS diagnosis in adults.23,24
The aims of this study were two-fold. Firstly, to exhaustively characterize at-home SpO2
recordings and to compose models aimed at classifying children showing high-risk for
OSAHS. Secondly, to further assess our methodology by comparing our results with
manual scoring from HRP and conventional ODI3. To achieve these goals, automated
pattern recognition techniques were applied in order to improve diagnostic ability of SpO2
as single screening tool for OSAHS in children.
Methods
Patients
A total of 50 children (27 boys and 23 girls) ranging 3–13 years old referred to the
Respiratory Sleep Disorders Unit of the University Hospital of Burgos in Spain for clinical
suspicion of OSAHS composed the population under study. The sample was
representative of the clinical population commonly referred to our sleep unit. Patients
were recruited regardless of the severity of their symptoms. Additionally, in order to avoid
potential bias linked with the inclusion process only those children who arrived to the
sleep unit on the days of the week selected using a random sequence participated in the
study. Table 1 summarizes the demographic and clinical data of the cohort. All patients
underwent in-laboratory PSG due to habitual snoring and/or witnessed breathing pauses
during sleep reported by their parents or caretakers. Exclusion criteria were the following:
children suffering from serious chronic medical and/or psychiatric additional conditions,
those showing symptoms indicative of sleep disorders other than OSAHS, and those
children who required urgent interventions. Children did not receive intranasal steroids,
oral montelukast, or other pharmacological treatment for symptoms before they were
recruited into the study. The Ethical Review Committee of the hospital approved the
protocol (#CEIC 936) and informed consent to participate in the study was obtained prior
to the enrollment.
Sleep studies
Sleep studies consisted of unattended HRP at children’s home and a subsequent (18.2
± 20.0 days after) in-laboratory PSG. HRP was carried out using a polygraph eXim Apnea
Polygraph (Bitmed ®, Sibel S.A., Barcelona, Spain). The following channels were
recorded: oronasal flow (thermistor) and pressure (nasal cannula), chest and abdominal
effort (impedance plethysmography), body position, snoring, and heart rate and SpO2 by
means of pulse oximetry.
In-hospital supervised PSG was carried out from 22:00 to 08:00 using a digital
polysomnograph Deltamed Coherence® 3NT version 3.0 (Diagniscan, S.A.U., Group
Werfen, Paris, France). The following signals were recorded: EEG, right and left EOG,
tibia and submental EMG, ECG, airflow (thermistor and nasal cannula), chest and
abdominal movements (effort bands), oximetry, continuous transcutaneous carbon
dioxide (PtcCO2), snoring, and body position.
HRP and PSG were scored manually by the same independent investigators, who were
blinded to the goals of the study. The American Academy of Sleep Medicine criteria were

5
used to perform sleep staging and quantify cardiorespiratory events.25 Apneas were
defined as the absence of oronasal airflow lasting at least 2 respiratory cycles, whereas
hypopneas were defined as decreases greater than or equal to 50% in the amplitude of
the nasal pressure or alternative signal for more than 2 respiratory cycles, accompanied
by a desaturation ≥3% or an arousal. The obstructive apnea-hypopnea index (OAHI) was
defined as the number of obstructive apneas and hypopneas per hour of sleep in the
PSG (OAHIPSG) and per recorded hour in the HRP (OAHIHRP), respectively. The OAHIPSG
was used as gold standard for OSAHS diagnosis. In this study, the following common
OAHI cutoff points were assessed2,4: 1, 3 and 5 events/hour (e/h). Table 1 shows OSAHS
prevalence in the cohort according to these cutoffs, as well as the averaged respiratory
indices from PSG, HRP and oximetry of the population under study.
SpO2 recordings from HRP were originally recorded at a sampling rate of 100 Hz. Each
recording was then saved to a separate file and subsequently processed offline by
means of the proposed automated algorithms.
Oximetry Signal Processing
Unattended SpO2 recordings from HRP were used to perform automated binary
classification of children showing symptoms of sleep apnea as OSAHS negative or
OSAHS positive according to PSG. The following signal processing stages were
implemented: (i) feature extraction, using conventional oximetric indexes and measures
from time and frequency domain analyses; (ii) feature selection, by means of GAs; and
(iii) feature classification, by means of binary logistic regression (LR).
Feature extraction
This stage is aimed at obtaining as much information as possible from the SpO2 signal.
To achieve this, three complementary analyses were conducted to exhaustively
characterize the influence of recurrent apneic events on the overnight SpO2 profile: (i)
statistical moments and nonlinear measures in time domain, (ii) statistical moments and
spectral measures in frequency domain, and (iii) conventional oximetric indices. Finally,
up to 18 features composed our initial feature set. Recent studies have shown the
usefulness of these automated methods in the context of childhood OSAHS diagnosis
from supervised in-lab pulse oximetry and airflow signals.21,26 In the present study, a
comprehensive analysis of input parameters and frequency bands was carried out to
properly characterize the influence of OSAHS in SpO2 unattended recordings at home.
First-to-fourth order statistical moments (M1–M4) were applied to characterize the data
histogram in the time domain. SpO2 data from non-OSAHS children is expected to be
concentrated in a non-pathological limited region, whereas recurrent desaturations,
typical of OSAHS, would change data distribution towards lower values. Mean (M1t),
variance (M2t), skewness (M3t) and kurtosis (M4t) were applied to quantify central
tendency, dispersion, asymmetry, and peakedness of the data histogram, respectively.27
On the other hand, nonlinear methods are able to derive additional and complementary
information from biomedical recordings. Hence, sample entropy (SampEn) and central
tendency measure (CTM) were used in this study to quantify irregularity and variability
of SpO2 recordings, respectively.28-31
Features from the frequency domain provide information about the duration and the
repetitive nature of apneic events. The power spectral density (PSD) was computed
using the well-known Welch method, which is suitable for nonstationary signals.26,31

6
Then, a comprehensive analysis was conducted to properly derive a frequency region in
the power spectrum related to the recurrence of desaturations in children. In order to
obtain such a frequency band of interest, we searched for statistical significant
differences in the PSD amplitude between OSAHS positive and OSAHS negative
children for every single frequency component.26 Mean (M1fb), variance (M2fb),
skewness (M3fb) and kurtosis (M4fb) were applied to quantify central tendency,
dispersion, asymmetry, and peakedness of the power spectrum in the band of interest,
respectively. In addition, other conventional spectral measures were also derived from
this frequency band: maximum (PAb) and minimum (MAb) amplitudes and the signal
relative power (RPb).26
Finally, conventional oximetric indices commonly used in clinical practice were also
included in the study. The oxygen desaturation index ≥3% (ODI3), the minimum (minSat)
and average (AvgSat) saturation, and the cumulative time spent below 90% (CT90) and
95% (CT95) saturation were computed.
Feature selection and classification
A GA is an optimization procedure derived from evolutionary computation with ability to
inspect efficiently the search space of variables or parameters that govern a model.22,32
GAs encode a potential solution as a chromosome-like data structure and apply genetic
operations (crossover and mutation) to make the population evolve iteratively in order to
reach the optimal solution.33 At each iteration, a particular group of chromosomes
(parents) are selected from the whole population to generate the offspring, which will
replace chromosomes in the new population.22 The iterative optimization process is
carried out in cycles called generations.
In this study, GAs were applied for feature selection to obtain the optimum input feature
subset to a binary classifier in terms of classification performance.23,24 Therefore, an
individual or chromosome from the population is just a combination of features, i.e. a
feature subset, from the initial oximetric feature space composed of 18 features. A 2-
symbol binary codification was used to encode each feature subset or individual in the
population, where the k-th bit denotes the absence (0) or the presence (1) of the k-th
feature. Each individual has p bits, where p is the number of features in the original set.34
The classification accuracy of a binary LR model was the performance metric used to
drive parent selection. A bootstrapping approach was applied to compute the accuracy
of each individual across the whole iteration process in order to deal with overfitting.35 In
the present study, probability of crossover (Pc) values ranging from 0.5 to 0.9 and
probability of mutation (Pm) values ranging from 0.01 to 0.09 were used to introduce
variations into the offspring along 100 generations.23,24,33,34 The elite or percentage of the
best individuals in the old population preserved after each generation were also varied
between 0 and 25%.23,24 For each cutoff point for childhood OSAHS (1, 3, and 5 e/h), the
optimum feature subset from the last generation was selected in terms of diagnostic
performance.
LR was used for binary classification, where input patterns are classified into one of two
mutually exclusive classes (OSAHS negative vs. OSAHS positive). LR classifiers assign
an input vector to the class with the maximum a posteriori probability according to a
probability density for the response variable modeled by a Bernoulli distribution.36 The
maximum likelihood criterion is used to optimize coefficients of the independent input
features in the logistic model.36

7
Statistical analyses
IBM SPSS Statistics version 20 (Chicago, IL) was used to perform statistical analyses.
Normality and homoscedasticity analyses revealed that oximetric features derived from
the population under study were not normally distributed and variances were unequal.
Therefore, descriptive analysis of features was presented in terms of their median and
interquartile range. In addition, the non-parametric Mann-Whitney U test was applied to
search for statistical significant differences between OSAHS negative and OSAHS
positive groups. A p-value < 0.05 was considered significant.
Matlab R2015a was used to implement feature extraction, selection, and classification
stages. Diagnostic performance was assessed by means of sensitivity (Se), specificity
(Sp), positive predictive value (PPV), negative predictive value (NPV), positive likelihood
ratio (LR+), negative likelihood ratio (LR-), accuracy (Acc), and area under the receiver
operating characteristics (ROC) curve (AUC). A bootstrapping approach was carried out
in order to ensure the statistical validity of our results since it is particularly useful to
estimate statistics in small-sized datasets. The number of bootstrap samples was set to
1000 because it ensures a proper estimation of the 95% confidence interval (CI95%).26
Results
Optimization of the frequency band of interest and nonlinear measures
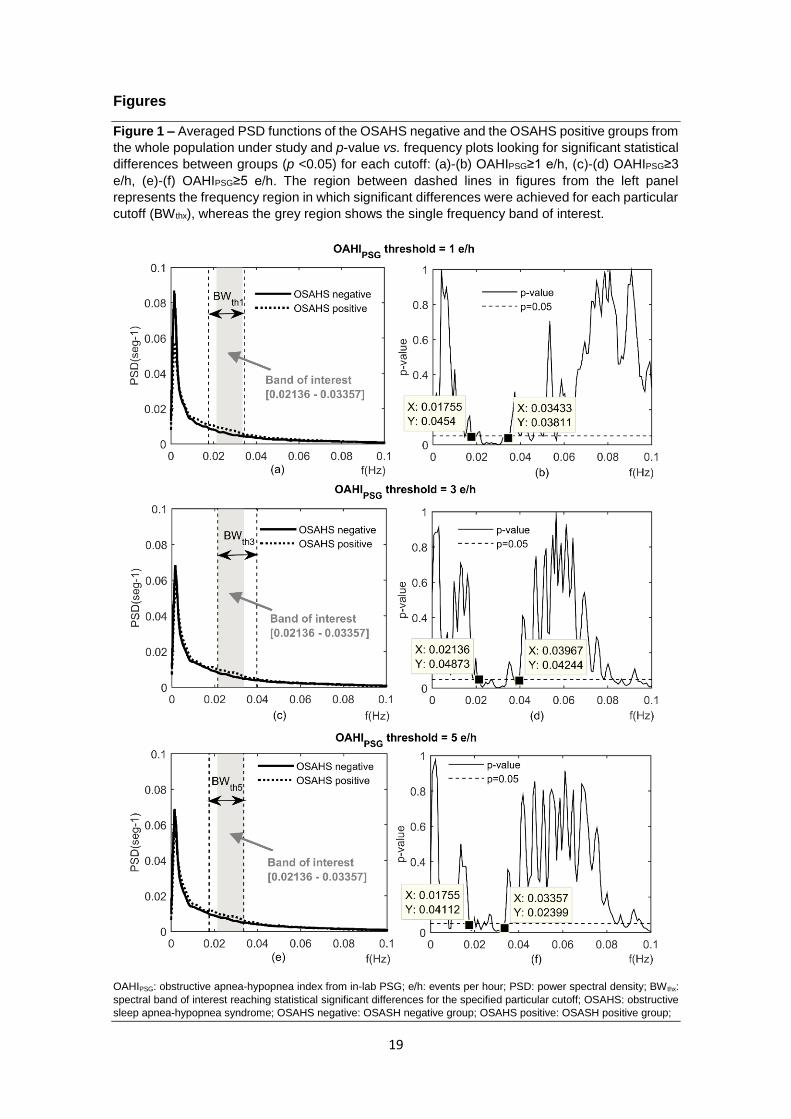
Figs. 1 (a), (c), and (e) show the averaged power spectrum of OSAHS negative and
OSAHS positive groups for each cutoff point under study. OSAHS positive children
showed greater spectral power than OSAHS negative ones in a very low frequency band
(<0.1 Hz) linked with the recurrence and duration of OSAHS typical desaturations, which
agrees with previous studies.21 Furthermore, Figs. 1 (b), (d), and (f) show the p-value vs.
frequency plots to define quantitatively the band of interest. In order to retain a single
frequency band regardless of the threshold for positive OSAHS, the broader region
showing significant statistical differences between OSAHS groups common to all the
cutoffs were selected: 0.02136 – 0.03357 Hz.
Input parameter optimization of nonlinear methods was also carried out in terms of
significant statistical differences between OSAHS negative and OSAHS positive groups.
Regarding SampEn optimization, the recommended m = 1 and 2 and r = 0.1, 0.15, 0.2,
and 0.25 times the standard deviation (SD) of the time series were assessed
[Richmann00]. No significant differences were reached for OAHI = 1 e/h (all p-values >
0.1) while the greatest differences (p-values < 0.05) for OAHI = 3 and 5 e/h were obtained
using m = 1 and r = 0.1 SD. Thus, SampEn was computed using m = 1 and r = 0.1 SD
for all the cutoffs. Regarding CTM, the greatest significant differences were achieved
using rho = 1.1 for all cutoffs under study. Therefore, we finally obtained a single initial
feature set independent of the diagnostic threshold for OSAHS, which demonstrates the
consistency of the proposed methodology.
Feature extraction
Table 2 shows the median and interquartile range of every feature involved in the study
for each cutoff. Regarding features in the time domain, OSAHS positive children showed
overall lower M1t (central tendency), higher M2t (dispersion), higher (less negative) M3t
(asymmetry), lower M4t (peakedness), higher SampEn (irregularity), and lower CTM
(higher variability) than OSAHS negative children for all the cutoffs. For this clinical
threshold for OSAHS, just the CTM achieved significant statistical differences in the time

8
domain. For cutoffs 3 and 5 e/h M2t, M4t, SampEn, and CTM reached significant
differences. Regarding features in the frequency domain, OSAHS positive children
showed significantly higher (p<0.05) M1f (mean spectral power), PAb (maximum
amplitude), RPb (relative power), and MAb (minimum amplitude) in the frequency band
of interest than OSAHS negative children for all cutoffs under study. Finally, conventional
oximetric indexes showed an irregular behavior using different clinical thresholds for
OSAHS. Only ODI3 achieved significant statistical differences between OSAHS positive
and OSAHS negative children for all cutoffs. Similarly, OSAHS positive children showed
significantly higher CT95 than OSAHS negative when using 3 and 5 e/h as cutoffs for
OSAHS.
Feature selection and classification
GAs automatically selected an optimum feature subset for each clinical threshold for
positive OSAHS. Table 3 shows the variables included in the proposed optimum feature
subsets. A total of 6 variables were automatically selected for cutoffs equal to 1 e/h (M1t,
M2t, M3t, M4t, M3fb, RPb) and 3 e/h (M1t, M2t, M4fb, PAb, RPb, and ODI3), whereas 7
features composed the optimum set for a cutoff equal to 5 e/h (M3t, M4fb, PAb, MAb,
RPb, SampEn, ODI3). It is noteworthy that all the proposed signal processing
approaches (time, spectral, and conventional indexes) were represented in these
optimum subsets. Table 4 summarizes the diagnostic performance of the LR models
composed of these optimal subsets, as well as the performance achieved by the manual
OAHI from HRP and the conventional ODI3 alone. Our approach was the most accurate
when a cutoff of 1 e/h was used to diagnose childhood OSAHS. The optimum LR model
from GAs achieved 85.5% Acc (CI95% 66.4-96.6), which significantly outperformed both
the OAHI from HRP (74.6% Acc, CI95% 57.0-88.9) and the conventional ODI3 (65.9%
Acc, CI95% 47.5-83.0). When the clinical threshold for positive OSAHS is increased to
3 e/h, our approach reached 83.4% Acc (CI95% 64.2-96.8), which again significantly
outperformed the single ODI3 (74.5% Acc, CI95% 58.5-88.7) and almost equaled the
manual OAHI from conventional HRP (85.0% Acc, CI95% 71.6-95.5). Finally, the
optimum LR model for a cutoff of 5 e/h achieved 82.8% Acc (CI95% 64.5-96.3), which is
still higher than that obtained with ODI3 (76.7% Acc, CI95% 59.2-90.9) but slightly lower
than the performance reached with HRP (85.1% Acc, CI95% 71.6-95.9). It is important
to note that our proposal always reached higher LR+ and AUC than HRP and ODI3
whatever the cutoff.
Discussion
In this study, the diagnostic performance of an automated simplified method based on
unattended oximetry was assessed as a single tool for diagnosis of childhood OSAHS.
Single-channel SpO2 recordings from at-home oximetry were automatically analyzed. In-
hospital complete PSG was used as the gold standard and three common clinical cutoff
points for childhood OSAHS (OAHI of 1, 3, and 5 e/h) were employed to assess the
consistency of the proposed methodology. Additionally, two indices from alternative
simplified techniques, commonly proposed for OSAHS detection when in-lab PSG is not
available, were analyzed for comparison purposes: manual OAHI from HRP and
conventional ODI3 from oximetry.
In our aim to maximize the diagnostic ability of oximetry, a wide initial feature set was
composed. As expected, spectral and nonlinear features, as well as ODI3, exhibited
statistically significant differences between OSAHS positive and OSAHS negative

9
children, which agrees with previous studies.21,26 Then, automatic feature selection was
accomplished by means of GAs in order to exhaustively analyze the feature space, and
obtain the optimum feature subset for each cutoff. We found that a proper selection of
variables provided complementary information that improves the diagnostic ability of
oximetry. It is noteworthy that these optimum feature subsets showed a consistent
composition when considering contiguous cutoffs for childhood OSAHS: optimum
subsets using cutoffs equal to 1 and 3 e/h share 50% of features (M1t, M2t, and RPb)
whereas subsets from cutoffs equal to 3 and 5 e/h share even more than 50% (M4fb,
PAb, RPb, and ODI3). In addition, RPb was included in all of the optimum feature
subsets, which demonstrates the relevancy and consistency of the frequency band of
interest identified in this study.
Using the GAs-derived optimum subsets, our LR models from unattended oximetry
significantly outperformed the conventional ODI3 in terms of Acc and AUC for all the
cutoffs. Furthermore, our proposed models reached similar Acc and higher AUC than
HRP for cutoffs equal to 3 e/h (83.4% vs. 85.0% Acc and 0.96 vs. 0.93 AUC) and 5 e/h
(82.8% vs. 85.1% Acc and 0.97 vs. 0.95 AUC) and even outperformed manual scoring
of HRP using a low cutoff equal to 1 e/h (85.5% vs. 74.6% Acc and 0.97 vs. 0.78 AUC).
Noteworthy is the fact that manual rather than automated scoring of HRP is considered
the preferred alternative to PSG when the latter is not available. Conversely, our
proposed methodological approach is fully automated, which would markedly reduce the
workload of specialized technicians, and improve consistency. Finally, it is important to
point out that all the optimum models from oximetry reached higher LR+ than HRP and
single ODI3 whatever the OAHI cutoff selected, which is an essential characteristic for
screening tests. This is particularly relevant in the context of pediatric OSAHS since
children are referred to the sleep unit because of existing symptoms of OSAHS.
Overall, we observed that the higher the cutoff, the lower the performance of our
automated LR models from unattended oximetry. In contrast, using conventional manual
OAHI and ODI3, the performance of these approaches increased when the cutoff moved
from 1 to 5 e/h. Notwithstanding, it is important to highlight that conventional ODI3
showed the common imbalance of unattended oximetry, with higher specificity due to
underestimation of the severity of the disease, whereas automated LR models showed
higher sensitivity than specificity for a clinical threshold of 1 e/h for positive OSAHS and
balanced sensitivity and specificity pairs for cutoffs equal to 3 and 5 e/h. Thus, the
maximum benefit of our automated methodology in terms of simplicity and screening
capability can be achieved when using lower cutoffs for positive OSAHS. Since most
sleep laboratories use the cutoff of 1 e/h during interpretation of PSG,2 the features that
emerged in our automated approaches in unattended oximetry further stress the unique
superiority afforded by the proposed methodology.
Several diagnostic alternatives to PSG have been proposed to expand the accessibility
of children to diagnosis and treatment in a timely manner. Quite similar to in-lab PSG in
terms of percentage of successful recordings, unattended PSG at home has shown
similar success rates among school-aged children, but much greater inconsistencies in
younger children.2 Similarly, nap-based PSG studies report high specificity but low
sensitivity.2,13 Although not intrusive and a priori simple, clinical history and sleep quality
questionnaires lack the required diagnostic accuracy, precluding their use as a routine
diagnostic tool for OSAHS in children.4,11,13 However, RP-based approaches have
become increasingly accepted as an effective diagnostic method when carried out in a
clinical setting both in adults and children.11,37 Furthermore, ambulatory HRP has been
considered a feasible means of diagnosing OSAHS when PSG is not available in a

10
recent report of the European Respiratory Society.11 In this regard, Alonso-Álvarez et al.
recently illustrated the effectiveness of HRP for OSAHS diagnosis in an unsupervised
setting.13 Similarly, nocturnal oximetry has emerged as a simple, low-cost, and less
intrusive alternative to PSG, RP, or HRP to help in childhood OSAHS diagnosis.14,17 In
the present study, our results suggest that automated analysis of single-channel SpO2
from unattended oximetry may be as accurate as HRP in the diagnosis of OSAHS.
This is an obvious departure from previous perceptions regarding oximetry. Indeed,
oximetry has been characterized as achieving high specificity but low sensitivity.2
Nevertheless, several studies have shown the usefulness and effectiveness of common
oximetric indices based on the number of overnight desaturations in the context of
pediatric OSAHS, such as the ODI19,20,38 and, more recently, the quantification of clusters
of desaturations.18,39 On the other hand, only a few studies have been carried out at
home.38,39 In such unattended settings, both the McGill oximetry score and the ODI ≥4%
(ODI4) achieved high night-to-night agreement (mean difference 0.32, limits of
agreement -8.00 to 8.64 e/h).38,39 Regarding the diagnostic performance, ODI4 achieved
poor performance (67% Se and 60% Sp) for detecting moderate OSAHS (OAHI≥5 e/h).38
Our proposal based on unsupervised oximetry clearly outperformed the results reported
in this study. Recent approaches analyze the pulse rate (PR) signal from pulse oximetry40
or combine data derived from the SpO2 signal with other sources of information to
improve diagnostic ability, such as the PR signal from the own pulse oximetry recording21
or the airflow signal.26 In the study by Sahadan et al.,40 PR increases of 15 bpm (PRI-15)
from ambulatory pulse oximetry were scored automatically. This PR-derived index
reached a sensitivity ranging 16%-39% and specificity ranging 79%-97% for a OSAHS
cutoff ≥1 e/h. In the study by Garde et al.,21 time, spectral and conventional measures
from both SpO2 and PR recordings obtained by means of a pulse oximeter sensor
attached to a smartphone were combined using a linear classifier. These investigators
reported 88.4% sensitivity and 83.6% specificity for a AHI cutoff of 5 e/h. Although a
portable device was used, all recordings were carried out in the hospital. Finally, in a
recent study by our own group, ODI3 from oximetry was combined with spectral
measures from the airflow signal using a LR model.26 All the recordings were obtained
during unattended HRP. A sensitivity of 85.9%, a specificity of 87.4%, and an accuracy
of 86.3% were reached for a cutoff of 3 e/h.
Some limitations should be taken into account. First of all, the population cohort
evaluated herein should be expanded in order to draw more generalizable conclusions.
A larger dataset would allow a better optimization of the feature space using GAs since
this feature selection method maximizes its usefulness when working with high-
dimensional spaces and a large number of instances. Nevertheless, in order to address
this issue, a bootstrapping approach was carried out both for feature selection and
classification. This procedure is known to provide good estimates from small datasets.
Similarly, a wider dataset would let us a better optimization of all input parameters from
nonlinear and spectral features, including the frequency band of interest for childhood
OSAHS. However, our results revealed quite consistent features and a frequency band
linked with recurrent desaturations characteristic of OSAHS. An additional drawback that
could affect our results may reside in undesirable differences related to potential
temporal changes of the disease. As such, the time interval between in-hospital PSG
and at-home RP was set to be lower than 2 months, a timeframe that is clearly shorter
than the actual waiting times for a pediatric sleep study in our sleep unit. Nevertheless,
even this shorter interval could lead to potential differences between the reference OAHI
and oximetry from in-lab PSG and OAHI and oximetry from RP at patient’s home due to
the widely known night-to-night variability of OSAHS.

11
The main goal for assessing abbreviated test for pediatric OSAHS just based on oximetry
is to use portable oximeters at the patients’ home instead of complete PSG or RP
equipment. In the present investigation, we analyzed SpO2 recordings from unattended
RP recordings. Therefore, potential differences between oximetric profiles from overnight
RP and from a portable standalone device could influence our results. Sampling rates,
resolution, and averaging time settings may impose significant influence on the collected
data, which could affect time response and reproducibility of SpO2.21,41 Notwithstanding,
previous studies demonstrated that our approach could be easily optimized for any
technical setting in order to achieve a high diagnostic performance.24,42 In addition,
current high-performance oximeters already match technical characteristics of in-
hospital equipment overcoming previous limitations of portable devices due to
restrictions in memory storage capability and battery life. Finally, the proposed
methodology presented herein aims to confirm or discard the presence of OSAHS, i.e.
to perform binary classification. Although three commonly used OAHI cutoff points in
clinical practice were assessed for positive OSAHS (1, 3, and 5 e/h), it would be very
useful to couple the current novel approach to develop and implement a pattern
recognition methodology aimed at classifying patients in the 4 common categories of
severity (no disease, mild, moderate, and severe) or estimating the actual PSG-derived
OAHI of each patient under study.
Conclusions
To the best of our knowledge, this is the first study comparing the diagnostic performance
of unattended oximetry and HRP as alternative to standard in-lab PSG in the context of
childhood OSAHS. Automated analysis of single-channel at-home SpO2 recordings
emerged as a useful and a reliable alternative to manual scoring of HRP in the detection
of children with high clinical suspicion of suffering from OSAHS, particularly when using
low OAHI cutoff points for a positive diagnosis of the disease. Furthermore, our optimum
LR models significantly outperformed conventional ODI3 for all the cutoffs under study
using the same dataset. Therefore, our results suggest that automated processing of the
SpO2 signal could be an essential approach in order to develop abbreviated as well as
accurate diagnostic tools for childhood OSAHS in unsupervised settings.

12
References
1. Capdevila OS, Kheirandish-Gozal L, Dayyat E, Gozal D. Pediatric obstructive sleep
apnea. Complications, management, and long-term outcomes. Proc Am Thorac Soc
2008;5:274-82.
2. Marcus CL, Brooks LJ, Ward SD, Draper KA, Gozal D, Halbower AC, Jones J,
Lehmann C, Schechter MS, Sheldon S, Shiffman RN, Spruyt K. Diagnosis and
management of childhood obstructive sleep apnea syndrome. Pediatrics
2012;130:e714-55.
3. Tarasiuk A, Simon T, Tal A, Reuveni H. Adenotonsillectomy in children with
obstructive sleep apnea syndrome reduces health care utilization. Pediatrics
2004;113:351-6.
4. Kheirandish-Gozal L. What is “abnormal” in pediatric sleep? Respiratory Care
2010;55:1366-76.
5. Lesser DJ, Haddad GG, Bush RA, Pian MS. The utility of a portable recording device
for screening of obstructive sleep apnea in obese adolescents. J Clin Sleep Med
2012;8:271-7.
6. Katz ES, Ron BM, D'Ambrosio CM. Obstructive sleep apnea in infants. Am J Respir
Crit Care Med 2012;185:805-16.
7. Poets PJP, Schilder AGM, Van den Berg S, Hoes AW, Joosten KFM. Evaluation of
a new device for home cardiorespiratory recording in children. Arch Otolaryngol
Head Neck Surg 2003;129:1281-4.
8. Brockmann PE, Schaefer C, Poets A, Poets CF, Urschitz MS. Diagnosis of
obstructive sleep apnea in children: A systematic review. Sleep Medicine Reviews
2013;17:331-40.
9. Alonso-Álvarez ML, Navazo-Egüia AI, Cordero-Guevara JA, Ordax-Carbajo E, De
La Mata G, Barba-Cermeño JL, Terán-Santos J. Respiratory polygraphy for follow-
up of obstructive sleep apnea in children. Sleep Medicine 2012;13:611-5.
10. Alonso-Álvarez ML, Terán-Santos J, Cordero-Guevara JA, Navazo-Egüia AI, Ordax-
Carbajo E, Masa-Jiménez JF, Pelayo R. Reliability of respiratory polygraphy for the
diagnosis of sleep apnea-hypopnea syndrome in children. Arch Bronconeumol
2008;44:318-23.
11. Kaditis AG, Alonso-Alvarez ML, Boudewyns A, Alexopoulos EI, Ersu R, Joosten K,
Larramona H, Miano S, Narang I, Trang H, Tsaoussoglou M, Vandenbussche N,
Villa MP, Van Waardenburg D, Weber S, Verhulst S. Obstructive sleep disordered
breathing in 2- to 18-year-old children: diagnosis and management. Eur Respir J
2016;47:69-94.
12. Tan HL, Gozal D, Ramirez HM, Bandla HPR, Kheirandish-Gozal L. Overnight
polysomnography versus respiratory polygraphy in the diagnosis of pediatric
obstructive sleep apnea. SLEEP 2014;37:255-60.
13. Alonso-Álvarez ML, Terán-Santos J, Ordax-Carbajo E, Cordero-Guevara JA,
Navazo-Egüia AI, Kheirandish-Gozal L, Gozal D. Reliability of home respiratory
polygraphy for the diagnosis of sleep apnea in children. Chest 2015;147:1020-8.
14. Brouillette RT, Morielli A, Leimanis A, Waters KA, Luciano R, Ducharme FM. Nocturnal pulse oximetry as an abbreviated testing modality for pediatric obstructive sleep apnea. Pediatrics 2000;105:405-12.
15. Nixon GM, Kermack AS, Davis GM, Manoukian JJ, Brown KA, Brouillette RT. Planning adenotonsillectomy in children with obstructive sleep apnea: the role of overnight oximetry. Pediatrics 2004;113:e19-25.

13
16. Brouillette RT, Lavergne J, Leimanis A, Nixon GM, Ladan S, McGregor CD. Differences in pulse oximetry technology can affect detection of sleep-disorderd breathing in children. Anesth Analg 2002;94:S47-53.
17. Kaditis A, Kheirandish-Gozal L, Gozal D. Pediatric OSAS: Oximetry can provide answers when polysomnography is not available. Sleep Medicine Reviews 2016;27:96-105.
18. Velasco-Suarez CT, Figueroa-Turienzo JM, Len F, Mansilla E. Pulse oximetry
recording in children with adenotonsillar hypertrophy: usefulness in the diagnostic of
obstructive sleep apnea syndrome. Arch Argent Pediatr 2013;111:196e201.
19. Chang L, Wu J, Cao L. Combination of symptoms and oxygen desaturation index in
predicting childhood obstructive sleep apnea. Int J Pediatr Otorhinolaryngol
2013;77:365-71.
20. Tsai CM, Kang CH, Su MC, Lin HC, Huang EY, Chen CC, Hung JC, Niu CK, Liao
DL, Yu HR. Usefulness of desaturation index for the assessment of obstructive sleep
apnea syndrome in children. Int J Pediatr Otorhinolaryngol 2013;77:1286-90.
21. Garde A, Dehkordi P, Karlen W, Wensley D, Ansermino JM, Dumont GA.
Development of a screening tool for sleep disordered breathing in children using the
Phone OximeterTM. PLoS One 2014;9: e112959.
22. Tang KS, Man KF, Kwong S, He Q. Genetic algorithms and their applications. IEEE
Signal Proc Mag 1996;13:22-37.
23. Álvarez D, Hornero R, Marcos JV, Del Campo F. Feature selection from nocturnal
oximetry using genetic algorithms to assist in obstructive sleep apnoea diagnosis.
Med Eng Phys 2012;34:1049-57.
24. Álvarez D, Hornero R, Marcos JV, Wessel N, Penzel T, Glos M, Del Campo F.
Assessment of feature selection and classification approaches to enhance
information from overnight oximetry in the context of sleep apnea diagnosis. Int J
Neural Syst 2013; 23:1-18.
25. Iber C, Ancoli-Israel S, Chesson AL, Quan SF for the American Academy of Sleep
Medicine. The AASM Manual for the scoring of sleep and associated events. Rules,
terminology and technical specifications. 1st ed. Westchester, Illinois: American
Academy of Sleep Medicine, 2007.
26. Gutiérrez-Tobal GC, Alonso-Álvarez ML, Álvarez D, Del Campo F, Terán-Santos J,
Hornero R. Diagnosis of pediatric obstructive sleep apnea: Preliminary findings
using automatic analysis of airflow and oximetry recordings obtained at patients’
home. Biomedical Signal Processing and Control 2015;18:401-7.
27. Jobson JD. Applied multivariate data analysis. Volume I: Regression and
experimental design. New York: Springer-Verlag, 1991.
28. Richman JS and Moorman JR. Physiological time series analysis using approximate
entropy and sample entropy. Am J Physiol Heart Circ Physiol 2000;278:H203949.
29. Cohen ME, Hudson DL, Deedwania PC. Applying continuous chaotic modeling to
cardiac signals analysis. IEEE Eng Med Biol 1996;15:97-102.
30. Álvarez D, Hornero R, García M, Del Campo F, Zamarrón C. Improving diagnostic
ability of blood oxygen saturation from overnight pulse oximetry in obstructive sleep
apnea detection by means of central tendency measure. Artif Intell Med 2007;41:13-
24.
31. Álvarez D, Hornero R, Marcos JV, Del Campo F. Multivariate Analysis of Blood
Oxygen Saturation Recordings in Obstructive Sleep Apnea Diagnosis. IEEE Trans
Biomed Eng 2010;57:2816-24.

14
32. Patrinos P, Alexandridis A, Ninos K, Sarimveis H. Variable selection in nonlinear
modeling based on RBF networks and evolutionary computation. International
Journal of Neural Systems 2010;20:365-79.
33. Yom-Tov E, Inbar GF. Feature selection for the classification of movements from
single movement-related potentials. IEEE Trans Neural Systems and Rehab Eng
2002;10:170-7.
34. Siedlecki W, Sklansky J. A note on genetic algorithms for large scale feature
selection. Pattern Recognition Letters 1989;10:335-47.
35. Witten IH, Frank E, Hall MA. Data Mining Practical Machine Learning Tools and
Techniques. Burlington, MA, USA: Morgan Kaufmann/Elsevier, 2011.
36. Jobson JD. Applied multivariate data analysis. Volume II: Categorical and
multivariate methods. New York: Springer-Verlag, 1991.
37. Collop NA, Anderson WD, Boehlecke B, Claman D, Goldberg R, Gottlieb DJ, Hudhel
D, Sateia M, Schwab R. Clinical guidelines for the use of unattended portable
monitors in the diagnosis of obstructive sleep apnea in adult patients. Journal of
Clinical Sleep Med 2007;3:737-47.
38. Kirk VG, Bohn SG, Flemons WW, Remmers JE. Comparison of home oximetry
monitoring with laboratory polysomnography in children. Chest 2003; 124: 1702-
1708.
39. Pavone M, Cutrera R, Verrillo E, Salerno T, Soldini S, Brouillette RT. Night-to-night
consistency of at-home nocturnal pulse oximetry testing for obstructive sleep apnea
in children. Pediatr Pulmonol 2013;48:754e60.
40. Sahadan DZ, Davey MJ, Horne RSC, Nixon GM. Improving detection of obstructive
sleep apnoea by overnight oximetry in children using pulse rate parameters. Sleep
Breath 2015;19:1409-14.
41. Böhning N, Schultheiß B, Eilers S, Penzel T, Böhning W, Schmittendorf E.
Comparability of pulse oximeters used in sleep medicine for the screening of OSA.
Physiol Meas 2010;31:875-88.
42. Hornero R, Álvarez D, Abásolo D, Del Campo F, Zamarrón C. Utility of approximate
entropy from overnight pulse oximetry data in the diagnosis of the obstructive sleep
apnea syndrome. IEEE Trans Biomed Eng 2007;54:107-13.

15
Tables
Table 1 – Demographic and clinical
characteristics and polygraphic indexes
of the pediatric population under study.
Measure Median [IQR] Subjects (n) 50 Age (years) 4 [4, 6] Males (n) 27 (54.0%) BMI (kg/m2) 16.42 [15.00, 17.53] Recording time (h) 9.05 [8.40, 9.27] OAHIPSG (e/h) 3.56 [1.21, 17.28] OAHIHRP (e/h) 5.15 [1.27, 9.79] ODI3HRP (e/h) 1.89 [0.84, 6.03]
Prevalence
OAHIPSG ≥ 1 (e/h) 40 (80%) OAHIPSG ≥ 3 (e/h) 26 (52%) OAHIPSG ≥ 5 (e/h) 22 (44%)
IQR: interquartile range; BMI: body mass index; e/h: events per hour; OAHIPSG: obstructive apnea-hypopnea index from in-lab PSG; OAHIHRP: obstructive apnea-hypopnea index from at-home RP; ODI3HRP: oxygen desaturation index of 3% from at-home RP

16
Table 2 – Median and interquartile range for the whole OSAHS negative and OSAHS positive
groups according to the different cutoffs under study for every oximetric feature in the original
feature space.
Cutoff OAHIPSG = 1 e/h Cutoff OAHIPSG = 3 e/h Cutoff OAHIPSG = 5 e/h
OSAHSn Median [IQR]
OSAHSp Median [IQR]
p OSAHSn Median [IQR]
OSAHSp Median [IQR]
p OSAHSn Median [IQR]
OSAHSp Median [IQR]
p
Time Domain
M1t 97.3 [96.7, 97.6]
97.5 [96.8, 97.9]
0.536 97.5 [97.1, 98.0]
97.3 [96.6, 97.7]
0.171 97.5 [97.0, 98.0]
97.3 [96.5, 97.7]
0.261
M2t 0.29 [0.18, 0.43]
0.49 [0.27, 0.76]
0.163 0.30 [0.18, 0.48]
0.57 [0.40, 1.20]
<0.05 0.32 [0.18, 0.59]
0.54 [0.40, 1.20]
<0.05
M3t -2.49 [-3.32, -1.44]
-1.68 [-2.30, -0.97]
0.118 -2.14 [-3.31, -1.18]
-1.57 [-2.11, -0.87]
0.073 -1.99 [-3.19, -1.16]
-1.57 [-2.11, -0.90]
0.194
M4t 91.3 [42.3, 154.9]
41.0 [15.0, 102.9]
0.083 88.1 [34.1, 156.5]
29.8 [8.0, 72.6]
<0.05 70.5 [31.2, 146.3]
29.8 [6.3, 72.6]
<0.05
SampEn
(x10-4)
8.75 [6.46, 10.5]
11.11 [7.79, 16.50]
0.118 8.88 [6.07, 11.11]
13.61 [9.99, 17.56]
<0.05 9.30 [6.43, 12.88]
12.39 [9.99, 19.25]
<0.05
CTM (x104)
9999.93 [9999.86, 9999.95]
9999.82 [9999.57, 9999.91]
<0.05 9999.94 [999987, 9999.96]
9999.68 [9999.43, 9999.82]
<<0.05 9999.93 [9999.83, 9999.96]
9999.72 [9999.41, 9999.82]
<<0.05
Frequency Domain
M1fb (x10-2)
0.63 [0.56, 0.68]
0.77 [0.67, 0.89]
<0.05 0.67 [0.62, 0.74]
0.78 [0.69, 0.92]
<0.05 0.68 [0.62, 0.77]
0.78 [0.69, 0.92]
<0.05
M2fb (x10-6)
1.41 [0.72, 2.13]
2.25 [1.08, 3.48]
0.057 1.71 [1.17, 2.37]
2.42 [1.00, 5.56]
0.218 1.71 [1.02, 2.37]
2.74 [1.12, 5.56]
0.120
M3fb 0.55 [030, 1.22]
0.30 [-0.17, 0.68]
0.136 0.41 [0.27, 0.73]
0.15 [-0.22, 0.78]
0.210 0.38 [0.12, 0.59]
0.21 [-0.25, 0.78]
0.500
M4fb -0.71 [-0.99, 1.78]
-0.67 [-1.23, -0.11]
0.654 -0.82 [-1.28, -0.12]
-0.57 [-1.22, 0.06]
0.749 -0.85 [-1.35, -0.24]
-0.42 [-1.19, 0.13]
0.333
PAb (x10-2)
0.92 [0.67, 0.99]
1.05 [0.93, 1.22]
<0.05 0.95 [0.83, 1.05]
1.07 [0.93, 1.27]
<0.05 0.96 [0.83, 1.05]
1.12 [0.93, 1.27]
<0.05
MAb (x10-2)
0.45 [0.39, 0.53]
0.53 [0.47, 0.63]
<0.05 0.49 [0.42, 0.54]
0.56 [0.50, 0.67]
<0.05 0.49 [0.42, 0.56]
0.56 [0.50, 0.67]
<0.05
RPb 0.11 [0.10, 0.12]
0.13 [0.11, 0.15]
<0.05 0.11 [0.11, 0.13]
0.13 [0.12, 0.16]
<0.05 0.12 [0.11, 0.13]
0.13 [0.12, 0.16]
<0.05
Conventional indexes
ODI3 0.91 [0.34, 1.67]
2.73 [0.93, 6.76]
<0.05 0.87 [0.45, 1.92]
5.90 [1.82, 9.08]
<<0.05 1.04 [0.52, 2.18]
6.1 [1.95, 9.55]
<<0.05
MinSat 91.5 [90.0, 92.0]
90.0 [88.0, 92.0]
0.282 91.0 [90.0, 92.0]
89.0 [87.0, 90.0]
<0.05 91.0 [88.5, 92.0]
89.5 [87.0, 90.0]
0.052
AvgSat 97.0 [96.0, 98.0]
97.0 [96.4, 98.0]
0.804 97.0 [97.0, 98.0]
97.0 [96.0, 97.7]
0.212 97.0 [97.0, 98.0]
97.0 [96.0, 97.7]
0.255
CT90 0 [-, -]
0.0 [0.0, 0.2]
0.260 0 [-, -]
0.05 [0.0, 0.69]
<0.05 0.0 [0.0, 0.07]
0.02 [0.0, 0.69]
0.120
CT95 0.34 [0.11, 0.77]
0.98 [0.23, 3.73]
0.139 0.36 [0.08, 1.17]
1.62 [0.57, 7.18]
<0.05 0.42 [0.08, 1.41]
1.41 [0.57, 7.18]
<0.05
OAHIPSG: obstructive apnea-hypopnea index from in-lab PSG; OSAHS: obstructive sleep apnea-hypopnea syndrome;
OSAHSn: OSAHS negative group; OSAHSp: OSAHS positive group; IQR: interquartile range; p: p-value from the Mann-
Whitney nonparametric test; M1t – M4t: mean (M1), variance (M2), skewness (M3), and kurtosis (M4) in the time domain;
SampEn: sample entropy; CTM: central tendency measure; M1fb – M4fb: mean (M1), variance (M2), skewness (M3), and
kurtosis (M4) in frequency band of interest; PAb: peak amplitude in frequency band of interest; MAb: minimum amplitude
in frequency band of interest; RPb: relative power in frequency band of interest; ODI3: oxygen desaturation index greater
than or equal to 3%; MinSat: minimum saturation; AvgSat: average saturation; CT90 – CT95: cumulative time with a
saturation below 90% and 95%, respectively.

17
Table 3 – Optimum feature subsets from the GAs-based feature selection approach for each
cutoff for childhood OSAHS under study.
Cutoff for childhood OSAHS # variables Optimum features OAHIPSG = 1 e/h 6 M1t, M2t, M3t, M4t, M3fb, RPb OAHIPSG = 3 e/h 6 M1t, M2t, M4fb, PAb, RPb, ODI3 OAHIPSG = 5 e/h 7 M3t, M4fb, PAb, MAb, RPb, SampEn, ODI3
OSAHS: obstructive sleep apnea-hypopnea syndrome; OAHIPSG: obstructive apnea-hypopnea index from in-lab PSG; M1t – M4t: mean (M1), variance (M2), skewness (M3), and kurtosis (M4) in the time domain; SampEn: sample entropy; M3fb, M4fb: skewness (M3) and kurtosis (M4) in frequency band of interest; PAb: peak amplitude in frequency band of interest; MAb: minimum amplitude in frequency band of interest; RPb: relative power in frequency band of interest; ODI3: oxygen desaturation index greater than or equal to 3%.

18
Table 4 – Diagnostic performance using a bootstrap approach of each LR model composed of
optimum feature subsets from genetic algorithm feature selection.
Cutoff OAHIPSG = 1 e/h
Se (%) Sp (%) PPV (%) NPV (%) LR+ LR- Acc (%) AUC
LRHOX(6) 89.6 (63.8, 1)
71.5 (28.3, 1)
92.5 (78.2, 1)
66.8 (16.6, 1)
4.37 (1.88, 8.23)
0.18 (0, 0.64)
85.5 (66.4, 96.6)
0.97 (0.89, 1)
OAHIHRP 71.3 (52.5, 90.4)
88.2 (43.8, 1)
96.1 (80.2, 1)
43.4 (17.5, 72.7)
3.62 (1.64, 7.07)
0.35 (0.12, 0.78)
74.6 (57.0, 88.9)
0.78 (0.63, 0.91)
ODI3HRP 64.3 (39.6, 92.3)
73.1 (21.0, 1)
91.6 (74.7, 1)
33.8 (7.4, 64.0)
2.28 (1.02, 5.13)
0.52 (0.18, 1.06)
65.9 (47.5, 83.0)
0.75 (0.58, 0.90)
Cutoff OAHIPSG = 3 e/h
Se (%) Sp (%) PPV (%) NPV (%) LR+ LR- Acc (%) AUC
LRHOX(6) 82.9 (56.5, 1)
84.4 (51.5, 1)
86.2 (61.3, 1)
82.2 (57.4, 1)
7.40 (2.39, 15.78)
0.22 (0, 0.64)
83.4 (64.2, 96.8)
0.96 (0.88, 1)
OAHIHRP 86.1 (59.8, 1)
84.2 (59.6, 1)
86.1 (65.2, 1)
85.6 (63.3, 1)
6.7 (2.39, 14.96)
0.16 (0, 0.42)
85.0 (71.6, 95.5)
0.93 (0.86, 0.98)
ODI3HRP 71.8 (43.6, 98.2)
77.6 (38.5, 1)
79.7 (53.4, 1)
72.8 (49.2, 97.4)
3.93 (1.47, 11.81)
0.36 (0.03, 0.72)
74.5 (58.5, 88.7)
0.85 (0.73, 0.94)
Cutoff OAHIPSG = 5 e/h
Se (%) Sp (%) PPV (%) NPV (%) LR+ LR- Acc (%) AUC
LRHOX(7) 82.2 (54.1, 1)
83.6 (55.7, 1)
80.8 (52.8, 1)
85.9 (62.7, 1)
8.48 (2.35, 17.48)
0.23 (0, 0.64)
82.8 (64.5, 96.3)
0.97 (0.89, 1)
OAHIHRP 83.6 (58.8, 1)
86.4 (59.2, 1)
84.5 (57.2, 1)
87.8 (71.5, 1)
7.04 (2.31, 17.16)
0.19 (0, 0.44)
85.1 (71.6, 95.9)
0.95 (0.87, 0.99)
ODI3HRP 72.7 (45.9, 97.3)
79.9 (45.9, 1)
76.7 (47.4, 1)
79.4 (61.4, 97.9)
4.80 (1.55, 14.81)
0.34 (0.03, 0.68)
76.7 (59.2, 90.9)
0.84 (0.71, 0.95)
OAHIPSG: obstructive apnea-hypopnea index from in-lab PSG; e/h: events per hour; LRHOX: logistic regression model from
at-home oximetry; OAHIHRP: obstructive apnea-hypopnea index from at-home respiratory polygraphy; ODI3HRP: oxygen
desaturation index of 3% from at-home respiratory polygraphy; Se: sensitivity; Sp: specificity; PPV: positive predictive
value; NPV: negative predictive value; LR+: positive likelihood ratio; LR- negative likelihood ratio; Acc: accuracy; AUC:
area under the receiver operating characteristic curve.
19
Figures
Figure 1 – Averaged PSD functions of the OSAHS negative and the OSAHS positive groups from
the whole population under study and p-value vs. frequency plots looking for significant statistical
differences between groups (p <0.05) for each cutoff: (a)-(b) OAHIPSG≥1 e/h, (c)-(d) OAHIPSG≥3
e/h, (e)-(f) OAHIPSG≥5 e/h. The region between dashed lines in figures from the left panel
represents the frequency region in which significant differences were achieved for each particular
cutoff (BWthx), whereas the grey region shows the single frequency band of interest.
OAHIPSG: obstructive apnea-hypopnea index from in-lab PSG; e/h: events per hour; PSD: power spectral density; BW thx:
spectral band of interest reaching statistical significant differences for the specified particular cutoff; OSAHS: obstructive
sleep apnea-hypopnea syndrome; OSAHS negative: OSASH negative group; OSAHS positive: OSASH positive group;