automated particle analysis of aerosols formed during...
TRANSCRIPT

© ZFE / FELMI TU Graz
Automated particle analysis of aerosols Automated particle analysis of aerosols formed during biomass combustion by formed during biomass combustion by
SEM/EDXSEM/EDXSS
DI Stefan Mitsche
Austrian Centre Austrian Centre for Electron Microscopyfor Electron Microscopyand and NanoanalysisNanoanalysis

© ZFE / FELMI TU Graz
OverviewOverview
General information about SEM
Fundamentals of particle analysis
Principles of the automated particle analysis (APA)
APA of aerosols from biomass plants

© ZFE / FELMI TU Graz
The Scanning electron microscopeThe Scanning electron microscopePrimary electrons (up to 30keV)
Augerelectrons (AE) Cathodoluminescence (CL)
SEM images:• Secondary electrons (SE)• Backscattered electrons (BSE)
Characteristic x-rays (EDXS)
Specimen current
Electron-specimen interaction and generated signals

© ZFE / FELMI TU Graz
Monte Carlo simulations of electron scattering of an 100 nm particle of:left K2SO4 and right PbCl2E0 = 7 keV
Monte Carlo simulations of electron scattering of an 100 nm particle of PbCl2:left E0 = 20 keV and right E0 = 7 keV
The Scanning electron microscopeThe Scanning electron microscope

© ZFE / FELMI TU Graz
Fundamentals of particle analysis Fundamentals of particle analysis
pure chemicals (K2SO4, PbSO4 and PbCl2) were ground in a ball mill
suspended in pure sec-butanolfiltered through a 3 µm Nucleopore filterthe filtrate was filtered through a 0.05 µm (C-
coated) Isopore poly-carbonate filter
Experimental
top: in-lens image (SEI); bottom: BSE image (BSE) PbSO4-particles
1 µm

© ZFE / FELMI TU Graz
EDX-detector
x-ray yield
in-lens detector
BSE detector
objective lens
The Scanning electron microscopeThe Scanning electron microscope
primary electrons
Instrumentation:
Zeiss DSM 982 Gemini
Noran Voyager EDX-detector, 30 mm2 Si(Li), ultrathin window

© ZFE / FELMI TU Graz
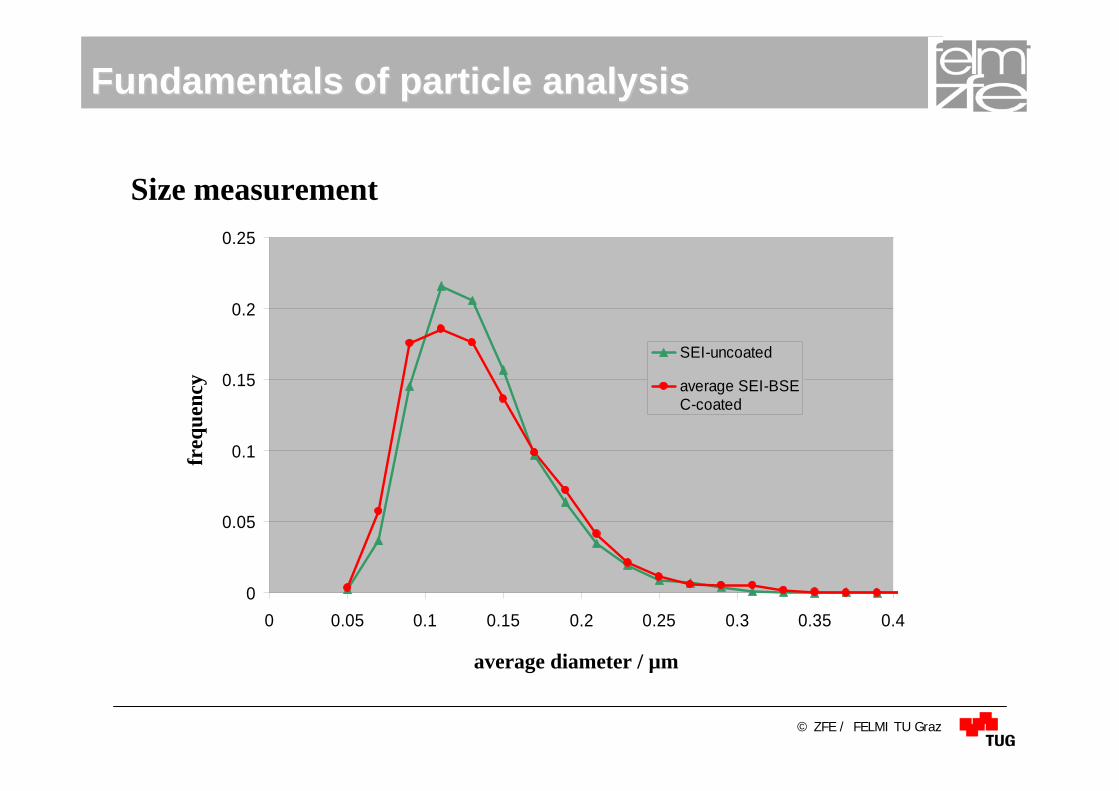
Fundamentals of particle analysis Fundamentals of particle analysis
Size measurement
Influence of the coating of the particles on the measured particle size

© ZFE / FELMI TU Graz
Fundamentals of particle analysis Fundamentals of particle analysis
Size measurement
yellow: SEI-signalgreen: BSE-signalparticle: PbCl2no coatingacc. voltage: 7 keV
yellow: SI-signalgreen: BSE-signalparticle: PbCl2carbon coatingacc. voltage: 7 keV

© ZFE / FELMI TU Graz
Fundamentals of particle analysis Fundamentals of particle analysis
Size measurement
Influence of mean atomic number of the particles on the measured particle size
© ZFE / FELMI TU Graz
0
0.05
0.1
0.15
0.2
0.25
0 0.05 0.1 0.15 0.2 0.25 0.3 0.35 0.4
SEI-C-coated
BSE-C-coated
SEI-uncoated
BSE-uncoated
0
0.05
0.1
0.15
0.2
0.25
0 0.05 0.1 0.15 0.2 0.25 0.3 0.35 0.4
SEI-uncoated
average SEI-BSEC-coated
Fundamentals of particle analysis Fundamentals of particle analysis
Size measurement
average diameter / µm
freq
uenc
y

© ZFE / FELMI TU Graz
a)
1 µm
a)
b)
X-ray analysis of biomass fly ash particle (E0 = 7 keV, Ip = 0.7 nA);a) image of particles with the analysis spot marked by a cross (SE – image)b) x-ray spectra
Fundamentals of particle analysis Fundamentals of particle analysis
Chemical composition

© ZFE / FELMI TU Graz
K2SO4 particles: measured ratio of K (at%) / S (at%), in dependence on both the type of the substrate and the coating (spot analysis, E0 = 7 keV, Ip = 0.7 nA; spectra at 10s and 60s stored without any interruption; mean particle diameter: 400 nm)
Fundamentals of particle analysis Fundamentals of particle analysis
Chemical composition

© ZFE / FELMI TU Graz
Fundamentals of particle analysis Fundamentals of particle analysis
Chemical composition
Automated analysis of standard particles: K2SO4 , PbSO4 and PbCl2

© ZFE / FELMI TU Graz
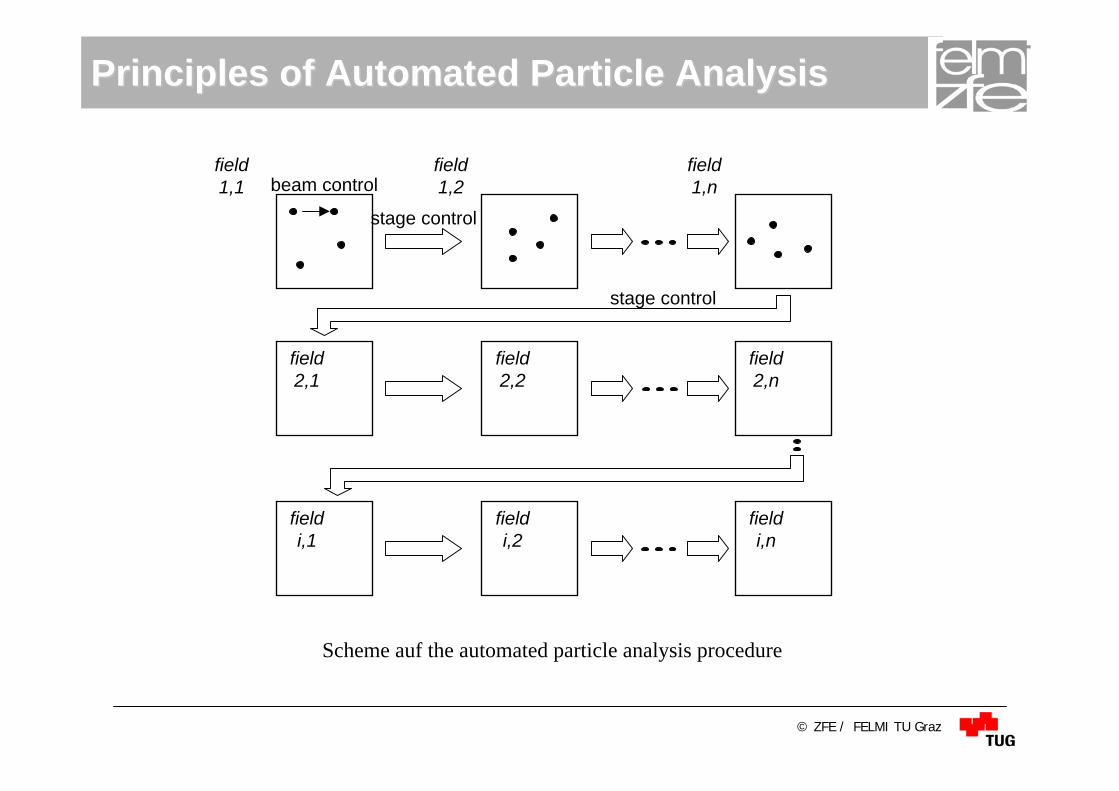
Principles of Automated Particle AnalysisPrinciples of Automated Particle Analysis
binary imagesBSE image
image width 3.8 µm
SEI-image
© ZFE / FELMI TU Graz
field1,1 beam control
stage control
field1,2
field1,n
stage control
field2,1
field2,2
field2,n
fieldi,1
fieldi,n
fieldi,2
Principles of Automated Particle AnalysisPrinciples of Automated Particle Analysis
Scheme auf the automated particle analysis procedure

© ZFE / FELMI TU Graz
Automated Particle Analysis of aerosolsAutomated Particle Analysis of aerosols
waste wood bark
Size distribution of aerosols (fuel: waste wood, bark)

© ZFE / FELMI TU Graz
Automated Particle Analysis of aerosolsAutomated Particle Analysis of aerosols
waste wood bark
0.0 0.1 0.2 0.3 0.4 0.5 0.6 0.70
10
20
30
40
50
60
average diameter / µm
wt% Pb
0.0 0.1 0.2 0.3 0.4 0.5 0.6 0.70
20
40
60
80
average diameter / µm
wt% K
0.0 0.1 0.2 0.3 0.4 0.5 0.6 0.70
10
20
30
40
50
60
wt% Pb
average diameter / µm
0.0 0.1 0.2 0.3 0.4 0.5 0.6 0.70
20
40
60
80
wt% K
average diameter / µm
Concentrations of Pb and K in dependence on the diameter of the aerosols (fuel: waste wood, bark)

© ZFE / FELMI TU Graz
Automated Particle Analysis of aerosolsAutomated Particle Analysis of aerosols
waste wood bark
0 10 20 30 40 50 600
10
20
30
40
50
60
wt% Cl
wt% Pb
0 10 20 30 40 50 600
10
20
30
40
50
60
wt% S
wt% Pb
0 10 20 30 40 50 600
10
20
30
40
50
60
wt% Pb
wt% Cl
0 10 20 30 40 50 600
10
20
30
40
50
60
wt% Pb
wt% S
Correlations between various elements for aerosols (fuel: waste wood, bark)

© ZFE / FELMI TU Graz
Automated Particle Analysis of aerosolsAutomated Particle Analysis of aerosols
waste wood bark
Correlations between various elements for aerosols (fuel: waste wood, bark)
0 20 40 60 800
20
40
60
80
wt% S
wt% K
0 20 40 60 800
20
40
60
80
wt% Cl
wt% K
0 20 40 60 800
20
40
60
80
wt% K
wt% S
0 20 40 60 800
20
40
60
80
wt% K
wt% Cl

© ZFE / FELMI TU Graz
Automated Particle Analysis of aerosolsAutomated Particle Analysis of aerosols
0.0 0.5 1.0 1.5 2.0 2.5 3.0 3.5 4.00
100
200
300
400
500spot 1spot 2
C O
NaZn
SPb
ClK
energy / keV
counts
SE-image (image width: 0.29 µm) of an aerosol particle (left) and the EDXS – spectra (right) at the 2 spots marked in the image

© ZFE / FELMI TU Graz
SummarySummary
If only the particle size is of interest, uncoated particles and the use of the in-lens detector is recommended.
In case of carbon coated particles the average of the sizes obtained from images of the in-lens and the BSE-detector have to be used
Automated analysis of aerosols with SEM/EDXS is possible down to particle diameters of about 50 -100 nm depending on the chemical composition

© ZFE / FELMI TU Graz
Institute for Electron Microscopy:Prof. Ferdinand Hofer
Dr. Peter PoeltDr. Mario Schmied
Institute for Resource Efficient and Sustainable Systems:Prof. Ingwald Obernberger
DI Thomas Brunner DI Markus Jöller
AcknowledgementAcknowledgement