automated method for detection and quantification of
TRANSCRIPT
Automated method for detection and quantification of building
damage and debris using post-disaster LiDAR data
Richard C. Labiaka,b
, Jan A.N. van Aardta, Dmitry Bespalov
a, Darryl Eychner
a, Erin Wirch
a, Hans-
Peter Bischofa
aRochester Institute of Technology, Chester F. Carlson Center for Imaging Science, Digital Imaging
and Remote Sensing Laboratory, 54 Lomb Memorial Drive, Rochester, NY USA 14623 bAir Force Institute of Technology Civilian Institution Program, 2950 Hobson Way, Wright-
Patterson Air Force Base, OH USA 45433
ABSTRACT
There is a growing need for rapid and accurate damage and debris assessment following natural disasters, terrorist
attacks, and other crisis situations. This research enhances existing algorithms for LiDAR point classification
(ground/non-ground), feature classification (buildings, vegetation, roads, etc.), and seeks to develop new algorithms for
building damage and debris detection and quantification—work evaluated using LiDAR data of Port-au-Prince, Haiti,
collected by RIT just days after the January 12, 2010 earthquake. Normalized height, height variation, intensity, and
multiple return information are among the parameters being used to develop rules for building extraction and vegetation
removal. Various approaches are being explored to perform damage assessment, with a focus on the slope and texture of
roof planes. Initial results show a general over-segmentation in a 457x449 m region-of-interest (ROI)—the building
detection algorithm autonomously identified 206 buildings, while only 98 buildings actually exist in the ROI. Further,
four buildings went completely undetected. The accuracy of the damage detection algorithm was assessed only in
regions where the building detection algorithm results overlapped actual building locations. The overall damage
detection accuracy was 73.40%, but with a low Kappa accuracy of k = 0.275. The algorithms will be implemented in a
common programming language where the processing will be optimized for large data sets. The goal is for the
operational tool to be implemented in the field, using available equipment in a close to real-time environment.
Keywords: LiDAR, building damage, debris assessment, point classification, feature classification, building
segmentation, disaster management
1. INTRODUCTION
On January 12, 2010 at 4:53 PM local time, the Haiti region experienced a magnitude 7.0 earthquake that killed an
estimated 230,000 people, injured 300,000, and displaced 1.6 million from their damaged or destroyed homes1. This
natural disaster caused severe to extreme damage in the Port-au-Prince area, Haiti’s capital, which was located 15 miles
from the epicenter. According to the United States Geological Survey (USGS), 97,294 houses were destroyed and
188,383 were damaged in Port-au-Prince and in much of southern Haiti2. In the days following the earthquake,
individuals and organizations from around the world descended upon Haiti to help search for survivors, provide food,
water, medicine, and shelter, and start the rebuilding effort.
The sheer scale of disasters like Haiti, and more recently the magnitude 9.0 earthquake and tsunami affecting Japan,
present rescuers with a seemingly overwhelming task. Roads are often impassable and damage to ports and airfields,
combined with the influx of humanitarian relief and military aid, result in a myriad of logistical challenges. Whether it is
a natural disaster, terrorist attack, or other crisis situation, there is a common and growing need for rapid aerial imagery
of the affected region to aid in disaster management. Information products, e.g., fast and extensive damage assessment,
must be derived from such imagery in order to efficiently direct emergency response activities. This increased situational
awareness can help to determine where first responders and relief workers should be sent and how to prioritize their
efforts. It also informs those on the ground about the relative safety of areas and structures, and in the case of Haiti,
where displaced personnel camps should be constructed.
Though there are several remote sensing imaging systems that could be employed in crisis situations, one technology is
quickly emerging as an effective approach for assessing structural damage. LiDAR systems have become a primary data
source for digital terrain model (DTM) generation and three-dimensional (3D) city models3. LiDAR data inherently
provides precise and reliable elevation information, and thus the capability to identify and measure collapsed and
standing buildings. In addition, the data can be acquired at night or in adverse conditions, such as in poor illumination or
through clouds and smoke. Finally, LiDAR sensors provide extensive coverage so large affected areas can be remotely
sensed. The 3D data products, often used to complement image-based modalities, have become increasingly important in
a wide range of applications in civil engineering, environmental protection and planning, and more recently, emergency
response3.
The application of LiDAR data to detect and quantify building damage is part of a relatively new field of research and
relies primarily on the ability to accurately extract building features from the data set. The majority of work to date has
been concerned with building detection, extraction, and reconstruction, with scientists extracting 3D building models
from airborne LiDAR data since the mid-1990s. Maas and Vosselman (1999) proposed two approaches for the automatic
derivation of building models from a point cloud, based on the analysis of invariant moments and the intersection of
planar faces4. However, as the diversity of sensors has increased over time, the trend has been to fuse LiDAR data with
other imaging modalities. LiDAR is typically combined with high-resolution satellite or aerial imagery to aid in building
detection and can further be used with ground plans, the latter giving insight to building footprints and road layouts. In
addition, the fusion of multispectral and hyperspectral imagery with LiDAR data can help classify features in a scene,
with one example being the use of normalized difference vegetation index (NDVI) to detect trees and shrubs. Such
fusion techniques have been employed by a host of studies5,6,7,8
.
Algorithm developments have been complemented by an evolution in sensor technology, as the point cloud density
acquired by LiDAR systems has increased; this has made the data even more valuable in mapping urban environments
and assessing damage. To date, much of the work investigating building damage following a disaster has been performed
using change detection9,10
. This approach requires both pre- and post-disaster LiDAR data sets of the affected area,
which is not always feasible. For example, pre-earthquake LiDAR data were simply not available in the case of Haiti.
Such restrictions have led to research to automatically detect building roof planes from a post-event point cloud, to later
be used in building damage classifiers11
.
Disaster management has become increasingly important worldwide in recent years, given the prevalence of natural and
man-made disasters. The objective of this work is to develop an end-to-end operational tool that will ingest a LiDAR
point cloud of a post-disaster scene, and autonomously output a building damage map showing damaged and collapsed
buildings. If generated in a close to real-time environment using available equipment in the field, the resulting
information product will be invaluable to managing disaster response. The tool will eventually be implemented in Java,
where the processing will be optimized for large data sets.
2. DATA
2.1 Haiti earthquake LiDAR data set
The building damage assessment tool is being developed and tested using post-earthquake LiDAR data of the Port-au-
Prince area. The data were collected January 21-27, 2010 by the Rochester Institute of Technology (RIT) through a
partnership with Kucera International and ImageCat Inc. and sponsorship by the World Bank. The Leica ALS60 airborne
laser scanner, provided by Kucera International, was operated at pulse rates up to 150 kHz, with a vertical placement
accuracy of approximately 11 cm. The point cloud density is roughly 2-5 points per square meter over the capitol city.
The data were processed and delivered by Kucera in LAS file format, containing the x, y, z location for each return, the
return intensity, return number, number of returns, and the classification (either ground, non-ground, or noise). The latter
was generated by Kucera International using Terrasolid software's slope-based ground return classifier. RIT also
operated their Wildfire Airborne Sensor Program (WASP) sensor during the collect, so 0.15 m resolution visible (RGB)
imagery is available and co-located with the LiDAR data.
2.2 Study area
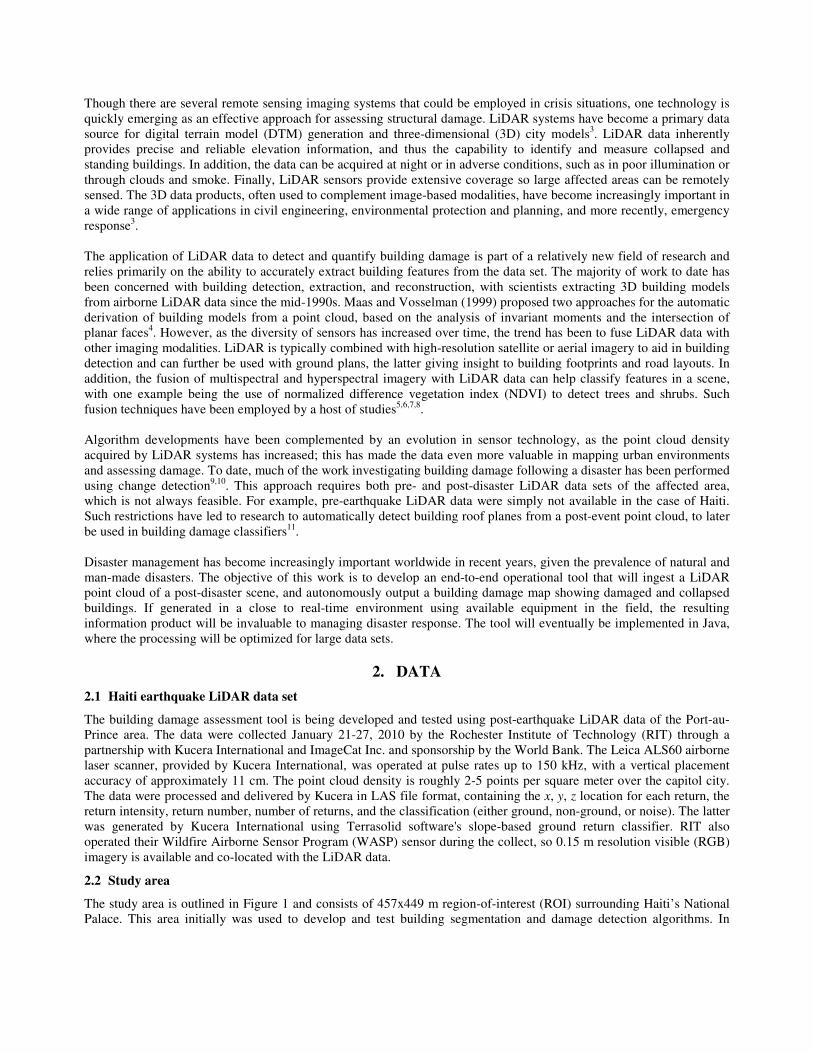
The study area is outlined in Figure 1 and consists of 457x449 m region-of-interest (ROI) surrounding Haiti’s National
Palace. This area initially was used to develop and test building segmentation and damage detection algorithms. In
addition to containing the iconic Haitian landmark, the ROI was chosen for its assortment of building shapes and sizes,
as well as its varying levels of damage, ranging from undamaged to collapsed buildings. Future efforts will extend
algorithm development to areas with varying topography and building shapes/sizes.
Figure 1. WASP imagery of the region-of-interest surrounding the National Palace. The ROI used in algorithm
development and testing is outlined in white.
3. LIDAR POINT CLOUD PREPROCESSING
Preprocessing of the LiDAR data must first be performed in order to remove outlier points and eliminate the effect of the
terrain: before buildings can be identified and damage detected, the point cloud must accurately reflect height above
ground. In the first preprocessing step, gross outlier points such as bird hits and noise were removed by thresholding the
point cloud by three standard deviations above and below the mean. With the outlier points removed, a DTM could be
created that represents the ground surface topography. This step is essential in order to reference the LiDAR points
above ground and thereby remove the effect of varying topography.
The second preprocessing step involves extracting ground points from the point cloud and interpolating those points to
create a DTM. Separating ground from non-ground returns can be challenging. A variety of autonomous classification
algorithms exist that can be employed in this situation, such as morphology filters, statistical interpolation, or slope-
based filters12
. The Haiti data set includes a vendor-supplied classification, which this research is currently leveraging. In
the future, a classification algorithm will be added to the operational tool, since processed LiDAR data will not always
include vendor classification. The additional processing requires time and money, two resources that are scarce in crisis
situations. Using the supplied classification, the scattered ground points were interpolated on a 1 m resolution grid using
Delaunay triangulation, effectively creating the DTM.
The DTM is then subtracted from the point cloud to create the height model in the last preprocessing step. Two options
were considered when creating the height model. The first was to subset the full point cloud to only first return points
and interpolate these onto a 1 m grid. First returns represent the first surface with which the pulse interacts, which
implies that this interpolated surface is the top-most feature surface. The DTM can then be subtracted from the surface
model, leaving a rasterized set of points referenced to the ground. The second option is a point-based approach, which
uses the points classified as "non-ground". For each non-ground point, the x, y location in the DTM grid that is closest to
the x, y position of the point is found. The height of the terrain at that location is then subtracted from the height of each
point. This point-based approach was used to create the height model, since it results in a denser point cloud, which is
later needed to quantify building damage. Also, unlike the raster approach it does not use interpolation, which could lead
to spurious data points.
4. METHODOLOGY
4.1 Building segmentation
Prior to the detection of building damage, the height model must be segmented to identify building points. The first step
in this process was to remove any points below 1 m. This follows the assumption that no buildings will be less than 1 m
tall. Even if a building is completely collapsed, it is still assumed that the debris pile will rise above 1 m. When this
threshold was implemented on the ROI, 49.9% of the LiDAR points were removed from the height model. With the
ground, roads, curbs, shrubs, cars, etc. removed, one can be fairly certain that the remaining point cloud consists of
either building points or vegetation points.
Next, the 3D point cloud was gridded and a variety of operations were performed on the points located within each cell.
Based on 0.5 m, 1 m, 2 m, and 5 m trials, it was determined that the optimum grid size for the point density of the data
was 1 m. The 0.5 m grid produced images with empty cells and took twice as long to process. The 2 m and 5 m cell sizes
blurred building edges, and resulted in a loss of structure. For each 1x1 m cell, the metrics evaluated were maximum
height, average intensity, normalized intensity, number of multiple returns, and height variance. The resulting raster-like
outputs were termed “zonal attribute matrices” and were assessed for their utility in removing non-building points.
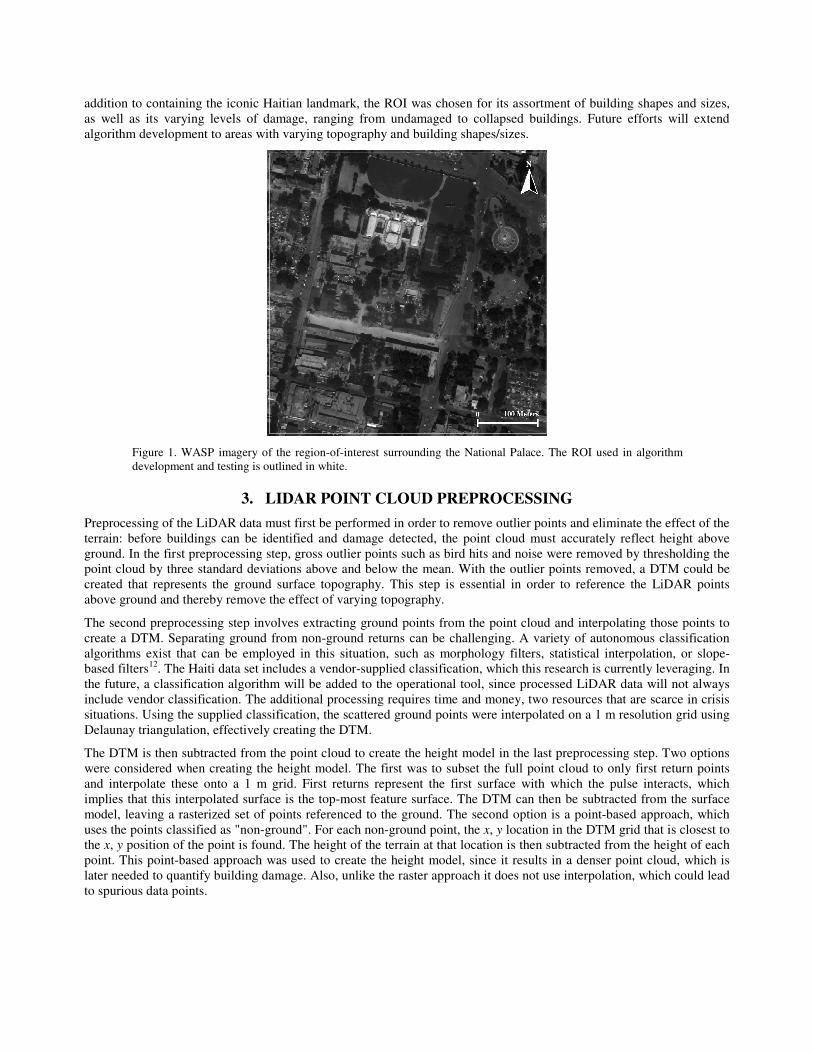
Unlike any of the other zonal attribute matrices, building pixels in the normalized intensity image had a relatively
constant intensity value, regardless of height, building size, or building material. This can be seen in Figure 2a, where
building pixels generally have intensity values greater than 0.9, which makes the buildings relatively more distinct when
compared to vegetation in the scene. The other useful metric, shown in Figure 2b, turned out to be the number of
multiple returns. As expected, the total number of multiple returns image clearly shows the location of the trees in the
ROI, where a laser at 1064 nm could interact with canopy and below-canopy material.
(a) (b)
Figure 2. Normalized intensity image (a) and multiple return image (b) that were used as part of the building
segmentation algorithm.
A threshold was then calculated for the normalized intensity image using Otsu’s global thresholding method. This
technique uses the image histogram to autonomously select a threshold value that maximizes the between-class variance
of two classes of pixels13
. The threshold for the ROI was determined to be 0.498 and all the pixels with normalized
intensity values below that level were set to zero. The multiple return image was then smoothed using a 3x3 median
filter and a binary mask was created. The multiple return mask was applied to the normalized intensity image, effectively
removing the majority of the vegetation.
Morphological processes were then applied to the resulting image, starting with an erosion operation using a ball-shaped
structuring element. Regions of the image that could not contain the structuring element, for instance the majority of the
remaining vegetation pixels, were completely removed. An opening operation using a square structuring element was
performed to reduce the number of leftover vegetation pixels, or noise, smooth the building edges, and remove thin
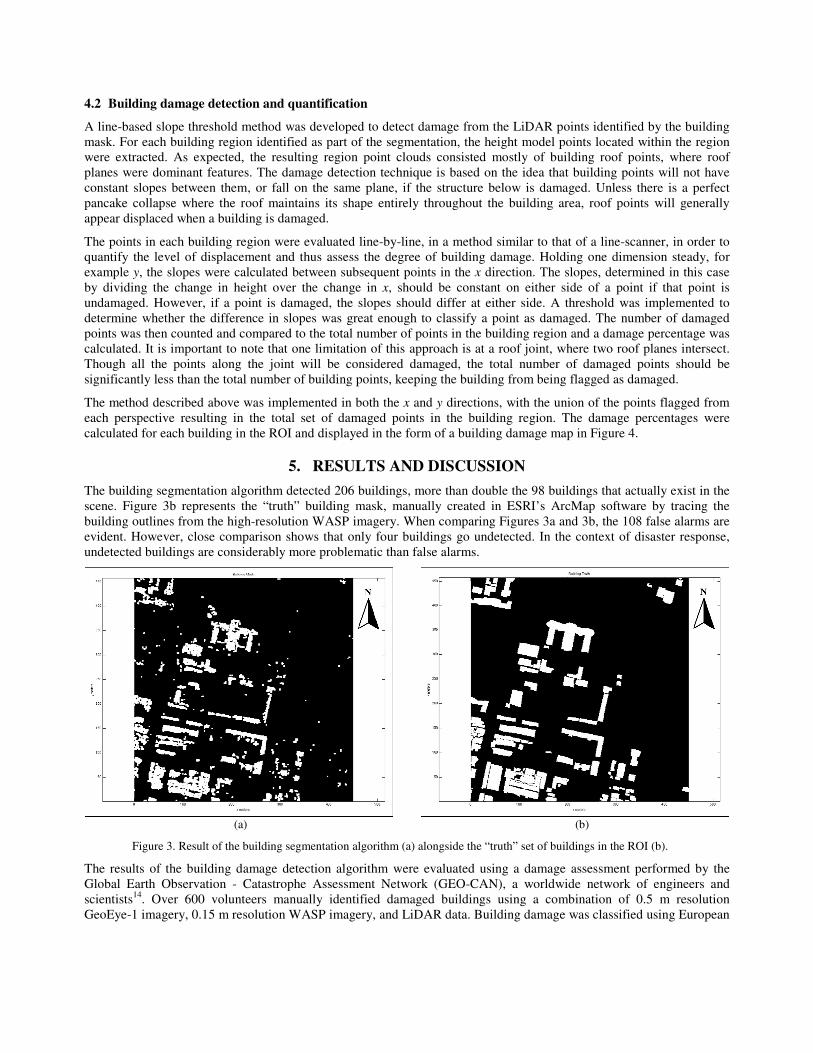
connections. The resulting building mask (Figure 3a) is the product of the building segmentation algorithm and is shown
alongside a hand-digitized building reference map in Figure 3.
4.2 Building damage detection and quantification
A line-based slope threshold method was developed to detect damage from the LiDAR points identified by the building
mask. For each building region identified as part of the segmentation, the height model points located within the region
were extracted. As expected, the resulting region point clouds consisted mostly of building roof points, where roof
planes were dominant features. The damage detection technique is based on the idea that building points will not have
constant slopes between them, or fall on the same plane, if the structure below is damaged. Unless there is a perfect
pancake collapse where the roof maintains its shape entirely throughout the building area, roof points will generally
appear displaced when a building is damaged.
The points in each building region were evaluated line-by-line, in a method similar to that of a line-scanner, in order to
quantify the level of displacement and thus assess the degree of building damage. Holding one dimension steady, for
example y, the slopes were calculated between subsequent points in the x direction. The slopes, determined in this case
by dividing the change in height over the change in x, should be constant on either side of a point if that point is
undamaged. However, if a point is damaged, the slopes should differ at either side. A threshold was implemented to
determine whether the difference in slopes was great enough to classify a point as damaged. The number of damaged
points was then counted and compared to the total number of points in the building region and a damage percentage was
calculated. It is important to note that one limitation of this approach is at a roof joint, where two roof planes intersect.
Though all the points along the joint will be considered damaged, the total number of damaged points should be
significantly less than the total number of building points, keeping the building from being flagged as damaged.
The method described above was implemented in both the x and y directions, with the union of the points flagged from
each perspective resulting in the total set of damaged points in the building region. The damage percentages were
calculated for each building in the ROI and displayed in the form of a building damage map in Figure 4.
5. RESULTS AND DISCUSSION
The building segmentation algorithm detected 206 buildings, more than double the 98 buildings that actually exist in the
scene. Figure 3b represents the “truth” building mask, manually created in ESRI’s ArcMap software by tracing the
building outlines from the high-resolution WASP imagery. When comparing Figures 3a and 3b, the 108 false alarms are
evident. However, close comparison shows that only four buildings go undetected. In the context of disaster response,
undetected buildings are considerably more problematic than false alarms.
(a) (b)
Figure 3. Result of the building segmentation algorithm (a) alongside the “truth” set of buildings in the ROI (b).
The results of the building damage detection algorithm were evaluated using a damage assessment performed by the
Global Earth Observation - Catastrophe Assessment Network (GEO-CAN), a worldwide network of engineers and
scientists14
. Over 600 volunteers manually identified damaged buildings using a combination of 0.5 m resolution
GeoEye-1 imagery, 0.15 m resolution WASP imagery, and LiDAR data. Building damage was classified using European

Macroseismic Scale 1998 criteria, where safe structures are graded 1-3, heavily damaged structures are given a grade of
4, and collapsed buildings are grade 515
.
Figure 4. Building damage map showing the relative damage of each building in the ROI. The grayscale colorbar
represents the scale in terms of percent damage, where lighter shades correspond to greater levels of damage.
To evaluate the building damage map in Figure 4, a 16% damage threshold was chosen to separate relatively safe or
grade 1-3 buildings, from heavily damaged or collapsed grade 4-5 buildings. The results were then compared to the
GEO-CAN validation data using a confusion matrix. The accuracy assessment, summarized in Table 1, provides the
number of classified and misclassified buildings in terms of both buildings and percentages. The assessment was
performed on the 94 correctly detected buildings.
Table 1. Confusion matrix assessing the accuracy of the damage assessment and quantification algorithm.
Reference Data
Building Damage Grade 1 - 3 4 - 5 Row Total User's Accuracy
1 - 3 59 16 75 78.67%
4 - 5 9 10 19 52.63%
Column Total 68 26 94
Producer's Accuracy 86.76% 38.46%
Overall Accuracy 73.40%
Kappa Statistic 0.2751
The results show that the damage detection algorithm performed relatively well at classifying buildings with less
damage, as it correctly identified 59 out of 68 (86.76%) grade 1-3 buildings in the ROI. Only 10 out of the 26 (38.46%)
grade 4-5 buildings were correctly classified, hence the algorithm is missing and under-classifying heavy damage. The
overall classification accuracy is 73.40% and the Kappa accuracy is k = 0.275. It is important to note that the building
segmentation and damage detection algorithms were assessed only on the one ROI, so future efforts will extend the
study area to encompass other regions of interest.
The results can be attributed in part to the building segmentation step: in a few cases the segmentation algorithm
clumped multiple buildings into one building region. Such under-segmentation often results in segments with damaged
points corresponding to one or two damaged buildings, but not enough points to flag the region as damaged when the
whole, large segment was evaluated. Future work will focus on better segmentation of the building regions and
development of supplementary damage detection metrics. The line-based slope threshold method appeared to work well,
but additional texture metrics such as a variance calculation will most likely improve especially the detection of heavy
damage and the overall Kappa results.
There is also an ongoing effort to implement improved algorithms in Java using efficient data structures and parallel
computing. In the disaster response environment, fast processing of large amounts of data is critical. Initial results show
that a LAS file of 100 MB can be processed in 10 seconds on average. This result was unachievable using MATLAB,
the initial algorithm development and testing environment. We believe that the eventual development, testing, and
operationalization of this LiDAR-based building damage assessment tool will greatly contribute to relief efforts during
future disaster events.
ACKNOWLEDGEMENTS
The Haiti LiDAR data were supplied through a RIT partnership with ImageCat Inc. and Kucera International, and was
sponsored by the World Bank. ImageCat also provided the GEO-CAN damage assessment validation data. Funding
support for this research was provided by a Google Faculty Research Award and a National Science Foundation
Partnerships for Innovation grant (award #0917839).
DISCLAIMER
The views expressed in this proceedings paper are those of the authors and do not reflect the official policy or position of
the United States Air Force, Department of Defense, or the United States Government.
REFERENCES
[1] http://www.usaid.gov/ht/docs/eqdocs/ofda_fact_sheets/08.06.10_haiti_factsheet_66.pdf
[2] http://earthquake.usgs.gov/earthquakes/eqinthenews/2010/us2010rja6/#summary
[3] Forlani G., Nardinocchi, C., Scaioni, M. and Zingaretti, P., “Complete classification of raw LiDAR data and 3D
reconstruction of buildings,” Pattern Analysis & Applications 8, 357–374 (2006).
[4] Maas, H.G. and Vosselman, G., “Two algorithms for extracting building models from raw laser altimetry data,”
ISPRS Journal of Photogrammetry and Remote Sensing 54, 153–163 (1999).
[5] Haala, N. and Brenner, C., “Extraction of buildings and trees in urban environments,” ISPRS Journal of
Photogrammetry and Remote Sensing 54, 130–137 (1999).
[6] Suveg, I. and Vosselman, G., “Reconstruction of 3D building models from aerial images and maps,” ISPRS Journal
of Photogrammetry and Remote Sensing 58, 202–224 (2004).
[7] Baltsavias, E.P., “Object extraction and revision by image analysis using existing geodata and knowledge: current
status and steps towards operational systems,” ISPRS Journal of Photogrammetry and Remote Sensing 58, 129–151
(2004).
[8] Vu, T. T., Yamazaki, F. and Matsuoka, M., “Multi-scale solution for building extraction from LiDAR and image
data”, International Journal of Applied Earth Observation and Geoinformation 11(4), 281-289 (2009).
[9] Murakami, H., Nakagawa, K., Shibata, T. and Iwanami, E., “Potential of an airborne laser scanner system for
change detection of urban features and orthoimage development,” International Archives of Photogrammetry and
Remote Sensing 32(4), 422-427 (1998).
[10] Vögtle, T. and Steinle, E., “Detection and recognition of changes in building geometry derived from multi-temporal
laser scanning data,” International Archives of Photogrammetry and Remote Sensing 35(B2), 428-433 (2004).
[11] Rehor, M., Bähr, H.-P., Tarsha-Kurdi, F., Landes, T. and Grussenmeyer, P., “Contribution of two plane detection
algorithms to recognition of intact and damaged buildings in lidar data,” The Photogrammetric Record 23, 441–456
(2008).
[12] Ma, R., “DEM generation and building detection from LiDAR data,” Photogrammetric Engineering & Remote
Sensing 71(7), 847-854 (2005).

[13] Gonzalez, R. C., Woods, R. E. and Eddins, S. L., [Digital Image Processing using MATLAB, Second Edition],
Gatesmark Publishing, 561-571 (2009).
[14] http://www.imagecatinc.com/wp-content/uploads/2010/01/PR_ImageCat_Haiti_2010-01-24_US2.pdf
[15] Bevington, J., Adams, B. and Eguchi, R., “GEO-CAN Debuts to Map Haiti Damage,” Imaging Notes 25, 26-30
(2010).