automated digestion of total nitrogen and total phosphorus...
TRANSCRIPT

Automated Digestion of Total
Nitrogen and Total
Phosphorus in Environmental
Samples
William Lipps
OI Analytical
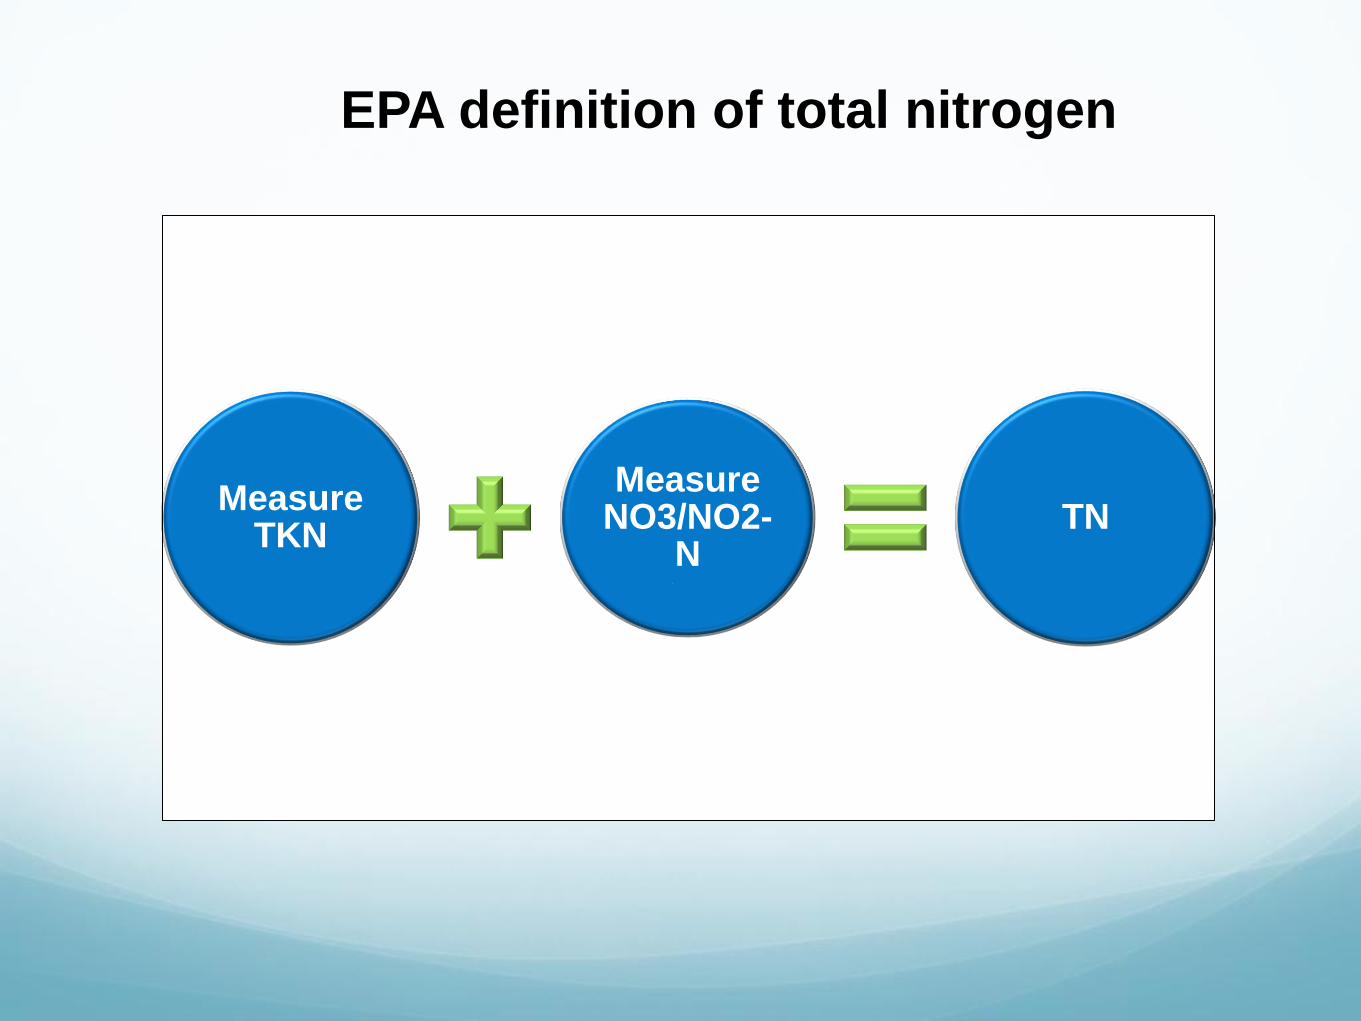
EPA definition of total nitrogen
Measure TKN
Measure NO3/NO2-
N TN

Measuring organic nitrogen requires a TKN
and ammonia analysis
NH3-N Organic Nitrogen
TKN

TKN is a “classical” analysis of total nitrogen
TKN includes
Organic Nitrogen
Ammonia Nitrogen (NH3-N)
TKN does not include
Nitrate Nitrogen (NO3-N)
Nitrite Nitrogen (NO2-N)
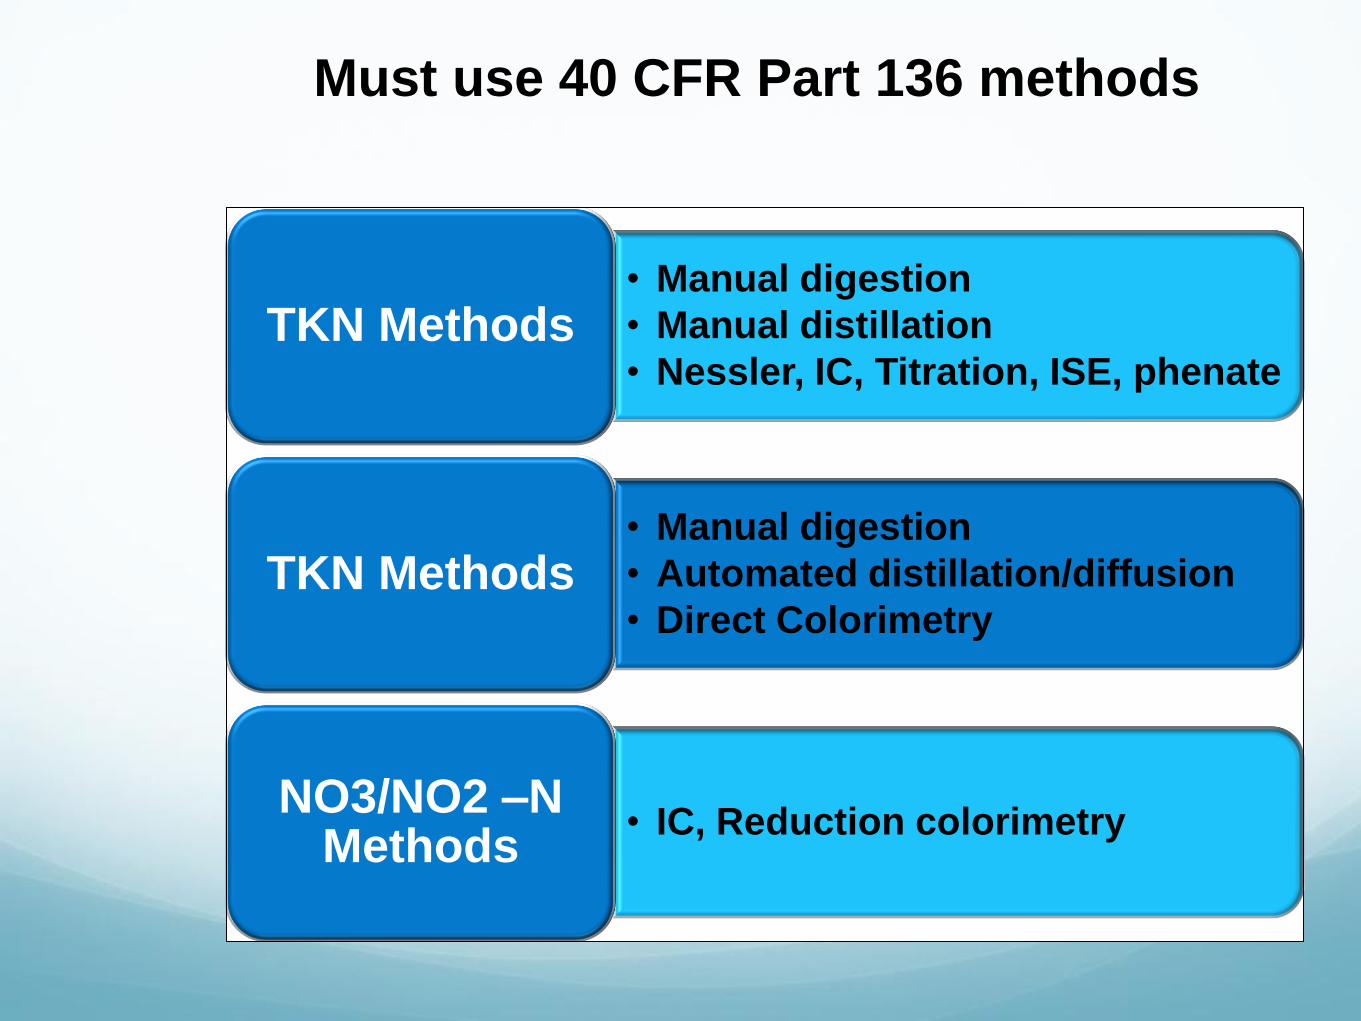
• Manual digestion
• Manual distillation
• Nessler, IC, Titration, ISE, phenate TKN Methods
• Manual digestion
• Automated distillation/diffusion
• Direct Colorimetry TKN Methods
• IC, Reduction colorimetry NO3/NO2 –N
Methods
Must use 40 CFR Part 136 methods

The “classical” Kjeldahl Reactions distilled and
titrated ammonia
Digestion
• H2SO4 + 2(NH2)2CO -> (NH4)2SO4 +2 CO2
Distillation
• (NH4)2SO4 + NaOH -> NaHSO4 + H2O + 2NH3
Capture
• H2SO4 + 2NH3 -> (NH4)2SO4 + H2O
Titration
• H2SO4 + NaOH -> NaHSO4 + H2O

Present Day TKN methods can either distill
(diffuse) or measure NH4+ in the matrix
Manual Digestion
• H2SO4 + (NH2)2CO -> (NH4)2SO4 + 2CO2
• Must use catalyst
Distillation (required for some methods)
• (NH)4SO4 + NaOH -> NaHSO4 +H2O + 2NH3
Detection
• Titration, ISE, manual colorimetry, automated colorimetry

The block digester methods for TKN do not
require distillation
Sodium Citrate is a better complexing agent
Salicylic acid method
Blue color measured at 640 – 660 nm
Continuous Flow or Discrete Analyzer methods.

Digest multiple samples on a block and
analyze them automatically
Faster than titration
Results in minutes
Easy repeat of questionable results
Dilute off scale samples
No distillation
Smaller volumes (25 ml)

Operational Comparison of TKN methods
Manual Digestion
& Distillation
Followed By:
Require final
digest volume
Require final
distillate volume
Titration no no
Ion Selective
Electrode no yes
Manual Phenate no yes
Automated
Phenate no yes
Block Digestion
Automated
Salicylate yes N/A

Techniques for the analysis of Total Nitrogen
(EPA only approves TKN)
Manual Digestion &
Distillation Followed By: MDL (mg/L)
Titration 1.0
Manual Phenate 0.05 ?
Ion Selective Electrode 0.03
Automated Phenate 0.01
Block Digestion
Automated Salicylate 0.1
Auto-GD/pH colorimetry 0.2
Auto-GD/Salicylate 0.02

Problem -TKN does not measure nitrate, and
total nitrogen includes nitrate plus nitrite

0
20
40
60
80
100
120
0 5 20 50
% R
eco
very
of
2.5
pp
m T
KN
ppm NO3-N
Low Recovery of TKN in presence of NO3-N
Schlueter 1977

Influent
Effluent
TKN (mg/L)
30
2
NO3-N (mg/L)
0
17
TN (mg/L)
30
19
Typical N in influent and effluent
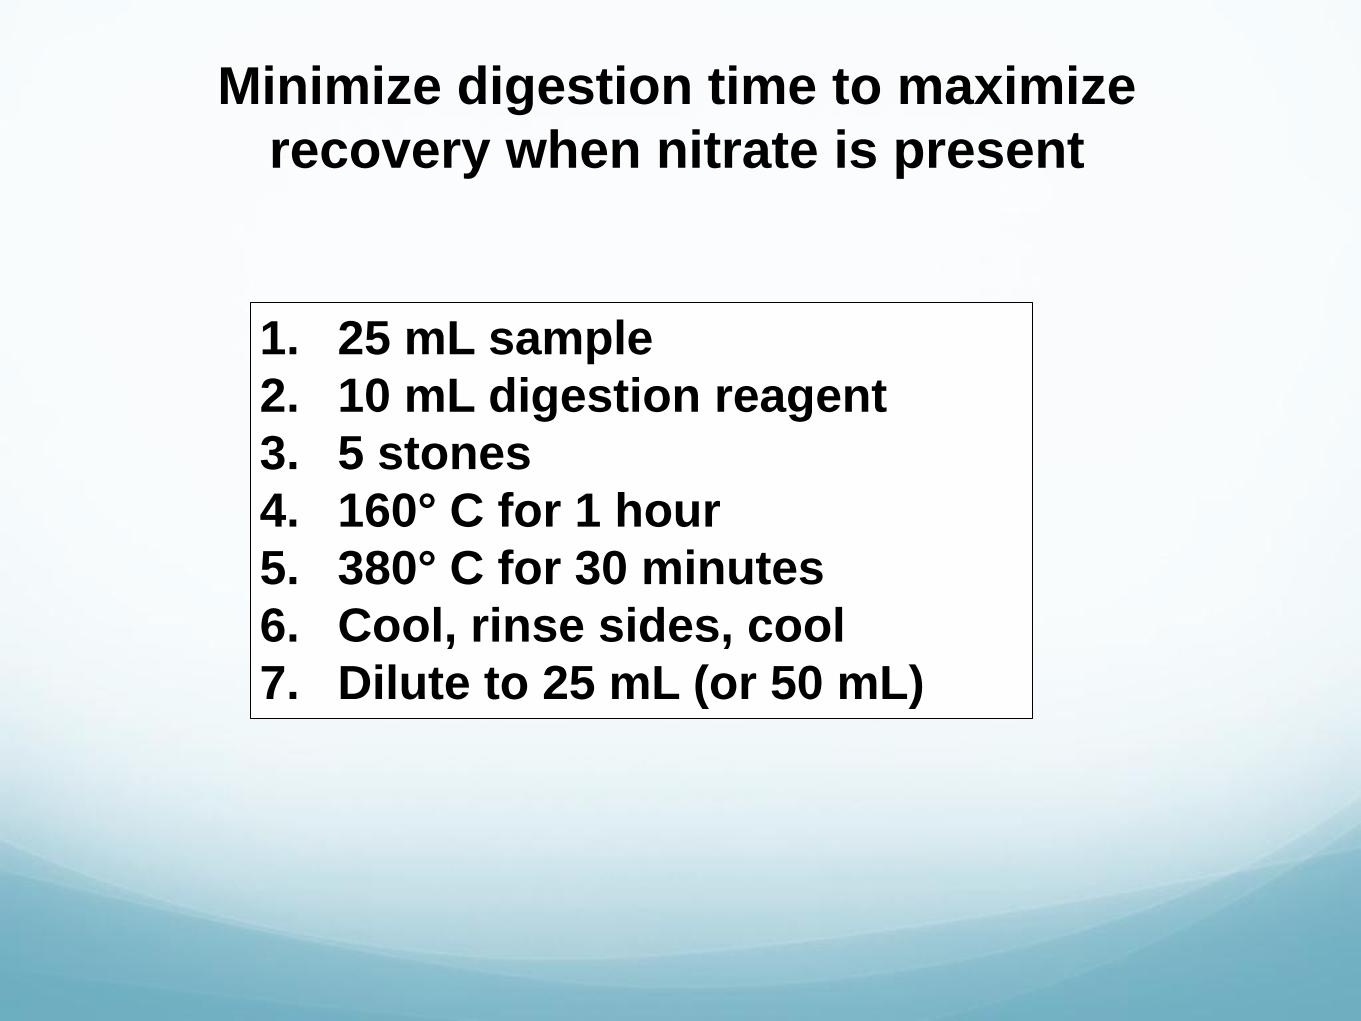
Minimize digestion time to maximize
recovery when nitrate is present
1. 25 mL sample
2. 10 mL digestion reagent
3. 5 stones
4. 160° C for 1 hour
5. 380° C for 30 minutes
6. Cool, rinse sides, cool
7. Dilute to 25 mL (or 50 mL)

With EPA allowed method modifications, both
ammonia and TKN can be determined with the
same CFA method

EPA 351.2 TKN by Gas Diffusion Colorimetry
EPA Modified
Direct Colorimetry Automated Diffusion
Salicylate Salicylate
Tartrate Citrate
0.01 – 2.0 ppm 0.01 – 20 ppm

Organic Nitrogen
NH3-N NOx-N TN
NOx-N = NO3-N + NO2-N
Low Level Organic Nitrogen Requires a
TN analysis, not TKN
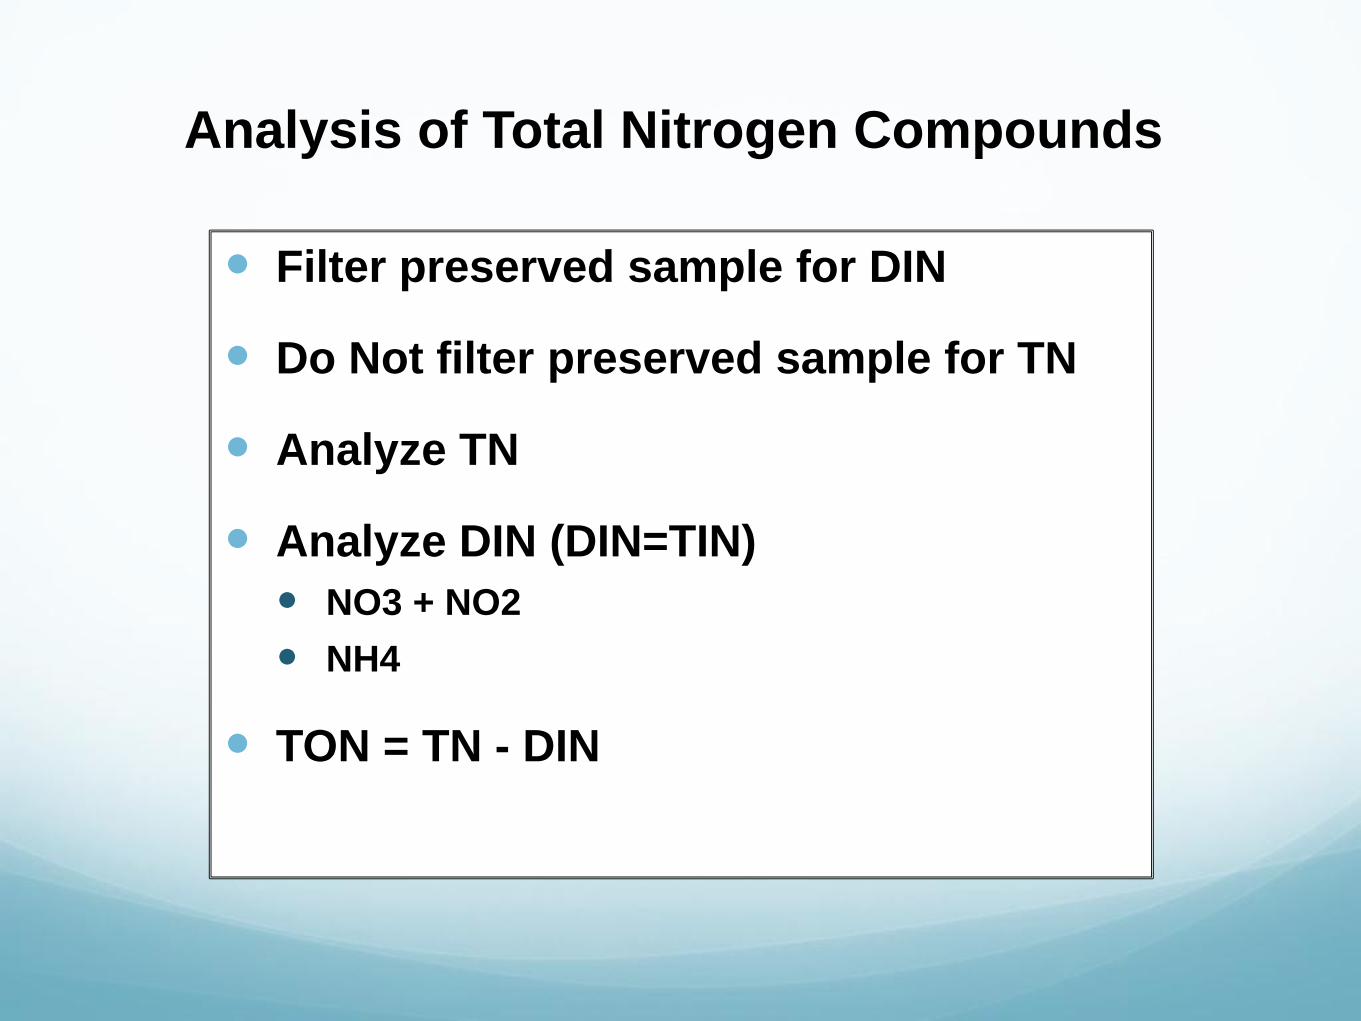
Analysis of Total Nitrogen Compounds
Filter preserved sample for DIN
Do Not filter preserved sample for TN
Analyze TN
Analyze DIN (DIN=TIN)
NO3 + NO2
NH4
TON = TN - DIN

HTCO Total Nitrogen Bound (TNb)
Use TOC Analyzer
720° C reactor
TOC & TNb
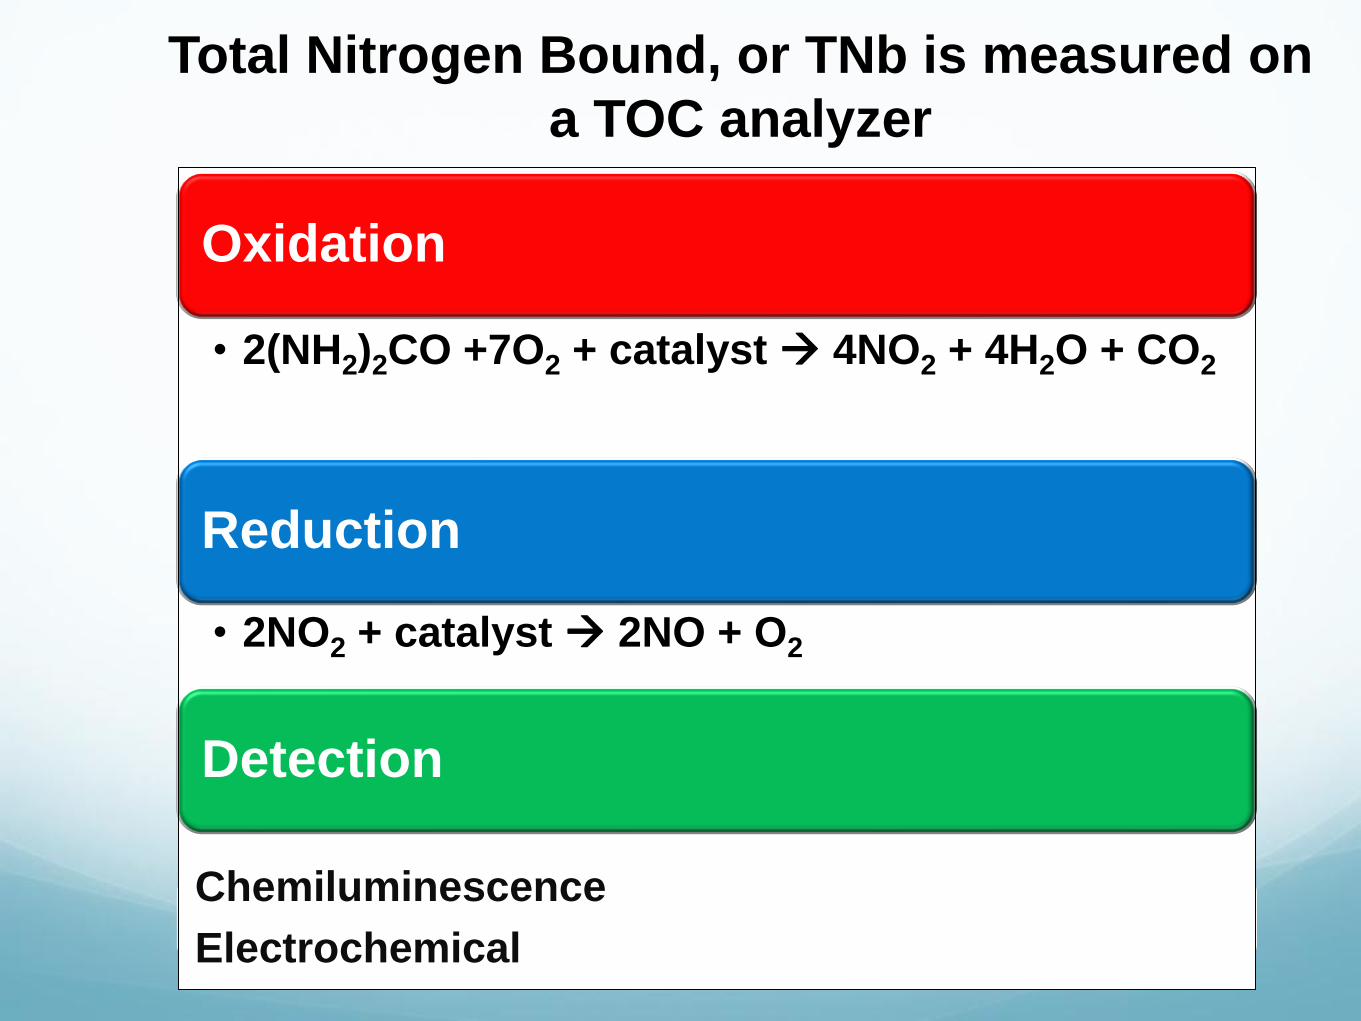
Total Nitrogen Bound, or TNb is measured on
a TOC analyzer
Oxidation
• 2(NH2)2CO +7O2 + catalyst 4NO2 + 4H2O + CO2
Reduction
• 2NO2 + catalyst 2NO + O2
Detection
Chemiluminescence
Electrochemical

Comparison of TNb to TKN (QC samples)
Use TOC Analyzer

Advantages and disadvantages of TNb
Use TOC Analyzer Cons Pros
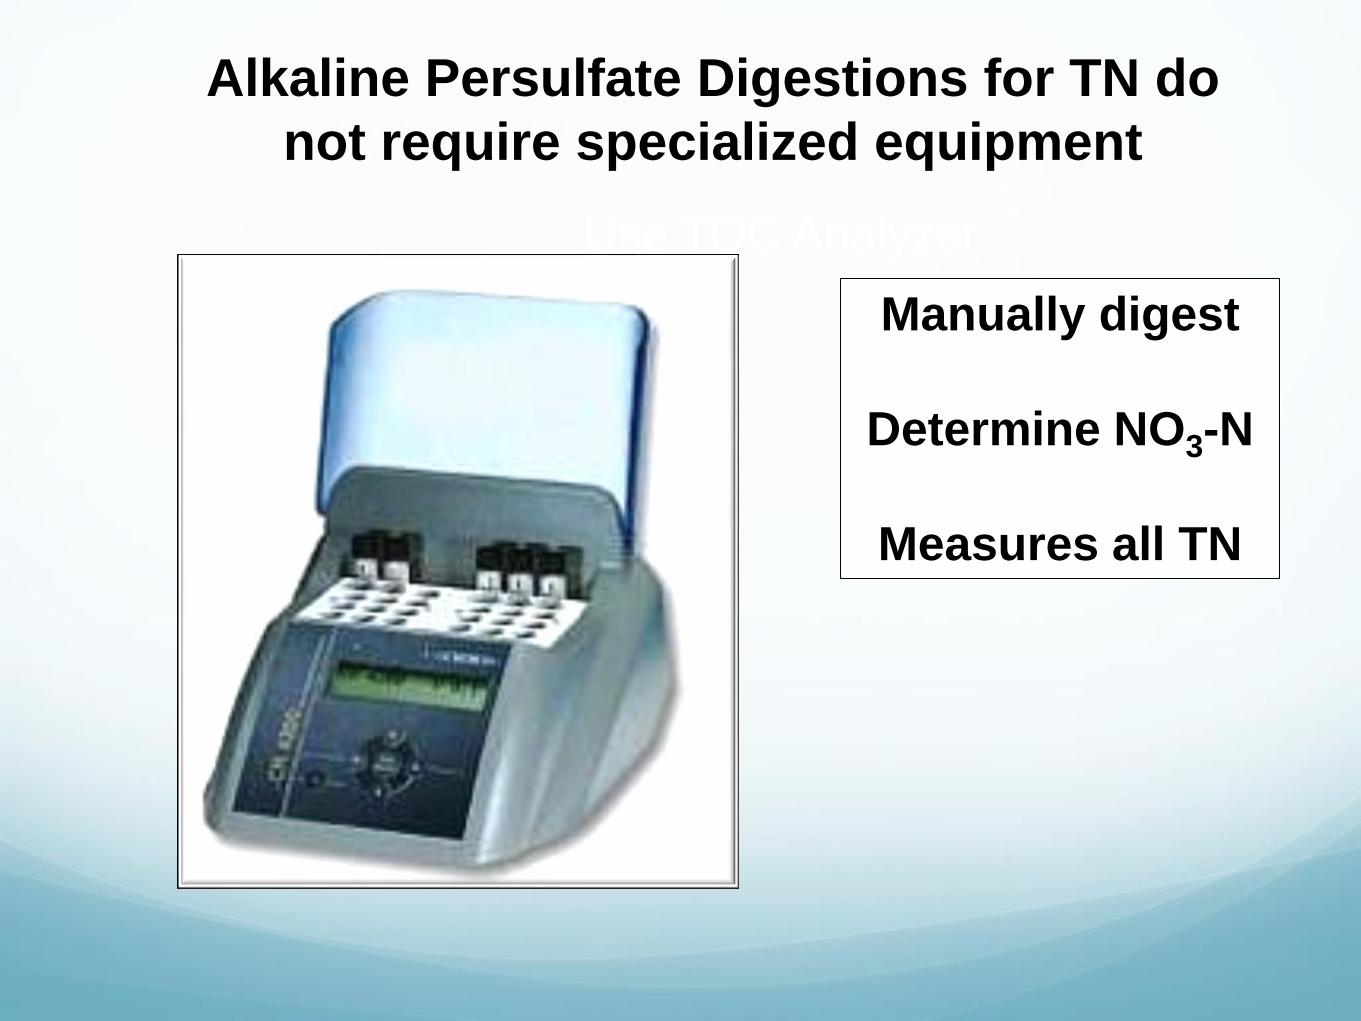
Alkaline Persulfate Digestions for TN do
not require specialized equipment
Use TOC Analyzer
Manually digest
Determine NO3-N
Measures all TN

Manual Alkaline Digestion for TN can be
done in an autoclave or with test tubes
Alkaline Digestion
• (NH2)2CO + 8 S2O8-2 + 18 OH- 2 NO3
- + CO2 + 16 SO4
-2 + 11 H2O
Colorimetry
• Any Nitrate or Nitrate + Nitrite method

Comparison of TN to TNb illustrates
equivalent results on samples tested
Use TOC Analyzer
Doyle 2004

Comparison of TN to TKN + NO3/NO2 -N
Use TOC Analyzer
Cabrera 1993
TOC
(mg/L)
TKN + NOx
(mg/L)
TN
(mg/L)
Cecil 17.5 2.9 2.9
Greenville 1 36.0 3.1 3.5
Hiwassee 2 59.0 8.8 8.9
Irwin 108 17.7 16.0

Comparison of TN to TKN with % RSD
Use TOC Analyzer
Smart 1981
TKN
(mg/L)
TKN
(%RSD)
TN
(mg/L)
TN
(%RSD)
Bear Creek 0.18 10.65 0.22 5.72
Silver Fork 0.36 19.29 0.41 6.49
Salt River 0.59 25.31 0.76 3.23
Ted Shanks 0.61 25.25 1.05 6.04

Advantages and disadvantages of manual
TN persulfate methods
Use TOC Analyzer
Cons Pros

Automated Alkaline UV Persulfate
Digestions increase throughput
Use TOC Analyzer
Automated digest
Determine NO3-N
Measures TDN
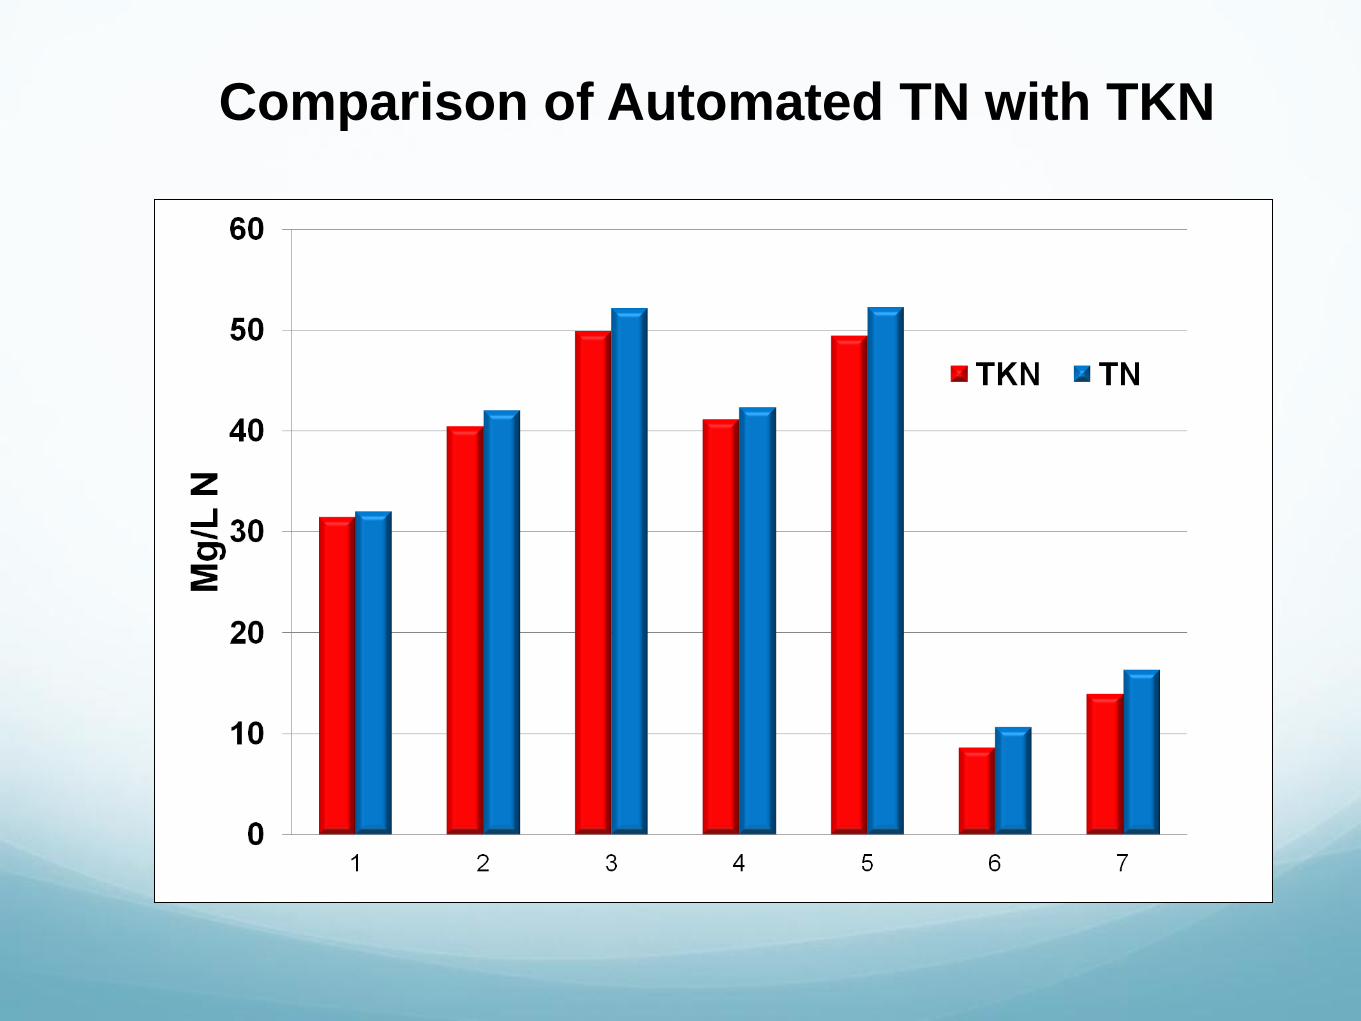
Comparison of Automated TN with TKN
Use TOC Analyzer
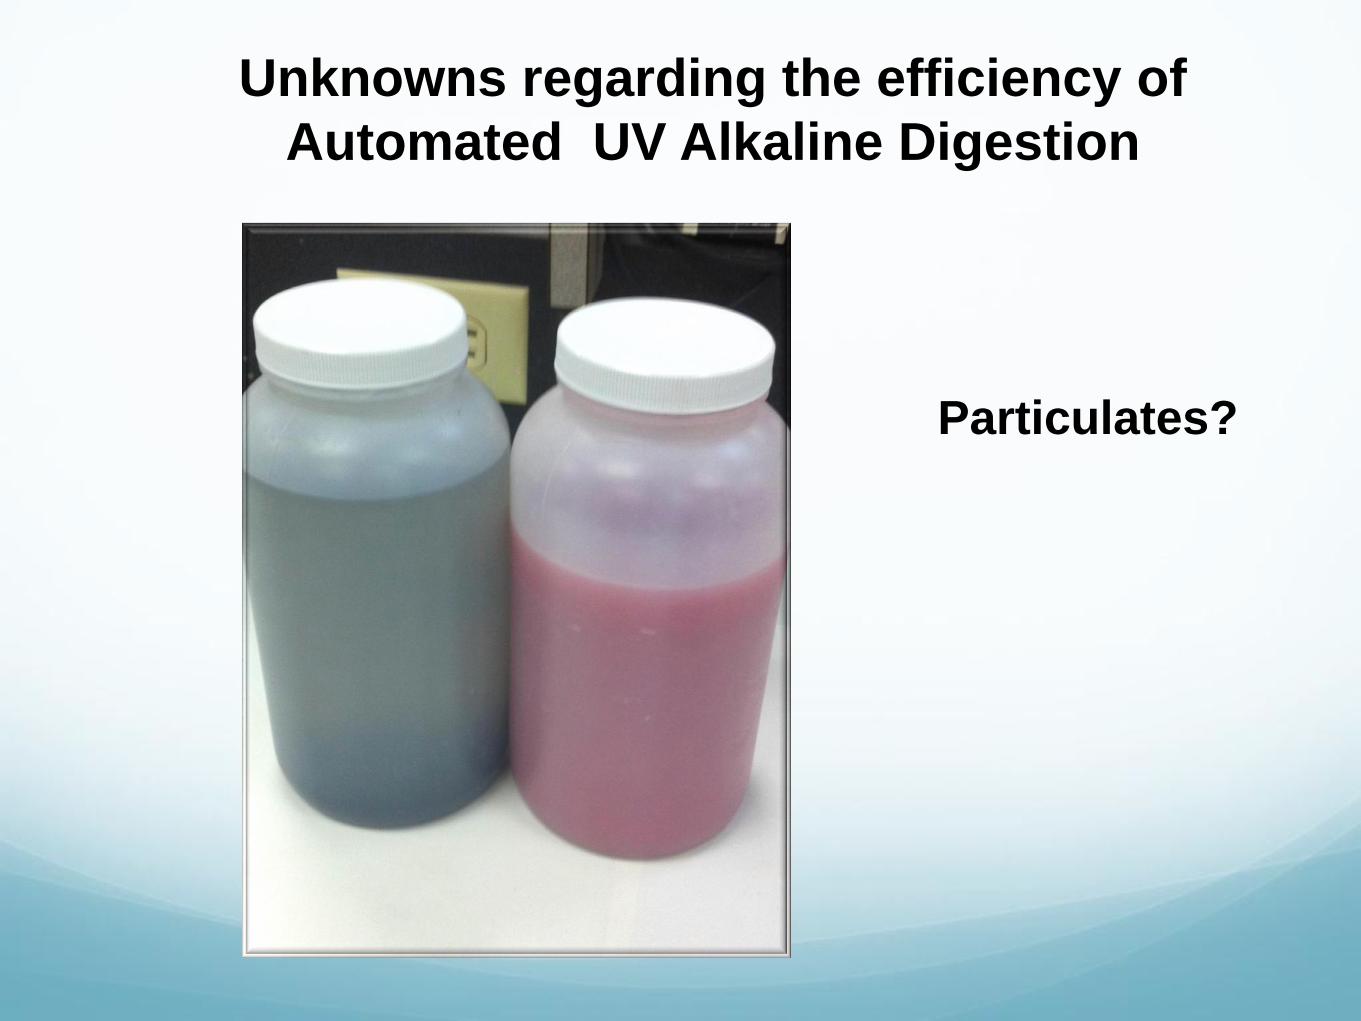
Unknowns regarding the efficiency of
Automated UV Alkaline Digestion
Particulates?

Advantages and disadvantages of
automated TN persulfate methods
Use TOC Analyzer
Cons Pros

What samples for Total Nitrogen may look like

Organic matter consumes persulfate too
(NH2)2CO + 8 S2O8-2 + 18 OH- 2 NO3
- +
CO2 + 16 SO4-2 + 11 H2O
About 100 ppm C upper limit

A Humic acid molecule

Particulates consume persulfate and are
hard to sample
~ 15 - 20% N attached to particulates
Particulates > ~ 30 ppm TSS N/A by CFA
Non quantitative transfer of particulates
to HTCO
Fe+2 to Fe+3 = 1 e-

Acid Persulfate (beaker or
autoclave)
Kjeldahl (block digestion)
Both convert inorganic and
organic phosphorus to
orthophosphate
Total Phosphorus Digestion Methods

Acid persulfate digestion for total P can be
done in a beaker, autoclave, or test tubes
Acid Persulfate Digestion
• R-HPO4 + S2O8-2 + H2SO4 H3PO4 + nCO2 +
nHSO4- + n H2O
Colorimetry
• Any Phosphate method

Accuracy of Persulfate Digestion for TP
y = 1.0096x - 1.9493
R2 = 0.9875
-20
0
20
40
60
80
100
120
140
160
180
200
0 20 40 60 80 100 120 140 160 180 200
Dry Ashing (uMol P)
Ac
id P
ers
ulf
ate
(u
Mo
l P
)
Comparison of Dry Ashing and Acid
Persulfate for Total P

Material tested Dry Ash
uMol P
Persulfate
uMol P
Montmorillonite 1.44 1.00
Kaolinite 22.0 3.04
Outlier data on persulfate and wet oxidation
comparison for TP digestion
Suzamura, Limnol. Oceanogr. Methods 6 2008, 619-629

Potential problems with acid persulfate
digestions for total phosphorus
Too much acid
High chloride
Organic Matter
Excess particulates
Contamination

Advantages and disadvantages of
manual acid persulfate methods for TP
Use TOC Analyzer
Pros Cons
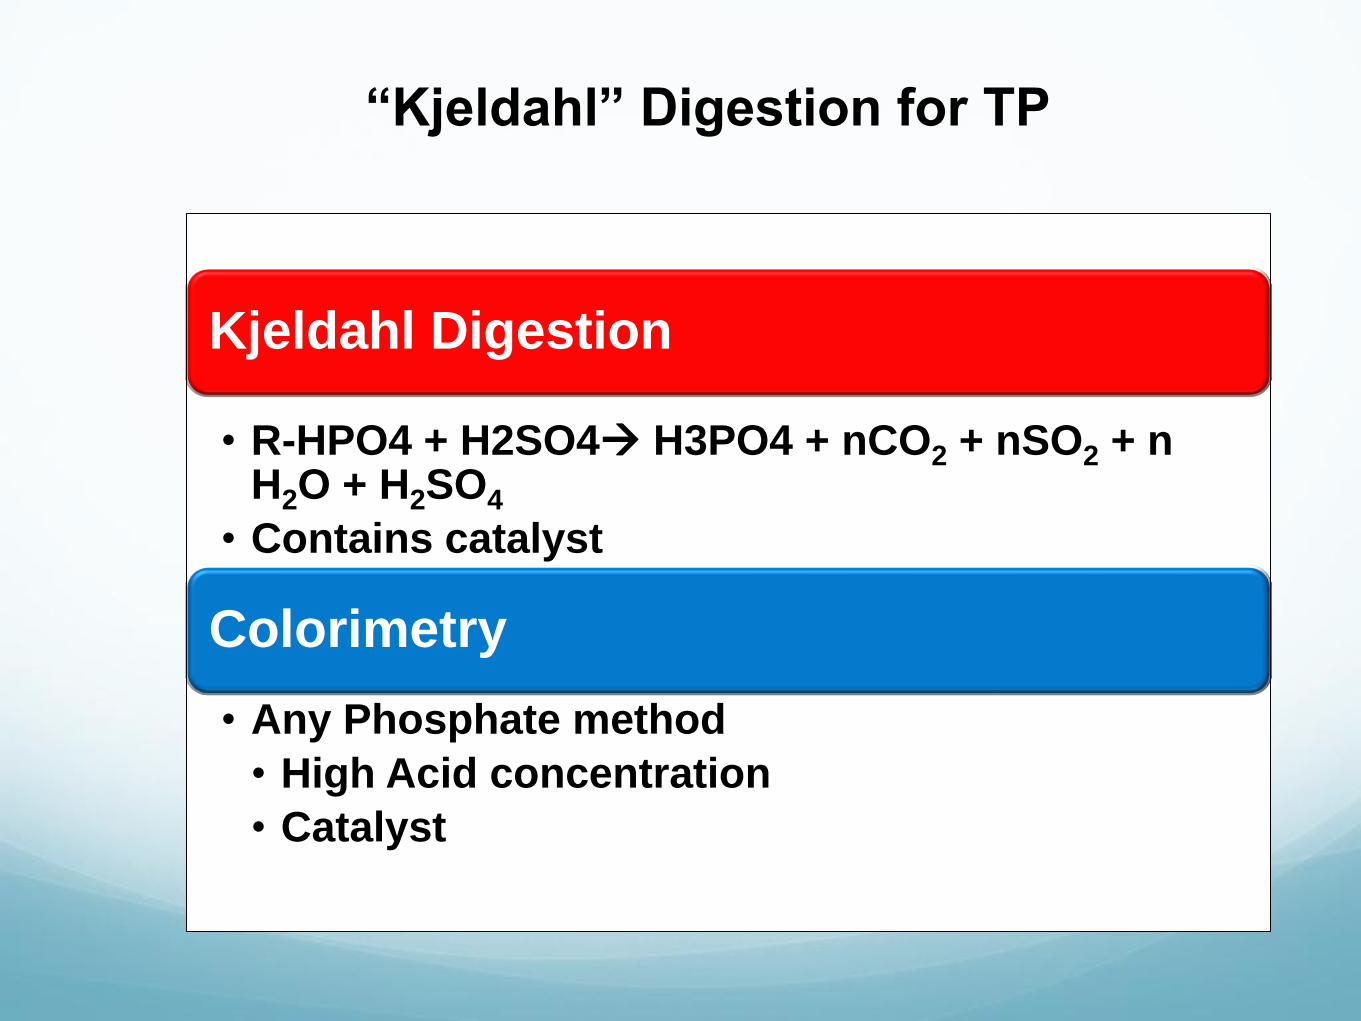
“Kjeldahl” Digestion for TP
Kjeldahl Digestion
• R-HPO4 + H2SO4 H3PO4 + nCO2 + nSO2 + n H2O + H2SO4
• Contains catalyst
Colorimetry
• Any Phosphate method
• High Acid concentration
• Catalyst

Comparison of persulfate and Kjeldahl for TP
Comparison of Persulfate and Kjeldahl Phosphorus
y = 0.9389x + 0.0497
R2 = 0.996
0
2
4
6
8
10
12
14
16
18
0 2 4 6 8 10 12 14 16 18 20
TKP (mg/L)
Pe
rs
ulf
ate
P (
mg
/L)
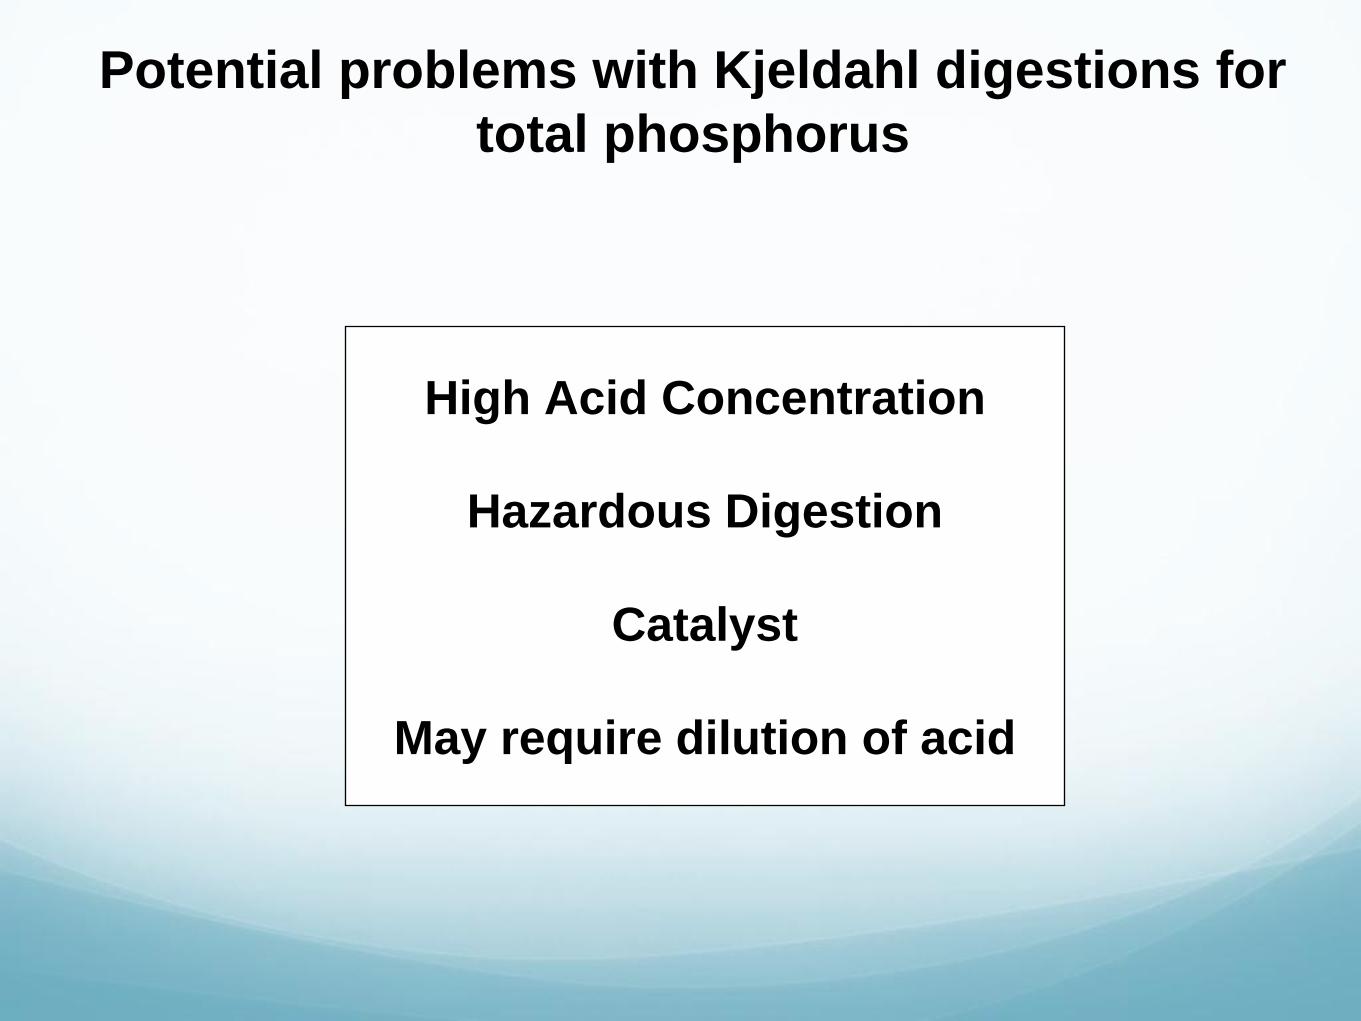
Potential problems with Kjeldahl digestions for
total phosphorus
High Acid Concentration
Hazardous Digestion
Catalyst
May require dilution of acid
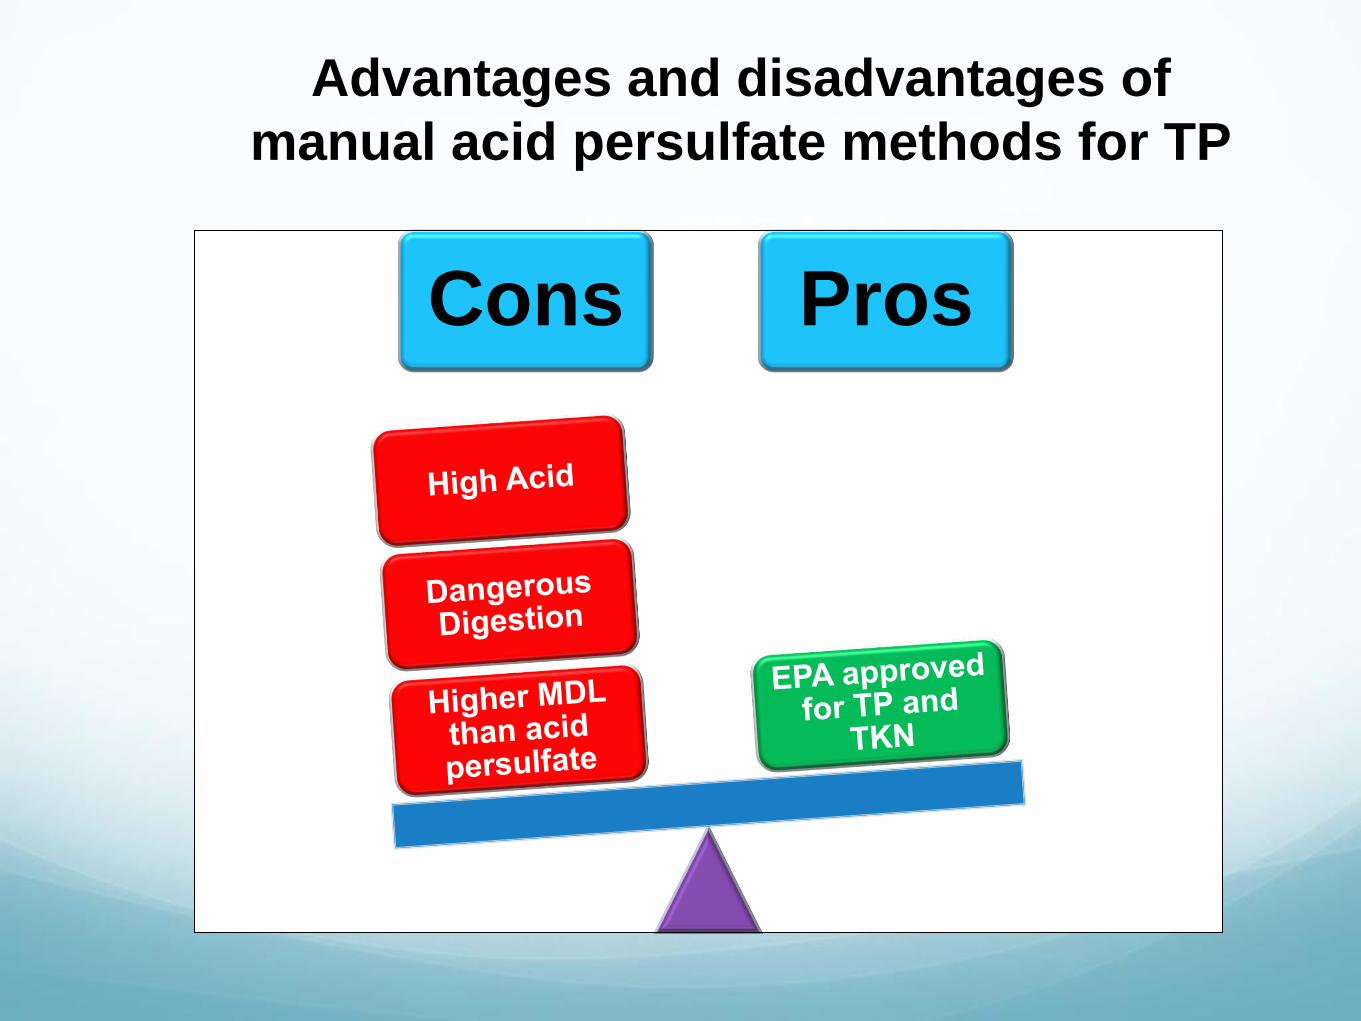
Advantages and disadvantages of
manual acid persulfate methods for TP
Use TOC Analyzer
Cons Pros

Using USGS I-4690-91 to overcome problems
with normal Kjeldahl phosphorus methods
Uses Dialysis
includes On-line dilution
Includes On-line filtration
Controls acid concentration
Low Detection Limit

Alkaline Persulfate Digestions for Total P
Use TOC Analyzer
Manually digest
Determine PO4-3
Measures TP
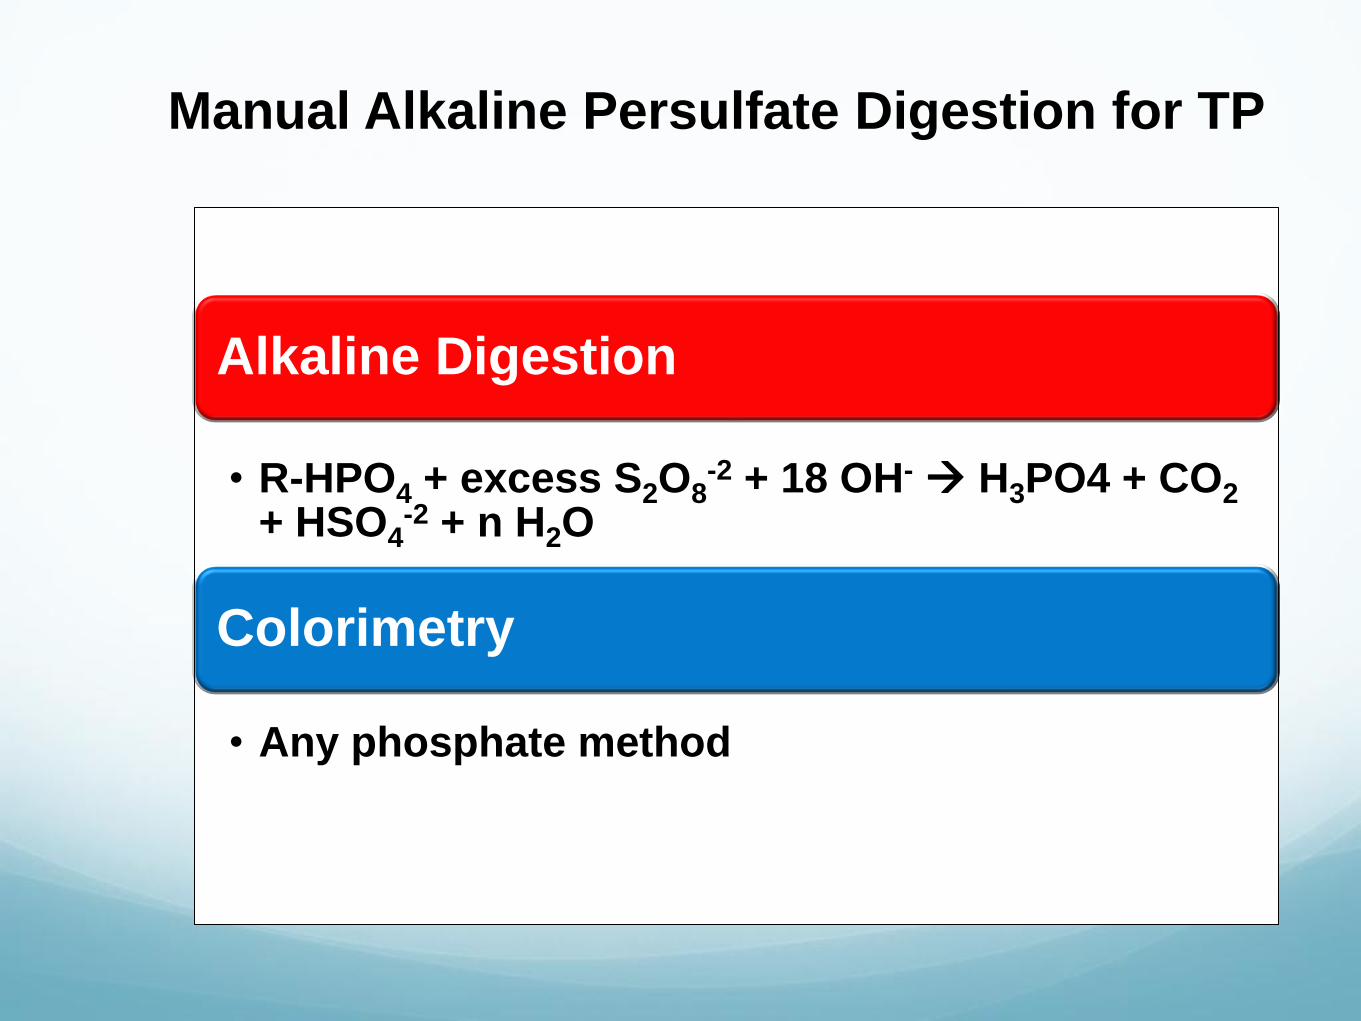
Manual Alkaline Persulfate Digestion for TP
Alkaline Digestion
• R-HPO4 + excess S2O8-2 + 18 OH- H3PO4 + CO2
+ HSO4-2 + n H2O
Colorimetry
• Any phosphate method

Comparison of Alkaline Persulfate and Acid
Persulfate Total Phosphorus
Compound Alkaline
(mg/L P)
Acid
(mg/L P)
Adenosine tri-
phosphate (ATP) 0.166 0.176
Glycerophosphate 0.196 0.204
Phenyl Phosphate 0.168 0.179
Phytic Acid 0.177 0.180
USGS Water Resources Investigative Report 03-4174 (2003)
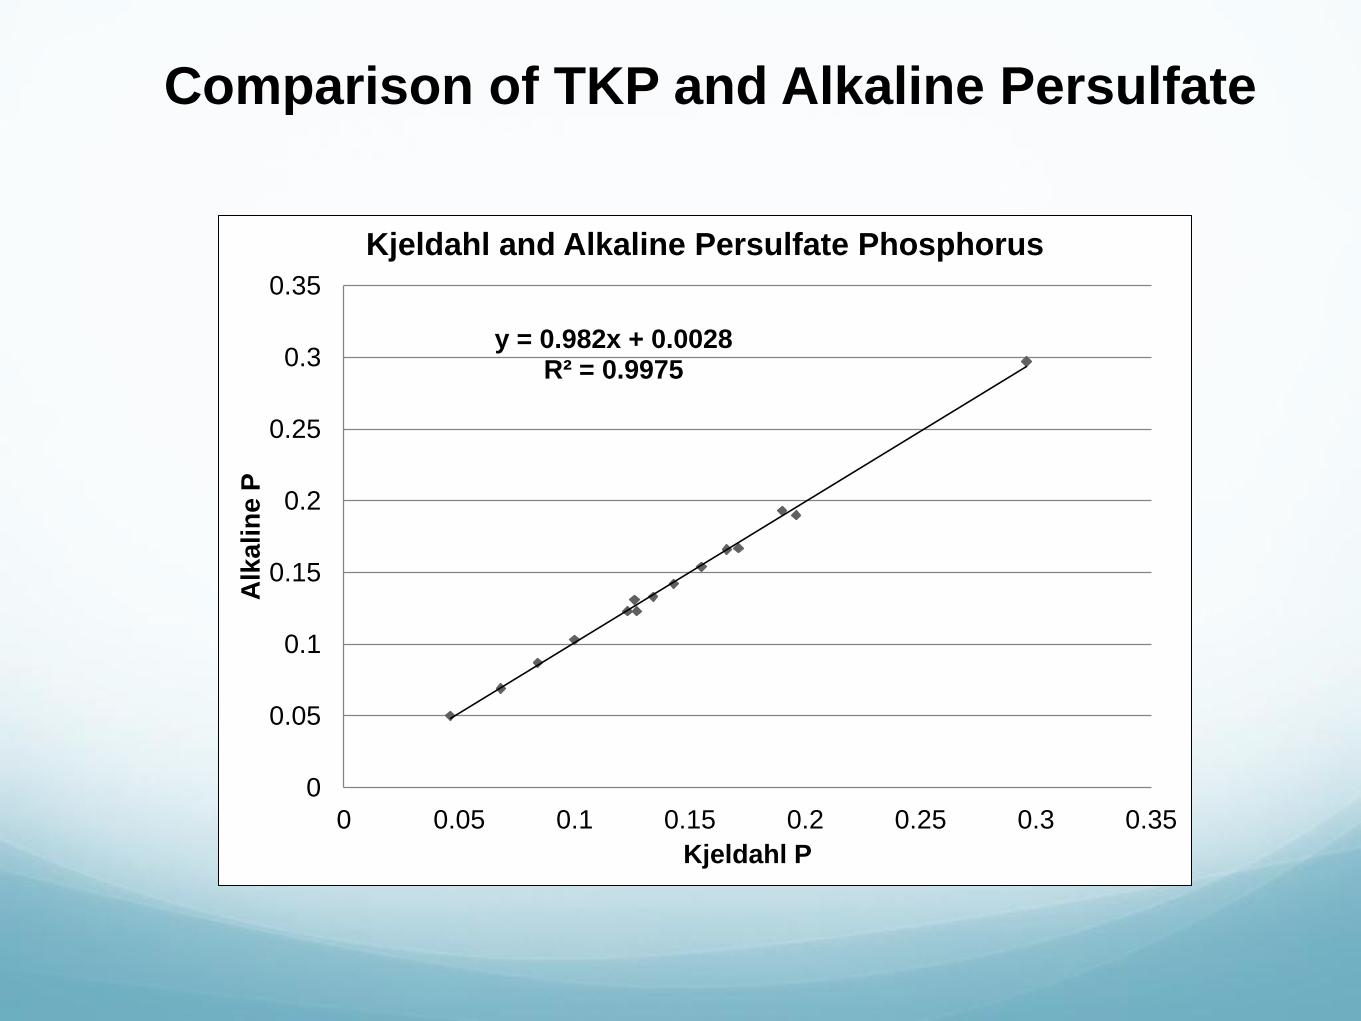
y = 0.982x + 0.0028 R² = 0.9975
0
0.05
0.1
0.15
0.2
0.25
0.3
0.35
0 0.05 0.1 0.15 0.2 0.25 0.3 0.35
Alk
alin
e P
Kjeldahl P
Kjeldahl and Alkaline Persulfate Phosphorus
Comparison of TKP and Alkaline Persulfate
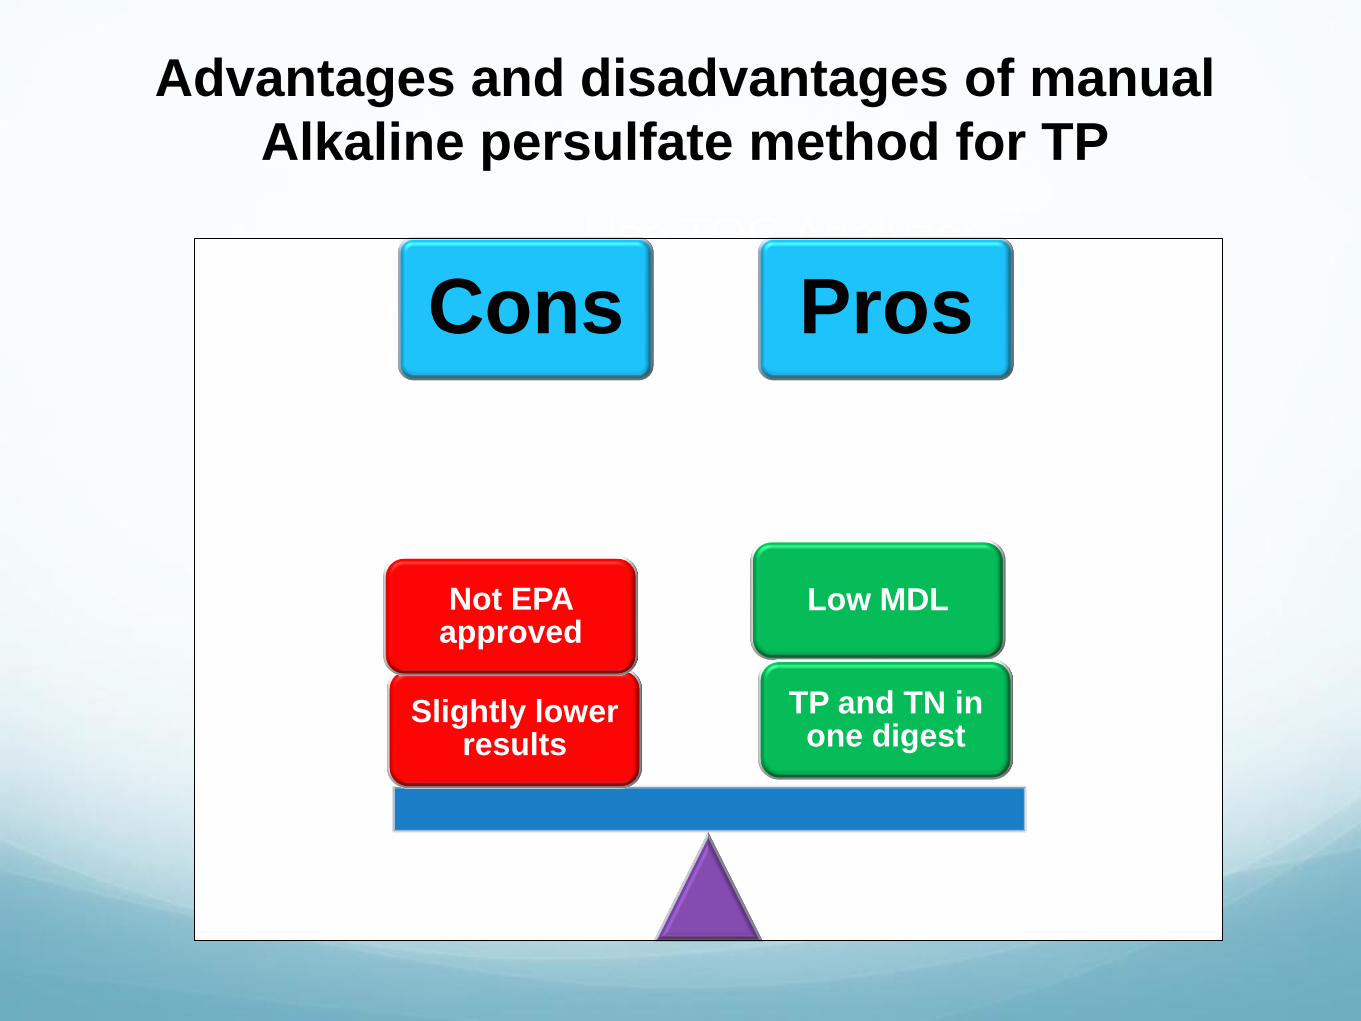
Advantages and disadvantages of manual
Alkaline persulfate method for TP
Use TOC Analyzer
Cons Pros
Low MDL
Slightly lower results
Not EPA approved
TP and TN in one digest

Automated Alkaline UV Persulfate
Digestions
Use TOC Analyzer
Automated digest
Determine PO4-3
Measures TDP

Advantages and disadvantages of
automated persulfate method for TP
Use TOC Analyzer
Cons Pros
throughput
Solids?
Not EPA approved
TP and TN in one digest
