automated detection of martian gullies from hirise · pdf fileautomated detection of martian...
TRANSCRIPT

Automated Detection of Martian Gullies from HiRISE Imagery
Wei Li, Kaichang Di, Zongyu Yue, Yiliang Liu, and Shujuan Sun
Abstract Gully is a type of young geological feature on the Martian sur-face, and the study of gullies can significantly contribute to un-derstanding of the geologic history of Martian surface. As a large amount of high-resolution orbital images have been acquired, manual identification and extraction of all gullies is tedious and prohibitively time consuming. Therefore, it is desirable to devel-op automated methods for detection of Martian gullies to support scientific studies of the gullies. This paper presents an automated gully detection method based on mathematical morphology techniques. The method integrates a series of morphological operators, including area opening and closing, Bottom-Hat trans-formation, and path opening. Experimental results using HiRISE images at six sites demonstrate promising performance with detection percentage from 76 percent to 94 percent.
IntroductionMartian gullies are small, narrow, linear features incised into steep slopes, and were first found by Mars Orbiter Camera (MOC) onboard Mars Global Surveyor (MGS) in 2000. They usu-ally have a dendritic alcove head and a fan-shaped apron, with a single thread of channel linking the two parts (Malin and Edgett, 2000). The widths of the channels range from meters to tens of meters, and the lengths from tens of meters to hundreds of meters; thus the channels are much smaller than the valley networks on Mars (Carr, 2006; Gulick, 2008). Martian gullies have been found on crater walls, terraces, and sand dunes. They are believed to be very young in geologic time, because craters are absent on most of their terminal deposits, and they cut across all other features in their path such as sand dunes (Malin and Edgett, 2000). Recent repeated observations from High Resolution Science Experiment (HiRISE) images onboard Mars Reconnaissance Orbiter (MRO) indicate that some gullies are still active today (Costard et al., 2007; Diniega et al., 2010; Reiss et al., 2010). The formation of Martian gully remains a hot topic in planetary science community. So far, three catego-ries of hypotheses have been proposed for Martian gully forma-tion: dry mechanism (dry mass wasting of fine-grained materi-als), underground wet mechanisms (release of groundwater and liquid CO2), and surficial wet mechanisms (melting of shallow
ground ice and snowmelt) (Malin and Edgett, 2000; Mellon and Phillips, 2001; Lee et al., 2001; Musselwhite et al., 2001; Hoffman, 2002; Costard et al., 2002; Treiman, 2003; Head et al., 2008). Further studies of gullies can significantly contribute to the understanding of the geologic history of Martian surface.
Many high-resolution images acquired in last decades have been utilized for studying Martian gully distribution, such as Mars Orbiter Camera narrow angle (MOC/NA) images from MGS (Heldmann and Mellon, 2004; Heldmann et al., 2007), Thermal Emission Imaging System (THEMIS) images from Mars Odyssey (Bridges and Lackner, 2006), High Resolution Stereo Camera (HRSC) images from Mars Express (Balme et al., 2006; Kneissl et al., 2010), HiRISE, and Context Camera (CTX) images from MRO (Gulick, 2008; Harrison et al., 2014). How-ever, currently only parts of the Martian gullies have been mapped and documented (Harrison et al., 2014), and most of them have been identified manually. Since large quantities of Martian gullies still have been unmapped and monitoring new activities of Martian gullies is very important in Martian geology research, it is considered being necessary to develop automated methods for Martian gully detection.
In this paper, an automated method based on mathematical morphology techniques is proposed for Martian gully detec-tion. First, area opening and closing operators are used to fil-ter the grayscale image, and then Bottom-Hat transformation is applied to extract small dark features from the filtered im-age; finally, non-gully features are removed by path opening operation. Because the resolution of HiRISE imagery is denser than that of any other Mars orbital images, we use HiRISE im-ages to detect gullies in this research. If high-resolution digi-tal terrain model (DTM) is available, an additional detection step (relief calculation) is adopted to eliminate false positive through relief calculation to improve the detection accuracy.
Related WorkIn the past decade, many researchers tried to develop au-tomated methods to extract features, primarily craters, on planetary surfaces, but little attention has been paid to gully extraction. So far, there is no publication of an automated approach dedicated to Martian gully detection from imagery. In previous studies, extraction method for Martian valley network from DTM data has been proposed (Stepinski and Col-lier, 2004; Molloy and Stepinski, 2007) based on the classic run-off modeling algorithm for automated delineation of flow paths in hydrologic modeling (Jenson and Domingue, 1988; Tarboton et al., 1991; Tarboton and Ames, 2001; Statella et al., 2012). Since high-resolution DTMs that can be used to identify Martian gullies are rare, we use high-resolution imagery as the primary source to detect gullies.
Wei Li is with the State Key Laboratory of Remote Sensing Science, Institute of Remote Sensing and Digital Earth, Chinese Academy of Sciences, P. O. Box 9718, Datun Road, Chaoyang District, Beijing 100101, China; and College of Tourism, Resources and Environment Science, Hunan University of Arts and Science, 170 Dongting Road, Changde 415000, Changde Hunan, China.
Kaichang Di, Zongyu Yue, and Shujuan Sun are with the State Key Laboratory of Remote Sensing Science, Institute of Remote Sensing and Digital Earth, Chinese Academy of Sciences, P. O. Box 9718, Datun Road, Chaoyang District, Beijing 100101, China ([email protected]).
Yiliang Liu is with Space Star Aerospace Technology Applications Co., Ltd., 82 Zhichun Road, Haidian District, Beijing 100086, China.
Photogrammetric Engineering & Remote SensingVol. 81, No. 12, December 2015, pp. 913–920.
0099-1112/15/913–920© 2015 American Society for Photogrammetry
and Remote Sensingdoi: 10.14358/PERS.81.12.913
PHOTOGRAMMETRIC ENGINEERING & REMOTE SENSING December 2015 913
12-15 December Peer Reviewed.indd 913 11/19/2015 11:13:27 AM

In the field of terrestrial soil erosion research using remote sensing technology, there are a number of methods being uti-lized for discriminating gully features. Metternicht and Zinck (1998) mapped soil erosion features by image classification using Landsat TM and JERS-1 SAR data; Vrieling et al. (2007) discerned erosion gullies from multitemporal ASTER imagery. However, ad-equate training areas are required for training the classifiers in the two methods. De Asis et al. (2008) delineated potential erosion areas by applying linear spectral un-mixing method to Landsat Enhanced Thematic Mapper images, and this method requires determination of end-members before un-mixing, which needs in-depth knowledge of the study area. Knight et al. (2007) used AS-TER imagery to map alluvial gullies associated with large tropical rivers, but only reached an accuracy of approximately 50 percent for the gully class. Shruthi et al. (2011) employed an object-orient-ed image analysis method to extract gully erosion features, using a combination of DTM, spectral, shape and contextual information obtained from Ikonos and GEOEYE-1 data. d’Oleire-Oltmanns et al. (2014) applied object-based image analysis to detected gully-affected areas using multispectral QuickBird-2 satellite image, but detection cannot perform well for small scale gullies. Recently, several studies on gully detection from airborne Light Detection and Ranging (lidar) or terrestrial laser scanner data have been pub-lished (James et al., 2007; Eustace et al., 2009; Evans and Lindsay, 2010; Baruch and Filin, 2011; Sofia et al., 2011; Höfle et al., 2013).
As revealed by a recent comparative study (Yue et al., 2014), the morphometric parameters of Martian gullies are similar to those on earth, but the magnitudes are quite different. Thus, it is necessary to verify whether the gully detection methods developed for earth soil erosion analysis are applicable to Mar-tian gullies detection and it is also desirable to develop gully detection method dedicated to Martian gullies.
Data HiRISE data with an ultra-high resolution (usually 0.25 to 0.5 m/pixel) has shown its great advantage in fine-scaled feature identification and analysis, and it is used in this research for detecting Martian gullies. Six test sites, marked with A through F, are chosen to test our method, and their locations are shown in Figure 1. The background image mosaic was obtained from “Mars Global GIS DVD Equidistant Cylindrical (clon0).”1 The gullies in Site A and Site F occur on the walls of craters; in Site C and Site D, the gullies are located on sand dunes; in the rest of the test sites, gullies are found in other steep slopes. At Sites A, B, and C, stereo pairs of HiRISE images were acquired and the derived DTMs, and orthoimages are also available. HiRISE image data of the six sites and DTM of the three sites have been down-loaded from the HiRISE website (http://www.uahirise.org/). In or-der to save processing time and discard irrelevant area with no gullies, images are trimmed to regions of interest. Table 1 lists the detailed information of the HiRISE data used in this research. An asterisk before a site name denotes there exists related DTM at this site. At the sites with DTM data, orthoimages are used instead of original HiRISE image. DTM data have the same resolu-tions as the corresponding orthoimages. The reference data used for detection accuracy assessment is collected by manual digitization, in which a gully is delineated as a polyline on the image from its alcove head to the head of fan-shaped apron.
MethodThe method we have developed is based on mathematical morphology techniques that have been widely used in im-age analysis. In a grayscale image, a gully appears as a small linear feature, and usually has lower grayscale value than the
1. ftp://pdsimage2.wr.usgs.gov/pub/pigpen/mars/Global_GIS_Mars/
Figure 1. Location map of the six test sites. The background map is a Viking mosaic (available at: ftp://pdsimage2.wr.usgs.gov/pub/pigpen/mars/Global_GIS_Mars/).
Table 1. DeTails of hirise DaTa of The six TesT siTes (asTerisk DenoTes DTm available)
Site name Image product IDResolution
(meter)Image size
(pixel) Latitude Longitude
*Site A PSP_007110_1325_RED_C_01_ORTHO 1.0 1614×1891 -46.980° 18.794°
*Site B ESP_013097_1115_RED_C_01_ORTHO 2.0 2745×1600 -68.463° 1.310°
*Site C ESP_013083_1325_RED_C_01_ORTHO 1.0 1377×1832 -47.229° 19.479°
Site D PSP_003748_1250_RED 1.0 1289×1295 -54.582° 12.943°
Site E ESP_022074_1315_RED 0.25 3536×2139 -48.309° 73.706°
Site F ESP_028163_1410_RED 1.0 1784×1194 -38.804° 159.488°
914 December 2015 PHOTOGRAMMETRIC ENGINEERING & REMOTE SENSING
12-15 December Peer Reviewed.indd 914 11/19/2015 11:13:31 AM

surrounding environment. Hence, our method devotes to detect linear features with limited width and adequate length in an im-age. DTM data, if available, is adopted as auxiliary information to refine the results of morphological analysis by removing pos-sible false detections through relief calculation. The main steps of the proposed gully detection method are shown in Figure 2.
The first operation of our method is filtering the image by area opening and closing operators, respectively. Area open-ing γα
λ of a binary image can be defined as (Vincent, 1993):
γαλ (X) = È{Xi|i∈I, Area (Xi) ≥ λ} (1)
where the parameter λ is a threshold of area, X is the collec-tion of the foreground pixels in the image (i.e., the set of pixels with value of 1 in the binary image), and (Xi)i∈I denotes the connected components of X; γα
λ (X) is equal to the union of the connected components Xi with area greater than or equal to λ.
In mathematical morphology, a grayscale image is treated as a function f. For the grayscale image f, area opening γα
λ (f) can be represented as (Vincent, 1993):
(γαλ (f ))(x) = sup {h≤f(x)|x∈γα
λ (Th(f ))} (2)
where x is a variable standing for any pixel of the grayscale im-age, f (x) denotes the grayscale value of the pixel, Th(f ) stands for
the thresholding result of f at grayscale value h, i.e., Th(f ) = {x|f (x)≥h}. If h equals to min(f (x)), all pixels will be included in Th(f ). The larger the h value, the less pixels in the resultant Th(f ). With a given area threshold λ>0, a specific pixel x may or may not belong to the result of γα
λ (Th(f )), depending on the h value. The maximum value of h which makes the pixel x belong to the result of γα
λ (Th(f )) is the resultant value of the pixel after area opening.From a morphological perspective, the area opening filter is
algebraic opening (Soille, 2003), and it removes all connected components whose area (in number of pixels) is smaller than a given threshold λ. Area closing is the dual operation of area opening. The area opening filter affects the bright connected components, and area closing filter affects the dark connected components. More details of area opening and closing and their implementations were elaborated by Vincent (Vincent, 1993). The two filters are used to filter out some small features from the image such as boulders, boulder shadows, and noises introduced in imaging process. In our experiments, the thresh-old value λ for both area opening and closing operations is set to 200/R² empirically, where R is the image resolution. The filtering result of site A is shown in Figure 3. It can be seen that the background becomes smoother and the gully itself is preserved. This will be helpful to the subsequent Bottom-Hat
Figure 2. Flowchart of the automated gully detection method.
Figure 3. Result of area opening and closing filtering for a subset of HiRISE image at Site A: (a) Original image, (b) Detail view on the sub-set of the original image, outlined as white rectangle, and (c) Detail view on the subset of the resultant image.
PHOTOGRAMMETRIC ENGINEERING & REMOTE SENSING December 2015 915
12-15 December Peer Reviewed.indd 915 11/19/2015 11:13:35 AM
transformation and path opening operation.In the second step, a Bottom-Hat transformation is applied
to extract dark structures from the background. Bottom-Hat of an image is the difference between the morphologically closed image and the original image. The formula of Bottom-Hat transformation can be represented as (Soille, 2003):
BOTHAT(f ) = (f · g) – f (3)
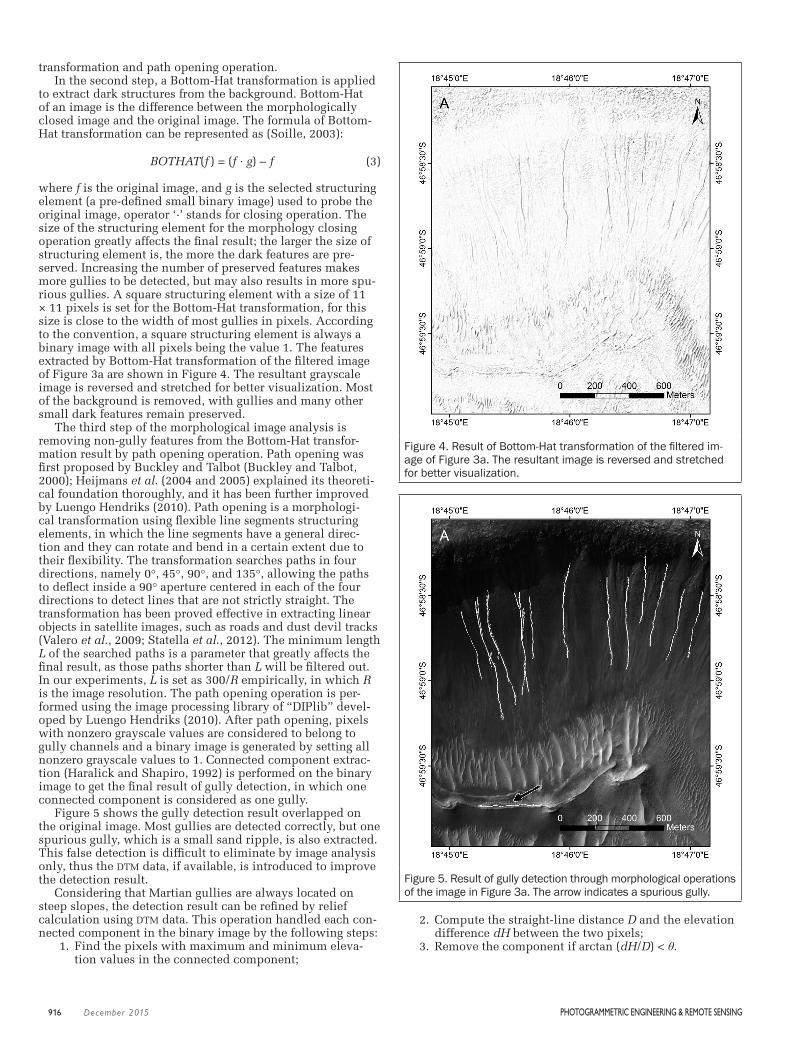
where f is the original image, and g is the selected structuring element (a pre-defined small binary image) used to probe the original image, operator ‘∙’ stands for closing operation. The size of the structuring element for the morphology closing operation greatly affects the final result; the larger the size of structuring element is, the more the dark features are pre-served. Increasing the number of preserved features makes more gullies to be detected, but may also results in more spu-rious gullies. A square structuring element with a size of 11 × 11 pixels is set for the Bottom-Hat transformation, for this size is close to the width of most gullies in pixels. According to the convention, a square structuring element is always a binary image with all pixels being the value 1. The features extracted by Bottom-Hat transformation of the filtered image of Figure 3a are shown in Figure 4. The resultant grayscale image is reversed and stretched for better visualization. Most of the background is removed, with gullies and many other small dark features remain preserved.
The third step of the morphological image analysis is removing non-gully features from the Bottom-Hat transfor-mation result by path opening operation. Path opening was first proposed by Buckley and Talbot (Buckley and Talbot, 2000); Heijmans et al. (2004 and 2005) explained its theoreti-cal foundation thoroughly, and it has been further improved by Luengo Hendriks (2010). Path opening is a morphologi-cal transformation using flexible line segments structuring elements, in which the line segments have a general direc-tion and they can rotate and bend in a certain extent due to their flexibility. The transformation searches paths in four directions, namely 0°, 45°, 90°, and 135°, allowing the paths to deflect inside a 90° aperture centered in each of the four directions to detect lines that are not strictly straight. The transformation has been proved effective in extracting linear objects in satellite images, such as roads and dust devil tracks (Valero et al., 2009; Statella et al., 2012). The minimum length L of the searched paths is a parameter that greatly affects the final result, as those paths shorter than L will be filtered out. In our experiments, L is set as 300/R empirically, in which R is the image resolution. The path opening operation is per-formed using the image processing library of “DIPlib” devel-oped by Luengo Hendriks (2010). After path opening, pixels with nonzero grayscale values are considered to belong to gully channels and a binary image is generated by setting all nonzero grayscale values to 1. Connected component extrac-tion (Haralick and Shapiro, 1992) is performed on the binary image to get the final result of gully detection, in which one connected component is considered as one gully.
Figure 5 shows the gully detection result overlapped on the original image. Most gullies are detected correctly, but one spurious gully, which is a small sand ripple, is also extracted. This false detection is difficult to eliminate by image analysis only, thus the DTM data, if available, is introduced to improve the detection result.
Considering that Martian gullies are always located on steep slopes, the detection result can be refined by relief calculation using DTM data. This operation handled each con-nected component in the binary image by the following steps: 1. Find the pixels with maximum and minimum eleva-
tion values in the connected component;
2. Compute the straight-line distance D and the elevation difference dH between the two pixels;
3. Remove the component if arctan (dH/D) < θ.
Figure 4. Result of Bottom-Hat transformation of the filtered im-age of Figure 3a. The resultant image is reversed and stretched for better visualization.
Figure 5. Result of gully detection through morphological operations of the image in Figure 3a. The arrow indicates a spurious gully.
916 December 2015 PHOTOGRAMMETRIC ENGINEERING & REMOTE SENSING
12-15 December Peer Reviewed.indd 916 11/19/2015 11:13:42 AM

The threshold θ is set as 7° empirically, indicating the minimum slope for forming Martian gullies. This operation removes the linear structures distributed in flat terrains, which are usually non-gully features. The non-gully feature in the bottom of Figure 5 is easily removed by relief calculation.
Results and DiscussionWe have carried out gully detection experiments in other five sites, and the detection results are shown in Figure 6.
Three quality factors are used to evaluate the performance of our method, including detection percentage D = 100TP/(TP + FN), branching factor B = FP/TP, and quality percentage Q = 100TP/(TP + FP +FN), which were proposed by Shufelt (1999) and have been widely used in evaluation of crater detection algorithms (Barata et al., 2004; Kim et al., 2005; Bue and Stepinski, 2007; Bandeira et al., 2012). Here, TP stands for the number of true positive detections, FP the number of
false positive detections, and FN the number of false negative detections (Swets, 1988). The parameter D can be treated as a measurement of the detection performance (the larger, the better), parameter B can be treated as a measurement of de-lineation performance (the smaller, the better), and parameter Q can be treated as a measurement of the overall algorithm performance (the larger, the better). The detected gullies are counted and compared with the manually delineated gullies to calculate the three factors, in which the manually delin-eated gullies are considered as the reference data. Since the detected gullies may not coincide exactly with the manually delineated ones, the assessment factors are computed accord-ing to the following principles: a detection result which cov-ers at least half length of the corresponding manually delin-eated gully is considered to be a true positive detection (TP); otherwise, it is a false positive detection result (FP); for those manually delineated gullies which are not covered by detec-tion results are counted as false negative detection results
Figure 6. Gully detection results in other five test sites (corresponding to Sites B through F in Table 1 from top to bottom).
PHOTOGRAMMETRIC ENGINEERING & REMOTE SENSING December 2015 917
12-15 December Peer Reviewed.indd 917 11/19/2015 11:13:48 AM

(FN). Figure 7 shows the evaluation result of Site A, with solid lines representing correct detection (true positive) results and dashed lines representing false negative results. The evalua-tion results of Site B through Site F are shown in Plate 1, in which green lines represent correct detection results, yellow lines represent false negative results, and read lines represent false positive results. Table 2 lists the performance quality factors of the six test sites.
Figure 7. Evaluation results of gully detection of Site A (solid lines: correct detection results; dashed lines: false negative results).
Table 2. Gully DeTecTion QualiTy FacTors oF The six siTes
Test site TP FP FN D B Q
A 13 0 4 76% 0 76%
B 24 4 3 89% 0.16 77%
C 16 5 1 94% 0.31 73%
D 66 23 18 79% 0.35 62%
E 94 1 10 90% 0.01 90%
F 31 4 6 84% 0.13 76%
From Table 2, it can be seen that factor D is always higher than 76 percent, indicating most gullies can be correctly detected by this method. Factor B is always below 0.35, sometimes lower than 0.16, which means false detection can be restrained effectively. The values of overall performance factor Q in majority of the test sites are higher than 73 per-cent. Site C has the highest detection percentage because the gullies are well preserved with relatively simple morphology. Site A has the lowest detection percentage, because the image characteristics of some gullies are not as distinctive as that of the successfully detected gullies. Meanwhile, Site A has the lowest value of factor B because there are no other linear features around the gullies with length and width similar to them, and the linear sand ripples are located in a flat area, which have been removed by relief calculation. The highest value of factor B appears in Site D, since there is a number of
linear sand ripples in the upper north part, and DTM data is absent for relief calculation; correspondingly Site D has the lowest value of the overall performance factor Q. Site E has the highest value of the overall performance factor Q. But there is a false positive detection in the upper left part of Site E due to a non-gully dark linear feature.
The gully detection performance is affected by the mor-phology of the gully and the complexity of the background. The severely modified gullies with inconspicuous difference from the background are usually undetected. Other small fea-tures with similar morphology to gullies tend to increase false detection. Some wide gullies are also undetected because we set a small size for the structuring element in Bottom-Hat transformation to reduce false positive detection.
This is a preliminary study of automated Martian gully detection from high-resolution images. In the six test sites, most of the gullies are correctly detected and the false posi-tive detection is restrained at a low level. Overall, the per-formance of the mathematical morphology based method is promising. In principle, the method may be also applied to other linear target detection, but for Mars high-resolution im-ages, the method is most suitable to gully detection with the specified size and length parameters. Further improvement of the method and more extensive validations will be done in the future.
ConclusionsThis paper presents an automated method for Martian gully detection from high resolution HiRISE images based on math-ematical morphology techniques. The method integrates a series of morphological operators, including area opening and closing, Bottom-Hat transformation and path opening. The width and length of the gullies to be detected are controlled by the size of the structuring element for Bottom-Hat trans-formation and the length parameter for path opening. Relief calculation is applied as an extra step to remove/reduce false positive detections, if a DTM is available along with the image. Experimental results at six sites show that the proposed au-tomated method achieves good performance in Martian gully detection with accuracy values ranging between 76 percent and 94 percent. In the future, the method will be further im-proved to enhance its robustness and applicability by inte-grating other techniques such as machine learning. DTM data will be better used to calculate the runoff attributions of the gully such as flow length and watershed area.
ReferencesBalme, M., N. Mangold, D. Baratoux, F. Costard, M. Gosselin, P.
Masson, P. Pinet, and G. Neukum, 2006. Orientation and distribution of recent gullies in the southern hemisphere of Mars: Observations from High Resolution Stereo Camera/Mars Express (HRSC/MEX) and Mars Orbiter Camera/Mars Global Surveyor (MOC/MGS) data, Journal of Geophysical Research: Planets, 111(E5):E05001.
Bandeira, L., W. Ding, and T. F. Stepinski, 2012. Detection of sub-kilometer craters in high resolution planetary images using shape and texture features, Advances in Space Research, 49(1):64–74.
Barata, T., E.I. Alves, J. Saraiva, and P. Pina, 2004. Automatic recognition of impact craters on the surface of Mars, Image Analysis and Recognition (Aurélio Campilho and Mohamed Kamel, editors), Springer, Berlin, pp. 489–496.
Baruch, A., and S. Filin, 2011. Detection of gullies in roughly textured terrain using airborne laser scanning data, ISPRS Journal of Photogrammetry and Remote Sensing, 66(5):564–578.
918 December 2015 PHOTOGRAMMETRIC ENGINEERING & REMOTE SENSING
12-15 December Peer Reviewed.indd 918 11/19/2015 2:09:59 PM

Plate 1. Evaluation results of gully detection of Site B through F (green lines: correct detection results, yellow lines: false negative results, and red lines: false positive results).
Bridges, N.T., and C.N. Lackner, 2006. Northern hemisphere Martian gullies and mantled terrain: Implications for near‐surface water migration in Mars’ recent past, Journal of Geophysical Research: Planets, 111(E9):E09014.
Buckley, M., and H. Talbot, 2000. Flexible linear openings and closings, Mathematical Morphology and Its Applications to Image and Signal Processing (John Goutsias, Luc Vincent, and Dan S. Bloomberg, editors), Springer, Berlin, pp. 109–118.
Bue, B.D., and T.F. Stepinski, 2007. Machine detection of martian impact craters from digital topography data, IEEE Transactions on Geoscience and Remote Sensing, 45(1):265–274.
Carr, M.H., 2006. The Surface of Mars, Cambridge University Press, Cambridge, 307 p.
Costard, F., F. Forget, N. Mangold, and J. Peulvast, 2002. Formation of recent Martian debris flows by melting of near-surface ground ice at high obliquity, Science, 295(5552):110–113.
Costard, F., N. Mangold, D. Baratoux, and F. Forget, 2007. Current gullies activity: Dry avalanches at seasonal defrosting as seen on HiRISE images, Proceedings of the Seventh International Conference on Mars, 09-13 July, Pasadena, California, LPI Contribution No. 1353, pp. 3133.
De Asis, A., K. Omasa, K. Oki, and Y. Shimizu, 2008. Accuracy and applicability of linear spectral unmixing in delineating potential erosion areas in tropical watersheds, International Journal of Remote Sensing, 29(14):4151–4171.
Diniega, S., S .Byrne, N.T. Bridges, C.M. Dundas, and A.S. McEwen, 2010. Seasonality of present-day Martian dune-gully activity, Geology, 38(11):1047–1050.
d’Oleire-Oltmanns, S, I. Marzolff, D. Tiede, and T. Blaschke, 2014. Detection of gully-affected areas by applying object-based image analysis (OBIA) in the region of Taroudannt, Morocco. Remote Sensing, 6(9):8287–8309.
PHOTOGRAMMETRIC ENGINEERING & REMOTE SENSING December 2015 919
12-15 December Peer Reviewed.indd 919 11/19/2015 11:14:01 AM

Eustace, A., M. Pringle, and C. Witte, 2009. Give me the dirt: Detection of gully extent and volume using high-resolution lidar, Innovations in Remote Sensing and Photogrammetry (Simon Jones, and Karin Reinke, editors), Springer, Berlin, pp. 255–269.
Evans, M., and J. Lindsay, 2010. High resolution quantification of gully erosion in upland peatlands at the landscape scale, Earth Surface Processes and Landforms, 35(8):876–886.
Gulick, V., 2008. A closer look at valley, channel and gully formation on Mars with HiRISE, Proceedings of the 39th Lunar and Planetary Institute Science Conference, 10-14 March, League City, Texas, LPI Contribution No. 1391, pp. 2411.
Haralick, R.M., and L.G. Shapiro, 1992. Computer and Robot Vision, Volume I, Addison-Wesley, Boston, Massechuttes pp. 28–48.
Harrison, T.N., G.R. Osinski, and L.L. Tornabene, 2014. Global documentation of gullies with the Mars Reconnaissance Orbiter context camera (CTX) and implications for their formation, Proceedings of the 45th Lunar and Planetary Science Conference, 17-21 March, The Woodlands, Texas, LPI Contribution No.1777, pp. 2124
Head, J.W., D.R. Marchant, and M.A. Kreslavsky, 2008. Formation of gullies on Mars: Link to recent climate history and insolation microenvironments implicate surface water flow origin, Proceedings of the National Academy of Science, 105(36):13258–13263.
Heijmans, H., M. Buckley, and H. Talbot, 2004. Path-based morphological openings, Proceedings of the IEEE 2004 International Conference on Image Processing, 24-27 October, Singapore, pp. 3085–3088.
Heijmans, H., M. Buckley, and H. Talbot, 2005. Path openings and closings, Journal of Mathematical Imaging and Vision, 22(2-3):107–119.
Heldmann, J.L., E. Carlsson, H. Johansson, M.T. Mellon, and O.B. Toon, 2007. Observations of Martian gullies and constraints on potential formation mechanisms: II, The northern hemisphere, Icarus, 188(2):324–344.
Heldmann, J.L., and M.T. Mellon, 2004. Observations of Martian gullies and constraints on potential formation mechanisms, Icarus, 168(2):285–304.
Hoffman, N., 2002. Active polar gullies on Mars and the role of carbon dioxide, Astrobiology, 2(3):313–323.
Höfle, B., L. Griesbaum, and M. Forbriger, 2013. GIS-based detection of gullies in terrestrial LiDAR data of the Cerro Llamoca peatland (Peru), Remote Sensing, 5(11):5851–5870.
James, L.A., D.G. Watson, and W.F. Hansen, 2007. Using LiDAR data to map gullies and headwater streams under forest canopy: South Carolina, USA, CATENA, 71(1):132–144.
Jenson, S.K., and J.O. Domingue, 1988. Extracting topographic structure from digital elevation data for geographic information system analysis, Photogrammetric Engineering &Remote Sensing, 54 (11):1593–1600.
Kim, J.R., J.-P. Muller, S. van Gasselt, J.G. Morley, and G. Neukum, 2005. Automated crater detection, A new tool for Mars cartography and chronology, Photogrammetric Engineering & Remote Sensing, 71(10):1205–1217.
Kneissl, T., D. Reiss, S. Van Gasselt, and G. Neukum, 2010. Distribution and orientation of northern-hemisphere gullies on Mars from the evaluation of HRSC and MOC-NA data, Earth and Planetary Science Letters, 294(3):357–367.
Knight, J., J. Spencer, A. Brooks, and S. Phinn, 2007. Large-area, high-resolution remote sensing based mapping of alluvial gully erosion in Australia’s tropical rivers, Proceedings of the 5th Australian Stream Management Conference, 21-25 May, Thurgoona, Australia, pp. 199–204.
Lee, P., C.S. Cockell, M.M. Marinova, C.P. McKay, and J.W. Rice, Jr, 2001. Snow and ice melt flow features on Devon Island, Nunavut, Arctic Canada as possible analogs for recent slope flow features on Mars, Proceedings of the 32nd Lunar and Planetary Science Conference, 12-16 March, Houston, Texas, pp. 1809.
Luengo-Hendriks, C.L., 2010. Constrained and dimensionality-independent path openings, IEEE Transactions on Image Processing, 19(6):1587–1595.
Malin, M.C., and K.S. Edgett, 2000. Evidence for recent groundwater seepage and surface runoff on Mars, Science, 288(5475):2330–2335.
Mellon, M.T., and R.J. Phillips, 2001. Recent gullies on Mars and the source of liquid water, Journal of Geophysical Research, 106(E10):23165–23180.
Metternicht, G., and J. Zinck, 1998. Evaluating the information content of JERS-1 SAR and Landsat TM data for discrimination of soil erosion features, ISPRS Journal of Photogrammetry and Remote Sensing, 53(3):143–153.
Molloy, I., and T. Stepinski, 2007. Automatic mapping of valley networks on Mars, Computers & Geosciences, 33(6):728–738.
Musselwhite, D.S., T.D. Swindle, and J.I. Lunine, 2001. Liquid CO2 breakout and the formation of recent small gullies on Mars, Geophysical Research Letters, 28(7):1283–1285.
Reiss, D., G. Erkeling, K.E. Bauch, and H. Hiesinger, 2010. Evidence for present day gully activity on the Russell crater dune field, Mars, Geophysical Research Letters, 37(6):L06203.
Shruthi, R.B., N. Kerle, and V. Jetten, 2011. Object-based gully feature extraction using high spatial resolution imagery, Geomorphology, 134(3):260–268.
Shufelt, J.A., 1999. Performance evaluation and analysis of monocular building extraction from aerial imagery, IEEE Transactions on Pattern Analysis and Machine Intelligence, 21(4):311–326.
Sofia, G., P. Tarolli, F. Cazorzi, and G. Dalla-Fontana, 2011. An objective approach for feature extraction: Distribution analysis and statistical descriptors for scale choice and channel network identification, Hydrology and Earth System Sciences, 15(5):1387–1402.
Soille, P., 2003. Morphological Image Analysis: Principles And Applications, Springer-Verlag New York, Inc., 391 p.
Statella, T., P. Pina, and E.A. da Silva, 2012. Image processing algorithm for the identification of Martian dust devil tracks in MOC and HiRISE images, Planetary and Space Science, 70(1):46–58.
Stepinski, T., and M. Collier, 2004. Extraction of Martian valley networks from digital topography, Journal of Geophysical Research: Planets, 109(E11):E11005.
Swets, J., 1988. Measuring the accuracy of diagnostic systems, Science, 240(4857):1285–1293.
Tarboton, D.G., R.L. Bras, and I.Rodriguez-Iturbe, 1991. On the extraction of channel networks from digital elevation data, Hydrological Processes 5:81–100.
Tarboton, D.G., and D.P. Ames, 2001. Advances in the mapping of flow networks from digital elevation data, Proceedings of World Water And Environmental Resources Congress, 20-24 May, Orlando, Florida, pp. 1–10.
Treiman, A.H., 2003. Geologic settings of Martian gullies: Implications for their origins, Journal of Geophysical Research, 108(E4):8031–8042.
Valero, S.,J. Chanussot, J.A. Benediktsson, H. Talbot, and B. Waske, 2009. Directional mathematical morphology for the detection of the road network in very high resolution remote sensing images, Proceedings of the 16th IEEE International Conference on Image Processing, 07-11 November, Cairo, Egypt, pp. 3725–3728.
Vincent L., 1993. Grayscale area openings and closings, Their efficient implementation and applications, Proceedings of EURASIP Workshop on Mathematical Morphology and Its Applications to Signal Processing, Barcelona, Spain, pp. 22–27.
Vrieling, A., S. Rodrigues, H. Bartholomeus, and G. Sterk, 2007. Automatic identification of erosion gullies with ASTER imagery in the Brazilian Cerrados, International Journal of Remote Sensing, 28(12):2723–2738.
Yue, Z., W. Hu, B. Liu, Y. Liu, X. Sun, Q. Zhao, and K. Di, 2014. Quantitative analysis of the morphology of Martian gullies and insights into their formation, Icarus, 243:208–221.
(Received 14 August 2014; accepted 12 April 2015; final ver-sion 12 June 2015)
920 December 2015 PHOTOGRAMMETRIC ENGINEERING & REMOTE SENSING
12-15 December Peer Reviewed.indd 920 11/19/2015 11:14:01 AM