autogrill group - message-asp.comautogrill14ar.rep.message-asp.com/sites/autogrill14ar/files/... ·...
TRANSCRIPT

2014
Autogrill Group
Annual Report


Autogrill Group2014 Annual Report
Translation from the Italian original which remains the definitive version


2014 Annual Report
3
Chairman’s message
Dear Shareholders,
This year, the first since the demerger from World Duty Free, reflects the Group’s results
exclusively in the travel food & beverage business, in which the Company is the world
leader.
Autogrill’s strategic refocussing on food & beverage is happening at a time when the
economic situation is looking more positive than in recent years. The world economy is
showing the first signs of recovery, which I trust our Group will be able to exploit
increasingly effectively, thanks to the strategy of international expansion underpinning our
business development.
Economic recovery has been faster in North America, where the Group further
consolidated its leadership, and in emerging markets, especially Asia and the Middle East,
where Autogrill entered major new contracts. These are key markets for the future that we
will continue to cultivate, ever ready to take up new growth opportunities as soon as they
occur.
In Europe, Autogrill prioritised a strategy of selective investments mainly in the airport
channel. In Italy, despite the scaling down of commercial operations on motorways, the
Company decided to contribute to the growth and prestige of Milan, which is hosting the
Expo 2015, by building a multi-store in the heart of the city – Il Mercato del Duomo –
where the Group is concentrating much of the know-how and innovation it is developing
on the domestic and international markets.
Thanks to this progress, which has strengthened Autogrill’s leadership in the sector, and the
quality and duration of its concessions portfolio, we look to the future with the conviction
that there are still important opportunities to take up, also through industrial aggregation
capable of further increasing the value of the Company for all the Shareholders.
Gilberto Benetton

Autogrill Group
4

2014 Annual Report
5
Letter from the CEO
Dear Stakeholders,
In 2014, we worked hard to build the platform for a new phase in the development of our
business.
Month by month, Autogrill consolidated its strength in mature markets, like Europe and
North America, and took important growth opportunities in emerging markets, mainly by
winning new contracts in major airports in fast growing economies like Vietnam, Indonesia,
the United Arab Emirates and Turkey.
These initiatives reflect our Group’s main focus on the airport channel, where we have
made heavy investments and developed new foodservice concepts that we hope will
satisfy the needs - which are continually evolving and increasingly sophisticated - of all the
travellers that visit our points of sale every day.
Meanwhile, in Italy, where the market continued to be weak, Autogrill started to redefine its
boundary of operations to concentrate resources on the locations with the highest potential.
Thanks to these measures and the numerous innovations we’ve introduced, as well as the
know-how acquired by the Group over many years of doing business globally, I am
confident that Autogrill can exploit the new opportunities that will arise in the future.
A future we are confident of also in light of falling oil prices, which favour increases in
traffic flows.
With these assumptions we will continue the work done last year with the conviction that
we can build on the good results delivered in 2014.
Gianmario Tondato Da Ruos

Autogrill Group
6
Company bodies

2014 Annual Report
7
Com
pany
bod
ies
Board of Directors1
Chairman 2, 3 Gilberto Benetton
CEO 2, 3, 4 Gianmario Tondato Da Ruos E
Directors Ernesto Albanese I
Tommaso Barracco 5, I
Alessandro BenettonFrancesco Umile Chiappetta 6, I
Carolyn Dittmeier 6, 7, I
Massimo Fasanella d’Amore di Ruffano 5, 8, I
Giorgina Gallo 5, 7, I
Gianni Mion 5
Stefano Orlando 6, 7, 8, I, L
Paolo Roverato 6, 8
Neriman Ülsever I
Secretary Paola Bottero
Board of Statutory Auditors9
Chairman Marco Rigotti 10
Standing auditor Luigi Biscozzi 10
Standing auditor Eugenio Colucci 10
Alternate auditor Giuseppe Angiolini 10
Alternate auditor Pierumberto Spanò 10
Independent auditors 11 KPMG S.p.A.
1. Elected by the annual general meeting of 28 May 2014; in office until approval of the 2016 financial statements
2. Appointed at the Board of Directors meeting of 28 May 20143. Powers assigned by law and the company’s by-laws, particularly legal representation with individual
signing authority4. Powers of ordinary administration, with individual signing authority, per Board resolution of 28 May 20145. Member of the Strategies and Investments Committee6. Member of the Internal Control, Risks and Corporate Governance Committee7. Member of the Related Party Transactions Committee8. Member of the Human Resources Committee9. Elected by the annual general meeting of 19 April 2012; in office until approval of the 2014 financial
statements10. Certified auditor11. Engagement awarded by the shareholders’ meeting of 27 April 2006, to expire on approval of the 2014
financial statementsE Executive directorI Independent director as defined by the Corporate Governance Code for Listed Companies (version
approved in July 2014 by the Corporate Governance Committee and endorsed by Borsa Italiana, ABI, Ania, Assogestioni, Assonime and Confindustria) and pursuant to arts. 147-ter (4) and 148 (3) of Legislative Decree 58/1998
L Lead Independent Director

Autogrill Group
Contents

2014 Annual Report
9
Con
tent
s
1. Directors’ report 11
1.1 The Autogrill Group 13
1.2 Group performance 191.2.1 General business context 191.2.2 Highlights 201.2.3 Financial position 25
1.3 Business segments 29
1.4 Outlook 39
1.5 Other information 411.5.1 Corporate Social Responsibility 411.5.2 Main risks and uncertainties faced by the Autogrill Group 431.5.3 Corporate Governance 471.5.4 Management and coordination 471.5.5 Related party transactions 481.5.6 Statement pursuant to art. 2.6.2(9) of the Regulations for Markets Organized
and Managed by Borsa Italiana S.p.A. 481.5.7 Research and development 481.5.8 Treasury shares 481.5.9 Significant non-recurring events and transactions 491.5.10 Atypical or unusual transactions 491.5.11 Information pursuant to arts. 70 and 71 of Consob Regulation no. 11971/1999 491.5.12 Reconciliation between parent and consolidated equity 49
2. Consolidated financial statements 51
2.1 Consolidated financial statements 522.1.1 Statement of financial position 522.1.2 Income statement 532.1.3 Statement of comprehensive income 542.1.4 Statement of changes in equity 552.1.5 Statement of cash flows 57
2.2 Notes to the consolidated financial statements 58
Annexes 138List of consolidated companies and other investments 138Certification by the CEO and manager in charge of financial reporting 143External Auditors’ Report 144


1. Directors’ report

Autogrill Group
12
1. Directors’ report
Definitions and symbols
Exchange rates: more than half the Group’s operations are located in countries which use a non-euro currency, primarily the United States of America, Canada, Switzerland, and the United Kingdom. Due to the local nature of the business, in each country revenue is generally expressed in the same currency as costs and investments. The Group also has a currency risk management policy, financing most of its net assets in the principal non-euro currencies with debt in the same currency, or entering into currency hedges that achieve the same effect. However, this does not neutralize the impact of exchange rate fluctuations when translating individual financial statement items. In comparisons with prior-year figures, the phrase “at constant exchange rates” may also be used, to signify the increase or decrease that would have occurred had the comparative figures of consolidated companies with functional currencies other than the euro been calculated at the same exchange rates employed for the period under review.
Revenue: in the directors’ report this refers to operating revenue, excluding fuel sales. Costs as a percentage of revenue are calculated on this basis.
EBITDA: this is the sum of EBIT (earnings before interest and tax) and depreciation, amortization and impairment losses, and can be gleaned directly from the consolidated financial statements, as supplemented by the notes thereto. Because it is not defined in IFRS, it could differ from and therefore not be comparable with EBITDA reported by other companies.
Capital expenditure: this excludes investments in non-current financial assets and equity investments.
Comparable basis: this refers to revenue generated only by locations open throughout the comparison period as well as the period under review, without any significant change in products sold or services provided.
Symbols: unless otherwise specified, amounts in the directors’ report are expressed in millions of euros (Em) or millions of US dollars ($m). In the notes to the financial statements, unless otherwise specified, amounts are expressed in thousands (Ek and $k).
Where figures have been rounded to the nearest million, sums, changes and ratios are calculated using figures extended to thousands for the sake of greater accuracy.

2014 Annual Report
13
1.1
The
Aut
ogril
l Gro
up
1.1 The Autogrill GroupOperations
Autogrill is the world’s largest provider of food & beverage services for travelers and is the recognized leader of the US and Italian markets.Present in 29 countries with a workforce of 54,000, it manages more than 4,300 points of sale in approximately 1,000 locations. It operates mainly through concessions: at airports, along motorways and in railway stations, as well as on high streets and at shopping centers, trade fairs and cultural attractions.It offers a highly varied selection, including both proprietary products and concepts (such as Ciao, Bistrot, Bubbles, Beaudevin and La Tapenade) and third-party concepts and brands. The latter include local brands as well as names recognized around the world (Starbucks Coffee, Burger King, Brioche Dorée, etc.). Autogrill manages a portfolio of more than 250 brands, directly or under license.
Strategy
The Group’s strategy is to ensure steady growth in value through expansion and diversification into different geographical areas and channels, constant product and concept innovation, and the improvement of service with a view to increasing the satisfaction of customers and concession grantors.In the airport and railway station channel, the Group plans to expand in countries where it is already active, as well as in new ones with good potential for an increase in traffic. In the motorway channel, efforts are more selective, given the limited growth potential in developed countries and the extensive investments needed to penetrate new markets. Menus are kept up-to-date through the development of new concepts and the ongoing review of partner brands, so that the most innovative and attractive brands the market has to offer are always in the Group’s portfolio.The Group judges how well it is achieving its objectives by monitoring customer satisfaction and the growth of sales and cash generation, earned through the acquisition and management of a broad, diversified portfolio of concessions with strategically balanced durations.Autogrill is committed to simplifying organizational charts and business processes and to enhancing operating efficiency and investments, efforts that are constantly monitored so as to free up financial and managerial resources that can better be devoted to growth.Maintaining a well-balanced financial structure is crucial to the Group’s objectives. Any opportunities for growth by accretion will be assessed for consistency with strategic objectives (in terms of areas and channels served) and financial sustainability.

Autogrill Group
14
1. Directors’ report
Autogrill around the worldThe Autogrill Group is active in 29 countries around the globe.
COFFEE, BAKERY& FINE FOOD
Mercedes-Benz CafèRestaurant | Lounge bar
Proprietary brands
Licensed brands

2014 Annual Report
15
1.1
The
Aut
ogril
l Gro
up
Channel of activity North America International Italy
Other European countries Total
Airports 82 43 8 11 144
Motorways 97 - 410 215 722
Railway stations - - 14 37 51
Malls 5 - 36 9 50
Others - - 20 7 27
Total 184 43 488 279 994
AustraliaAustriaBelgiumCanadaCzech Republic
DenmarkFinlandFranceGermanyGreece
IndiaIndonesiaIrelandItalyMalaysia
New ZealandPolandRussiaSingaporeSlovenia
SpainSwedenSwitzerlandThe NetherlandsTurkey
United Arab EmiratesUnited KingdomUSAVietnam
Location by channel
Autogrill Group
16
1. Directors’ report
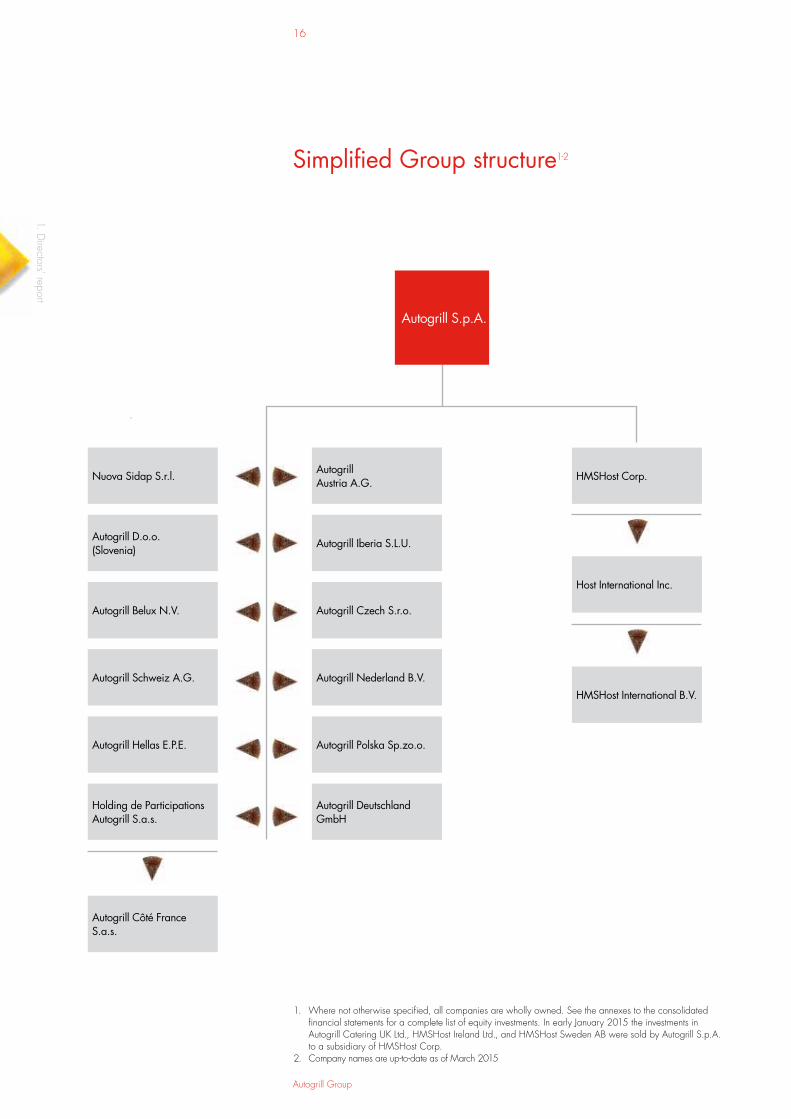
Simplified Group structure1-2
1. Where not otherwise specified, all companies are wholly owned. See the annexes to the consolidated financial statements for a complete list of equity investments. In early January 2015 the investments in Autogrill Catering UK Ltd., HMSHost Ireland Ltd., and HMSHost Sweden AB were sold by Autogrill S.p.A. to a subsidiary of HMSHost Corp.
2. Company names are up-to-date as of March 2015
Nuova Sidap S.r.l.
Autogrill D.o.o. (Slovenia)
Autogrill Belux N.V.
Autogrill Schweiz A.G.
Autogrill Hellas E.P.E.
Holding de Participations Autogrill S.a.s.
Autogrill Côté France S.a.s.
Autogrill S.p.A.
HMSHost Corp.
Host International Inc.
AutogrillAustria A.G.
Autogrill Iberia S.L.U.
Autogrill Czech S.r.o.
Autogrill Nederland B.V.
Autogrill Polska Sp.zo.o.
Autogrill Deutschland GmbH
HMSHost International B.V.

2014 Annual Report
17
1.1
The
Aut
ogril
l Gro
up
3. United States of America, Canada4. It includes North Europe: Amsterdam (Schiphol Airport), Finland, Ireland, United Kingdom, Sweden/
Denmark and Rest of the world: Australia, United Arab Emirates, India, Indonesia, Malaysia, New Zealand, Russia, Singapore, Turkey, Vietnam
5. Italy and Other European countries: Austria, Belgium, France, Germany, Greece, The Nederlands (motorways), Poland, Czech Republic, Slovenia, Spain, Switzerland
Organizational structureThe Group is structured in business units, which manage operational levers according to objectives and guidelines defined by the corporate executives of Autogrill S.p.A.
Board of Directors
Group Chief Executive Officer
Group Chief HR & Organization Officer
Group Chief Internal Audit & CSR Officer
Group Chief Marketing Officer
Group Chief Financial Officer (Financial reporting Officer Law 262)
Group General Counsel
Group Chief Engineering & Procurement
Group Corporate Communications Manager
CEO North America 3 CEO International 4 COO Europe 5
Public Affairs Director

Autogrill Group
1. Directors’ report

2014 Annual Report
19
1.2
Gro
up p
erfo
rman
ce
6. Source: IATA - Industry Financial Forecast - December 20147. Source: AISCAT - December 20148. Source: Federal Highway Administration (FHWA): January - November 2014
1.2 Group performance1.2.1 General business context
1.2.1.1 The air transport industry and the trend in airport traffic 6
In 2014 passenger traffic at airports worldwide grew by 5.1%, thanks especially to a 5.8% increase in the international component. The significant growth of the air transport industry was achieved despite limited economic recovery in Europe and a highly unstable political climate in some parts of the world, including Eastern Europe and the Middle East.In 2014, passengers in North America numbered 1.3 billion, an increase of 3.3% on the previous year. Domestic traffic was up by 2.9%, and international traffic by 6.1%.In Europe there were around 1.3 billion passengers, an increase of 5.3% on the previous year, with growth rates roughly equal for international traffic (+5.3%) and domestic (+5.1%).Asia, with about 1.2 billion passengers, enjoyed traffic growth of 5.9%.In South America, traffic was up by 6.4% to about 370 million passengers, while the Middle East (180 million passengers) showed a 9.4% increase thanks to record growth in international traffic at airports like Abu Dhabi and Doha.
1.2.1.2 The trend in motorway traffic
In Italy, the Group’s largest motorway market, traffic increased by a total of 0.9% after three years of decline, thanks in part to lower fuel costs towards the end of the year. The growth was driven more by light traffic (+1.0%) than by heavy vehicles (+0.7%) 7.In the United States, traffic showed an increase of 0.5% with respect to 2013 8.

Autogrill Group
20
1. Directors’ report
1.2.2 HighlightsDue to the proportional partial demerger of Autogrill S.p.A. to World Duty Free S.p.A. with effect from 1 October 2013, the results of the Travel Retail & Duty Free business for the first nine months of 2013 are presented separately, in accordance with IFRS 5 “Non-current Assets Held for Sale and Discontinued Operations”.To better represent the performance of the various business segments, starting from the fourth quarter of 2014 the results of HMSHost are split into its two components: North America (United States and Canada) and International (Northern Europe, Middle East and Asia). The International area also includes operations in the United Kingdom, Ireland, Sweden and Denmark, previously included under “Other European countries”.For ease of comprehension, “Corporate” functions serving the Group as a whole no longer include those pertaining to European operations only, which are now termed “European Structure”.
Full Year 2014
Change
(Em) Full Year 2013 2013At constant
exchange rates
Revenue 3,930.2 3,984.8 -1.4% -0.9%
EBITDA 316.2 314.0 0.7% 1.2%
EBITDA margin 8.0% 7.9%
EBIT 118.6 88.3 34.4% 35.7%
EBIT margin 3.0% 2.2%
Profit from continuing operations 37.0 8.3 343.7% 398.5%
% of revenue 0.9% 0.2%
Profit from discontinued operations (demerger)
- 91.1 -100.0% -100.0%
Profit attributable to owners of the parent
25.1 87.9 -71.4% -71.1%
Earnings per share (E cents)*
- basic 9.9 34.7
- diluted 9.9 34.6
Net cash flows from operating activities
223.5 148.1
Net investment 196.4 162.6 20.8% 21.0%
% of net sales 5.0% 4.1%
* Earnings per share of third quarter 2013 includes Profit from discontinued operations (demerger)
31.12.2014
Change
(Em) 31.12.2013 31.12.2013At constant
exchange rates
Net invested capital 1,184.0 1,117.5 66.5 (17.3)
Net financial position 693.3 672.7 20.6 (35.4)

2014 Annual Report
21
1.2
Gro
up p
erfo
rman
ce
Condensed consolidated income statement 9
Full Year 2014
Change
(Em) % of revenue Full Year 2013 % of revenue 2013At constant
exchange rates
Revenue 3,930.2 100.0% 3,984.8 100.0% -1.4% -0.9%
Other operating income 130.5 3.3% 146.3 3.7% -10.8% -10.8%
Total revenue and other operating income 4,060.8 103.3% 4,131.1 103.7% -1.7% -1.3%
Raw materials, supplies and goods (1,304.1) 33.2% (1,331.4) 33.4% -2.0% -1.6%
Personnel expense (1,296.6) 33.0% (1,318.2) 33.1% -1.6% -1.2%
Leases, rentals, concessions and royalties (668.5) 17.0% (677.4) 17.0% -1.3% -0.9%
Other operating expense (475.4) 12.1% (490.2) 12.3% -3.0% -2.7%
EBITDA 316.2 8.0% 314.0 7.9% 0.7% 1.2%
Depreciation, amortization and impairment losses (197.6) 5.0% (225.8) 5.7% -12.5% -12.2%
EBIT 118.6 3.0% 88.3 2.2% 34.4% 35.7%
Net financial expense (44.4) 1.1% (50.5) 1.3% -12.0% -12.1%
Impairment losses on financial assets 3.0 0.1% (2.4) 0.1% n.s. n.s.
Pre-tax profit 77.2 2.0% 35.4 0.9% 118.2% 123.7%
Income tax (40.2) 1.0% (27.1) 0.7% 48.7% 48.5%
Profit from continuing operations 37.0 0.9% 8.3 0.2% 343.7% 398.5%
Profit from discontinued operations (demerger) - 0.0% 91.1 2.3% -100.0% -100.0%
Profit attributable to: 37.0 0.9% 99.4 2.5% -62.8% -62.4%
- owners of the parent 25.1 0.6% 87.9 2.2% -71.4% -71.1%
- non- controlling interests 11.9 0.3% 11.5 0.3% 3.0% 3.0%
9. “Revenue” and “Raw materials, supplies and goods” differ from the amounts shown in the consolidated income statement primarily because they do not include revenue and costs from fuel sales, the net amount of which is classified as “Other operating income” in accordance with management’s protocol for the analysis of Group figures. This revenue came to E 531.2m in 2014 (E 561.1m in 2013) and the cost to E 509.6m (E 542.7m the previous year).

Autogrill Group
22
1. Directors’ report
Revenue
The Group closed 2014 with consolidated revenue of E 3,930.2m, a decrease of 0.9% (-1.4% at current exchange rates) compared with the previous year’s revenue of E 3,984.8m. After adjusting for the deconsolidation of the US Retail business, which was sold early in the fourth quarter of 2013 and contributed $ 131.5m in revenue, the change was a positive 1.6% (+1.1% at current exchange rates).Revenue was on the rise for HMSHost’s North American operations, sustained chiefly by the increase in average purchase per customer and the positive traffic trend, which led to larger number of transactions.HMSHost International gave an outstanding performance, thanks in part to its expanded sphere of activity, with new openings at UK airports and its debut in other markets such as Russia and Indonesia.In Europe, revenue decreased due to the Group’s strategy of narrowing its perimeter in Italy. Sales were on the rise in Belgium, Germany and Spain as a result of new openings.
Sales by channel are detailed below:
(Em) Full Year 2014 Full Year 2013
Change
2013At constant
exchange rates
Airports 1,966.9 1,890.5 4.0% 4.8%
Motorways 1,622.4 1,629.9 -0.5% -0.2%
Railway stations 161.7 145.1 11.4% 11.5%
Other 179.2 220.2 -18.6% -18.7%
Total (excl. transferred US Retail business)
3,930.2 3,885.8 1.1% 1.6%
Transferred US Retail business - 99.0 -100.0% -100.0%
Total revenue 3,930.2 3,984.8 -1.4% -0.9%
The general upturn in passenger traffic bolstered the performance of airports, where revenue increased by 4.8% 10. Overall growth in this channel and expansion at railway stations more than offset the slight decrease in the motorway channel, which is prevalent in Europe, and the decline in sales at other locations—high streets, trade fairs and shopping centers—many of which are no longer operated by the Group.
EBITDA
Consolidated EBITDA in 2014 amounted to E 316.2m, an increase of 1.2% (+0.7% at current exchange rates) compared with the previous year’s E 314.0m, and went from 7.9% of revenue in 2013 to 8.0% this year.Excluding non-recurring components 11 and the contribution 12 of the US Retail business (sold in 2013), EBITDA would have increased by 5.9% (+5.4% at current exchange rates) and amounted to 8.3% of revenue (8.0% the previous year); the change stems mainly from the improved profitability of the areas operated by HMSHost.
10. +4% at current exchange rates11. 2014, reorganization costs of E 11.8m; 2013: net non-recurring charges of E 2.3m (reorganization costs of E 11.6m, demerger costs
of E 4.5m and non-recurring income of E 13.8m)12. Amounting to $ 6.8m

2014 Annual Report
23
1.2
Gro
up p
erfo
rman
ce
Corporate 13 costs in 2014 amounted to E 20.9m, down from E 27.1m the previous year, when they included costs incurred for the demerger of the Travel Retail & Duty Free business (E 4.5m).
Change in EBITDA margin
Depreciation, amortization and impairment losses
These came to E 197.6m, down from E 225.8m in 2013 (-12.2%, or -12.5% at current exchange rates). The change reflects a decrease in amortization and depreciation (from E 15.7m in 2013 to E 10.1m), as well as lower investments in recent years with respect to the past.
Net financial expense
Net financial expense in 2014 came to E 44.4m, down from E 50.5m the previous year, due mainly to the fact that the amortization of interest rate hedging instruments was no longer a factor as such instruments were cancelled ahead of their original maturity (March 2013) during the debt refinancing of July 2011. Also contributing were the reduction in average annual indebteness and the lower average cost of borrowing, which fell from 5.4% in 2013 to 5.1%.
Income tax
Tax increased from E 27.1m in 2013 to E 40.2m, due to the higher pre-tax profit, which rose from E 35.4m to E 77.2m. The average tax rate, calculated excluding IRAP and CVAE14 for both years (E 8.1m in 2014 and E 9.2m in 2013), came to 41.6% in 2014 and 50.4% the previous year.
2013at costant exchange
rates
Cost ofgoods sold
Personnel expense
Costof rentals
and concessions
Other costs
2014
10%
8%
6%
4%
2%
0
7.9% 0.2% 0.1% 0.0% (0.1%) 8.0%
13. Compared with the figures published previously, Corporate costs now exclude those incurred by European Structure, in keeping with the new distinctions among operating segments (see page 29)
14. IRAP, which is charged on Italian operations and whose basis is essentially EBIT plus personnel expense, came to E 6.3m in 2014 (E 7.4m the previous year); CVAE, charged on French operations and calculated on the basis of revenue and value added, amounted to E 1.8m in 2014 (in line with the previous year)

Autogrill Group
24
1. Directors’ report
Profit from continuing operations (Food & Beverage)
In 2014 the profit from continuing operations was E 37m, a strong increase on the previous year’s E 8.3m, thanks to the improvement in operating profitability and the decrease in financial expense.
Profit from discontinued operations (demerger) (Travel Retail & Duty Free)
The consolidated profit for 2013 included E 91.1m from the Travel Retail & Duty Free business, which was demerged on 1 October 2013.
Profit for the year
The 2014 profit attributable to the owners of the parent amounted to E 25.1m, compared with E 87.9m in 2013, when the Travel Retail & Duty Free business was still part of the Group.Profit for the year attributable to non-controlling interests came to E 1.9m (E 11.5m the previous year).

2014 Annual Report
25
1.2
Gro
up p
erfo
rman
ce
1.2.3 Financial position
Reclassified consolidated statement of financial position 15
(Em) 31.12.2014 31.12.2013
Change
2013At constant
exchange rates
Intangible assets 868.3 811.1 57.2 0.4
Property, plant and equipment 834.9 782.5 52.4 1.5
Financial assets 22.8 22.0 0.8 0.3
A) Non-current assets 1,726.0 1,615.6 110.4 2.2
Inventories 123.5 106.1 17.4 14.3
Trade receivables 43.5 46.4 (2.9) (3.6)
Other receivables 179.9 191.1 (11.2) (18.2)
Trade payables (406.7) (396.2) (10.5) 0.3
Other payables (335.0) (287.5) (47.6) (30.5)
B) Working capital (394.7) (340.0) (54.7) (37.7)
C) Invested capital, less current liabilities 1,331.3 1,275.6 55.7 (35.5)
D) Other non-current non-financial assets and liabilities (147.3) (158.1) 10.7 18.3
E) Net invested capital 1,184.0 1,117.5 66.5 (17.3)
Equity attributable to owners of the parent 458.5 413.6 45.0 17.6
Equity attributable to non-controlling interests 32.1 31.2 0.9 0.6
F) Equity 490.7 444.8 45.9 18.2
Non-current financial liabilities 752.7 748.2 4.5 (48.8)
Non-current financial assets (4.9) (11.1) 6.2 7.7
G) Non-current financial indebtedness 747.8 737.0 10.7 (41.0)
Current financial liabilities 150.0 128.2 21.8 12.4
Cash and cash equivalents and current financial assets (204.5) (192.5) (12.0) (6.8)
H) Current net financial indebtedness (54.5) (64.3) 9.8 5.6
Net financial position (G + H) 693.3 672.7 20.6 (35.4)
I) Total as in E) 1,184.0 1,117.5 66.5 (17.3)
15. The figures in the reclassified consolidated statement of financial position are directly derived from the consolidated financial statements and notes, with the exception of “Financial assets”, which do not include “Financial receivables from third parties” (E 4.9m) classified as non-current financial receivables in the net financial position and included in other financial assets (non-current) in the consolidated statement of financial position

Autogrill Group
26
1. Directors’ report
Net invested capital at 31 December 2014 came to E 1,184m, up from E 1,117.5m the previous year for an increase of E 66.5m, due to the change in the euro/US dollar exchange rate.
Cash flow
(Em) Full Year 2014 Full Year 2013
EBITDA 316.2 314.0
Change in working capital and net change in non-current non-financial assets and liabilities
(20.9) (87.9)
Other items (4.5) (1.9)
Cash flows from operating activities 290.9 224.2
Tax (paid)/refunded (36.5) (33.9)
Net interest paid (30.8) (42.1)
Net cash flows from operating activities 223.5 148.1
Net CAPEX (175.9) (184.9)
Vietnam acquisition - (16.0)
Disposal of Retail US business 4.2 74.1
Free operating cash flows 51.8 21.4
In 2014 the Group generated free operating cash flows of E 51.8m, rising from E 21.4m the previous year, thanks to an improvement in cash flows from operating activities caused by the reduced absorption of net working capital.The change in net working capital was helped in 2014 by the receipt of $ 18.2m from the World Duty Free Group in connection with the disposal of the US Retail business, while in 2013 the payment of E 15m in long-term bonuses to managers had contributed to the item’s negative balance.The reduction in net interest paid owes to the decrease in average debt and the benefits arising from the early termination of interest rate hedging derivatives based on bonds issued by HMSHost Corp. (approximately $ 7.6m).
Net financial position
The net financial position at 31 December 2014 was E 693.3m, compared with E 672.7m the previous year. The generation of operating cash flow was sufficient to fund all investment for the year. The increase in the net indebtedness is therefore due solely to the effect of translating debt denominated in US dollars into euros.

2014 Annual Report
27
1.2
Gro
up p
erfo
rman
ce
Change in net financial position (Em)
* Includes E 12m minority dividend distribution
The fair value loss on interest rate hedging derivatives at 31 December 2014 was E 3.5m, compared with a fair value loss of E 1.3m at the end of 2013 (continuing operations). At 31 December 2014, 56% of net financial indebtedness was denominated in US dollars and the rest in euros, while 64% was fixed-rate, including by way of interest rate swaps. In 2014 the weighted average cost of debt was 5.1%, down from 5.4% the previous year. Debt consists mainly of committed non-current credit lines from banks and of long-term bonds (private placements). Loans had an average remaining life of three years and four months.The Group’s loan contracts and bond issues require it to uphold certain financial ratios. At 31 December 2014 all of these were amply satisfied.
800
600
400
200
0
31.12.2013 Fx difference Net capex Disposalof US Retail
Business
Net cash flows fromoperating activities
Other movements
31.12.2014
672.756.0 (223.5)
175.9 (4.2) 16.4 * 693.3

Autogrill Group
1. Directors’ report

2014 Annual Report
29
1.3
Busin
ess
segm
ents
1.3 Business segmentsTo better represent the performance of the various business segments, starting from the fourth quarter of 2014 the results of HMSHost are split into its two components: North America (United States and Canada) and International (Northern Europe, Middle East and Asia). The International area also includes operations in the United Kingdom, Ireland, Sweden and Denmark, previously included under “Other European countries”.For ease of comprehension, “Corporate” functions serving the Group as a whole no longer include those pertaining to European operations only, which are now termed “European Structure”.
Revenue by geographical areaRevenue is broken down below by geographical area:
(Em) Full Year 2014 Full Year 2013
Change
2013At constant
exchange rates
North America 1,847.9 1,817.8 1.7% 2.6%
International 278.2 232.6 19.6% 20.6%
Total HMSHost 2,126.2 2,050.4 3.7% 4.7%
Italy 1,091.7 1,154.1 -5.4% -5.4%
Other European countries 712.3 681.3 4.6% 4.3%
Total Europe 1,804.1 1,835.4 -1.7% -1.8%
Total (excl. transferred US Retail business)
3,930.2 3,885.8 1.1% 1.6%
Transferred US Retail business - 99.0 -100.0% -100.0%
Total revenue 3,930.2 3,984.8 -1.4% -0.9%
and here as a percentage of total revenue:
47.0%
27.8%
7.1%
18.1%46.8%
29.7%
6.0%
17.5%
Other European countries
Italy
International
North America
2014 2013

Autogrill Group
30
1. Directors’ report
EBITDA by geographical areaBelow are the details of EBITDA by geographical area:
(Em) Full Year 2014 % of revenue Full Year 2013 % of revenue
Change
2013At constant
exchange rates
North America 202.4 11.0% 194.9 10.7% 3.8% 4.6%
International 35.2 12.6% 30.0 12.9% 17.2% 17.9%
Total HMSHost 237.5 11.2% 224.9 11.0% 5.6% 6.4%
Italy 61.9 5.7% 73.2 6.3% -15.5% -15.5%
Other European countries 46.7 6.6% 46.3 6.8% 0.9% 0.5%
Europe Structure (9.0) - (8.5) - 6.2% 6.2%
Total Europe 99.6 5.5% 111.0 6.1% -10.3% -10.5%
Corporate costs (20.9) - (27.1) - -22.9% -22.9%
EBITDA (excl. transferred US Retail business) 316.2 8.0% 308.9 7.9% 2.4% 2.9%
Transferred US Retail business - - 5.1 - -100.0% -100.0%
Total EBITDA 316.2 8.0% 314.0 7.9% 0.7% 1.2%

2014 Annual Report
31
1.3
Busin
ess
segm
ents
HMSHost 16
In 2014, after adjusting for the sale of the US Retail 17 business (which had contributed $ 131.5m), HMSHost produced revenue of $ 2,824.6m, an increase of 4.7% (3.7% at current exchange rates) on the previous year’s figure of $ 2,723.1m. Overall, sales decreased by 0.2% (-1.1% at current exchange rates).
Revenue by channel is shown below:
($m) Full Year 2014 Full Year 2013
Change
2013At constant
exchange rates
Airports 2,333.2 2,228.4 4.7% 5.6%
Motorways 445.5 440.4 1.2% 2.7%
Other 45.9 54.3 -15.5% -15.5%
Total (excl. transferred US Retail business)
2,824.6 2,723.1 3.7% 4.7%
Transferred US Retail business - 131.5 -100.0% -100.0%
Total revenue 2,824.6 2,854.6 -1.1% -0.2%
EBITDA of HMSHost came to $ 315.6m, an increase of 4.0% (+3.3% at current exchange rates) compared with the previous year’s $ 305.5m, and rose to 11.2% of revenue from 10.7% in 2013 (11% excluding the US Retail business, now sold) thanks to the improved margin in North America.The result for the year includes restructuring expenses of $ 7.5m ($ 3.9m in 2013). Excluding these non-recurring charges and the contribution of the US Retail business ($ 6.8m in 2013), EBITDA grew by 7.5% (+6.8% at current exchange rates) and came to 11.4% of revenue (11.1% the previous year).
HMSHost - North America 18
In 2014 North American operations produced revenue of $ 2,454.9m, down from $ 2,545.7m in 2013 (-2.7% 19 or -3.6% at current exchange rates), due to the change in the scope of consolidation (sale of the US Retail business that contributed $ 131.5m). Net of that change, sales were up by 2.6% (1.7% at current exchange rates).
16 This area covers the Group’s operations in North America (USA and Canada) and various international locations in Northern Europe, the Middle East and Asia. In keeping with the new distinctions among business segments, the HMSHost segment now includes the operations of Autogrill Catering UK Ltd., HMSHost Ireland Ltd. and HMSHost Sweden AB, sold by Autogrill S.p.A. to a subsidiary of HMSHost Corp. at the beginning of 2015. In 2014, the transferred operations generated revenue of $ 119.9m ($ 95.3m in 2013) and EBITDA of $ 7.1m ($ 6m in 2013)
17. At 31 December 2014, contracts making up about 90% of the total called for in the agreement had been effectively transferred. The contracts not yet transferred generate approximately $ 60m in annual revenue. The remaining four contracts were sold to World Duty Free Group in February 2015
18. This area includes operations in the United States and Canada19. The change is provided at both constant and current exchange rates to reflect the impact of the appreciation of the US dollar against
the Canadian dollar, quantified as around $ 22m in sales

Autogrill Group
32
1. Directors’ report
Revenue from North America is broken down below by channel:
($m) Full Year 2014 Full Year 2013
Change
2013At constant
exchange rates
Airports 1,963.5 1,919.4 2.3% 3.1%
Motorways 445.5 440.4 1.2% 2.7%
Other 45.9 54.3 -15.5% -15.5%
Total (excl. transferred US Retail business)
2,454.9 2,414.2 1.7% 2.6%
Transferred US Retail business - 131.5 -100.0% -100.0%
Total revenue 2,454.9 2,545.7 -3.6% -2.7%
Sales in the airport channel grew by 3.1% overall (+2.3% at current exchange rates), while at US airports only 20, on a comparable basis 21, they increased by 5.6% compared with traffic growth of 2.7% 22. The fact that revenue outpaced traffic reflects a higher number of transactions and especially a greater average purchase per customer, thanks to new concepts like table service at restaurants. Revenue from US motorways increased by 2.3% on a comparable basis, outpacing the growth of traffic (+0.5% 23); including Canada, revenue in this channel rose by 2.7% (+1.2% at current exchange rates) thanks to reopenings on the Ontario Turnpike after renovation work in 2013 and 2014.Sales in the other channels were down by 15.5% for the year, because of the Group’s exit from some contracts at shopping centers. EBITDA in North America came to $ 268.9m, an increase of 1.9% (+1.2% at current exchange rates) compared with the $ 265.6m reported in 2013, and rose to 11% of revenue from last year’s 10.4% (10.7% excluding the US Retail business, now sold). The result for the year includes restructuring expenses of $ 7.5m ($ 3.9m in 2013). Excluding these non-recurring expenses and the contribution to 2013 results of the US Retail business, EBITDA grew by 6% (+5.2% at current exchange rates) and came to 11.3% of revenue (10.9% the previous year). Increased labor productivity was mainly responsible for the boost in profitability.
20. Accounting for around 90% of the channel’s revenue21. Same locations and menus22. Source: Airlines for America, January-December 201423. Source: Federal Highway Administration, January-November 2014 (stretches of road served by the Group)

2014 Annual Report
33
1.3
Busin
ess
segm
ents
HMSHost - International 24
The International area covers operations in the United Kingdom, Ireland, Sweden and Denmark, previously included under “Other European countries”, which in 2014 produced revenue of $ 119.9m ($ 95.3m the previous year) and EBITDA of $ 7.1m ($ 6m in 2013).
Revenue in the International area, where all operations are concentrated in the airport channel, increased by 20.6% in 2014 (+19.6% at current exchange rates), rising from $ 309.0m the previous year to $ 369.6m.
($m) Full Year 2014 Full Year 2013
Change
2013At constant
exchange rates
North Europe 273.2 237.7 14.9% 15.2%
Rest of the world 96.4 71.3 35.3% 38.9%
Total revenue 369.6 309.0 19.6% 20.6%
In Northern Europe, an increase of 15.2% (+14.9% at current exchange rates) reflects the outstanding performance of Schiphol airport in the Netherlands (where revenue was up 6.3% against traffic growth of 4.6% 25), additional locations in Great Britain, and the Group’s first-time presence in Finland, at Helsinki airport.In other countries, growth was caused by expansion in Vietnam and Turkey (which together grossed $ 10.9m more than in 2013) and by the Group’s debut in Indonesia (Bali) and Russia (St. Petersburg), where revenue came to $ 13.7m. EBITDA for this area came to $ 46.7m ($ 39.8m in 2013), increasing by 17.9% or 17.3% at current exchange rates. As a percentage of revenue it dipped slightly from 12.9% to 12.6%, due to start-up costs for new operations.
24. This area covers international locations in Northern Europe (Schiphol Airport in Amsterdam, the United Kingdom, Ireland, Sweden, Denmark and Finland) and other countries (United Arab Emirates, Turkey, Russia, India, Indonesia, Malaysia, Singapore, Vietnam, Australia and New Zealand)
25. Source: Schiphol Amsterdam Airport: January-December 2014

Autogrill Group
34
1. Directors’ report
Europe 26
Until 2013, the “Europe” area also included operations in the United Kingdom, Ireland, and Sweden/Denmark. For both 2014 and 2013, those operations are now included under HMSHost International; in 2014 they earned revenue of E 90.3m and EBITDA of E 5.4m (respectively E 71.7m and E 4.5m the previous year).
Revenue generated in Europe in 2014 came to E 1,804.1m, a decrease of 1.8% on the previous year’s E 1,835.4m. The growth achieved in various countries, thanks in part to new openings, did not completely offset the reduction in sales in Italy caused by the smaller perimeter of operations.
Sales in Europe by channel are detailed below:
(Em) Full Year 2014 Full Year 2013
Change
2013At constant
exchange rates
Motorways 1,269.2 1,277.1 -0.6% -0.7%
Airports 210.6 212.5 -0.9% -1.1%
Railway stations 161.3 144.8 11.4% 11.4%
Other * 162.8 201.0 -19.0% -19.1%
Total revenue 1,804.1 1,835.4 -1.7% -1.8%
* Including sales to franchisees
Sales along motorways, the prevalent channel in Europe, decreased by 0.7% (-0.6% at current exchange rates). The revenue contributed by the new openings in Belgium and Germany was overshadowed by the reduction in the number of locations operated in Italy, due to Autogrill’s departure from various contracts during the renewal period. EBITDA in Europe came to E 99.6m, down by 10.5% (-10.3% at current exchange rates) compared with the previous year’s E 111.0m, and fell from 6.1% to 5.5% of revenue. The 2014 result includes reorganization expenses of E 6.1m, while EBITDA for 2013 included net non-recurring income of E 5.8m 27. Excluding those components, EBITDA would have increased by 0.3% (+0.4% at current exchange rates) and risen from 5.7% to 5.9% of revenue. The costs incurred by European Structure amounted to E 9.0m, compared with E 8.5m in 2013.
26. This area covers the Group’s operations in Italy and the following other European countries: Austria, Belgium, France, Germany, Greece, the Netherlands, Poland, the Czech Republic, Slovenia, Spain and Switzerland
27. Non-recurring income of E 13.8m from the waiver of pre-emption rights on the renewal of expiring subconcessions and reorganization costs of E 8m

2014 Annual Report
35
1.3
Busin
ess
segm
ents
Italy
Revenue in Italy came to E 1,091.7m, down from E 1,154.1m the previous year (-5.4%).
The breakdown by channel is shown below:
(Em) Full Year 2014 Full Year 2013 Change
Motorways 852.9 878.3 -2.9%
Airports 79.1 83.1 -4.9%
Railway stations 35.1 32.8 7.0%
Other * 124.7 160.0 -22.0%
Total revenue 1,091.7 1,154.1 -5.4%
* Including sales to franchisees
Motorway revenue amounted to E 852.9m, down 2.9% with respect to the previous year’s E 878.3m. When concession contracts were close to expiring and the bidding process was reopened, the Group chose to focus its investments on the locations deemed to have the highest potential profitability. In accordance with this strategy, it renewed its contracts for just 21 of the 39 locations previously operated. Autogrill’s departure from the remaining locations, concentrated in the month of July, caused revenue to decrease by about E 24m with respect to 2013.With motorway traffic up by 0.9% 28, sales on a like-for-like basis increased by 0.4% with respect to the previous year. In detail, Food & Beverage revenue was down by 1.4%, partly because beverage sales were hurt by the poor weather and cool temperatures during the summer. Conversely, sales of market products increased by 4.6%, thanks in part to various promotions. Sales of complementary goods rose by 0.5%.Sales at airports, totalling E 79.1m (E 83.1m in 2013), fell by 4.9% due to the closure of various outlets at Milan Malpensa and the Group’s departure from the airports serving Florence, Catania, Bari, and Naples, which offset the additional revenue earned from new openings at Rome Fiumicino.Sales at railway stations progressed by 7.0%, with the contribution of new locations opened in 2013 and 2014 at Milano Centrale (Bistrot) and Bari.The decrease in sales in other channels (-22.0% for the year) reflects the closure of unprofitable locations on high streets and at shopping centers and trade fairs.EBITDA in Italy came to E 61.9m, down by 15.5% on the previous year, and fell from 6.3% of revenue to 5.7%. Excluding non-recurring items 29, EBITDA rose by 3.0% and came to 6.1% of sales (5.6% the previous year), thanks to a decrease in centralized and local operating costs and the benefits achieved by leaving unprofitable locations.
28. Source: AISCAT, January-December 201429. 2014, reorganization costs of E 4.2m; non-recurring income of E 13.8m from the waiver of pre-emption rights on the renewal of
expiring subconcessions and reorganization costs of E 4.7m

Autogrill Group
36
1. Directors’ report
Other European countries
Until 2013, “Other European countries” included the United Kingdom, Ireland, Sweden and Denmark. For both 2014 and 2013, those operations are now included under HMSHost International; in 2014 they earned revenue of E 90.3m and EBITDA of E 5.4m (respectively E 71.7m and E 4.5m the previous year).
Other European countries produced revenue of E 712.3m, up from E 681.3m the previous year, increasing by 4.3% (+4.6% at current exchange rates).
Revenue by channel is shown below:
(Em) Full Year 2014 Full Year 2013
Change
2013At constant
exchange rates
Motorways 416.4 398.8 4.4% 4.2%
Airports 131.6 129.4 1.7% 1.3%
Railway stations 126.3 112.1 12.7% 12.7%
Other 38.1 41.0 -6.9% -7.6%
Total revenue 712.3 681.3 4.6% 4.3%
Sales in the motorway channel rose from E 398.8m in 2013 to E 416.4m (+4.2% or +4.4% at current exchange rates), thanks mainly to a wider presence in Belgium.In the airport channel, sales were up by 1.3% (+1.7% at current exchange rates). The solid performance of airport locations in Athens, Brussels, Geneva and Zurich and the start-up of new operations in Düsseldorf more than offset the lapsed contract at Basel-Mulhouse. The excellent performance of railway stations (+12.7%) reflects new openings at the Madrid and Paris stations and in Belgium.EBITDA in Other European countries came to E 46.7m, an increase of 0.5% with respect to the previous year (+0.9% at current exchange rates). As a percentage of revenue it came to 6.6%, down from 6.8% in 2013.

2014 Annual Report
37
1.3
Busin
ess
segm
ents
Capital expenditure by geographical areaDetails of net capital expenditure 30 by geographical area are shown below:
(Em) Full Year 2014 Full Year 2013
Change
2013At constant
exchange rates
North America 78.8 75.0 5.1% 1.2%
International 36.8 22.5 63.3% 63.0%
Total HMSHost 115.6 97.5 18.5% 15.1%
Italy 38.0 29.8 27.7% 27.7%
Other European countries 36.0 30.0 19.7% 19.5%
Europe Structure 6.8 5.2 29.7% 29.7%
Europe 74.0 59.8 23.7% 21.4%
Total 196.4 162.6 20.8% 22.5%
Net capital expenditure in 2014, mostly geared toward the airport channel, came to E 196.4m (E 162.6m in 2013) and concerned the airports of Fort Lauderdale, Washington Dulles, Las Vegas, Toronto, Amsterdam, Helsinki, Bali, and Rome Fiumicino, as well as rest areas on the Pennsylvania Turnpike in the motorway channel.
30. The amount of net capital expenditure consists of gross investments recognized for the year (E 200m), net of proceeds from the sale of assets (E 3.6m)

Autogrill Group
1. Directors’ report

2014 Annual Report
39
1.4
Out
look
1.4 OutlookSales in the first nine weeks 31 of 2015 increased by 1% at constant exchange rates with respect to the same period in 2014 (+9.8% at current exchange rates). In North America, revenue shows an overall increase of 2.1%, with growth at US airports of 3.9%. The International area has done extremely well, with sales up by 26.3%, thanks in part to the many new openings.Revenue in Italy has fallen by 7.9% because of the reduced perimeter, resulting from the selective renewal of motorway concessions and the closure of various locations last year. Other European countries report growth of 3.6%.
In 2015 the Group will focus on boosting revenue and margins in North America, taking advantage of the positive economic cycle and the favorable trend in traffic, which owes in part to lower energy costs. In the International area, management will concentrate on getting business up to speed at the numerous locations awarded in 2014, and on pursuing further opportunities in the airport channel. In Italy, Autogrill will maintain its selective investment strategy and seek further ways to boost efficiency in order to complete its restructuring program.In Other European countries the Group plans to take advantage of a possible upturn in consumption in the eurozone.
Events after the reporting periodSince 31 December 2014, no events have occurred that if known in advance would have entailed an adjustment to the figures reported or required additional disclosures.On 28 February 2015 Autogrill S.p.A. transferred to World Duty Free Group the Travel Retail activities operated by HMSHost at the Atlanta and Oakland airports and at the Empire State Building. The transfer completes HMSHost Corp.’s sale of its travel retail operations at US airports to World Duty Free Group, as announced to the market on 6 September 2013. The price agreed for the remaining operations was $ 19m.
31. Average exchange rates used to translate figures in the main non-euro currency: 2015, E/$ 1.1489; 2014, E/$ 1.3633

Autogrill Group
1. Directors’ report

2014 Annual Report
41
1.5
Oth
er in
form
atio
n
1.5 Other information1.5.1 Corporate Social ResponsibilityFor Autogrill, sustainability is a business philosophy. The Group’s commitment to sustainability began in 2005 with the publication of its first Sustainability Report, which cleared the way for the development of projects based on a sense of corporate responsibility. This year’s Sustainability Report marks its tenth anniversary, symbolizing Autogrill’s steady commitment to these themes.The Afuture project, established in 2007 with the goal of building innovative Autogrill locations that would be both environmentally friendly and economically efficient, has evolved over the years into an international breeding ground for ideas, design concepts and best practices to be shared throughout the Group. The Afuture experience has allowed the business to grow and its people to achieve a greater awareness of sustainability issues, by better comprehending the value of this process.In 2011 Autogrill decided to build on this concept by laying out goals for an even more sustainable approach to the business, in the form of the Afuture Roadmap (2012-2015) and guidelines for the constant improvement of performance. In 2012 it reinforced its monitoring efforts, and over the last two years it has moved forward with activities designed to improve sustainability on an ongoing basis.In 2014 the Group developed an internal method for the materiality analysis of sustainability issues, aimed at determining which questions are significant for the sustainability of its business and for its stakeholders. Management took an active role in assigning significance to the various topics, considering the stakeholders’ point of view and sharing conclusions. The resulting matrix consists of a horizontal axis representing the importance the company places on the various issues in terms of business success, and a vertical axis representing the concerns of stakeholders. The issues of greatest significance are those on which the Group will focus its attention in coming years.For details of the materiality analysis, see the 2014 Sustainability Report, published online at www.autogrill.com (Sustainability section).
Autogrill’s policy for employees
A clear, structured policy concerning Autogrill’s relations with its employees gives it a competitive edge, because employees are its human capital: the wealth of skills, competencies and qualifications that make the company stand out.At any given location, in the act of serving a customer, each employee represents the company and its philosophy, its know-how and the way it treats the environment. By the same token, a satisfied customer is the best advertisement a company can have. That’s why the relationship between the Group and its employees is a strategic asset, fundamental for the creation of value enjoyed by all parties. To make the most of the Group’s size by leveraging the skills and expertise found in different countries, over the last few years a European organizational model has been developed, leading to the creation and integration of regional and international teams.
Dialogue and engagement“Do You Feel Good? ” is an online survey to measure employee engagement that Autogrill has conducted annually since 2012. The survey involves countries in the European area, identifying issues in need of improvement and the most effective ways of getting employees more engaged in their work. After the results

Autogrill Group
42
1. Directors’ report
are read and discussed, management is involved first-hand in developing a plan of action to be implemented at headquarters and locally, for each issue requiring attention.Other feedback systems vary from country to country. In North America, for example, HMSHost provides a free 24/7 hotline that employees can call to discuss any topic of concern, as well as a web-based line where they can leave comments or complaints at any time.
Work-life balanceA healthy relationship between company and staff is rooted in care for the individual and his or her wellbeing, both on and off the job. For Autogrill, this means working on two different levels: professional and individual growth, by way of work-life balance initiatives. On the professional plane, the Autogrill Group focuses on selection processes based on aptitudes and skills, as well as international job rotation. To work on these aspects effectively and uniformly, Autogrill uses a single process and a single platform for appraising performance and skills throughout Europe. To support employee development at European locations, in 2014 Autogrill launched “Academy”: a common training and development program in English with the course of study designed ad hoc on the basis of professional experience. For store employees, each country has its own Academy Operations program, with course material differentiated by role.As for the “life” part of the work-life balance, Autogrill provides its employees with a broad range of initiatives designed to increase leisure time and spending power, including discounts on products and services that differ from country to country (from insurance to online shopping).
Health and safetyAutogrill’s commitment to the health and safety of all employees and consumers translates into prevention, technology, training, and day-to-day monitoring. Autogrill performs preventive assessments of workplace hazards so it can take the most suitable measures, such as new operating procedures or the purchase of individual protection devices that will eliminate or minimize risks. To make sure these measures are effective, the type of accidents that occur is constantly monitored, along with the steps taken to mitigate the hazards.
Autogrill and the environment
Environmental issues—climate change, access to clean water, waste disposal, etc.—concern people, organizations and institutions all over the world. Autogrill believes it is the personal contribution of each individual that makes the difference. Simple, everyday habits can help reduce energy consumption without sacrificing quality of life. Although Autogrill is a service provider and not a manufacturer and therefore has a relatively minor impact on the environment, we feel a responsibility to reduce our consumption of energy and natural resources in favor of clean energies and recycled materials that are friendly to our Earth. We do this by designing green facilities, properly managing resources and processes, monitoring performance and, above all, enlisting the help of our employees.
Protecting the environment and the Earth’s resources means, above all, consuming less. And consuming less energy and water while properly handling waste takes commitment from everyone, from those who design our buildings and their plants & systems to those who run our operations day to day. Given the different contexts in which it works, Autogrill conducts a wide variety of projects on various levels.
Waste managementIn the United States, waste is being reduced—especially the proportion of non-recyclable waste—by implementing disposal and recycling systems at the back of stores. In France, 20 locations have set up bins where clients are actively involved in recycling PET bottles and aluminum cans, and the plastic parts of take-

2014 Annual Report
43
1.5
Oth
er in
form
atio
n
away packaging have been eliminated. In Italy Autogrill has its motorway locations served by the main waste collection specialists; in 2014 it launched a project to recycle the organic waste of the rest stops at Villoresi Est, Brianza Nord and Brianza Sud, just outside Milan, to fertilize a vegetable garden at the Bosco di Vanzago WWF nature reserve.
Energy and water managementAutogrill is working hard to decrease its energy and water consumption by using new technologies and equipment, collaborating with partners, and getting employees involved. Systems to monitor consumption and prevent waste are in constant operation at the Group’s major locations.
Environmental certificationsAutogrill’s possession of environmental certifications is a natural consequence of its commitment to the world around us.The Villoresi Est rest stop in Italy, opened to the public in early 2013, has obtained “LEED® NC for RETAIL” (Gold level): the first time this standard has been achieved in Italy in the Food & Beverage business. This milestone is in addition to the fifteen LEED® certified rest stops in Canada (eleven Silver and four Gold), and the LEED® Silver certified rest stop on the Delaware Turnpike in the United States.In Italy, ISO 14001 certification has been maintained for the environmental management systems of headquarters, the Brianza Sud location and the outlets at Caselle Turin airport, along with EMAS certification for HQ and Brianza Sud; both of these certifications were also obtained in 2014 by the Villoresi Est location. In Spain, ISO 14001 certification has been maintained for the outlets inside the Telefonica building in Madrid.
Keeping tabs through the Sustainability Report
This year the Autogrill Group publishes its tenth official Sustainability Report, based on the latest edition of the international guidelines set by the Global Reporting Initiative (GRI-G4 Core).The Sustainability Report is public and is made available each year to the stakeholders. Since 2008 it has been submitted annually to the Board of Directors. The information provided in the Corporate Social Responsibility section is further detailed in that report, which can be downloaded from the Sustainability section at www.autogrill.com.
1.5.2 Main risks and uncertainties faced by the Autogrill Group
The Autogrill Group is exposed to external risks and uncertainties arising from general economic conditions or those specific to the industry in which it works, from the financial markets and from frequent changes in legislation, as well as to risks generated by strategic decisions and operating procedures.The Group Risk Management department ensures the uniform handling of risks across the different organizational units. Autogrill has developed a model based on the systematic identification, analysis and assessment of the risk areas that may hinder the achievement of strategic goals. The model helps evaluate the Group’s overall exposure to risks, orient the necessary mitigation efforts, and reduce the volatility of business objectives.

Autogrill Group
44
1. Directors’ report
The updated risk matrix is essentially the same as that produced the previous year. The main risk areas—divided into business risks and financial risks—are presented below.
Business risks
Exogenous factors: traffic statistics and propensity to consumeThe Group’s operations are influenced by traffic trends. Any factor with the potential to reduce traffic flows significantly in the countries and channels served by the Group constitutes a threat to the production of value.Exogenous (hence uncontrollable) factors that may affect the flow of traffic and travelers’ propensity to consume include the general economic situation and its contributing trends—consumer confidence, inflation, unemployment and interest rates—along with rising petrol prices and, in general, the increase in the cost of transport. Traffic and average spending may also be sensitive to other uncontrollable events, such as the spread of alternative means of travel; changes to laws and regulations that govern or in any case influence how the Group operates in a given channel (this is especially relevant for airports); airline strategies and policies; strikes and political instability; acts or threats of terrorism; natural disasters; pandemics; and hostilities or wars. The impact of this risk is mainly economic, leading to a reduction in sales and thus profitability. The Autogrill Group’s sales are also subject to seasonal fluctuations and are higher in the summer, when passenger traffic goes up. Therefore, should one of the above events occur in the summer, the negative impact could be amplified.
One factor that helps mitigate this risk is the diversification of the Group’s activities in terms of:• channels (airports, motorways and railway stations);• geographical areas served.
The Group also has the following tools available to counter recessions or soften the impact of any concentration of its businesses in channels or areas hit by a downturn:• constant revision of products and customer services, to keep them competitive in terms of quality and price and adapt them to consumers’ different spending habits;• regularly updated operating models to ensure the most efficient mix of technologies and human resources;• focus on the profitability of sales, by cutting operating expense without sacrificing menus and catalogues or the quality of service;• modulation of investments in order to limit the impact on cash flows.
ReputationThe Group’s reputation with customers and with concession grantors and licensors, the key stakeholders from this point of view, is of great importance and is also a significant factor when grantors decide to award or renew concessions.Damage to or loss of reputation is caused in particular by the deterioration of perceived service, which can drive dissatisfied customers away, and by an inability to satisfy contractual commitments with concession and licensors, which threatens good business relations and the prospect of extending contracts.
To counter that risk, Autogrill constantly monitors the quality of the service it provides to customers (in terms of perceived satisfaction and product safety) and to the grantor (in light of the quantitative and qualitative standards defined in the concession contract), by way of:• the constant monitoring of procedures and processes, both internally and by outside firms, to keep service efficient and customers and workers safe;

2014 Annual Report
45
1.5
Oth
er in
form
atio
n
• portfolio reviews to ensure that brands, concepts and products remain appealing;• the development of customer retention initiatives and client satisfaction surveys;• training programs to ensure high standards of service.
Loss of reputation can also have indirect causes beyond our control. In Italy, for example, the fact that many travelers use the Group’s name to refer to highway rest stops in general (“let’s stop at the autogrill”) exposes operations in the motorway channel to reputation risk caused by any shortcomings on the part of competitors. Suitable brand protection measures are taken in Italy if unpleasant experiences are wrongly attributed to Autogrill. Likewise, for operations involving the sale of third-party brands under license or commercial partnerships (a model used widely in emerging markets), any reputation damage suffered by the licensor may expose Autogrill to a potential loss of business due to factors beyond its control.The impact of these risks is increasingly influenced by the growing use of online information and communication channels (websites, social media, etc.). By making news spread ever faster and to potentially greater numbers of people, this phenomenon has led to a new area of concern: a company’s “web reputation”.In response, Autogrill has implemented crisis prevention and management policies and developed a program for the effective communication of the brand’s positioning, its reputation and the values it evokes, measured through specific KPI that include monitoring the consistency between its reputation offline and on the Web.
Consumption habitsA change in consumption habits can be a risk if the Group is unable to react in time by adapting its service model and products to what the customer desires.In developing its concepts and offerings, the Group puts a high premium on innovation and flexibility, so that it can quickly interpret and respond to changes in consumers’ purchasing habits, needs and tastes. To this end it periodically conducts specific market research and client satisfaction surveys.In addition, an extensive portfolio of brands and commercial formulas helps to mitigate this risk.
Concession feesMost of the Group’s operations are conducted under long-term contracts awarded through competitive bidding by the owner of the infrastructure management concession (airport/motorway/station). Concession contracts are therefore a fundamental asset, and their extension under competitive conditions or the acquisition of new ones is a strategic factor. The contracts signed by the Group generally have a duration exceeding one year and require the operator to pay minimum guaranteed rent, regardless of the revenue earned. Should the revenue earned through the concession fall short of the amount forecast when the contract was awarded, perhaps due to a reduction in traffic or propensity to consume, the contract could become less profitable or even a liability given the ongoing obligation to pay minimum rent.
Over time, there have been changes in the competitive context and in the details of calls for tenders, so it is possible that in the case of new and/or extended contracts, the conditions set by the concession may be less favorable than those valid today.This risk might expose the Group to long-term losses in profitability, which could be significant in case of a simultaneous wane in traffic or consumer confidence.Some concession agreements involving Group companies restrict the operator’s sphere of operations, e.g. by limiting the range of products that can be sold or how they are priced. The need to comply with such limits could reduce or eliminate the Group’s ability to adapt its product range and terms of sale to customers’

Autogrill Group
46
1. Directors’ report
changing needs and preferences, which, as mentioned above, is one of the key points of its commercial strategy.In general, the Group mitigates these risks by focusing on the profitability of its contracts and not bidding at all for those considered to offer poor returns, and by following an approach aimed at building and maintaining a long-term partnership arrangement with the concession grantor, based in part on the development of concepts and commercial solutions that maximize the overall gain.
LaborLabor is a significant factor for the Group, whose business has a strong customer service component. The need to maintain service standards acceptable to customers and to the concession grantor, and the complexity of international labor laws, limit the flexibility of HR management. Therefore, major increases in the cost per employee or more stringent regulations can have a significant impact on the Group’s profitability. In this context, the “Living Wage Law” recently implemented in some US states is designed to raise minimum wages. For the moment it has only taken effect in certain states, but it could be extended to others, and is therefore a source of uncertainty with regard to labor costs in these regions.This risk is mitigated through the constant review of operating procedures in order to make the most efficient use of labor, increase flexibility and reduce occupational hazards.
Regulatory complianceThe business in which the Group works is highly regulated in terms of operating practices and customer and worker safety, which involves personal protections as well as product quality. Any violation of such norms would not only expose the Group to legal consequences but could diminish its reputation with concession grantors and customers, possibly leading to reduced sales, the loss of existing contracts and/or the inability to compete for new ones.To mitigate this risk, with the help of outside specialists, Autogrill stays constantly abreast of legal developments so it can adapt its processes, procedures and controls to the new requirements and bring personnel up to date. It also relies on constant monitoring and frequent audits of service quality with respect to contractual and legal obligations.
Further risks may arise from:• legislative or regulatory changes in the channels served by the Group or the concession system: concerning the motorway channel in Italy, in January 2015 the Ministry of Infrastructure and Transport and the Ministry of Economic Development enacted guidelines for the restructuring/streamlining of motorway rest areas. Under the plan, if certain minimum criteria are not satisfied (distance between rest areas, volume of fuel sold, and amount of food and beverage revenue), the number of rest areas can be reduced. It also confirms the possibility for gas stations to sell food and beverages directly. Because various aspects are still being determined, management is unable to assess the potential impact;• the introduction of more restrictive procedures, regulations and controls that can influence consumers’ propensity to buy, most typically in the airport channel. These risks are lessened by constantly monitoring consumer behavior when new rules come into force and by incorporating suitable measures into the business model.
InnovationThe Group’s ability to maintain a constant process of innovation for its business model, concepts, products and processes is key to offering a level of service and quality that keeps up with customers’ demands.The potential loss of such an ability would have a direct impact on sales performance and reputation.

2014 Annual Report
47
1.5
Oth
er in
form
atio
n
Efforts to thwart the risk of reputation loss and regulatory non-compliance (concerning the quality of Food & Beverage preparation and service), and quality controls on raw materials mitigate this threat as well.
Development in emerging marketsThe Autogrill Group is active in some emerging markets and hopes to expand into others; such markets typically present greater risks than those found in the areas it prevalently serves.The exogenous risks of operating in emerging markets may include the disruption of business due to political or social instability, and the establishment/enforcement of trade restrictions.In addition, the Group operates in these markets through partnerships with local operators that in some cases require their active participation in store management. This raises the risk that such partners will fail to meet their contractual obligations, including in terms of the operating standards needed to ensure a good level of quality and service, which could affect profitability and/or reputation.
Finally, it is difficult to pinpoint local tastes and choose an appropriate selection of products and brands.
To mitigate this risk, the Group has a broad portfolio of brands and commercial formulas and constantly monitors customer satisfaction and the attractiveness of the portfolio in terms of brands, concepts and pricing schemes, so it can interpret new and different needs and react promptly to any issues.
Financial risks
Autogrill manages its financial risks by defining Group-wide guidelines that inform the financial management of its operating units, as part of an overall policy of financial independence. The Finance department ensures that the financial risk management policies are harmonized, indicating the most suitable financial instruments and monitoring the results achieved.The Autogrill Group does not allow the use of speculative derivative instruments. The Group also strives for a certain financial flexibility, maintaining enough cash and committed credit lines to cover its refinancing needs for at least 12 to 18 months. Regarding the management of financial risks, consisting mostly of interest rate, currency rate and liquidity risk, see the financial risks management section of the notes.
1.5.3 Corporate GovernanceAll information on corporate governance is included in the Corporate Governance and Ownership Report (prepared in accordance with art. 123-bis of the Consolidated Finance Act), available at Autogrill’s headquarters and secondary office and online at www.autogrill.com (Governance/Corporate Governance Report section).
1.5.4 Management and coordinationAt its meeting of 27 April 2004, the Board of Directors decided that there were no conditions whereby Autogrill would be subject to the management and coordination of the indirect parent, Edizione S.r.l. (formerly Edizione Holding S.p.A.), pursuant to art. 2497-bis of the Italian Civil Code. Following Edizione S.r.l.’s transfer of its entire investment in Autogrill to its wholly-owned subsidiary Schematrentaquattro S.p.A. (formerly

Autogrill Group
48
1. Directors’ report
Schematrentaquattro S.r.l.), on 18 January 2007 the Board of Directors agreed that there were no conditions whereby Autogrill would be subject to the management and coordination of its parent, Schematrentaquattro S.p.A. Specifically, at those meetings the Board of Directors verified that there were no indicators of effective dominant influence by the controlling shareholders, given Autogrill’s extensive managerial, organizational and administrative autonomy and the lack of instructions or directives from Schematrentaquattro S.p.A. or Edizione S.r.l. that might be evidence of management or coordination activities.
1.5.5 Related party transactionsTransactions with the Group’s related parties do not qualify as atypical or unusual and fall within the normal sphere of operations. They are conducted in the interests of Autogrill S.p.A. and the Group on an arm’s length basis. See the section “Other information” in the notes to the consolidated financial statements for further information on related party transactions, including the disclosures required by Consob Resolution 17221 of 12 March 2010 (amended with Resolution 17389 of 23 June 2010). The “Procedure for related party transactions” is available online at www.autogrill.com (Governance section/Related parties).
1.5.6 Statement pursuant to art. 2.6.2(9) of the Regulations for Markets Organized and Managed by Borsa Italiana S.p.A.
In respect of art. 36 of Consob Regulation no. 16191 of 29 October 2007 on conditions for the listing of companies that control entities formed or governed under the laws of countries outside the European Union that are of material significance to the consolidated financial statements, we report that two companies fall under these provisions (HMSHost Corp. and Host International Inc.), that suitable procedures have been adopted to ensure total compliance with said rules, and that the conditions stated in art. 36 have been satisfied.
1.5.7 Research and developmentIn relation to the nature of its activities, the Group invests in innovation, product development, and improvements to the quality of service.It does not conduct technological research as such.
1.5.8 Treasury sharesThe annual shareholders meeting of 28 May 2014, after revoking the authorization granted on 6 June 2013 and pursuant to arts. 2357 et seq. of the Italian Civil Code, authorized the purchase and subsequent disposal of ordinary shares up to a maximum of 12,720,000 shares.
At 31 December 2014 Autogrill S.p.A. owned 870,798 treasury shares (1,004,934 at the end of 2013), with a carrying amount of E 3,451k and an average carrying amount of E 3.96 per share. The reduction in the number of treasury shares is due to the exercise of options by various beneficiaries under the 2010 Stock Option Plan.

2014 Annual Report
49
1.5
Oth
er in
form
atio
n
Autogrill S.p.A. does not own shares or other equity investments representing the share capital of the ultimate parents, and did not at any time during the year, either directly or through subsidiaries, trust companies or other intermediaries.
1.5.9 Significant non-recurring events and transactions
In 2014, there were no significant non-recurring events or transactions as defined by Consob Resolution 15519 of 27 July 2006 and Consob Communication DEM/6064293 of 28 July 2006.
1.5.10 Atypical or unusual transactionsIn 2014 there were no atypical and/or unusual transactions as defined by Consob Communication DEM/6064293 of 28 July 2006.
1.5.11 Information pursuant to arts. 70 and 71 of Consob Regulation no. 11971/1999
On 20 January 2013 the Board of Directors of Autogrill S.p.A. voted to take the option provided for by Consob Resolution 18079 of 20 January 2012 that removes the obligation to make available to the public the disclosure documents required by arts. 70 and 71 of the Listing Rules (Consob Regulation 11971/1999) in the case of significant mergers, demergers, increases in share capital through contributions in kind, acquisitions and transfers.
1.5.12 Reconciliation between parent and consolidated equity
(Ek)Equity at
31.12.2013Changes in equity
Profit (loss) for 2014
Equity at31.12.2014
Autogrill S.p.A. separate financial statements 374,081 (1,231) 19,039 391,890
Effect of the consolidation of subsidiaries’ financial statements and related deferred taxation * 44,250 (9,203) 6,068 41,115
Translation reserve (4,749) 30,277 - 25,528
Group consolidated financial statements 413,583 19,843 25,107 458,534
Equity attributable to non-controlling interests 31,175 (10,922) 11,872 32,125
Total consolidated equity 444,758 8,922 36,979 490,659
* The amount includes the combined effect of the subsidiaries contribution to consolidated profit (E 59,363k), the elimination of dividends paid by subsidiaries to the parent (E 81,551k) and the impairment losses on investments (E 28,255k)

2. Consolidated financial statem
ents

2. Consolidated financial statements
2. C
onso
lidat
ed fi
nanc
ial s
tate
men
ts

Autogrill Group
52
2. Consolidated financial statem
ents
2.1 Consolidated financial statements2.1.1 Statement of financial position
Note (Ek) 31.12.2014Of which
related parties 31.12.2013Of which
related parties
ASSETS
Current assets 551,468 527,250
I Cash and cash equivalents 183,241 171,516
II Other financial assets 21,244 - 20,949 3,868
III Tax assets 3,364 5,981
IV Other receivables 176,586 18,323 176,310 34,323
V Trade receivables 43,493 1,367 46,371 1,082
VI Inventories 123,540 106,123
Non-current assets 1,779,489 1,677,767
VII Property, plant and equipment 834,903 782,537
VIII Goodwill 804,544 749,237
IX Other intangible assets 63,752 61,816
X Investments 5,775 1,660
XI Other financial assets 21,981 31,512
XII Deferred tax assets 35,883 43,596
XIII Other receivables 12,651 7,409
TOTAL ASSETS 2,330,957 2,205,017
LIABILITIES AND EQUITY
LIABILITIES 1,840,298 1,760,259
Current liabilities 891,727 811,830
XIV Trade payables 406,698 34,282 396,205 36,586
XV Tax liabilities 7,779 7,015
XVI Other payables 315,361 126 266,890 2,132
XIX Bank loans and borrowings 136,609 118,755
XVII Other financial liabilities 13,405 9,416
XXIII Provisions for risks and charges 11,875 13,549
Non-current liabilities 948,571 948,429
XVIII Other payables 22,997 23,289
XIX Loans, net of current portion 330,553 362,278
XX Other financial liabilities 6,353 18,207
XXI Bonds 415,800 367,706
XII Deferred tax liabilities 37,418 50,795
XXII Defined benefit plans 101,836 90,336
XXIII Provisions for risks and charges 33,614 35,818
XXIV EQUITY 490,659 444,758
- attributable to owners of the parent 458,534 413,583
- attributable to non-controlling interests 32,125 31,175
TOTAL LIABILITIES AND EQUITY 2,330,957 2,205,017

2014 Annual Report
53
2.1
Con
solid
ated
fina
ncia
l sta
tem
ents
2.1.2 Income statement
Note (Ek) 2014Of which
related parties 2013Of which
related parties
Continuing operations
XXV Revenue 4,461,466 50 4,545,922 56
XXVI Other operating income 108,853 6,799 127,967 17,746
Total revenue and other operating income 4,570,319 4,673,889
XXVII Raw materials, supplies and goods 1,813,633 1,874,103
XXVIII Personnel expense 1,296,618 114 1,318,190 131
XXIX Leases, rentals, concessions and royalties 668,466 78,412 677,407 77,156
XXX Other operating expense 475,363 3,715 490,168 3,828
XXXI Depreciation and amortization 187,465 210,099
XXXI Impairment losses on property, plant and equipment and intangible assets 10,134 15,654
Operating profit 118,639 88,268
XXXII Financial income 2,103 90 1,228 52
XXXII Financial expense (46,496) (1,384) (51,699) (1,381)
Adjustment to the value of financial assets 2,977 (2,399)
Pre-tax profit 77,222 35,398
XXXIII Income tax (40,244) (27,065)
Profit for the year - Continuing operations 36,978 8,333
Profit/(loss) for the year attributable to:
- owners of the parent 25,107 (1,482)
- non-controlling interests 11,871 9,815
XXXIV Profit - Discontinued operations (net of tax effects) - 91,056 (144)
Profit for the year 36,978 99,389
Profit for the year attributable to:
- owners of the parent 25,107 87,859
- non-controlling interests 11,871 11,530
XXXV Earnings per share (in E cents)
- basic 9.9 34.7
- diluted 9.9 34.6
XXXV Earnings per share - continuing operations (in E cents)
- basic 9.9 (0.6)
- diluted 9.9 (0.6)

Autogrill Group
54
2. Consolidated financial statem
ents
2.1.3 Statement of comprehensive income
Note (Ek) 2014 2013
Profit for the year 36,978 99,389
Items that will never be reclassified to profit or loss
XXIV Remeasurements of the defined benefit (liability)/asset (21,777) (7,408)
XXIV Tax on items that will never be reclassified to profit or loss 5,239 927
Items that may be subsequently reclassified to profit or loss
XXIV Effective portion of fair value change in cash flow hedges 5,048 6,832
XXIV Net change in fair value of cash flow hedges reclassified to profit or loss - 4,490
XXIV Equity-accounted investees - share of other comprehensive income (172) (163)
XXIV Gain on fair value of available-for-sale financial assets (842) 262
XXIV Foreign currency translation differences for foreign operations 33,819 (43,715)
XXIV Gains (losses) on net investment hedge (1,024) 7,861
XXIV Tax on items that may be subsequently reclassified to profit or loss (947) (5,530)
Total comprehensive income for the year 56,323 62,944
- attributable to owners of the parent 41,838 51,379
- attributable to non-controlling interests 14,485 11,565

2014 Annual Report
55
2.1
Con
solid
ated
fina
ncia
l sta
tem
ents
2.1.4 Statement of changes in equity (note XXIV)
(Ek) Share capital Legal reserveHedging reserve
Translation reserve
Other reserves and retained
earningsTreasury
shares
Available- for-sale
financial assets reserve
Profit/(loss) for the year
Equity attributable
to owners of the parent
Equity attributable
to non-controlling
interests
31.12.2013 68,688 13,738 (5,581) (4,749) 346,689 (3,982) 262 (1,482) 413,583 31,175
Total comprehensive income for the year
Profit for the year - - - - - - - 25,107 25,107 11,871
Effective portion of fair value change in cash flow hedges, net of the tax effect - - 3,660 - - - - - 3,660 -
Foreign currency translation differences for foreign operations and other changes - - - 31,192 - - - - 31,192 2,627
Gains (losses) on net investment hedges, net of tax effect - - - (742) - - - - (742) -
Equity-accounted investees - share of other comprehensive income - - - (172) - - - - (172) -
Fair value gain on available-for-sale financial assets - - - - - - (683) - (683) -
Actuarial gains (losses) on defined benefit plans, net of the tax effect - - - - (16,524) - - - (16,524) (13)
Total comprehensive income for the year - - 3,660 30,278 (16,524) - (683) 25,107 41,838 14,485
Transactions with owners of the parent, recognised directly in equity
Contributions by and distributions to owners of the parent
Allocation of 2013 profit to reserves - - - - (1,482) - - 1,482 - -
Capital increase - - - - - - - - - 7,537
Dividend distribution - - - - - - - - - (21,294)
Stock options - - - - 124 - - - 124 -
Effect due to stock option exercise - - - - (25) 532 - - 507 -
Other movements (Tax effect on US Retail sale under common control) 2,483 2,483 -
Total contributions by and distributions to owners of the parent - - - - 1,100 532 - 1,482 3,114 (13,757)
Changes in ownership interests in subsidiaries
Sale of non-controlling interests - - - - - - - - - 222
Total transactions with owners of the parent - - - - 1,100 532 - 1,482 3,114 (13,535)
31.12.2014 68,688 13,738 (1,921) 25,528 331,265 (3,450) (421) 25,107 458,534 32,125

Autogrill Group
56
2. Consolidated financial statem
ents
(Ek) Share capital Legal reserveHedging reserve
Translation reserve
Other reserves and retained
earningsTreasury
shares
Available- for-sale
financial assets reserve
Profit/(loss) for the year
Equity attributable
to owners of the parent
Equity attributable
to non-controlling
interests
31.12.2012 132,288 26,458 (15,743) 4,417 551,237 (7,724) - 96,753 787,686 26,351
Total comprehensive income for the year
Profit for the year - - - - - - - 87,859 87,859 11,530
Effective portion of fair value change in cash flow hedges, net of the tax effect - - 8,129 - - - - - 8,129 -
Foreign currency translation differences for foreign operations and other changes - - - (43,769) - - - - (43,769) 54
Gains (losses) on net investment hedges, net of tax effect - - - 5,523 - - - - 5,523 -
Equity-accounted investees - share of other comprehensive income - - - (163) - - - - (163) -
Fair value gain on available-for-sale financial assets - - - - - - 262 - 262 -
Actuarial gains (losses) on defined benefit plans, net of the tax effect - - - - (6,462) - - - (6,462) (19)
Total comprehensive income for the year - - 8,129 (38,409) (6,462) - 262 87,859 51,379 11,565
Transactions with owners of the parent, recognised directly in equity
Contributions by and distributions to owners of the parent
Effect of demerger (Travel Retail & Duty Free) (63,600) (12,720) 2,033 29,243 (297,593) - - (89,341) (431,978) (6,363)
Effects of demerger on treasury shares and on the share-based payments reserve - - - - 2,338 3,742 - - 6,080 -
Allocation of 2012 profit to reserves - - - - 96,753 - - (96,753) - -
Capital increase - - - - - - - - - 14,733
Dividend distribution - - - - - - - - - (17,050)
Share-based payments - - - - 416 - - - 416 -
Total contributions by and distributions to owners of the parent (63,600) (12,720) 2,033 29,243 (198,086) 3,742 - (186,094) (425,482) (8,680)
Changes in ownership interests in subsidiaries
Acquisition of non-controlling interests - - - - - - - - - 1,939
Total transactions with owners of the parent (63,600) (12,720) 2,033 29,243 (198,086) 3,742 - (186,094) (425,482) (6,741)
31.12.2013 68,688 13,738 (5,581) (4,749) 346,689 (3,982) 262 (1,482) 413,583 31,175

2014 Annual Report
57
2.1
Con
solid
ated
fina
ncia
l sta
tem
ents
2.1.5 Statement of cash flows
(Ek) 2014 2013
Opening net cash and cash equivalents 129,579 96,770Pre-tax profit and net financial expense for the year 121,616 85,869Amortization, depreciation and impairment losses on non-current assets, net of reversals 197,599 225,753Adjustment and (gains)/losses on disposal of financial assets (2,977) 2,399(Gain)/losses on disposal of non-current assets (3,373) (2,346)Other non-cash items (1,142) 406Change in working capital 9,978 (79,512)Net change in non-current non-financial assets and liabilities (30,840) (8,403)Cash flows from operating activities 290,861 224,166Taxes (paid)/reimbursed (36,525) (33,925)Interest paid (30,836) (42,096)Net cash flows from operating activities 223,500 148,145Acquisition of property, plant and equipment and intangible assets (179,529) (187,365)Proceeds from disposal of non-current assets 3,585 2,504Acquisition of consolidated equity investments (1,335) (16,160)Dividends from discontinued operations (demerger) - 220,000Disposal of US Retail business 4,220 74,121Net change in non-current financial assets 11 184Net cash flows from (used in) investing activities (173,049) 93,284Bond issues “Private Placement” - 251,953Repayments of bond “Private Placement” - (192,879)Issue of new non-current loans - 24,677Repayments of non-current loans (42,432) (402,236)Repayments of non-current loans from discontinued operations (demerger) - 70,000Repayments of current loans, net of new loans 12,227 63,513Excercise of stock options 523 -Other cash flows * (14,029) (6,209)Net cash flows used in financing activities (43,711) (191,181)Cash flows for the year 6,741 50,248Net cash flows from operating activities - discontinued operations (demerger) - (116,584)Net cash flows used in investing activities - discontinued operations (demerger) - (119,397)Net cash flows used in financing activities - discontinued operations (demerger) - 232,299Cash flows for the year from discontinued operations (demerger) - (3,683)Effect of demerger - (11,683)Translation differences on net cash and cash equivalents 6,494 (2,073)Closing net cash and cash equivalents 142,814 129,579
* Includes dividend paid to non-controlling interests in subsidiaries
Reconciliation of net cash and cash equivalents
(Ek)
Opening - net cash and cash equivalents - balance as of 1 January 2014 and as of 1 January 2013 129,579 96,770Cash and cash equivalents 171,516 154,562Current account overdrafts (41,937) (57,792)Closing - net cash and cash equivalents - balance as of 31 December 2014 and as of 31 December 2013 142,814 129,579Cash and cash equivalents 183,241 171,516Current account overdrafts (40,427) (41,937)

Autogrill Group
58
2. Consolidated financial statem
ents
2.2 Notes to the consolidated financial statementsGroup operations
The Autogrill Group operates in the food & beverage sector at airports, motorway rest stops and railway stations, under contracts known as concessions.
As readers are aware, on 1 October 2013 Autogrill S.p.A. demerged its Travel Retail & Duty Free business to World Duty Free (WDF) S.p.A., as approved by those companies’ extraordinary general meetings on 6 June 2013. Consequently, in accordance with IFRS 5 (Non-current assets held for sale and discontinued operations), the profit and loss and cash flow figures of the Travel Retail & Duty Free business for the first nine months of 2013 are presented, respectively, under “Profit from discontinued operations (demerger)” and “Cash flows from discontinued operations (demerger)”, consistently with their presentation in the financial statements for the year ended 31 December 2013.
2.2.1 Accounting policies and basis of consolidationGeneral standards
These financial statements were prepared in accordance with the International Financial Reporting Standards (IFRS) published by the International Accounting Standards Board (IASB) and endorsed by the European Union. IFRS means International Financial Reporting Standards including International Accounting Standards (IAS), supplemented by the interpretations issued by the International Financial Reporting Interpretations Committee (IFRIC), previously called the Standing Interpretations Committee (SIC).
The financial statements are also compliant with the rules on reporting formats adopted by Consob in accordance with art. 9 of Legislative Decree 38/2005 and with the other Consob regulations on financial reporting.
The consolidated financial statements were prepared on a going-concern basis using the euro as the presentation currency. Unless otherwise specified, the figures in the financial statements and notes are in thousands of euros (Ek).
Below are the accounting standards, amendments and interpretations issued by the IASB and endorsed by the European Union for mandatory adoption in financial statements for years beginning on 1 January 2014:• IFRS 10 Consolidated financial statements;• IFRS 11 Joint arrangements;• IFRS 12 Disclosure of interests in other entities;• IAS 27 (2011) Separate financial statements;• IAS 28 (2011) Investments in associates and joint ventures;• Amendments to IFRS 10 Consolidated financial statements, IFRS 12 Disclosure of interests in other entities and IAS 27 Separate financial statements;

2014 Annual Report
59
2.2
Not
es to
the
cons
olid
ated
fina
ncia
l sta
tem
ents
• Amendments to IAS 39 Financial instruments: Novation of derivatives and continuation of hedge accounting;• Amendments to IAS 36 Impairment of assets: recoverable amount disclosures for non-financial assets;• Guide to the transition: amendments to IFRS 10 Consolidated financial statements, IFRS 11 Joint arrangements and IFRS 12 Disclosure of interests in other entities;• Amendments to IAS 32 Financial instruments: Presentation – Offsetting financial assets and financial liabilities.
More specifically, IFRS 10 establishes a single model of control to determine whether an investee should be consolidated. According to IFRS 11, investments in joint ventures, i.e. arrangements whereby the parties have rights to the net assets of the entity, are accounted for using the equity method. IFRS 12 combines, in a single standard, the disclosure requirements for subsidiaries, associates and joint arrangements, as well as unconsolidated structured entities.The newly adopted standards have not had a material impact on the consolidated financial statements, except for the increased disclosures required by IFRS 12 and the change in the consolidation method of Caresquick N.V. (Belgium). That investment, held as a joint venture, is now consolidated using the equity method in accordance with IFRS 11, while in 2013 it was consolidated using the proportionate method in accordance with IAS 31. The company’s revenue, net profit, assets and liabilities are not significant for the Group.
Below are the accounting standards, amendments and interpretations issued by the IASB and endorsed by the European Union for mandatory adoption in financial statements for years beginning after 1 January 2015:• Amendments to IAS 19 Employee benefits: employee contributions;• Annual improvements to IFRS (2010-2012 cycle);• Annual improvements to IFRS (2011-2013 cycle);• Interpretation of IFRIC 21 – Levies.
The application of the standards and interpretations listed above should not affect the consolidated financial statements to an extent requiring mention in these notes.
Structure, format and content of the consolidated financial statements
The financial statements are clearly presented and give a true and fair view of the Group’s financial position, results of operations and cash flows. Formats and standards are consistent over time, save for the exceptions mentioned below.
In accordance with IAS 1 and IAS 7, the formats used in the 2014 consolidated financial statements are as follows:• Statement of financial position, with assets and liabilities split between current and non-current items;• Income statement, with costs classified by nature;• Statement of comprehensive income;• Statement of changes in equity;• Statement of cash flows, using the indirect method to determine cash flows from operating activities.
The financial statements of each company in the scope of consolidation are prepared in the currency of its primary location (functional currency). For the purposes of the consolidated financial statements,

Autogrill Group
60
2. Consolidated financial statem
ents
the assets and liabilities of foreign subsidiaries with a functional currency other than the euro, including goodwill and fair value adjustments generated by the acquisition of a foreign business, are translated at the rates prevailing at year-end. Income and expense are converted at average exchange rates for the year, which approximate those in force when the corresponding transactions took place. Exchange rate differences are recognized in the statement of comprehensive income and shown under “translation reserve” in the statement of changes in equity. Exchange gains and losses arising from receivables or payables with foreign operations, the collection or payment of which is neither planned nor likely in the foreseeable future, are treated as part of the net investment in foreign operations and are recognized in other comprehensive income and shown under “translation reserve” in the statement of changes in equity.
Below are the exchange rates used to translate the financial statements of the main subsidiaries with a functional currency other than the euro:
2014 2013
Rate on 31 December
Average rate for the year
Rate on 31 December
Average rate for the year
US Dollar 1.2141 1.3285 1.3791 1.3281
Canadian Dollar 1.4063 1.4661 1.4671 1.3684
Swiss Franc 1.2024 1.2146 1.2276 1.2311
British Sterling 0.7789 0.8061 0.8337 0.8493
Basis of consolidation
The scope of consolidation includes subsidiaries for which the Group, pursuant to IFRS 10, is exposed to or has rights to variable returns and is able to affect those returns through power over these investees. The list of consolidated companies is annexed to these notes.
Specifically, the consolidated financial statements include the financial statements at 31 December 2014 of Autogrill S.p.A. and all companies it directly or indirectly controls or controlled during the year. The scope of consolidation also includes the French companies Sorebo S.A., Soberest S.a.s., Volcarest S.A., and some non-fully owned companies belonging to the American Group (see annex), which are controlled on the basis of a 50% or lower stake and an agreement that puts their business under the management of Autogrill.
The financial statements of subsidiaries are consolidated on a line-by-line basis, i.e. by recognizing the full amount of their assets and liabilities at the end of the year and their income and expenses for the entire year or for the portion of the year during which control was maintained, and eliminating the carrying amount of the consolidated equity investments held by the parent against the relative share of equity.
Non-controlling interests in the net assets of consolidated subsidiaries are identified separately from equity attributable to the owners of the parent. They are determined on the basis of the non-controlling investors’ share of the fair value of the assets and liabilities recognized at the date of acquisition (see “Business combinations”) and of changes in equity attributable to non-controlling interests after that date.
2014 Annual Report
61
2.2
Not
es to
the
cons
olid
ated
fina
ncia
l sta
tem
ents
Any material unrealized gains and losses arising out of transactions between consolidated companies are eliminated, as are all significant payables, receivables, income and expenses between Group companies. These adjustments, like the other consolidation adjustments, take account of any deferred tax effects.
The income and expense of subsidiaries acquired or sold during the year are included in the consolidated income statement from the actual date of acquisition or to the actual date of disposal, with slight timing adjustments where these dates do not coincide with monthly accounting dates. If necessary, adjustments are made to the subsidiaries’ financial statements to bring their accounting policies into line with those of the Group.
If control of a subsidiary is lost, the Group eliminates assets and liabilities, any non-controlling interests, and other components of equity relating to the former subsidiaries. The gain or loss resulting from loss of control is recognized in profit or loss. Any interest retained in the former subsidiary is measured at fair value at the date of loss of control. It is subsequently measured using the equity method, or as a financial asset depending on the degree of influence retained.
The scope of consolidation has not changed significantly with respect to the end of the previous year.
HMSHost Corporation (formerly Autogrill Group Inc.) and its subsidiaries close their fiscal year on the Friday closest to 31 December and divide it into 13 four-week periods, which in turn are grouped into 12-week quarters with the exception of the last which is a 16-week quarter. As a result, the financial statements included in the 2014 consolidated financial statements cover the period 4 January 2014 to 2 January 2015, while the previous year’s financial statements covered the period 29 December 2012 to 3 January 2014.
Accounting policies
The Group follows the historical cost principle, except for items that in accordance with IFRS are measured at fair value, as specified in the individual accounting policies below.
Business combinations
Business combinations carried out since 1 January 2008Since 1 January 2008, the Group has followed the rules of IFRS 3 (2008) – Business combinations.
The Group accounts for all business combinations using the purchase method. The consideration transferred in a business combination includes the fair value, as of the acquisition date, of the assets and liabilities transferred and of the interests issued by the Group, as well as the fair value of any contingent consideration and of the incentives included in share-based payments recognized by the acquiree that have to be replaced in the business combination. If the business combination settles a pre-existing relationship between the Group and the acquiree, the lesser of the settlement provision, as established by contract, and the off-market price of the element is deducted from the consideration transferred and recognized under other costs.
The identifiable assets acquired and the identifiable liabilities assumed are measured at their respective acquisition-date fair values.

Autogrill Group
62
2. Consolidated financial statem
ents
A contingent liability of the acquiree is assumed in a business combination only if this liability represents a current obligation deriving from past events and when its fair value can be reliably measured.
For each business combination, any non-controlling interest in the acquiree is measured at fair value or in proportion to the non-controlling interest of the acquiree’s net identifiable assets.
Goodwill arising from the acquisition is recognized as an asset and is initially measured as the excess between the consideration transferred and the acquisition-date net amount of the identifiable assets acquired and the identifiable liabilities assumed.
In case of a business combination achieved in stages, the interest previously held in the acquiree is remeasured at its acquisition-date fair value and any resulting gain or loss is recognized in profit or loss.
The costs relating to the acquisition are recognized in profit or loss in the period in which the costs are incurred and the services received; the sole exception is for the cost of issuing debt securities or equities.
Business combinations carried out from 1 January 2004 to 31 December 2007The Group accounts for all business combinations using the purchase method. The cost of each combination is determined as the aggregate of the fair values, at the date of exchange, of assets given, liabilities incurred or assumed, and equity instruments issued by the Group in exchange for control of the acquiree. Any costs directly attributable to a business combination also form part of its overall cost.
The acquiree’s identifiable assets, liabilities and contingent liabilities that can be recognized under IFRS 3 – Business Combinations are posted at their fair value on the date of acquisition.
Goodwill arising from the acquisition is recognized as an asset and measured initially at cost, i.e., the amount by which the acquisition cost exceeds the Group’s interest in the fair value of the identifiable assets, liabilities and contingent liabilities recognized on acquisition.
Non-controlling interests in the acquiree are initially measured according to their percentage interest in the fair value of the assets, liabilities and contingent liabilities recognized on acquisition.
Business combinations carried out before 1 January 2004On first-time adoption of IFRS (1 January 2005), the Group decided not to apply IFRS 3 – Business combinations retroactively to the acquisitions made prior to the date of changeover to IFRS (1 January 2004). Consequently, goodwill arising on acquisitions made prior to that date has been maintained at the previous amount determined under Italian GAAP, subject to measurement and recognition of any impairment losses.
Business combinations under common controlA business combination in which the combining entities or businesses are ultimately controlled by the same party or parties both before and after the business combination, when that control is not transitory, qualifies as a combination “under common control”. Business combinations under common control are outside the scope of IFRS 3 “Business Combinations” and of other IFRS. In the absence of an accounting principle that deals specifically with these transactions, the most suitable accounting principle to be chosen should meet the general object of IAS 8, that is, faithful and reliable presentation of the transaction. Furthermore, the

2014 Annual Report
63
2.2
Not
es to
the
cons
olid
ated
fina
ncia
l sta
tem
ents
accounting treatment of business combinations under common control should reflect the economic substance of the transaction, regardless of its legal form. The pre-eminence of economic substance is therefore the key factor guiding the method chosen to account for these business combinations. Economic substance must refer to the creation of added value that translates into significant changes in the cash flows of the net assets transferred.
The accounting treatment of the transaction should also take account of current interpretations and trends, in particular OPI 1 (Orientamenti Preliminari Assirevi in tema di IFRS – Preliminary Orientations on IFRS by the Italian Association of Auditors), “Accounting treatment of business combinations of entities under common control in separate and consolidated financial statements”.
The Autogrill Group recognizes the net assets transferred at the carrying amounts presented in the consolidated financial statements of the common parent and treats the resulting difference between the acquisition price and the value of the net assets transferred as an adjustment of consolidated equity reserves attributable to the Group. Conversely, in the case of discontinued operations, the difference between the disposal price and the value of the net assets transferred is treated as an adjustment of the Autogrill Group’s share of equity reserves.
Acquisitions of non-controlling interestsThe Group applies IFRS 10 to all acquisitions carried out after control is assumed. On that basis, acquisitions of non-controlling interests are treated as transactions carried out with shareholders in their capacity as owners, and do not give rise to goodwill. Adjustments to non-controlling interests are based on a proportional amount of the subsidiary’s net assets. Previously, the recognition of goodwill from the acquisition of a non-controlling interest in a subsidiary represented the excess cost of the additional investment with respect to the carrying amount of the interest in the net assets acquired at the transaction date.
Investments in associates and joint ventures
An associate is a company over which the Group has a significant influence, but not control or joint control, through participation in decisions regarding the associate’s financial and operational policies; a joint venture is an agreement through which the Group has rights to net assets, rather than rights to its assets and obligations for its liabilities.
The income, expenses, assets and liabilities of associates and joint ventures are recognized in the consolidated financial statements using the equity method, except where the investment is classified as held for sale.
Accordingly, investments in associates and joint ventures are initially recognized at cost. The cost of the investment includes transaction costs. The consolidated financial statements include the Group’s share of the investees’ profits or losses, recognized using the equity method, up to the date it no longer has significant influence or joint control.
Recognition of revenue and costs
Purchases and sales of goods are recognized on transfer of title at fair value, i.e., the price paid or received net of returns, rebates, sales discounts and year-end bonuses.

Autogrill Group
64
2. Consolidated financial statem
ents
Revenue is recognized when the risks and the benefits connected to ownership of the goods are transferred to the buyer, recovery of the consideration is probable, the associated costs or possible return of the goods can be estimated reliably, there is no continuing management involvement with the goods, and the amount of the revenue can be accurately measured. If it is probable that discounts will be granted and the amount can be measured reliably, the discount is charged as a reduction of revenue when the sale is recognized.
The transfer of the risks and benefits varies with the type of sale made. In the case of a retail sale, the transfer generally takes place when the goods are delivered and the consumer has paid the consideration asked. In the instance of wholesale transactions, the transfer usually coincides with the arrival of the products in the client’s warehouse.
Service revenue and costs are recognized according to the stage of completion at year-end. Stage of completion is determined according to measurements of the work performed. When the services covered under a single contract are provided in different years, the consideration will be broken down by service provided on the basis of the relative fair value.
When the Group is acting as an agent and not as a principal in a sales transaction, the revenue recognized is the net amount of the Group’s commission.
Recoveries of costs borne on behalf of third parties are recognized as a deduction from the related cost.
Recognition of financial income and expense
Financial income includes interest on invested liquidity (including financial assets available for sale), dividends resolved, proceeds from the disposal of financial assets available for sale, fair value changes in financial assets recognized in profit or loss, income arising from a business combination due to the remeasurement at fair value of the investment already held, gains on hedging instruments recognized in profit or loss, and the reclassification of net gains previously recognized in other comprehensive income. Interest income is recognized on an accruals basis using the effective interest method. Dividends are recognized when the Group’s right to receive them is established.
Financial expense includes interest on loans, discounting on provisions and deferred income, losses from the transfer of financial assets available for sale, fair value changes in financial assets recognized in profit or loss and in contingent consideration, impairment losses on financial assets (other than trade receivables), losses on hedging instruments recognized in profit or loss, and the reclassification of net losses previously recognized in other comprehensive income.
Loan-related costs that are not directly attributable to the purchase, construction or production cost of an asset that justifies capitalization are recognized in profit or loss for the year using the effective interest method.
Net foreign exchange gains or losses on financial assets/liabilities are shown under financial income and expense on the basis of the net gain or loss produced by foreign currency transactions.
Employee benefits
All employee benefits are recognized and disclosed on an accruals basis.
Group companies provide defined benefit and defined contribution plans.

2014 Annual Report
65
2.2
Not
es to
the
cons
olid
ated
fina
ncia
l sta
tem
ents
Post-employment benefit plans are formalized and non-formalized agreements whereby the Group provides post-employment benefits to one or more employees. The manner in which these benefits are provided varies according to legal, fiscal and economic conditions in the countries in which the Group operates, and are normally based on compensation and years of service.
Defined contribution plans are post-employment benefit plans under which the Group pays pre-determined contributions to a separate entity (a fund) and will have no legal or constructive obligation to pay further contributions should the fund have insufficient assets to pay all benefits to employees.
Defined benefit plans are post-employment benefit plans other than defined contribution plans. Defined benefit plans may be unfunded or else entirely or partly funded by contributions paid by the employer, and sometimes by the employee, to a company or fund which is legally separate from the company that pays the benefits.
The amount accrued is projected forward to estimate the amount payable on termination of employment and is then discounted using the projected unit credit method, to account for the time that will elapse before actual payment occurs.
The liability is recognized in the accounts net of the fair value of any plan assets. If the calculation generates a benefit for the Group, the amount of the asset recognized is limited to the sum of any unrecognized cost for previous employment and the present value of economic benefits available in the form of refunds from the plan or reductions in future contributions to the plan. To establish the present value of these economic benefits, the minimum funding requirements applicable to any Group plan are considered. An economic benefit is available to the Group when it can be realized throughout the duration of the plan or upon settlement of the plan liabilities.
Actuarial valuations are made by actuaries outside the Group. Actuarial gains and losses from experience adjustments and changes in actuarial assumptions are recognized in the statement of comprehensive income.
Due to changes in the Italian system of post-employment benefits (trattamento di fine rapporto or TFR ) brought about by Law 296 of 27 December 2006 and by the decrees and regulations issued in early 2007 (the “Social security reform”):• TFR accrued at 31 December 2006 by employees of the Group’s Italian companies is treated as a defined benefit plan in accordance with IAS 19. The benefits promised to employees in the form of TFR, which are paid upon termination of service, are recognized in the period in which the right vests;• TFR accrued from 1 January 2007 is treated as a defined contribution plan, so contributions accrued during the period are fully recognized as costs. The portion not yet paid into the funds is included under “Other payables”.
Share-based payments
In the case of share-based payment transactions settled with equity instruments of the company, the grant-date fair value of the options granted to employees is recognized in personnel expense with a corresponding increase in equity (“Other reserves and retained earnings”), over the period in which the employees become unconditionally entitled to the awards. The amount recognized as an expense is adjusted to reflect the number of options for which the related service and non-market conditions are

Autogrill Group
66
2. Consolidated financial statem
ents
expected to be met, such that the amount ultimately recognized as an expense is based on the number of awards that will definitively vest. Likewise, when estimating the fair value of the options granted, all non-vesting conditions must be considered.
In the case of cash-settled share-based payment transactions (or those settled with equity or other financial instruments of a different entity), the fair value of the amount payable to employees is recognized as an expense with a corresponding increase in liabilities over the period that the employees become unconditionally entitled to payment. The liability is remeasured at each reporting date and at settlement date based on the fair value of the share appreciation rights. Any changes in the liability are recognized as employee benefit expenses in the income statement.
Income tax
Tax for the year is the sum of current and deferred taxes recognized in the profit or loss for the year, with the exception of those recognized directly in equity or in other comprehensive income.
Current tax is calculated on taxable income for the year. Taxable income differs from the result reported in the income statement because it excludes costs and income that will be deducted or taxed in other years, as well as items that will never be deducted or taxed. Current tax liabilities are determined using the tax rates in effect (on an official or de facto basis) at the reporting date in the countries where the Group operates.
For three-year period 2013-2015, Autogrill S.p.A. and its Italian subsidiary Nuova Sidap S.r.l. have joined the domestic tax consolidation scheme of the ultimate parent Edizione S.r.l. as permitted by the Consolidated Income Tax Act. The regulation signed by the parties provides for: payment in full of the amount corresponding to the transferred profit times the IRES (corporate tax) rate; payment in full of the amount corresponding to the transferred loss times the IRES (corporate tax) rate, when utilized by Edizione S.r.l.; the transfer of any tax assets. The net current tax asset or liability for the year, in respect of IRES only, is therefore recognized as a receivable or payable due from/to Edizione S.r.l. and is therefore not shown under tax assets or liabilities but under “Other receivables” or “Other payables”.
Deferred tax liabilities are generally recognized for all taxable temporary differences, while deferred tax assets, arising from deductible temporary differences and losses carried forward, are recognized and maintained in the financial statements to the extent that future taxable income is likely to be earned allowing use of those assets. Specifically, the carrying amount of deferred tax assets is reviewed at each reporting date based on the latest forecasts as to future taxable income.
Deferred tax assets and liabilities are not recognized if the temporary differences arise from the initial recognition of goodwill or, for transactions other than business combinations, of other assets or liabilities in transactions that have no influence either on accounting profit or on taxable income. Deferred tax liabilities are recognized on taxable temporary differences relating to equity investments in subsidiaries, associates or joint ventures, unless the Group is able to monitor the reversal of the temporary differences and they are unlikely to be reversed in the foreseeable future.
Deferred tax assets and liabilities are measured using the tax rate expected to apply at the time the asset is realized or the liability is settled, taking account of the tax rates in force at the year-end.

2014 Annual Report
67
2.2
Not
es to
the
cons
olid
ated
fina
ncia
l sta
tem
ents
Current and deferred tax assets and liabilities are offset when there is a legal right to offset them and when they pertain to the same tax authorities.
Non-current assets
GoodwillGoodwill arising from the acquisition of subsidiaries is shown separately in the statement of financial position.
Goodwill is not amortized, but is subject to impairment testing on a yearly basis or when specific events or changed circumstances indicate the possibility of a loss in value. After its initial recognition, goodwill is measured at cost net of any accumulated impairment losses.
Upon the sale of a company or part of a company whose previous acquisition gave rise to goodwill, account is taken of the residual value of the goodwill in determining the (capital) gain or loss from the sale.
Other intangible assets“Other intangible assets” are recognized at purchase price or production cost, including ancillary charges, and amortized over their useful life when it is likely that use of the asset will generate future economic benefits.
The Group reviews the estimated useful life and amortization method of these assets at each year-end and whenever there is evidence of possible impairment losses. If impairment losses arise – determined in accordance with the section “Impairment losses on assets” – the asset is impaired accordingly.
The following are the amortization periods used for the various kinds of intangible asset:
Concessions, licenses, trademarks and similar rights:
Software licenses 3-6 years or term of license
License to sell state monopoly goods Term of license
Contractual rights Term of the rights
Other:
Software 3-6 years
Other costs to be amortized 3-10 years or term of underlying contract
Property, plant and equipmentProperty, plant and equipment are recognized when it is probable that use of the asset will generate future benefits and when the cost of the asset can be reliably determined. They are stated at purchase price or production cost, including ancillary charges and direct or indirect costs to the extent that can reasonably be attributed to the asset.
On transition to IFRS, any revaluations carried out in accordance with monetary revaluation laws were maintained in the financial statements as they are consistent with IFRS 1.
Property, plant and equipment are systematically depreciated on a straight-line basis at rates deemed to reflect their residual estimated useful lives. The Group reviews the useful life of each asset at every year-end. Cost includes reasonably estimated expenses (if compatible with IAS 37) that are likely to be

Autogrill Group
68
2. Consolidated financial statem
ents
incurred on expiry of the relevant contract to restore the asset to the contractually agreed condition, assuming that maintenance will continue to be carried out properly and with the usual frequency. Components of a significant amount (in excess of E 500k) or with a different useful life (50% longer or shorter than that of the asset to which the component belongs) are considered separately when determining depreciation.
The following are the depreciation periods used for property, plant and equipment:
Property, plant and equipment Useful life (years)
Industrial buildings 5-50
Plant and machinery 3-13
Industrial and commercial equipment 3-23
Other 3-33
Land is not depreciated.
For “Assets to be transferred free of charge”, these rates, if higher, are replaced by those corresponding to the term of the concession contract.
An asset’s useful life is reviewed annually, and is changed when maintenance work during the year has involved enhancements or replacements that materially change its useful life.
Regardless of depreciation already recognized, if there are impairment losses (determined as described under “Impairment losses on non-financial assets”), the asset is impaired accordingly.
Costs incurred to enhance and maintain an asset that produce a material and tangible increase in its productivity or safety or extend its useful life are capitalized to the asset and depreciated over its useful life. Routine maintenance costs are taken directly to the income statement.
Leasehold improvements are included in property, plant and equipment on the basis of the type of cost incurred. They are depreciated over the asset’s residual useful life or the term of the contract, whichever is shorter.
The gain or loss from the sale of property, plant or equipment is the difference between the net proceeds of the sale and the asset’s carrying amount, and is recognized under “Other operating income” or “Other operating expense”.
Leased assetsLease contracts are classified as finance leases if the terms of the contract are such to transfer all risks and benefits of ownership to the lessee. All other lease contracts are treated as operating leases.
Assets acquired under finance leases are recognized at fair value as of the commencement date of the contract less ancillary charges and any expenses for replacing another party in the lease, or, if lower, at the present value of the minimum payments due under the contract. The corresponding liability to the lessor is charged to “Other financial liabilities”. Lease payments are divided into principal and interest, using a constant interest rate for the full duration of the contract. Financial expense is recognized in the income statement.

2014 Annual Report
69
2.2
Not
es to
the
cons
olid
ated
fina
ncia
l sta
tem
ents
Operating lease payments are recognized over the term of the lease. Benefits received or to be received, and those given or to be given, as incentives for taking out operating leases are recognized on a straight-line basis for the entire duration of the lease (see section 2.2.12 – Operating leases).
Impairment losses on non-financial assetsAt each reporting date, the Group tests whether there is internal or external evidence of impairment of its property, plant and equipment and intangible assets. If so, the recoverable amount of the assets is estimated to determine any impairment loss. Where it is not possible to estimate the recoverable amount of an individual asset, the Group estimates the recoverable amount of the cash-generating unit to which the asset belongs; a cash-generating unit is a Group of assets that generates cash flows broadly independent from other assets or Groups of assets. With regard to property, plant and equipment used in the sales network, this minimum aggregation unit is the sales outlet or the sales outlets covered by a single concession agreement.
Goodwill and assets under construction are tested for impairment at each year-end and any time there is evidence of possible impairment.
The cash-generating units to which goodwill has been allocated are grouped so that the level of detection of impairment reflects the level of greatest detail at which goodwill is monitored for internal reporting purposes, anyway respecting the maximum limit of this aggregation that is the operating segment. Goodwill acquired in a business combination is allocated to the cash-generating units expected to benefit from the synergies of the combination.
The recoverable amount is the higher of fair value less costs to sell and value in use. In determining value in use, the estimated future cash flows are discounted to their present value using a pre-tax rate that reflects current market assessments of the time value of money and the risks specific to the asset. If the recoverable amount of an asset or cash-generating unit is estimated to be less than its carrying amount, it is reduced to the recoverable amount. Impairment losses are recognized in the income statement.
Impairment losses on cash-generating units are first deducted from the carrying amount of any goodwill attributed to the unit; any remainder is deducted from the other assets of the unit (or group of units) in proportion to their carrying amount.
If the reason for the impairment no longer exists, the asset or cash-generating unit is written back to the new estimate of recoverable amount (except in the case of goodwill), which may not exceed the carrying amount net of depreciation/amortization that the asset would have had if the impairment loss had not been charged. The reversal of impairment is taken to the income statement.
Assets/liabilities held for sale and discontinued operationsA discontinued operation is part of a Group whose activities and financial flows are clearly distinguishable from the rest of the Group, and which:• constitutes a major independent branch or geographical area of business,• is part of a single coordinated plan to dispose of a major independent branch or geographical area of business, or• is a subsidiary acquired for the sole purpose of reselling it.
An operation is listed as discontinued when it is sold or when it meets the conditions for being classified as “held for sale”, whichever comes first.

Autogrill Group
70
2. Consolidated financial statem
ents
When an operation is listed as discontinued, the comparative statement of comprehensive income is reclassified as if the operation had been discontinued as of the beginning of the comparative year.
The assets and liabilities of operations being discontinued are classified as held for sale if their carrying amount has been or will be recovered mainly through their sale and not through continued use. Once an asset/liability is classified as held for sale, it is recognized at the lower of carrying amount and fair value less cost to sell.
In the financial statements:• the net profit or loss of discontinued operations is shown separately in the income statement, net of tax effects and cost to sell (if sold), along with any capital gain or loss realized with the sale; the corresponding amounts from the prior year are reclassified for the sake of comparison;• financial assets and liabilities held for sale and discontinued operations are shown in the statement of financial position separately from other assets/liabilities and are not offset.
Current assets and current and non-current liabilities
InventoriesInventories are recognized at the lower of purchase or production cost and market value. Purchase or production cost includes directly attributable expenses, net of discounts, rebates, annual bonuses and similar contributions from suppliers, and is calculated using the FIFO method. When the carrying amount of inventories is higher than their net realizable value, they are written down and an impairment loss is charged to the income statement. The recoverability of inventories is tested at the end of each year. If the reasons for the write-down cease to apply, they are reversed to an amount not exceeding purchase or production cost.
Trade and other receivablesTrade receivables and other receivables are initially recognized at fair value, and subsequently at amortized cost using the effective interest method. They are reduced by estimated impairment losses.
In accordance with IAS 39, factored receivables are eliminated from the accounts if the contract entails the full transfer of the associated risks and rewards (contractual rights to receive cash flows from the asset). The difference between the carrying amount of the asset transferred and the amount received is recognized in the income statement as a financial expense.
Other financial assets“Other financial assets” are recognized or derecognized at the transaction date and are initially measured at fair value, including direct transaction costs.
Subsequently, the financial assets that the Group has the intention and capacity to hold to maturity (held to maturity investments) are measured at amortised cost net of impairment losses.
Financial assets other than those held to maturity are classified as held for trading or available for sale and are measured at each year-end at fair value. If the financial assets are held for trading, gains and losses arising from changes in fair value are recognized in that year’s income statement, under financial income/expense.

2014 Annual Report
71
2.2
Not
es to
the
cons
olid
ated
fina
ncia
l sta
tem
ents
Financial assets available for sale are initially recognized at fair value plus any directly attributable transaction costs. After first-time recognition, they are carried at fair value and any changes in fair value, other than impairment losses, are recognized as other comprehensive income and presented in the fair value reserve. When a financial asset is derecognized, the cumulative loss or gain is reclassified from other comprehensive income to profit (loss) for the year.
Cash and cash equivalentsCash and cash equivalents include cash and current accounts with banks and post offices, as well as demand deposits and other highly liquid short-term financial investments (maturity of three months or less from the acquisition date) that are immediately convertible to cash; they are stated at nominal amount as they are subject to no significant risk of impairment.
Loans, bank loans, bonds and overdraftsInterest-bearing bank loans, bonds and account overdrafts are initially recognized at fair value taking account of the amounts received, net of transaction costs, and are subsequently measured at amortized cost using the effective interest method.
Trade payablesTrade payables are initially recognized at fair value (normally the same as nominal amount) net of discounts, returns and billing adjustments, and subsequently at amortized cost, if the financial effect of payment deferral is material.
Derivative financial instruments and hedge accountingThe Group’s liabilities are exposed primarily to financial risks due to changes in interest and exchange rates. To manage these risks the Group uses financial derivatives, mainly in the form of interest rate swaps, forward rate agreements, interest rate options, and combinations of these. Some Group companies have a policy of converting part of floating-rate debt into fixed-rate. The use of derivatives is governed by Group policies approved by Autogrill S.p.A.’s Board of Directors, which establish precise written procedures concerning the use of derivatives in accordance with the Group’s risk management strategies. Derivative contracts have been entered into with counterparties deemed to be financially solid, with the aim of reducing default risk to a minimum. Group companies do not use derivatives for purely trading purposes, but rather to hedge identified risks.
For further information see the policy described in section 2.2.7.2 “Financial risk management”.
In accordance with IAS 39, derivative financial instruments qualify for hedge accounting only if: (i) at the inception of the hedge there is formal designation and documentation of the hedging relationship, and the hedge is assumed to be effective; (ii) effectiveness can be reliably measured; (iii) the hedge is effective throughout the financial reporting periods for which it was designated.
All derivative financial instruments are initially measured at fair value in accordance with IFRS 13 and IAS 39, with the related transaction costs recognized in profit or loss when incurred. They are subsequently carried at fair value. More specifically, the fair value of forward exchange contracts is based on the listed market price, where available. If a listed market price is not available, then fair value is estimated by discounting the difference between the contractual forward price and the current spot rate for the residual maturity of the contract using a risk-free interest rate (based on government securities) of the country/currency of the instrument’s user.

Autogrill Group
72
2. Consolidated financial statem
ents
For interest rate swaps, fair value is determined using the cash flows estimated on the basis of the conditions and remaining life of each contract, and according to the year-end market interest rates of comparable instruments.
Fair value changes are measured as described below.
When financial instruments qualify for hedge accounting, the following rules apply:• Fair value hedge: if a derivative financial instrument is designated as a hedge against changes in the fair value of a recognized asset or liability attributable to a particular risk that may affect profit or loss, the gain or loss arising from subsequent fair value accounting of the hedge is recognized in the income statement. The gain or loss on the hedged item attributable to the hedged risk adjusts its carrying amount and is recognized in the income statement;• Cash flow hedge: if a financial instrument is designated as a hedge against exposure to variations in the future cash flows of a recognized asset or liability or a forecast transaction that is highly probable and could affect profit or loss, the effective portion of the gain or loss on the financial instrument is recognized in comprehensive income and presented in the “hedging reserve” under equity. The cumulative gain or loss is reclassified from comprehensive income and recognized in profit or loss in the same year in which the economic effect of the hedged transaction is recognized. Fair value gains and losses associated with a hedge (or part of a hedge) which has become ineffective are recognized in the income statement immediately. If a hedge or a hedging relationship is terminated, but the hedged transaction has not yet taken place, the gains or losses accrued up to that time in the statement of comprehensive income are reclassified to profit or loss as soon as the transaction occurs. If the transaction is no longer expected to take place, the gains or losses not yet realized that have been included in comprehensive income are reclassified immediately to profit or loss;• Hedge of net investment: if a derivative is designated as a hedge of a net investment in a foreign operation, held directly or indirectly through an intermediary holding company, the effective portion of the gain or loss on the hedge is recognized in comprehensive income and presented in the “translation reserve” under equity, while the ineffective portion is taken to profit or loss. On disposal of the foreign operation, the gain or loss on the effective portion of the hedge that has been cumulatively recognized in the translation reserve is also taken to profit or loss.
If hedge accounting does not apply, the gains or losses arising from measurement at fair value of the financial derivative are immediately recognized in the income statement.
Provisions for risks and chargesProvisions are recognized when the Group has a present obligation as a result of a past event and will likely have to use resources in order to produce economic benefits that satisfy that obligation, and when the amount of the obligation can be reliably determined. Provisions are based on the best estimate of the cost of fulfilling the obligation at the reporting date, and when the effect is material, are discounted to their present value.
An onerous contracts provision is recognized when the unavoidable costs necessary to fulfil the obligations of a contract are greater than the economic benefits the Group can expect to obtain therefrom. The provision is measured at the present value of the lower of the cost of terminating the contract and the net cost of continuing with the contract. Before a provision is established, the Group recognizes any impairment losses on the assets associated with the contract.

2014 Annual Report
73
2.2
Not
es to
the
cons
olid
ated
fina
ncia
l sta
tem
ents
A provision for restructuring is recognized when the Group has approved a detailed and formal restructuring plan, and the restructuring has either commenced or been publicly announced. Future operating costs are not provided for.
Share capital and of treasury sharesThe share capital is comprised wholly of ordinary shares, which form part of equity. Incremental costs directly attributable to the issue of ordinary shares, net of any tax effects, are recognised as a deduction from equity.
If treasury shares are purchased, the amount paid – including directly attributable expenses and net of tax effects – is deducted from equity. The shares thus purchased are classified as treasury shares and reduce the amount of total equity. The amount received from the subsequent sale or re-issue of treasury shares is added back to equity. Any positive or negative difference from the transaction is transferred to or from retained earnings.
Earnings per shareAutogrill presents basic and diluted earnings per share for its ordinary shares. Basic earnings per share is calculated by dividing the profit or loss attributable to ordinary shareholders of the Parent by the weighted average number of ordinary shares outstanding during the year, adjusted for treasury shares held. Diluted earnings per share is determined by adjusting the profit or loss attributable to ordinary shareholders and the weighted average number of ordinary shares outstanding, as defined above, for the effects of all dilutive potential ordinary shares and stock options granted to employees.
Foreign currency transactionsTransactions in foreign currencies are converted into the functional currency at the exchange rate in effect on the transaction date. Foreign currency assets and liabilities are converted at the year-end exchange rate. Exchange gains and losses arising from translation are recognized in the income statement, under financial income/expense.
Use of estimatesThe preparation of the consolidated financial statements and notes requires management to make estimates and assumptions that affect the carrying amounts of assets, liabilities, costs and income and the disclosure about contingent assets and liabilities at the reporting date. Actual results may differ. Estimates are used to determine the effects of business combinations, impairment losses on assets, the fair value of derivatives, accrual to the allowance for impairment and to the allowance for inventory write-down, amortization and depreciation, employee benefits, tax and other provisions. Estimates and assumptions are periodically reviewed and the effect of any change is taken to the income statement in the current and future years.
2.2.2 Discontinued operations – demergerIn accordance with IFRS 5 “Non-current assets held for sale and discontinued operations”, income/costs and cash flows for the Travel Retail & Duty Free business up to the effective date of the demerger (1 October 2013) are shown on the lines “Profit for the year - Discontinued operations (net of tax effects)” and “Cash flows for the year from discontinued operations (demerger)”.
Below are the income statement and the statement of cash flows for the first nine months of 2013 of the discontinued operations.

Autogrill Group
74
2. Consolidated financial statem
ents
Income statement
(Ek)First nine months
2013
Revenue 1,531,436
Other operating income 18,803
Total revenue and other operating income 1,550,239
Raw materials, supplies and goods 624,753
Personnel expense 154,192
Leases, rentals, concessions and royalties 488,242
Other operating expense 88,988
Depreciation and amortization 65,932
Impairment losses on property, plant and equipment and intangible assets 3
Operating profit 128,129
Financial income 7,575
Financial expense (31,246)
Adjustment to the value of financial assets 2,161
Pre-tax profit 106,619
Income tax (15,563)
Profit for the period 91,056
Profit for the period attributable to:
- owners of the parent 89,341
- non-controlling interests 1,715

2014 Annual Report
75
2.2
Not
es to
the
cons
olid
ated
fina
ncia
l sta
tem
entsStatement of cash flows
(Ek)First nine months
2013
Opening net cash and cash equivalents 15,366
Pre-tax profit and net financial expense for the period 130,289
Amortization, depreciation and impairment losses on non-current assets, net of reversals 65,935
Adjustment and (gains)/losses on disposal of financial assets (2,161)
(Gain)/losses on disposal of non-current assets 421
Change in working capital * 6,488
Net change in non-current non-financial assets and liabilities (267,463)
Cash flows used in operating activities (66,491)
Taxes paid (30,840)
Interest paid (19,253)
Net cash flows used in operating activities (116,583)
Acquisition of property, plant and equipment and intangible assets (19,471)
Proceeds from sale of non-current assets 113
Disposal of US Retail business (74,121)
Net change in non-current financial assets (25,918)
Net cash flows used in investing activities (119,397)
Issue of new non-current loans 996,078
Repayments of non-current loans (481,311)
Repayments of non-current loans to Autogrill S.p.A. (70,000)
Repayments of current loans, net of new loans 10,650
Dividends paid to Autogrill S.p.A. (220,000)
Other cash flows ** (3,118)
Net cash flows from financing activities 232,299
Cash flow for the period (3,683)
Closing net cash and cash equivalents 11,683
* Includes the exchange rate gains (losses) on income components** Includes dividends paid to non-controlling interests in subsidiaries
Reconciliation of net cash and cash equivalents
(Ek)
Opening – net cash and cash equivalents – balance as of 31 December 2012 15,366
Cash and cash equivalents 18,684
Current account overdrafts (3,318)
Closing – net cash and cash equivalents – balance as of 30 September 2013 11,683
Cash and cash equivalents 29,647
Current account overdrafts (17,964)

Autogrill Group
76
2. Consolidated financial statem
ents
2.2.3 DisposalsIn order to transfer all of the Group’s Travel Retail & Duty Free operations to World Duty Free S.p.A. (beneficiary of the Autogrill S.p.A. demerger), on 7 September 2013 HMSHost Corporation and its subsidiary Host International Inc. entered into an agreement with World Duty Free Group US Inc. (an indirect subsidiary of World Duty Free S.p.A.) for the sale of the North American travel retail business for the sum of $ 120m. At 31 December 2013, contracts making up about 90% of the total called for in the agreement had been effectively transferred (with a combined value of about $ 105m), as the necessary authorizations from the concession grantors had not yet been obtained for the rest.
The change in the estimated tax charge for HMSHost Corporation on the capital gain from the sale of the US Retail business, recognized in 2013, is included in the 2014 financial statements. The effect is recognized in shareholders’ equity as it refers to a business combination under common control.
On 28 February 2015, after the Board of Directors approved the transaction on 24 February 2015, Autogrill S.p.A. transferred to World Duty Free Group the four remaining Travel Retail contracts operated at the Atlanta and Oakland airports and at the Empire State Building in New York, worth a total of $ 19m. The carrying amount at 31 December 2014 of net assets and liabilities transferred is $ 17.6m.

2014 Annual Report
77
2.2
Not
es to
the
cons
olid
ated
fina
ncia
l sta
tem
ents2.2.4 Notes to the statement of financial position
Current assets
I. Cash and cash equivalents
(Ek) 31.12.2014 31.12.2013 Change
Bank and post office deposits 126,299 102,153 24,146
Cash and equivalents on hand 56,942 69,363 (12,421)
Total 183,241 171,516 11,725
“Cash and equivalents on hand” include cash floats at stores and amounts in the process of being credited to bank accounts. The amount may vary substantially depending on the frequency of pick-ups for deposit, which are generally handled by specialized third-party carriers.
II. Other financial assets
(Ek) 31.12.2014 31.12.2013 Change
Financial receivables from third parties 19,672 19,597 75
Fair value of interest rate hedging derivatives 798 1,329 (531)
Fair value of exchange rate hedging derivatives 774 23 751
Total 21,244 20,949 295
“Financial receivables from third parties” consists mostly of current receivables due from the non-controlling shareholders of some North American subsidiaries.
“Fair value of interest rate hedging derivatives” includes the current portion of the fair value measurement of derivatives outstanding at 31 December 2014, with a combined notional amount of $ 100m. At 31 December 2013 this item included the current portion of the fair value measurement (total notional amount: $ 75m) of interest rate hedging derivatives.
“Fair value of exchange rate hedging derivatives” includes the current portion of the fair value measurement of the derivatives entered into to hedge currency risk at 31 December 2014, in particular to the forward purchase and/or sale of currency, in connection with intercompany loans and dividends.

Autogrill Group
78
2. Consolidated financial statem
ents
III. Tax assets
These amount to E 3,364k (E 5,981k at 31 December 2013) and refer to income tax advances and credits.
IV. Other receivables
(Ek) 31.12.2014 31.12.2013 Change
Suppliers 66,749 67,890 (1,141)
Lease and concession advance payments 23,040 16,854 6,186
Inland revenue and government agencies 24,984 19,114 5,870
Receivables from credit card companies 11,478 8,919 2,559
Personnel 803 1,101 (298)
Advances to grantors for investments 4,520 4,002 518
Sub-concessionaires 3,786 2,875 911
Receivables from the parent for tax consolidation 14,645 14,564 81
Other 26,581 40,991 (14,410)
Total 176,586 176,310 276
“Suppliers” refers chiefly to amounts receivable for promotional contributions and supplier bonuses awaiting settlement, as well as advances for services to be received.
“Lease and concession advance payments” consist of lease instalments paid in advance, as required by contract.
Receivables from “Inland revenue and government agencies” relate mostly to indirect taxes.
Amounts due from “Sub-concessionaires” refer to businesses licensed to others, while “Advances to grantors for investments” concern commercial investments carried out on behalf of concession grantors.
“Receivables from the parent for tax consolidation” concern the amount due from Edizione S.r.l. to the Italian companies in the Group that participate in the domestic tax consolidation scheme; they increased from E 14,564k at 31 December 2013 to E 14,645k at 31 December 2014.
“Other” includes prepayments for maintenance and insurance policies and advances on local taxes. At 31 December 2013, this item included $ 18.2m due to the US subsidiary from World Duty Free Group for the sale of the US Retail business, which was collected in 2014.

2014 Annual Report
79
2.2
Not
es to
the
cons
olid
ated
fina
ncia
l sta
tem
ents
V. Trade receivables
(Ek) 31.12.2014 31.12.2013 Change
Third parties 49,742 52,208 (2,466)
Allowance for impairment (6,249) (5,837) (412)
Total 43,493 46,371 (2,878)
“Third parties” refers mainly to catering service agreements and accounts with affiliated companies.
Movements in the “Allowance for impairment” are shown below:
(Ek)
Allowance for impairment at 31.12.2013 5,837
Increases, net of use 316
Other movements and exchange rate differences 301
Utilizations (205)
Allowance for impairment at 31.12.2014 6,249
VI. Inventories
Inventories, totalling E 123,540k at 31 December 2014 (up from E 106,123k the previous year), are shown net of the allowance for inventory write-down of E 599k (E 646k at 31 December 2013), determined considering the estimated recoverability of slow-moving goods. The increase is due in part to a different trend in the purchasing of monopoly goods (lottery tickets) in Italy at the reporting date.

Autogrill Group
80
2. Consolidated financial statem
ents
Non-current assets
VII. Property, plant and equipment
The following tables show movements in “Property, plant and equipment” at 31 December 2014 and 2013.
Property, plant and equipment (Ek)
31.12.2013 Change in gross carrying amount Change in gross carrying amount Depreciation/Impairment losses 31.12.2014
Gross carrying
amount
Accumulated depreciation and impair.
lossesCarrying
amount
Change in consolidation
scopeExchange rate gains (losses) Increases Decreases
Other movements Total
Change in consolidation
scopeExchange rate gains (losses)
Increases
DecreasesOther
movements TotalGross carrying
amount
Accumulated depreciation and impair.
losses
Carrying
amountDeprec. Imp. losses
Industrial land and buildings 163,957 (84,125) 79,832 - 1,218 908 (167) 723 2,682 - (796) (4,188) (837) 167 54 (5,600) 166,639 (89,727) 76,912
Leasehold improvements 971,328 (674,088) 297,240 570 80,802 11,590 (88,052) 64,282 69,192 - (51,417) (67,523) (2,080) 87,791 (1,148) (34,377) 1,040,520 (708,465) 332,055
Plant and machinery 216,370 (171,967) 44,403 - 2,188 2,545 (13,483) 4,077 (4,673) - (1,852) (11,663) (1,047) 13,387 63 (1,112) 211,697 (173,079) 38,618
Industrial and commercial equipment 745,367 (576,022) 169,345 455 38,575 17,789 (40,715) 47,181 63,285 52 (26,269) (63,896) (1,814) 39,880 (1,659) (53,706) 808,652 (629,728) 178,924
Assets to be transferred free of charge 450,963 (358,322) 92,641 - - 8,399 (75,435) 8,220 (58,816) - - (22,223) (4,304) 75,396 363 49,232 392,148 (309,090) 83,058
Other 50,069 (45,549) 4,520 (13) 498 1,273 (1,141) 1,948 2,565 13 (426) (2,288) (52) 1,128 (366) (1,991) 52,634 (47,540) 5,094
Assets under construction and payments on account 94,556 - 94,556 - 8,982 141,511 (474) (124,333) 25,686 - - - - - - - 120,242 - 120,242
Total 2,692,610 (1,910,073) 782,537 1,012 132,263 184,015 (219,467) 2,098 99,921 65 (80,760) (171,781) (10,134) 217,749 (2,693) (47,554) 2,792,532 (1,957,629) 834,903
31.12.2012 Change in gross carrying amount Change in gross carrying amount Depreciation/Impairment losses 31.12.2013
Property, plant and equipment (Ek)Gross carrying
amount
Accumulated depreciation and impair.
lossesCarrying
amount
Change in consolidation
scopeExchange rate gains (losses) Increases Decreases
Other movements Demerger Total
Exchange rate gains (losses)
Increases
DecreasesOther
movements Demerger TotalGross carrying
amount
Accumulated depreciation and impair.
losses
Carrying
amountDeprec. Imp. losses
Industrial land and buildings 155,579 (83,493) 72,086 - (1,080) 3,070 (3,685) 10,073 - 8,378 656 (3,234) (1,367) 3,269 44 - (632) 163,957 (84,125) 79,832
Leasehold improvements 1,045,151 (719,224) 325,927 3,237 (35,219) 7,561 (111,945) 62,543 - (73,823) 24,611 (77,752) (3,750) 100,976 1,051 - 45,136 971,328 (674,088) 297,240
Plant and machinery 211,773 (168,210) 43,563 - (1,677) 5,598 (6,411) 7,087 - 4,597 1,359 (11,219) (326) 6,411 18 - (3,757) 216,370 (171,967) 44,403
Industrial and commercial equipment 757,342 (587,991) 169,351 200 (15,715) 15,103 (71,582) 60,019 - (11,975) 12,586 (65,030) (1,455) 66,675 (807) - 11,969 745,367 (576,022) 169,345
Assets to be transferred free of charge 462,158 (349,628) 112,530 - - 14,225 (32,447) 7,027 - (11,195) - (34,710) (6,458) 32,475 - - (8,693) 450,963 (358,322) 92,641
Other 49,314 (44,414) 4,900 - (244) 780 (1,457) 1,677 - 756 242 (2,545) (19) 1,374 (187) - (1,135) 50,069 (45,549) 4,520
Assets under construction and payments on account 142,355 - 142,355 - (4,428) 108,670 (3,382) (148,659) - (47,799) - - - - - - - 94,556 - 94,556
Discontinued Operations – demerger (Travel Retail & Duty Free) * 311,436 (224,149) 87,287 - (6,069) 44,248 (18,254) (240) (331,121) (311,436) 4,075 (18,803) (3) 17,722 - 221,158 224,149 - - -
Total 3,135,108 (2,177,109) 957,999 3,438 (64,432) 199,255 (249,163) (473) (331,121) (442,497) 43,529 (213,293) (13,378) 228,902 119 221,158 267,037 2,692,610 (1,910,073) 782,537
* Please refer to section 2.2.2 for Discontinued operations - demerger (Travel Retail & Duty Free)

2014 Annual Report
81
2.2
Not
es to
the
cons
olid
ated
fina
ncia
l sta
tem
ents
Property, plant and equipment (Ek)
31.12.2013 Change in gross carrying amount Change in gross carrying amount Depreciation/Impairment losses 31.12.2014
Gross carrying
amount
Accumulated depreciation and impair.
lossesCarrying
amount
Change in consolidation
scopeExchange rate gains (losses) Increases Decreases
Other movements Total
Change in consolidation
scopeExchange rate gains (losses)
Increases
DecreasesOther
movements TotalGross carrying
amount
Accumulated depreciation and impair.
losses
Carrying
amountDeprec. Imp. losses
Industrial land and buildings 163,957 (84,125) 79,832 - 1,218 908 (167) 723 2,682 - (796) (4,188) (837) 167 54 (5,600) 166,639 (89,727) 76,912
Leasehold improvements 971,328 (674,088) 297,240 570 80,802 11,590 (88,052) 64,282 69,192 - (51,417) (67,523) (2,080) 87,791 (1,148) (34,377) 1,040,520 (708,465) 332,055
Plant and machinery 216,370 (171,967) 44,403 - 2,188 2,545 (13,483) 4,077 (4,673) - (1,852) (11,663) (1,047) 13,387 63 (1,112) 211,697 (173,079) 38,618
Industrial and commercial equipment 745,367 (576,022) 169,345 455 38,575 17,789 (40,715) 47,181 63,285 52 (26,269) (63,896) (1,814) 39,880 (1,659) (53,706) 808,652 (629,728) 178,924
Assets to be transferred free of charge 450,963 (358,322) 92,641 - - 8,399 (75,435) 8,220 (58,816) - - (22,223) (4,304) 75,396 363 49,232 392,148 (309,090) 83,058
Other 50,069 (45,549) 4,520 (13) 498 1,273 (1,141) 1,948 2,565 13 (426) (2,288) (52) 1,128 (366) (1,991) 52,634 (47,540) 5,094
Assets under construction and payments on account 94,556 - 94,556 - 8,982 141,511 (474) (124,333) 25,686 - - - - - - - 120,242 - 120,242
Total 2,692,610 (1,910,073) 782,537 1,012 132,263 184,015 (219,467) 2,098 99,921 65 (80,760) (171,781) (10,134) 217,749 (2,693) (47,554) 2,792,532 (1,957,629) 834,903
31.12.2012 Change in gross carrying amount Change in gross carrying amount Depreciation/Impairment losses 31.12.2013
Property, plant and equipment (Ek)Gross carrying
amount
Accumulated depreciation and impair.
lossesCarrying
amount
Change in consolidation
scopeExchange rate gains (losses) Increases Decreases
Other movements Demerger Total
Exchange rate gains (losses)
Increases
DecreasesOther
movements Demerger TotalGross carrying
amount
Accumulated depreciation and impair.
losses
Carrying
amountDeprec. Imp. losses
Industrial land and buildings 155,579 (83,493) 72,086 - (1,080) 3,070 (3,685) 10,073 - 8,378 656 (3,234) (1,367) 3,269 44 - (632) 163,957 (84,125) 79,832
Leasehold improvements 1,045,151 (719,224) 325,927 3,237 (35,219) 7,561 (111,945) 62,543 - (73,823) 24,611 (77,752) (3,750) 100,976 1,051 - 45,136 971,328 (674,088) 297,240
Plant and machinery 211,773 (168,210) 43,563 - (1,677) 5,598 (6,411) 7,087 - 4,597 1,359 (11,219) (326) 6,411 18 - (3,757) 216,370 (171,967) 44,403
Industrial and commercial equipment 757,342 (587,991) 169,351 200 (15,715) 15,103 (71,582) 60,019 - (11,975) 12,586 (65,030) (1,455) 66,675 (807) - 11,969 745,367 (576,022) 169,345
Assets to be transferred free of charge 462,158 (349,628) 112,530 - - 14,225 (32,447) 7,027 - (11,195) - (34,710) (6,458) 32,475 - - (8,693) 450,963 (358,322) 92,641
Other 49,314 (44,414) 4,900 - (244) 780 (1,457) 1,677 - 756 242 (2,545) (19) 1,374 (187) - (1,135) 50,069 (45,549) 4,520
Assets under construction and payments on account 142,355 - 142,355 - (4,428) 108,670 (3,382) (148,659) - (47,799) - - - - - - - 94,556 - 94,556
Discontinued Operations – demerger (Travel Retail & Duty Free) * 311,436 (224,149) 87,287 - (6,069) 44,248 (18,254) (240) (331,121) (311,436) 4,075 (18,803) (3) 17,722 - 221,158 224,149 - - -
Total 3,135,108 (2,177,109) 957,999 3,438 (64,432) 199,255 (249,163) (473) (331,121) (442,497) 43,529 (213,293) (13,378) 228,902 119 221,158 267,037 2,692,610 (1,910,073) 782,537
* Please refer to section 2.2.2 for Discontinued operations - demerger (Travel Retail & Duty Free)

Autogrill Group
82
2. Consolidated financial statem
ents
Investments in 2014 amounted to E 184,015k, while the net carrying amount of disposals was E 1,718k. The disposals generated net gains of E 3,373k.
In addition to depreciation of E 171,781k, impairment testing of individual CGUs resulted in impairment losses of E 10,134k. Impairment testing was based on estimated future cash flows (without considering any assumed efficiency gains), discounted at the average cost of capital, which reflects the cost of money and the specific business risk associated with each country of operation.
Leasehold improvements refer to expenses incurred to set up or adapt leased premises and concessions. This includes costs for the development of locations managed at airports, at shopping centers in North America, and at several motorway locations.
The increase in “Assets under construction and payments on account” mainly reflects the greater investments underway in North America, primarily in the airport channel.
In accordance with the financial method, this item includes the contractual value of the following property, plant and equipment held under finance leases:
31.12.2014 31.12.2013
(Ek) Gross amount
Accumulated depreciation
and impairment losses
Carrying amount Gross amount
Accumulated depreciation
and impairment losses
Carrying amount
Land and buildings 6,569 (4,467) 2,102 12,795 (10,558) 2,237
Plant and machinery 727 (460) 267 759 (495) 264
Assets to be transferred free of charge 5,108 (3,172) 1,936 12,788 (10,667) 2,121
Leasehold improvements 519 (329) 190 59 (25) 34
Industrial and commercial equipment 511 (188) 323 7 (3) 4
Other 84 (53) 31 10 (4) 6
Total 13,518 (8,669) 4,849 26,418 (21,752) 4,666

2014 Annual Report
83
2.2
Not
es to
the
cons
olid
ated
fina
ncia
l sta
tem
ents
The financial payable for these goods amounts to E 6,296k and is included under “Other financial liabilities” (current) for E 666k (E 893k at the end of 2013) and “Other financial liabilities” (non-current) for E 5,630k (E 10,149k the previous year). Future lease payments due after 31 December 2014 amounted to E 9,652k (E 19,141k at the end of 2013).
The Group also uses third party assets worth E 1,301k and rents businesses with assets worth E 12,769k.
VIII. Goodwill
At 31 December 2014 goodwill amounts to E 804,544k, compared with E 749,237k the previous year.
The cash-generating units (CGUs) were identified on the basis of business segment, following a geographical/operational logic, consistently with the minimum level at which goodwill is monitored for internal management purposes. Unlike in 2013, the goodwill allocated to the CGUs HMSHost North America and HMSHost International (which covers Northern Europe, the Middle East and Asia) have been shown separately, in keeping with revised management and reporting models.
The carrying amounts of CGUs grouped by operating and geographical segment are presented below:
(Ek) 31.12.2014 31.12.2013 Change
HMSHost North America 421,720 373,486 48,234
HMSHost International 58,641 54,056 4,585
Italy 83,631 83,631 -
Switzerland 121,260 118,772 2,488
Belgium 47,136 47,136 -
France 65,280 65,280 -
Other 6,876 6,876 -
Total 804,544 749,237 55,307

Autogrill Group
84
2. Consolidated financial statem
ents
The increase is due entirely to exchange rate differences.
The recoverability of the goodwill allocated to each CGU is tested by estimating their value in use, defined as the present value of estimated future cash flows discounted at a rate differentiated by geographical area reflecting the specific risks of the individual CGUs at the measurement date.
The discount rate was set in consideration of the capital assets pricing model, which is based, as far as possible, on indicators and variables that can be observed from the market.
Future cash flows have been estimated on the basis of the 2015 budget and forecasts for 2016-2019 (explicit forecast period). Cash flows beyond 2019 have been projected by extrapolating information from those forecasts and applying nominal growth rates (“g”), which do not exceed the long-term growth estimates of each CGU’s sector and country of operation (consistently with medium- to long-term inflation forecasts by the International Monetary Fund), and by using the perpetuity method to calculate terminal value.
Below are the main assumptions used for impairment testing. The discount rate has changed since the previous year, to reflect the different market conditions at 31 December 2014:
Forecast nominal growth rate “g”
Discount rate 2014 post tax
Discount rate 2013 post tax
HMSHost North America 2.0% 6.93% 5.40%
HMSHost International 2.5% 7.73% 6.63%
Italy 1.0% 7.24% 7.52%
Switzerland 1.0% 5.15% 4.37%
Belgium 1.0% 6.09% 5.62%
France 1.0% 6.06% 5.44%
Other 1.0% 5.66%-7.08% 4.96%-7.71%
To estimate cash flows for the period 2015-2019, management has made several assumptions, most importantly of air and motorway traffic volumes, future sales, operating costs, investments, and changes in working capital.
The principal assumptions used to estimate cash flows are broken down below by operating segment:• HMSHost North America: for the years covered by the plan (2015-2019), average annual sales are expected to rise faster than in Europe, driven by projected traffic growth in the airport channel (based on estimates by the Federal Aviation Administration). The renewal rate of existing contracts was estimated on the basis of historical trends. The total incidence of operating costs is expected to decrease slightly due to the positive effect of operating leverage.• HMSHost International: with internal forecasts the Group plans to grow substantially in markets offering faster growth and higher margins, such as Asia, the Middle East and Northern Europe (UK and Scandinavia), than the average of the markets in which the Group operates.

2014 Annual Report
85
2.2
Not
es to
the
cons
olid
ated
fina
ncia
l sta
tem
ents
• Italy: internal forecasts suggest a slight increase in motorway traffic for 2015 and subsequent years. The selective strategy with regard to investments is reflected in the lower expected renewal rate for expiring concessions with respect to historical trends. The reduced sphere of activity due to the assumed decrease in the number of renewals is offset by an expected improvement in the performance of locations whose contracts are renewed, as a result of renovation work. Operating costs, in particular rent, as a percentage of revenue have been revised in accordance with the expiration of leases and concession contracts, reflecting the contractual conditions that management expects will result from their renewal. • Other European countries: revenue projections are based on internally developed motorway traffic and airport traffic assumptions that differ from country to country. The total weight of location operating expense is expected to decrease thanks to the cost-cutting measures undertaken.
For all CGUs, growth investments are correlated with the expiration of contracts, while maintenance investments are assumed to be consistent with historical trends.
On the basis of these assumptions, the amount of goodwill attributed to each CGU was found to be fully recoverable.
The following table shows the levels at which, for the most significant assumptions used in the impairment tests and the most important CGUs, there would no longer be a gap between the CGU’s value in use and its carrying amount.
Discount rate net of taxes g
HMSHost North America 13.7% (12.3%)
HMSHost International 32.7% n,d,
Italy 14.9% (15.9%)
Switzerland 6.3% (0.6%)
Belgium 7.6% (1.2%)
France 9.9% (5.0%)
Additional steps included:• a sensitivity analysis, considering specific risk factors inherent to the plans;• a comparison between the CGUs’ value in use for 2014 and 2013 with gap analysis;• an analysis of reasonableness between total Group value in use and stock market capitalization.
These steps confirmed that goodwill is fully recoverable and that the assumptions used are reasonable.

Autogrill Group
86
2. Consolidated financial statem
ents
IX. Other intangible assets
The following tables show movements in “Other intangible assets” at December 2014 and 2013.
Intangible assets (Ek)
31.12.2013 Change in gross carrying amount Change in gross carrying amount Amortization/Impairment losses 31.12.2014
Gross carrying amount
Accumulated amort. and
impair. lossesCarrying
amount
Change in consolidation
scopeExchange rate gains (losses) Increases Decreases
Other movements Total
Change in consolidation
scopeExchange rate gains (losses)
Increases
DecreasesOther
movements TotalGross carrying
amount
Accumulated amort. and
impair. losses
Carrying
amountAmort. Imp. losses
Concessions, licenses, trademarks and similar rights 145,927 (100,515) 45,412 (1) 4,237 6,959 (1,713) (355) 9,127 1 (2,768) (10,611) - 1,564 1,071 (10,743) 155,054 (111,258) 43,796
Assets under development and payments on account 4,480 - 4,480 - - 8,458 (18) (4,023) 4,417 - - - - - - - 8,897 - 8,897
Other 64,392 (52,468) 11,924 (17) 33 562 (100) 3,656 4,134 17 (33) (5,073) - 95 (5) (4,999) 68,526 (57,467) 11,059
Total 214,799 (152,983) 61,816 (18) 4,270 15,979 (1,831) (722) 17,678 18 (2,801) (15,684) - 1,659 1,066 (15,742) 232,477 (168,725) 63,752
31.12.2012 Change in gross carrying amount Change in gross carrying amount Amortization/Impairment losses 31.12.2013
Gross carrying amount
Accumulated amort. and
impair. lossesCarrying
amount
Change in consolidation
scopeExchange rate gains (losses) Increases Decreases
Other movements Demerger Total
Exchange rate gains (losses)
Increases
DecreasesOther
movements Demerger TotalGross carrying
amount
Accumulated amort. and
impair. losses
Carrying
amountIntangible assets (Ek) Amort. Imp. losses
Concessions, licenses, trademarks and similar rights 136,124 (96,649) 39,475 10,245 (3,868) 5,213 (6,965) 5,178 9,803 2,939 (10,919) (2,279) 6,965 (572) (3,866) 145,927 (100,515) 45,412
Assets under development and payments on account 7,594 - 7,594 - - 3,993 (154) (6,953) (3,114) - - - - - - 4,480 - 4,480
Other 56,633 (47,852) 8,781 - (27) 909 (53) 6,930 7,759 21 (4,690) - 53 - (4,616) 64,392 (52,468) 11,924
Discontinued Operations - demerger (Travel Retail & Duty Free) * 1,031,529 (408,655) 622,874 - (14,892) 217 (22) 239 (1,017,071) (1,031,529) 4,818 (47,129) - 22 - 450,945 408,656 - - -
Total 1,231,880 (553,156) 678,724 10,245 (18,787) 10,332 (7,194) 5,394 (1,017,071) (1,017,081) 7,778 (62,738) (2,279) 7,040 (572) 450,945 400,174 214,799 (152,983) 61,816
* Please refer to section 2.2.2 for Discontinued operations - demerger (Travel Retail & Duty Free)

2014 Annual Report
87
2.2
Not
es to
the
cons
olid
ated
fina
ncia
l sta
tem
ents
Intangible assets (Ek)
31.12.2013 Change in gross carrying amount Change in gross carrying amount Amortization/Impairment losses 31.12.2014
Gross carrying amount
Accumulated amort. and
impair. lossesCarrying
amount
Change in consolidation
scopeExchange rate gains (losses) Increases Decreases
Other movements Total
Change in consolidation
scopeExchange rate gains (losses)
Increases
DecreasesOther
movements TotalGross carrying
amount
Accumulated amort. and
impair. losses
Carrying
amountAmort. Imp. losses
Concessions, licenses, trademarks and similar rights 145,927 (100,515) 45,412 (1) 4,237 6,959 (1,713) (355) 9,127 1 (2,768) (10,611) - 1,564 1,071 (10,743) 155,054 (111,258) 43,796
Assets under development and payments on account 4,480 - 4,480 - - 8,458 (18) (4,023) 4,417 - - - - - - - 8,897 - 8,897
Other 64,392 (52,468) 11,924 (17) 33 562 (100) 3,656 4,134 17 (33) (5,073) - 95 (5) (4,999) 68,526 (57,467) 11,059
Total 214,799 (152,983) 61,816 (18) 4,270 15,979 (1,831) (722) 17,678 18 (2,801) (15,684) - 1,659 1,066 (15,742) 232,477 (168,725) 63,752
31.12.2012 Change in gross carrying amount Change in gross carrying amount Amortization/Impairment losses 31.12.2013
Gross carrying amount
Accumulated amort. and
impair. lossesCarrying
amount
Change in consolidation
scopeExchange rate gains (losses) Increases Decreases
Other movements Demerger Total
Exchange rate gains (losses)
Increases
DecreasesOther
movements Demerger TotalGross carrying
amount
Accumulated amort. and
impair. losses
Carrying
amountIntangible assets (Ek) Amort. Imp. losses
Concessions, licenses, trademarks and similar rights 136,124 (96,649) 39,475 10,245 (3,868) 5,213 (6,965) 5,178 9,803 2,939 (10,919) (2,279) 6,965 (572) (3,866) 145,927 (100,515) 45,412
Assets under development and payments on account 7,594 - 7,594 - - 3,993 (154) (6,953) (3,114) - - - - - - 4,480 - 4,480
Other 56,633 (47,852) 8,781 - (27) 909 (53) 6,930 7,759 21 (4,690) - 53 - (4,616) 64,392 (52,468) 11,924
Discontinued Operations - demerger (Travel Retail & Duty Free) * 1,031,529 (408,655) 622,874 - (14,892) 217 (22) 239 (1,017,071) (1,031,529) 4,818 (47,129) - 22 - 450,945 408,656 - - -
Total 1,231,880 (553,156) 678,724 10,245 (18,787) 10,332 (7,194) 5,394 (1,017,071) (1,017,081) 7,778 (62,738) (2,279) 7,040 (572) 450,945 400,174 214,799 (152,983) 61,816
* Please refer to section 2.2.2 for Discontinued operations - demerger (Travel Retail & Duty Free)

Autogrill Group
88
2. Consolidated financial statem
ents
Investments in 2014 came to E 15,979k, while amortization totalled E 15,684k.
All “Other intangible assets” have finite useful lives.
X. Investments
This item is mainly comprised of associates and joint ventures, measured using the equity method.
Any surplus of an investment’s carrying amount over pro rata equity represents future profitability inherent in the investment.
Using the equity method, a reversal of impairment losses of E 2,977k was recognized in the income statement under “Adjustments to the value of financial assets”.
Investments at 31 December 2014 and 31 December 2013 are detailed below:
31.12.2014
Name Registered office Country % held Currency
RevenueProfit/(loss) for the year Total assets
Total liabilities Carrying
amount (Ek)Currency/000
Dewina Host Sdn. Bhd. Kuala Lumpur Malaysia 49% MYR 23,031 892 15,907 3,766 1,393
HKSC Developments L.P. Winnipeg Canada 49% CAD 28,154 7,477 59,120 53,291 1,997
HKSC Opco L.P. Winnipeg Canada 49% CAD 67 57 232 136 33
Autogrill Middle East. LLC Abu Dhabi United Arab Emirates 49% AED 8,271 1,396 6,736 1,740 560
Caresquick N.V Antwerp Belgium 50% EUR 7,756 265 2,911 895 1,008
Other 784
Total as of 31 December 2014 5,775
31.12.2013
Name Registered office Country % held Currency
RevenueProfit/(loss) for the year Total assets
Total liabilities Carrying
amount (Ek)Currency/000
Dewina Host Sdn. Bhd. Kuala Lumpur Malaysia 49% MYR 28,289 2,261 19,358 4,613 1,161
TGIF National Airport Restaurant Joint Venture Texas USA 25% USD 2,650 82 2 (11) -
HKSC Developments L.P. Winnipeg Canada 49% CAD 47,038 (7,783) 59,791 61,593 -
HKSC Opco L.P. Winnipeg Canada 49% CAD 56 55 352 129 74
Other 425
Total as of 31 December 2013 1,660

2014 Annual Report
89
2.2
Not
es to
the
cons
olid
ated
fina
ncia
l sta
tem
ents
XI. Other financial assets
(Ek) 31.12.2014 31.12.2013 Change
Interest-bearing sums with third parties 2,563 3,016 (453)
Guarantee deposits 7,862 7,056 806
Other financial receivables from third parties 4,913 4,800 113
Other equity investments 6,643 10,292 (3,649)
Fair value of interest rate hedging derivatives - 6,348 (6,348)
Total 21,981 31,512 (9,531)
“Other financial receivables from third parties” consist primarily of amounts due from the non-controlling shareholders of some North American subsidiaries.
Because of changes made to the stock option plans (see section 2.2.13), the shares of World Duty Free S.p.A., held to service those plans, are correlated with the liability for share-based payments. Therefore, in accordance with IAS 39, the fair value gains(losses) on the investment are charged to profit or loss in an amount equal to the cost of the plan, in order to reduce the accounting mismatch with the change in the fair value of the option implicit in the stock option cost, the effects of which are recognized in the income statement.
“Other equity investments” (E 6,643k) covers the fair value of World Duty Free S.p.A. shares, calculated on the basis of market value (stock market price) at the year-end, which was E 7.965 per share. At 31 December 2014 the Group owned 833,965 such shares, down from 1,124,934 a year earlier, due to their use in the context of the exercise of Stock Option Plan 2010 by some beneficiaries.
The change in the “Fair value of interest rate hedging derivatives” with respect to 31 December 2013 reflects the early termination of such instruments, with a combined notional value of $ 75m.
Details of the derivatives outstanding at year-end are provided in section 2.2.7, “Financial risk management”.

Autogrill Group
90
2. Consolidated financial statem
ents
XII. Deferred tax assets
Deferred tax assets, shown net of offsettable deferred tax liabilities, amount to E 35,883k (E 43,596k at 31 December 2013). At 31 December 2014, “Deferred tax liabilities” not offsettable against deferred tax assets amounted to E 37,418k (E 50,795k the previous year).
Total net deferred tax liabilities at 31 December 2014, amounting to E -1,535k, are analyzed below:
31.12.2014 31.12.2013
(Ek)Temporary differences Tax effect
Temporary differences Tax effect
Trade receivables 5,469 1,504 5,183 1,426
Other receivables (36,731) (13,839) (32,557) (13,039)
Property, plant and equipment and other intangible assets (177,098) (41,548) (173,927) (38,137)
Total temporary differences on assets (208,359) (53,883) (201,301) (49,750)
Other payables (921) (15) (2,657) (639)
Defined benefit plans (99,031) (33,402) (71,896) (25,760)
Provisions for risks and charges (11,856) (5,048) (21,173) (7,485)
Other reserves and retained earnings 152,494 3,767 232,023 7,366
Total temporary differences on liabilities and equity 40,686 (34,698) 136,298 (26,518)
Net deferred tax (19,185) (23,232)
Deferred tax assets arising from tax losses 17,650 16,036
Total net deferred tax (1,535) (7,197)
The deferred tax liabilities on “Other reserves and retained earnings” refer mainly to the effect of deferred taxation on the retained earnings of subsidiaries.
Tax losses existing at 31 December 2014 on which deferred tax assets have not been recognized amount to E 120,333k. The corresponding unrecognized tax benefit would be E 35,088k.
XIII. Other receivables
Most of the other non-current receivables (E 12,651k at 31 December 2014) consist of amounts due from suppliers in relation to installments paid in advance.
(Ek) 31.12.2014 31.12.2013 Change
Advance rents and royalties 12,113 6,705 5,408
Other 538 704 (166)
Total 12,651 7,409 5,242

2014 Annual Report
91
2.2
Not
es to
the
cons
olid
ated
fina
ncia
l sta
tem
entsCurrent liabilities
XIV. Trade payables
Trade payables at 31 December 2014 came to E 406,698k, compared with E 396,205k at the end of 2013. The increase is due primarily to exchange rates, especially that of the US dollar.
XV. Tax liabilities
At E 7,779k, these increased by E 764k and refer to taxes accrued during the year net of offsettable tax. The income tax balance of the Italian companies participating in Edizione S.r.l.’s domestic tax consolidation scheme is recognized under “Other receivables” in current assets.
XVI. Other payables
(Ek) 31.12.2014 31.12.2013 Change
Personnel expense 120,813 106,559 14,254
Due to suppliers for investments 82,481 56,401 26,080
Social security and defined contribution plans 47,706 45,310 2,396
Indirect taxes 21,103 21,181 (78)
Withholding taxes 8,597 9,908 (1,311)
Other 34,661 27,531 7,130
Total 315,361 266,890 48,471
The increase in “Personnel expense” is due mostly to the unfavorable exchange rate trend, especially against the US dollar. At 31 December 2014 this item also included the liability for stock options generated by the change in stock option plans as a result of the demerger, as described in section 2.2.13.
“Due to suppliers for investments” went up because of an increase in investments and their different distribution over time in the course of the year.
The item “Other” includes amounts due to directors and statutory auditors (E 983k), as well as accrued liabilities for insurance premiums, utilities, and maintenance pertaining to 2014.
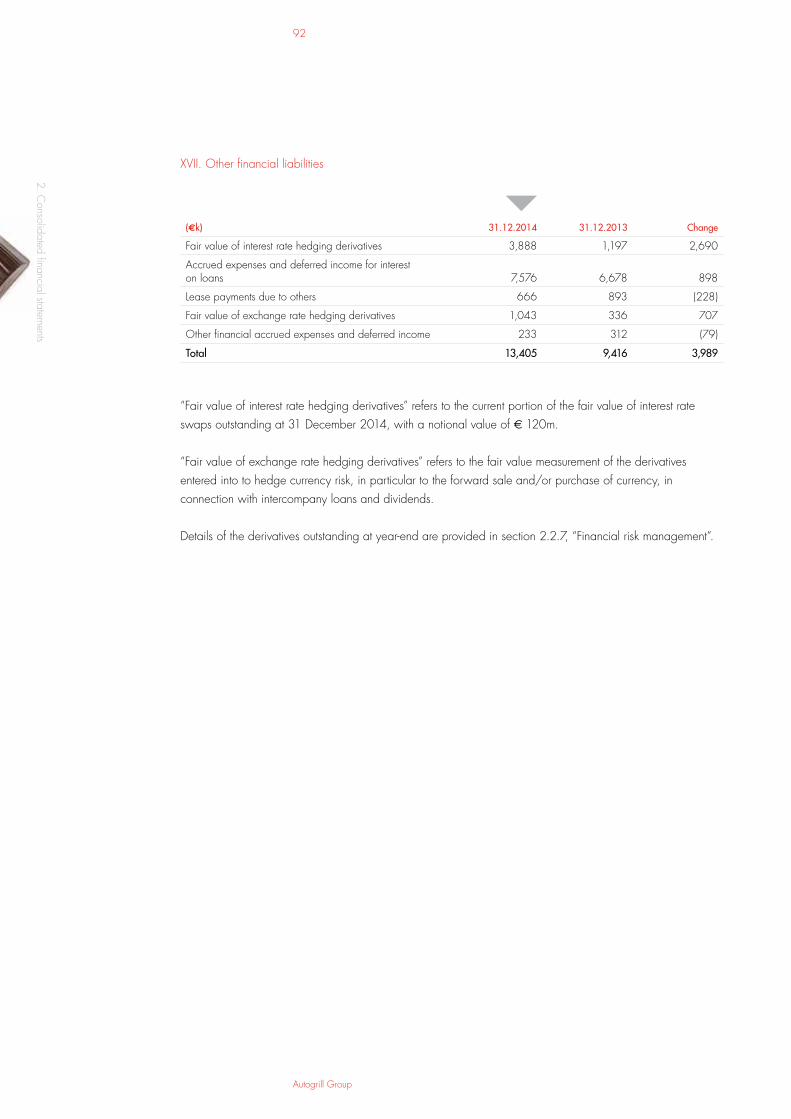
Autogrill Group
92
2. Consolidated financial statem
ents
XVII. Other financial liabilities
(Ek) 31.12.2014 31.12.2013 Change
Fair value of interest rate hedging derivatives 3,888 1,197 2,690
Accrued expenses and deferred income for interest on loans 7,576 6,678 898
Lease payments due to others 666 893 (228)
Fair value of exchange rate hedging derivatives 1,043 336 707
Other financial accrued expenses and deferred income 233 312 (79)
Total 13,405 9,416 3,989
“Fair value of interest rate hedging derivatives” refers to the current portion of the fair value of interest rate swaps outstanding at 31 December 2014, with a notional value of E 120m.
“Fair value of exchange rate hedging derivatives” refers to the fair value measurement of the derivatives entered into to hedge currency risk, in particular to the forward sale and/or purchase of currency, in connection with intercompany loans and dividends.
Details of the derivatives outstanding at year-end are provided in section 2.2.7, “Financial risk management”.

2014 Annual Report
93
2.2
Not
es to
the
cons
olid
ated
fina
ncia
l sta
tem
entsNon-current liabilities
XVIII. Other payables
These amount to E 22,997k (E 23,289k at 31 December 2013) and include mainly the liability to personnel and for defined contribution plans.
XIX. Loans
(Ek) 31.12.2014 31.12.2013 Change
Current account overdrafts 40,426 41,937 (1,511)
Unsecured bank loans (current) 96,183 76,818 19,365
Total current 136,609 118,755 17,854
Unsecured bank loans (non-current) 333,281 366,540 (33,259)
Commissions on loans (2,728) (4,262) 1,534
Total non-current 330,553 362,278 (31,725)
Total 467,162 481,033 (13,871)
In 2014 no outstanding loans were paid off and no new loans were obtained.
The breakdown of “Unsecured bank loans” at the end of 2014 and 2013 is shown below:
31.12.2014 31.12.2013
Credit lines ExpiryAmount
(Ek)Drawdowns
in Ek *
Amount (Ek)
Drawdowns in Ek *
Multicurrency Revolving Facility - Autogrill S.p.A. ** July 2016 500,000 308,571 500,000 340,167
2011 Syndicated lines 500,000 308,571 500,000 340,167
Revolving facility Agreement - HMSHost Corporation *** March 2016 205,914 24,710 217,533 26,373
2013 Line 205,914 24,710 217,533 26,373
Total 705,914 333,281 717,533 366,541
Current portion 20,591 - 36,256 -
Total lines of credit net of current portion 685,323 333,281 681,277 366,541
* Drawdowns in currency are measured based on exchange rates at 31 December 2014 and 31 December 2013** Starting from October 2013, the line can not be drawn down by HMSHost Corporation and Host International Inc., as originally agreed*** Original line of $ 300m, reduced to $ 250m, as originally agreed

Autogrill Group
94
2. Consolidated financial statem
ents
At 31 December 2014, the credit facilities granted to the Group had been drawn down by about 49%.
The contract for the credit facility of E 500m requires the Group to uphold certain financial ratios: a leverage ratio (net debt/EBITDA) of 3.5 or less and an interest coverage ratio (EBITDA/net financial expense) of at least 4.5, referring to the Group as a whole.
The loan contract signed by HMSHost Corporation for $ 300m (reduced to $ 250m as stated in the contract) requires the maintenance of a leverage ratio (gross debt/EBITDA) of 3.5 or less and interest coverage ratio (EBITDA/net financial expense) of at least 4.5, referring solely to the companies headed up by HMSHost Corporation.
For the calculation of these ratios, net and gross debt, EBITDA and financial charges are measured according to contractual definitions and therefore differ from the amounts valid for financial reporting purposes. Thus, the final ratios are not readily apparent from the financial statements.
At 31 December 2014 all of the above covenants were amply satisfied.
On 6 March 2015, the subsidiary HMSHost Corporation extended the maturity of its $ 250m credit line from 22 March 2016, as originally agreed, to 6 March 2020.
On 12 March 2015, Autogrill S.p.A. contracted a new loan in the amount of E 600m. This is comprised of an amortizing term loan of E 200m and a revolving credit facility of E 400m, both maturing in March 2020. It will be used for the early reimbursement of the revolving credit facilities maturing in July 2016 and to finance the Group’s operations.
XX. Other financial liabilities
(Ek) 31.12.2014 31.12.2013 Change
Lease payments due to others 5,630 10,149 (4,519)
Liabilities due to others 289 283 6
Fair value of interest rate hedging derivatives 434 7,775 (7,341)
Total 6,353 18,207 (11,854)
“Fair value of interest rate hedging derivatives” refers to the non-current portion of interest rate swaps outstanding at 31 December 2014, with a notional value of $ 100m.
The change in value reflects the reclassification from non-current to current of interest rate swaps expiring in 2015, for a notional value of E 120m, as well as the trend in interest rates net of payments made.

2014 Annual Report
95
2.2
Not
es to
the
cons
olid
ated
fina
ncia
l sta
tem
ents
Details of the derivatives outstanding at year-end are provided in section 2.2.7, “Financial risk management”.
XXI. Bonds
(Ek) 31.12.2014 31.12.2013 Change
Bonds 418,006 369,911 48,095
Commissions on bond issues (2,206) (2,205) (1)
Total non-current 415,800 367,706 48,094
“Bonds” refer to private placements issued by HMSHost Corporation:• in May 2007, for a total of $ 150m, maturing in May 2017 and paying interest half-yearly at a fixed annual rate of 5.73%. Exposure to fair value fluctuations was partially hedged by interest rate swaps with a notional value of $ 75m, which were terminated early in December 2014. For this private placement, the fixed interest rate coupons may be adjusted depending on the trend in the leverage ratio of the Group headed up by HMSHost Corporation; • in January 2013, for a total of $ 150m, maturing in January 2023 and paying interest half-yearly at a fixed annual rate of 5.12%; • in March 2013, for a total of $ 200m, paying interest half-yearly and split into tranches as summarized in the table below:
Nominal amount ($m) Issue date Annual fixed rate Expiry
25 March 2013 4.75% September 2020
40 March 2013 4.97% September 2021
80 March 2013 5.40% September 2024
55 March 2013 5.45% September 2025
On the whole, at 31 December 2014 this item amounted to E 415.8m, compared with E 367.7m at the end of 2013. The change is due mostly to the translation effect (E 49.8m) and the change in the fair value of hedging instruments.
At 31 December 2014, the amount of the bond issued in 2007 reflects a fair value change of E 6m ($ 7.3m), recognized in relation to the outstanding fair value hedge and referring to interest rate swaps that were terminated ahead of their maturity in December 2014. The difference generated by the early termination has been recognized in the income statement using the amortized cost method and at 31 December 2014 amounted to a positive E 0.16m ($ 0.2m).

Autogrill Group
96
2. Consolidated financial statem
ents
In December 2014, new interest rate swaps were negotiated on some of the bonds issued in 2013, for a notional value of $ 100m. At 31 December 2014 there was a loss on the hedged item of E 0.37m ($ 0.45m) and a profit of a similar amount on the hedge, so the effect on the income statement was practically nil.
The fair value of the outstanding bonds is measured using valuation techniques based on parameters other than prices that can be observed in the open market. They can therefore be classified in level 2 of the fair value hierarchy (as defined by IFRS 7), with no change on the previous year.
The bond regulations require the Group to uphold certain financial ratios: a leverage ratio (gross debt/EBITDA) of 3.5 or less and interest coverage ratio (EBITDA/net financial expense) of at least 4.5, calculated solely with respect to HMSHost Corporation and its subgroup. For the calculation of these ratios, gross debt, EBITDA and financial expense are measured according to contractual definitions and therefore differ from the amounts valid for financial reporting purposes or their aggregated amounts. Thus, they are not readily apparent from the financial statements.
At 31 December 2014 these contractual requirements were amply satisfied.
XXII. Defined benefit plans
At 31 December 2014 this item amounted to E 101,836k (E 90,336k at the end of the previous year).
The table below shows details of employee benefits recognized as defined benefit plans. The legal obligation for Italian post-employment benefits (trattamento di fine rapporto or “TFR”) is E 59,045k, compared with E 66,046k determined on an actuarial basis.
(Ek) 31.12.2014 31.12.2013 Change
Defined benefit plans:
Post-employment benefit 66,046 68,528 (2,482)
Health insurance plans 247 242 5
Other defined benefit plans 35,543 21,566 13,977
Total 101,836 90,336 11,500

2014 Annual Report
97
2.2
Not
es to
the
cons
olid
ated
fina
ncia
l sta
tem
ents
The following is a reconciliation of the present value of the obligation and the fair value of assets against the liability recognized at 31 December 2014:
(Ek) 31.12.2014 31.12.2013 31.12.2012 31.12.2011
Present value of the funded plans 106,491 91,005 94,806 89,635
Fair value of the plan assets (77,263) (74,601) (73,164) (71,676)
29,228 16,404 21,642 17,959
Present value of the unfunded plans 72,608 73,932 77,589 54,281
Discontinued Operations – demerger (Travel Retail & Duty Free) *
- - 10,223 11,944
Net liabilities recognised 101,836 90,336 109,454 84,184
* Please refer to section 2.2.2 for Discontinued operations - demerger (Travel Retail & Duty Free)
The actuarial assumptions used to calculate defined benefit plans are summarized in the following table:
Italy Switzerland The Netherlands Other plans
2014 2013 2014 2013 2014 2013 2014 2013
Discount rate 0.9% 2.5% 1.1% 2.6% 2.4% 3.7% 1.3%–2.2% 2.5%–3.3%
Inflation rate 2.0% 2.0% 1.8% 2.0% - - 2.0% 2.0%
Yield on assets - - 3.0% 3.9% 3.0% 3.7% - -
Salary increase rate - - 1.0% 1.0% 1.0% 1.8% 1.0%–2.5% 2.0%–2.5%
Pension increase rate 3.0% 3.0% - - - 2.0% - -
Increase in healthcare costs - - - - - - 7.4% 7.7%
The discount rates were determined based on the yield of high grade corporate bonds at the reporting date.
Below are the amounts recognized in the income statement for defined benefit plans:
(Ek) 2014 2013 Change
Current service costs 1,121 1,706 (585)
Past service costs (21) (2,065) 2,044
Net interest expense 2,284 2,547 (263)
Total 3,384 2,188 1,196

Autogrill Group
98
2. Consolidated financial statem
ents
Net interest expense is recognized under “Financial expense” net of interest income on plan assets, while the post-employment benefit cost is recognized under “Personnel expense”.
Movements in the present value of post-employment benefit obligations are as follows:
(Ek) Italy SwitzerlandThe
Netherlands Other PlansTotal Food
& BeverageTravel Retail
& Duty Free * Total
Present value of the obligation at 31.12.2012 72,615 75,786 19,020 4,974 172,395 151,009 323,404
Current service costs - 1,166 187 353 1,706 101 1,807
Past service cost - (2,046) - (19) (2,065) - (2,065)
Interest expense 1,907 1,740 788 205 4,640 3,205 7,845
Actuarial losses (gains) due to:
- demographic assumptions - - 5 (22) (17) - (17)
- financial assumptions 349 (1,306) 2,087 980 2,109 2,350 4,459
- experience adjustments (674) (711) - (241) (1,626) - (1,626)
Employees' share of contributions - 2,452 - 59 2,511 53 2,564
Benefit paid (5,028) (6,329) (577) (561) (12,494) (2,781) (15,275)
Exchange rate losses/(gains) - (1,257) - (13) (1,270) (3,535) (4,805)
Other (640) - - (312) (952) - (952)
Effect of demerger - - - - - (150,403) (150,403)
Present value of the obligation at 31.12.2013 68,528 69,495 21,510 5,403 164,936 - 164,936
Current service costs - 996 (241) 366 1,121 - 1,121
Past service cost - - - (21) (21) - (21)
Interest expense 1,577 1,789 776 163 4,304 - 4,304
Actuarial losses (gains) due to:
- demographic assumptions - - 27 35 62 - 62
- financial assumptions 6,178 12,484 3,634 929 23,224 - 23,224
- experience adjustments 694 (1,940) (910) 2 (2,154) - (2,154)
Employees' share of contributions - 2,303 - 59 2,362 2,362
Benefit paid (10,931) (4,397) (606) (403) (16,336) - (16,336)
Exchange rate losses/(gains) - 1,570 - 30 1,601 - 1,601
Present value of the obligation at 31.12.2014 66,046 82,301 24,190 6,563 179,099 - 179,099
* Travel Retail & Duty Free figures are represented in Discontinued operations

2014 Annual Report
99
2.2
Not
es to
the
cons
olid
ated
fina
ncia
l sta
tem
ents
This table shows movements in the present value of plan assets:
(Ek) Italy SwitzerlandThe
Netherlands Other PlansTotal Food
& BeverageTravel Retail
& Duty Free * Total
Fair value of the assets at 31.12.2012 - 54,326 18,838 - 73,164 140,787 213,950
Interest income - 1,304 789 - 2,093 3,022 5,115
Estimated yield on plan assets, except interest income - (85) 1,677 - 1,592 7,963 9,555
Employees' share of contributions - 2,452 - - 2,452 53 2,504
Group's share of contributions - 2,570 597 - 3,167 9,989 13,156
Benefits paid - (6,329) (577) - (6,906) (2,192) (9,098)
Exchange rate gains/(losses) - (899) - - (899) (3,310) (4,209)
Other - - (61) - (61) (14,112) (14,173)
Effect of demerger - - - - - (142,199) (142,199)
Fair value of the assets at 31.12.2013 - 53,338 21,263 - 74,601 - 74,601
Interest income - 1,427 593 - 2,020 - 2,020
Estimated yield on plan assets, except interest income - 777 (1,421) - (644) - (644)
Employees' share of contributions - 2,303 - - 2,303 - 2,303
Group's share of contributions - 2,602 239 - 2,841 - 2,841
Benefits paid - (4,397) (606) - (5,003) - (5,003)
Exchange rate gains/(losses) - 1,144 - - 1,144 - 1,144
Fair value of the assets at 31.12.2014 - 57,195 20,068 - 77,263 - 77,263
* Travel Retail & Duty Free figures are represented in Discontinued operations
The main categories of plan assets are:
Switzerland The Netherlands
Cash and cash equivalents 10.7% -
Equity instruments 22.9% -
Bonds 41.0% -
Real estate 22.2% -
Other securities 3.2% 100.0%

Autogrill Group
100
2. Consolidated financial statem
ents
Equity instruments and bonds have official market prices.
The occurrence of reasonably possible variations in actuarial assumptions at the year-end would have affected the defined benefit obligation as quantified in the table below.
Italy Switzerland The Netherlands Other plans
(Ek) Increase Decrease Change Increase Decrease Change Increase Decrease Change Increase Decrease Change
Discount rate (1,292) 1,340 0.25% (2,724) 2,806 0.25% (1,073) 1,148 0.25% (339) 373 0.5%
Salary increase rate - - - 317 n.a. 0.25% - - - 365 (335) 0.5%
Pension increase rate - - - - - - 1,742 (1,540) 0.50% - - -
Inflation rate 820 (804) 0.25% - - - - - - - - -
At the year-end, the weighted average duration of the defined benefit obligation was 12.2 years for 2014 and 11.7 years for 2013.
XXIII. Provisions for risks and charges
The change is due to normal allocations and utilizations for the year, and to the release of provisions as described below.
(Ek) 31.12.2013
Other movements
and exchange
rate Allocations Reversals Utilizations 31.12.2014
Provision for taxes 3,486 275 393 (1,403) - 2,752
Other provisions 7,878 (5,381) 6,446 (30) - 8,913
Provision for legal disputes 1,762 55 85 (201) (1,495) 206
Provision for the refurbishment of third party assets 417 - 7 (3) (421) -
Onerous contracts provision 6 - - (2) - 4
Total provisions for current risks and charges 13,549 (5,051) 6,931 (1,639) (1,915) 11,875
Provision for taxes 150 42 - (60) - 132
Other provisions 22,301 8,237 522 (1,246) (8,316) 21,498
Provision for legal disputes 4,206 - 1,385 (163) (1,657) 3,770
Provision for the refurbishment of third party assets 5,692 116 309 - - 6,117
Onerous contracts provision 3,469 171 1,477 (2,418) (602) 2,097
Total provisions for non-current risks and charges 35,818 8,565 3,694 (3,887) (10,575) 33,614

2014 Annual Report
101
2.2
Not
es to
the
cons
olid
ated
fina
ncia
l sta
tem
ents
(Ek) 31.12.2012
Other movements
and exchange
rate Allocations Reversals Utilizations Demerger 31.12.2013
Provision for taxes 3,154 121 361 - (150) - 3,486
Other provisions 8,248 (3,344) 10,144 - (7,170) - 7,878
Provision for legal disputes 382 (63) 1,715 (105) (168) - 1,762
Provision for the refurbishment of third party assets - 337 80 - - - 417
Onerous contracts provision 221 (1) - (214) - - 6
Discontinued Operations – demerger (Travel Retail & Duty Free) * 12,403 (905) - - - (11,498) -
Total provisions for current risks and charges 24,408 (3,854) 12,300 (319) (7,488) (11,498) 13,549
Provision for taxes 390 - - (150) (90) - 150
Other provisions 21,181 2,655 1,436 (629) (2,341) - 22,301
Provision for legal disputes 3,454 - 2,010 (98) (1,161) - 4,206
Provision for the refurbishment of third party assets 5,863 (435) 300 - (36) - 5,692
Onerous contracts provision 6,571 (1,020) 280 (842) (1,520) - 3,469
Discontinued Operations – demerger (Travel Retail & Duty Free) * 6,854 6 - - - (6,860) -
Total provisions for non-current risks and charges 44,313 1,206 4,026 (1,719) (5,148) (6,860) 35,818
* Please refer to section 2.2.2 for Discontinued operations - demerger (Travel Retail & Duty Free)
Provision for taxesThe current portion relates primarily to disputes over US companies’ direct and indirect tax obligations.
Other provisionsThese refer almost entirely to a United States “self-insurance” provision covering the deductibles on third-party liability contained in insurance plans. In 2014, E 6,446k was accrued to this provision and E 7,884k was used for insurance settlements.
Provision for legal disputesThis provision covers the risk of losing lawsuits brought against Group companies, and takes account of the opinions of the Group’s legal advisors. Utilizations concern actual payments, as well as revised amounts where necessary.
Provision for the refurbishment of third party assetsThis represents estimated liabilities for ensuring that leased assets are returned in the contractually agreed condition.
Onerous contracts provisionThis refers to long-term leases or concession agreements on commercial units that are not profitable enough to cover the rent.

Autogrill Group
102
2. Consolidated financial statem
ents
XXIV. Equity
Movements in equity items during the year are detailed in a separate schedule.
Share capitalAt 31 December 2014 the share capital of Autogrill S.p.A., fully subscribed and paid in, amounts to E 68,688k and consists of 254,400,000 ordinary shares.
On 6 June 2013, the shareholders’ meeting of Autogrill S.p.A. approved a change to art. 5 (“Share capital”) of the company’s by-laws which eliminates the nominal amount of shares.
At 31 December 2014, Schematrentaquattro S.p.A., wholly owned by Edizione S.r.l., held 50.1% of the share capital.
Legal reserveThe “Legal reserve” (E 13,738k) is the portion of Autogrill S.p.A.’s profits that cannot be paid out as dividends, in accordance with art. 2430 of the Italian Civil Code.
Hedging reserveThe “Hedging reserve,” amounting to E -1,921k (E -5,581k at 31 December 2013), corresponds to the effective portion of the fair value of derivatives designated as cash flow hedges. The increase of E 3,660k relates to the fair value change of derivatives designated as cash flow hedges (E +5,048k), net of the tax effect (E -1,388k).
Translation reserveTranslation differences are generated by the translation into euros of the foreign currency financial statements of companies consolidated on a line-by-line basis or using the equity method, net of the fair value of instruments designated as net investment hedges. Of the increase, E 31,192k concerns exchange rate gains from the translation of financial statements in foreign currencies, partially offset by the portion of comprehensive income for investments measured using the equity method (E 172k) and by the change in the fair value of instruments designated as net investment hedges, net of the tax effect (E 742k).
Other reserves and retained earningsThese include the profits of subsidiaries not distributed as dividends and the amount set aside in connection with the recognized costs of the stock option plans.
In accordance with IAS 19 revised, other reserves and retained earnings also include unrealized actuarial gains and losses (net of the tax effect) arising from the remeasurement defined benefit plan assets and liabilities.
The decrease in this item was caused primarily by the change in the actuarial gains/losses of defined benefit plans net of the tax effect (E 16,524k) and by the allocation to reserves of the 2013 profit on the basis of the shareholders’ resolution of 28 May 2014, partially offset by the change caused by the stock option plans with regard to share-based payments (E 124k).

2014 Annual Report
103
2.2
Not
es to
the
cons
olid
ated
fina
ncia
l sta
tem
ents
Treasury sharesThe annual general meeting of 28 May 2014, after revoking the authorization granted on 6 June 2013 and pursuant to arts. 2357 et seq. of the Italian Civil Code, authorized the purchase and subsequent disposal of ordinary shares up to a maximum of 12,720,000 shares.
At 31 December 2014, the parent owned 870,798 treasury shares (1,004,934 at the end of 2013) with a carrying amount of E 3,450k and an average carrying amount of E 3.96 per share. The reduction in the number of treasury shares is due to the exercise of options by various beneficiaries under the 2010 Stock Option Plan.
Other than the above, no additional treasury shares were purchased or disposed of in 2014.
Non-controlling interestsNon-controlling interests amount to E 32,125k, compared with E 31,175k at 31 December 2013. Most of the increase is due to the profit for the year (E 11,871k) and capital injections (E 7,537k), net of dividends paid (E 21,294k).
Other comprehensive incomeThe following table shows the components of comprehensive income and the relative tax effect:
2014
(Ek) Gross amountTax benefit/
(expense) Net amount
Actuarial gains/(losses) on defined benefit plans (21,777) 5,239 (16,538)
Other consolidated comprehensive income items that will not be reclassified to profit or loss (21,777) 5,239 (16,538)
Effective portion of the fair value change in cash flow hedges 5,048 (1,388) 3,660
Equity-accounted investees - share of other comprehensive income (172) - (172)
Fair value gain(loss) on available-for-sale financial assets (842) 159 (683)
Foreign currency translation differences from foreign operations 33,819 - 33,819
Gains (losses) on net investment hedges (1,024) 282 (742)
Other consolidated comprehensive income items that will be reclassified to profit or loss 36,829 (948) 35,882
Total other consolidated comprehensive income 15,052 4,292 19,344

Autogrill Group
104
2. Consolidated financial statem
ents
(Ek)
2013
Food & Beverage Travel Retail & Duty Free
TotalGross
amountTax benefit/
(expense) Net amountGross
amountTax benefit/
(expense) Net amount
Actuarial gains/(losses) on defined benefit plans 1,098 (692) 405 (8,506) 1,619 (6,887) (6,481)
Other consolidated comprehensive income items that will not be reclassified to profit or loss 1,098 (692) 405 (8,506) 1,619 (6,887) (6,481)
Effective portion of fair value change in cash flow hedges 3,654 (1,005) 2,649 3,178 (953) 2,225 4,874
Net change in fair value of cash flow hedges reclassified to profit or loss 4,490 (1,235) 3,255 - - - 3,255
Equity – accounted investees – share of other comprehensive income (163) - (163) - - - (163)
Fair value gain(loss) on available-for-sale financial assets 262 - 262 - - - 262
Foreign currency translation differences from foreign operations (24,646) - (24,646) (19,069) - (19,069) (43,715)
Gains (losses) on net investment hedges 826 (227) 599 7,035 (2,110) 4,924 5,523
Other consolidated comprehensive income items that will be reclassified to profit or loss (15,577) (2,467) (18,044) (8,856) (3,064) (11,920) (29,964)
Total other consolidated comprehensive income (14,479) (3,159) (17,638) (17,362) (1,444) (18,807) (36,445)

2014 Annual Report
105
2.2
Not
es to
the
cons
olid
ated
fina
ncia
l sta
tem
ents2.2.5 Notes to the income statement
Comments on the items making up the income statement are provided below.
XXV. Revenue
Revenue for 2014 was made up as follows:
(Ek) 2014 2013 Change
Food & Beverage sales 3,930,218 3,885,807 44,411
Oil sales 531,248 561,101 (29,853)
Retail US sales - 99,014 (99,014)
Total 4,461,466 4,545,922 (84,456)
The sale of fuel takes place mainly at rest stops in Italy and Switzerland.
For details of revenue by segment, see section 2.2.9 (Segment reporting) and the Directors’ report.
XXVI. Other operating income
(Ek) 2014 2013 Change
Bonuses from suppliers 47,609 51,527 (3,918)
Income from business leases 7,867 8,590 (723)
Affiliation fees 2,661 2,662 (1)
Gains on sales of property, plant and equipment 3,487 2,706 781
Other revenue 47,229 62,482 (15,253)
Total 108,853 127,967 (19,114)
“Other revenue” includes E 23.5m (E 24.5m the previous year) in commissions for the sale of goods and services for which the Group acts as an agent.
Most of the change on the previous year relates to the inclusion only in 2013 of non-recurring income from having waived the right of pre-emption on the renewal of expiring subconcessions in Italy (E 13.8m).

Autogrill Group
106
2. Consolidated financial statem
ents
XXVII. Raw materials, supplies and goods
(Ek) 2014 2013 Change
Purchases 1,827,797 1,870,832 (43,035)
Change in inventories (14,164) 3,271 (17,435)
Total 1,813,633 1,874,103 (60,470)
This item decreased mainly in correlation with the decline in revenue.
XXVIII. Personnel expense
(Ek) 2014 2013 Change
Wages and salaries 1,003,311 1,025,120 (21,809)
Social security contributions 183,879 188,456 (4,577)
Employee benefits 27,006 26,058 948
Other costs 82,422 78,556 3,866
Total 1,296,618 1,318,190 (21,572)
“Other costs” include the portion of the stock option plans pertaining to the year (E 796k) and fees paid to members of the Board of Directors, as detailed in Section 2.2.13 below.
The average headcount, expressed in terms of equivalent full-time employees, was 40,128 (41,646 the previous year).
The decrease in personnel expense is due mainly to the reduction in staff as a result of the smaller number of locations operated.
XXIX. Leases, rentals, concessions and royalties
(Ek) 2014 2013 Change
Leases, rentals and concessions 580,223 593,016 (12,793)
Royalties 88,243 84,391 3,852
Total 668,466 677,407 (8,941)
Most of the change in this item reflects the lower number of locations operated in Italy, due to the lapse of 19 rest area contracts, and the Group’s departure from unprofitable locations at airports, high streets and trade fairs.

2014 Annual Report
107
2.2
Not
es to
the
cons
olid
ated
fina
ncia
l sta
tem
ents
XXX. Other operating expense
(Ek) 2014 2013 Change
Utilities 92,098 95,410 (3,312)
Maintenance 73,915 74,932 (1,017)
Cleaning and disinfestations 49,638 49,484 153
Consulting and professional services 33,961 36,964 (3,003)
Commissions on credit card payments 37,151 36,408 743
Storage and transport 15,669 16,138 (470)
Advertising 12,771 13,702 (931)
Travel expenses 22,743 23,811 (1,068)
Telephone and postal charges 17,077 15,769 1,308
Equipment hire and lease 7,532 8,018 (485)
Insurance 4,675 4,622 52
Surveillance 3,327 3,953 (626)
Transport of valuables 5,062 5,282 (219)
Banking services 4,689 4,567 122
Sundry materials 31,317 30,518 799
Other services 28,566 22,833 5,733
Costs for materials and services 440,192 442,411 (2,219)
Impairment losses on receivables 370 1,283 (913)
For taxes 282 212 71
For legal disputes 1,106 3,522 (2,416)
For onerous contracts (943) (776) (167)
For other risks 5,692 10,951 (5,259)
Provisions for risks 6,138 13,909 (7,771)
Indirect and local taxes 20,823 24,095 (3,272)
Other operating expense 7,841 8,470 (629)
Total 475,363 490,168 (14,804)
“Sundry materials” refer to the purchase of inexpensive equipment and to various consumables such as uniforms, office supplies, and advertising materials.
“Consulting and professional services” were received primarily in Italy and the United States.
The item “Other services” includes miscellaneous items such as medical check-ups, public relations, general services, and personnel recruitment and training.

Autogrill Group
108
2. Consolidated financial statem
ents
XXXI. Depreciation, amortization and impairment losses
In detail by type of assets:
(Ek) 2014 2013 Change
Other intangible assets 15,684 15,609 75
Property, plant and equipment 149,558 159,780 (10,222)
Assets to be transferred free of charge 22,223 34,710 (12,487)
Total 187,465 210,099 (22,634)
Impairment losses (net of reversals) were recognized in the amount of E 10,134k, following tests of the recoverability of carrying amounts on the basis of the projected cash flows of each cash generating unit.
The following table provides a breakdown by type of assets:
(Ek) 2014 2013 Change
Other intangible assets - 2,279 (2,279)
Property, plant and equipment 5,830 6,917 (1,087)
Assets to be transferred free of charge 4,304 6,458 (2,154)
Total 10,134 15,654 (5,520)
See notes VII, VIII and IX for details of the assumptions and criteria used to measure impairment.
XXXII. Financial income and expense
(Ek) 2014 2013 Change
Interest income 1,116 933 183
Interest differential on exchange rate hedges 74 215 (141)
Ineffective portion of hedging instruments 111 - 111
Other financial income 802 80 722
Total financial income 2,103 1,228 875

2014 Annual Report
109
2.2
Not
es to
the
cons
olid
ated
fina
ncia
l sta
tem
ents
(Ek) 2014 2013 Change
Interest expense 37,055 44,049 (6,994)
Discounting of long-term liabilities 2,451 2,808 (357)
Exchange rate losses 2,411 723 1,688
Fees paid on loans and bonds 144 1,602 (1,458)
Ineffective portion of hedging instruments - 23 (23)
Other financial expense 4,435 2,494 1,941
Total financial expense 46,496 51,699 (5,203)
Total net financial expense (44,393) (50,471) 6,078
The change in interest expense reflects the decrease in debt and the fact that the 2013 figure included the impact of using the amortized cost method to account for the early termination of interest rate hedging contracts during the Group’s refinancing in July 2011.
XXXIII. Income tax
The balance of E 40,244k (E 27,065k in 2013) includes E 35,523k in current taxes (E 21,175k the previous year) and E 3,425k in net deferred tax assets (net deferred tax assets of E 1,496k in 2013).
IRAP, which is charged on Italian operations and whose basis is essentially operating profit plus personnel expense, came to E 6,297k (E 7,387k the previous year).
CVAE, charged on French operations and calculated on the basis of revenue and value added, amounted to E 1,849k (E 1,830k in 2013).
Excluding IRAP and French CVAE, the actual average tax rate was 41.6%, compared with 50.4% in 2013.
Below is a reconciliation between the tax charge recognized in the consolidated financial statements and the theoretical tax charge. The latter was determined by applying the theoretical tax rate to the gross income earned in each jurisdiction, including additional taxes on future profit distributions by subsidiaries.
(Ek) 2014 % 2013 %
Theoretical income tax 34,427 44.6 20,594 58.2
Reduced tax due to the direct taxation of minority partners in fully consolidated US joint ventures (4,252) (3,415)
Net effect of unrecognised tax losses, of utilization of unrecognised prior-year tax losses and the revision of estimates on the taxability/deductibility of temporary differences 6,838 6,049
Other permanent differences (4,915) (5,380)
Income tax, excluding IRAP and CVAE 32,098 41.6 17,848 50.4
IRAP and CVAE 8,146 9,217
Recognised income tax 40,244 52.1 27,065 76.5

Autogrill Group
110
2. Consolidated financial statem
ents
XXXIV. Profit from discontinued operations (net of tax effects)
This item, listed for 2013 only in the amount of E 91,056k, refers to the net profit of the Travel Retail & Duty Free business for the first nine months of 2013 (i.e. until the effective date of the demerger). See section 2.2.2 for details of the individual items.
XXXV. Basic and diluted earnings per share
Basic earnings per share is calculated as the profit for the year attributable to owners of the parent divided by the weighted average number of ordinary Autogrill S.p.A. shares outstanding during the year; treasury shares held by the Group are therefore excluded from the denominator.
Diluted earnings per share takes account of dilutive potential shares deriving from stock option plans when determining the number of shares outstanding.
Below is the calculation of basic earnings per share:
2014 2013
Profit/(loss) for the year attributable to owners of the parent (Ek) 25,107 87,859
Weighted average no. of outstanding shares (no./000) 253,469 253,395
Basic earning per share (E/cent.) 9.9 34.7
2014 2013
Profit/(loss) for the year attributable to owners of the parent (Ek) 25,107 87,859
Weighted average no. of outstanding shares (no./000) 253,469 253,395
Weighted average no. of shares included in stock option plans (no./000) 290 204
Weighted average no. of ordinary shares outstanding, after dilution (no./000) 253,759 253,599
Diluted earning per share (E/cent.) 9.9 34.6
2014 2013
Profit/(loss) for the year from continuing operations attributable to owners of the parent (Ek)
25,107 (1,481)
Weighted average no. of outstanding shares (no./000) 253,469 253,395
Basic earning per share from continuing operations (E/cent.) 9.9 (0.6)
2014 2013
Profit/(loss) for the year from continuing operations attributable to owners of the parent (Ek)
25,107 (1,481)
Weighted average no. of outstanding shares (no./000) 253,469 253,395
Weighted average no. of outstanding shares included in stock option plans (no./000)
290 204
Weighted average no. of ordinary shares outstanding, after dilution (no./000) 253,759 253,599
Diluted earning per share from continuing operations (E/cent.) 9.9 (0.6)

2014 Annual Report
111
2.2
Not
es to
the
cons
olid
ated
fina
ncia
l sta
tem
ents2.2.6 Net financial position
Details of the net financial position at 31 December 2014 and 31 December 2013 are as follows:
Note (Em) 31.12.2014 31.12.2013 Change
I A) Cash on hand 57.0 69.4 (12.4)
I B) Cash equivalents 126.3 102.2 24.1
C) Securities held for trading - - -
D) Cash and cash equivalents (A + B + C) 183.3 171.6 11.7
II E) Current financial assets 21.2 20.9 0.3
XIX F) Bank loans and borrowings, current (136.6) (118.8) (17.9)
XXI G) Bonds issued - - -
XVII H) Other financial liabilities (13.4) (9.4) (4.0)
I) Current financial indebtedness (F + G + H) (150.0) (128.2) (21.8)
J) Net current financial indebtedness (I + E + D) 54.5 64.3 (9.8)
XIX K) Bank loans and borrowings, net of current portion
(330.6) (362.3) 31.7
XXI L) Bonds issued (415.8) (367.7) (48.1)
XX M) Due to others (6.3) (18.2) 11.9
N) Non-current financial indebtedness (K + L + M) (752.7) (748.2) (4.4)
O) Net financial indebtedness (J + N) * (698.2) (683.8) (14.3)
XI P) Non-current financial assets 4.9 11.1 (6.2)
Net financial position - total (693.3) (672.7) (20.6)
* As defined by Consob communication 28 July 2006 and ESMA/2011/81 recommendations
For further commentary, see the notes indicated for each item. The increase is due principally to the translation into euros of debt denominated in US dollars.
At 31 December 2014 there were no financial payables or receivables with related parties, while at the end of 2013 the Group was owed $ 5.3m by World Duty Free Group US Inc. in relation to the disposal of the US Retail business.

Autogrill Group
112
2. Consolidated financial statem
ents
2.2.7 Financial instruments - fair value and risk management2.2.7.1 Fair value hierarchy
The following tables break down assets and liabilities by category at 31 December 2014 and 2013 and financial instruments measured at fair value by measurement method. The different levels are defined as follows:Level 1 - quoted prices (unadjusted) in active markets for identical assets or liabilities;Level 2 - inputs other than quoted prices included within Level 1 that are observable for the assets and liabilities either
directly (prices) or indirectly (derived from prices);Level 3 - inputs for assets and liabilities that are not based on observable market data (unobservable inputs).
31.12.2014
Carrying amount Fair value
(Ek)
Fair value - hedging
instrumentsLoans and
receivablesAvailable-
for-sale
Other financial liabilities Total Level 1 Level 2 Level 3 Total
Financial assets measured at fair value
Fair value of interest rate hedging derivatives 798 - - - 798 - 798 - 798
Fair value of exchange rate hedging derivatives 774 - - - 774 - 774 - 774
1,572 - - - 1,572
Financial assets not measured at fair value
Cash and cash equivalents - 183,241 - - 183,241
Trade receivables - 43,493 - - 43,493
Other current assets - 102,016 - - 102,016 - - - -
Other non-current assets - 12,651 - - 12,651 - - - -
Other financial assets (current) - 19,643 29 - 19,672 - - - -
Other financial assets (non-current) - 15,257 6,724 - 21,981 6,654 - - 6,654
- 376,301 6,752 - 383,053
Financial liabilities measured at fair value
Fair value of interest rate hedging derivatives 4,321 - - - 4,321 - 4,321 - 4,321
Fair value of exchange rate hedging derivatives 1,043 - - - 1,043 - 1,043 - 1,043
5,364 - - - 5,364
Financial liabilities not measured at fair value
Bank overdrafts - - - 40,427 40,427 - - -
Unsecured bank loans - - - 426,736 426,736 - 334,358 - 334,358
Finance leases - - - 6,296 6,296 - - - -
Financial liabilities due to others - - - 289 289 - - - -
Bonds - - - 415,800 415,800 - 426,686 - 426,686
Trade payables - - - 406,698 406,698 - - - -
Due to suppliers for investments - - - 82,481 82,481 - - - -
- - - 1,378,726 1,378,726

2014 Annual Report
113
2.2
Not
es to
the
cons
olid
ated
fina
ncia
l sta
tem
ents31.12.2013
Carrying amount Fair value
(Ek)
Fair value - hedging
instrumentsLoans and
receivablesAvailable-
for-sale
Other financial liabilities Total Level 1 Level 2 Level 3 Total
Financial assets measured at fair value
Fair value of interest rate hedging derivatives 7,677 - - - 7,677 - 7,677 - 7,677
Fair value of exchange rate hedging derivatives 23 - - - 23 - 23 - 23
7,700 - - - 7,700
Financial assets not measured at fair value
Cash and cash equivalents - 171,516 - - 171,516 - - -
Trade receivables - 46,371 - - 46,371 - - -
Other current assets - 114,449 - - 114,449 - - - -
Other non-current assets - 7,409 - - 7,409 - - - -
Other financial assets (current) - 19,598 - - 19,598 - - - -
Other financial assets (non-current) - 14,872 10,292 - 25,164 10,292 - - 10,292
- 374,215 10,292 - 384,507
Financial liabilities measured at fair value
Fair value of interest rate hedging derivatives 8,972 - - - 8,972 - 8,972 - 8,972
Fair value of exchange rate hedging derivatives 336 - - - 336 - 336 - 336
9,308 - - - 9,308
Financial liabilities not measured at fair value
Bank overdrafts - - - 41,937 41,937 - - -
Unsecured bank loans - - - 439,097 439,097 - 443,218 - 443,218
Finance leases - - - 11,042 11,042 - - - -
Financial liabilities due to others - - - 283 283 - - - -
Bonds - - - 367,706 367,706 - 367,505 - 367,505
Trade payables - - - 396,205 396,205 - - -
Due to suppliers for investments - - - 56,402 56,402 - - -
- - - 1,312,671 1,312,671

Autogrill Group
114
2. Consolidated financial statem
ents
Information on the fair value of assets and liabilities is not included when the carrying amount is a reasonable approximation of fair value.
In 2014 there were no transfers between different hierarchical levels.
(a) Level 1 financial instrumentsThe fair value of a financial instrument traded in an active market is based on its quoted market price at the reporting date. A market is regarded as active if quoted prices are readily and regularly available from an exchange, dealer, broker, industry Group, pricing service or regulatory agency, and those prices represent actual and regularly occurring market transactions on an arm’s length basis. The quoted market price used for the financial assets held by the Group is the current bid price.
(b) Level 2 financial instrumentsThe fair value of financial instruments not traded in an active market (for example, over-the-counter derivatives) is determined using valuation techniques that maximize the use of observable market data and rely as little as possible on entity specific estimates. If all significant inputs required to fair value of an instrument are observable, the instrument is included in level 2. If one or more of the significant inputs is not based on observable market data, the instrument is included in level 3.
For level 2, the specific valuation techniques are as follows:• the fair value of interest rate swaps has been estimated considering the present value of future cash flows based on observable yield curves. This fair value takes into account the credit risk of the counterparty determined based on observable market data. It also takes into account the credit risk of the Group, calculated on the basis of credit and other financial ratios and benchmarking. The adjustments to the aforementioned risks are considered not significant at 31 December 2014;• the fair value of loans and bonds was estimated by discounting future cash flows at a risk-free market interest rate gross of a spread determined on the basis of the Group’s credit risk, financial ratios and benchmarking.
2.2.7.2 Financial risk management
The Group is exposed to the following risks:• market risk;• credit risk;• liquidity risk.
The overall responsibility for the creation and supervision of a Group risk management system lies with Autogrill S.p.A.’s Board of Directors, which has set up the Control, Risk and Corporate Governance Committee. The committee is responsible for looking into matters concerning Autogrill’s control and risk management system and helping the Board of Directors reached informed decisions on these issues.

2014 Annual Report
115
2.2
Not
es to
the
cons
olid
ated
fina
ncia
l sta
tem
ents
The Group’s risk management policies are designed to identify and analyze the risks to which the Group is exposed, establish appropriate limits and controls, and monitor the risks and compliance with those limits. These policies and the corresponding systems are revised regularly to reflect any changes in market conditions and the Group’s operations. Through training, standards and official procedures, the Group aims to create a disciplined and constructive environment in which its employees are aware of their roles and responsibilities. The Internal Audit unit complements the Committee in its monitoring activities, conducting periodic reviews and spot checks of the controls and risk management procedures and reporting the results to the Board of Directors.
This section describes the Group’s exposure to each of the risks listed above, its risk objectives and policies, and its means of managing and assessing these risks.
Market risk
Market risk is the risk that the fair value or future cash flows from a financial instrument may fluctuate due to changes in exchange rates, interest rates or equity instrument prices. The aim of market risk management is to monitor these risks and keep them within acceptable levels, along with their potential impact on the Group’s financial position, results of operations and cash flows.
Autogrill’s financial policy places a strong emphasis on the management and control of market risk, in particular with respect to interest rates and exchange rates, given the extent of the Group’s borrowings and its international profile.
Interest rate risk
The aim of interest rate risk management is to control financial expense and its volatility. This entails, through a mix of fixed- and floating-rate liabilities, the predetermination of a portion of financial expense out to a time horizon in keeping with the structure of debt, which in turn must be in line with capital structure and future cash flows. Where it is not possible to obtain the desired risk profile in the capital markets or through banks, it is achieved by using derivatives of amounts and maturities in line with those of the liabilities to which they refer. The derivatives used are mainly interest rate swaps (IRS).
Hedging instruments are allocated to companies with significant exposure to interest rate risk where there are borrowings paying a floating rate (thus exposing the Group to higher finance costs if interest rates rise) or a fixed rate (which means that lower interest rates do not bring about a reduction in financial expense).
At 31 December 2014, the ratio of fixed-rate debt to net debt (i.e., net of financial assets, which are generally floating-rate) was 64%. The percentage of fixed-rate debt is higher when considering debt denominated in US dollars (84%) as opposed to debt in euros (38%).
Gross debt denominated in US dollars amounted to $ 621m at the end of the year, including $ 504.8m in bond issues. Part of the interest rate risk is hedged by fixed-to-floating interest rate swaps for $ 100m, classified as fair value hedges.

Autogrill Group
116
2. Consolidated financial statem
ents
When applying the policy described above, interest rate risk management instruments were accounted for as cash flow hedges in Group companies’ financial statements where they were subject to this risk, and thus recognized as financial assets or liabilities with a specific balancing entry in specific comprehensive income and presented in the hedging reserve under equity. In the year ended 31 December 2014, a fair value gain of E 5,048k was recognized in respect of derivatives found to be effective.
The basic details of IRS contracts used as cash flow hedges at 31 December 2014 are as follows:
Underlying Notional amount ExpiryAverage fixed rate
receivedFloating rate
receivedFair value
(Ek)
Term Loan k 500m kk 120,000 24.06.2015 4.66% 3 months Euribor (3,888)
Below are the details of financial instruments used to hedge fixed-rate debt of $ 100m at the end of the year:
Underlying Notional amount ExpiryAverage fixed rate
receivedFloating rate
receivedFair value
(Ek)
Bond issue kk 25,000 17.01.2023 2.24% 6 months Usd Libor 89
Bond issue kk 45,000 01.09.2024 2.38% 6 months Usd Libor 158
Bond issue kk 30,000 01.09.2025 2.44% 6 months Usd Libor 118
These instruments were accounted for as fair value hedges in the financial statements of Group companies subject to this risk, and thus recognized as financial assets or liabilities with a balancing entry in the income statement. A hypothetical unfavorable change of 1% in the interest rates applicable to assets and liabilities and to interest rate hedges outstanding at 31 December 2014 would increase net financial expense by E 2,811k.
Currency risk
The Group operates in some countries with functional currencies other than the euro. In these countries, the procurement policy dictates that raw material purchases and other operating expense be conducted in the same currencies, thereby minimizing currency risk. Such a risk remains with respect to intraGroup loans, when granted to subsidiaries that use non-euro currencies. Under these circumstances, the objective of currency risk management is to neutralize some of this risk in respect of payables and receivables in foreign currency arising from lending transactions in currencies other than the euro.
The Group’s exposure to currency translation risk is detailed below, in local currency:
(currency/000) USD CAD CHF
Equity 251,462 45,863 174,150
Profit 66,414 8,944 5,729

2014 Annual Report
117
2.2
Not
es to
the
cons
olid
ated
fina
ncia
l sta
tem
ents
With respect to the above currencies, a 10% appreciation or depreciation of the euro (to account for currency trends in the first two months of 2015) would have altered equity and profit for the year as shown in the following table:
USD 1.2141
CAD 1.4063
CHF 1.2024
(Ek) +10% -10% +10% -10% +10% -10%
Equity (16,576) 20,260 (2,842) 3,473 (12,897) 15,762
Profit (4,546) 5,556 (594) 726 (423) 517
This analysis was based on the assumption that the other variables, especially interest rates, remain unchanged.
Hedging instruments are allocated to companies with significant exposure to currency risk in terms of translation risk (i.e., the risk attending translation into euros in the parent’s or its subsidiaries’ financial statements of equity investments denominated in foreign currency) or financial assets or liabilities in a currency other than the reporting currency. These transactions are recognized at fair value under financial assets or liabilities.
Fluctuations in the fair value of hedges of foreign currency financial assets or liabilities are taken to profit or loss, as is the corresponding change in the amount of the hedged assets and liabilities.
The fair value of exchange rate hedges outstanding at 31 December 2014 is shown below:
Notional amount (currency/000) Expiry Forward rate
Fair value (Ek)
USD 2,400 12.01.2015 1.2949 (75)
USD 1,400 12.01.2015 1.2468 (3)
CAD 44,800 07.01.2015 1.3977 494
CAD 22,500 07.01.2015 1.3975 332
CHF 5,500 23.01.2015 1.2010 (5)
CHF 7,000 23.01.2015 1.2009 (6)
CHF 1,500 23.01.2015 1.2010 (1)
CHF 1,500 23.01.2015 1.2035 (1)
GBP 14,800 13.01.2015 0.7935 (345)
PLN 5,300 23.01.2015 4.2285 14
PLN 4,000 23.01.2015 4.2260 12
For instruments hedging translation risk that are therefore designated as hedges of net investments, the effective component of fair value is recognized in comprehensive income and classified to the translation reserve under equity.

Autogrill Group
118
2. Consolidated financial statem
ents
The fair value of these hedges outstanding at 31 December 2014 is shown in the following table:
Notional amount (currency/000) Expiry Forward rate
Fair value (Ek)
CHF 30,000 27.04.2015 1.21887 (345)
CHF 30,000 27.04.2015 1.21865 (340)
Credit risk
Credit risk is the risk that a customer or a financial instrument counterparty may cause a financial loss by defaulting on an obligation. It arises principally in relation to the Group’s trade receivables and financial investments.
The carrying amount of the financial assets is the Group’s maximum exposure to credit risk, in addition to the face value of guarantees given for the borrowings or commitments of third parties, as detailed in Section 2.2.11.
Exposure at 31 December 2014 and 31 December 2013 was as follows:
Financial assets (Ek) 31.12.2014 31.12.2013 Change
Bank and post office deposits 126,299 102,153 24,146
Other current financial assets 19,672 19,598 74
Trade receivables 43,493 46,371 (2,878)
Other current receivables 102,016 114,449 (12,433)
Derivative instruments 1,572 7,700 (6,128)
Other non-current financial assets 21,981 25,164 (3,183)
Other non-current receivables 12,650 7,409 5,241
Total 327,683 322,844 4,839
Exposure to credit risk depends on the specific characteristics of each customer. The Group’s business model, centered on the relationship with the end consumer, means that trade receivables and thus the relative degree of risk is of limited significance in relation to total financial assets, since most sales are paid for in cash.
In most cases, the Group’s trade receivables stem from catering service agreements and commercial affiliations.
Other receivables consist mainly of amounts due from Inland Revenue and other government agencies, fees paid in advance, and advances for services or commercial investments made on behalf of concession grantors, for which the degree of credit risk is low.

2014 Annual Report
119
2.2
Not
es to
the
cons
olid
ated
fina
ncia
l sta
tem
ents
Financial assets are recognized net of impairment losses calculated on the basis of the counterparty’s risk of default. Impairment is determined according to local procedures, which may require impairment of individual positions, if material, where there is evidence of an objective condition of uncollectability of part or all of the amount due, or collective impairment calculated on the basis of historical and statistical data.
Trade receivables (Ek)
31.12.2014
Not expired
Expired not impaired
1-3 months 3-6 months 6 months-1 year Over 1 year Total
Airlines 2,579 864 13 - - 3,456
Franchises 1,430 265 - 3,425 - 5,120
Catering services agreements 5,959 2,465 109 498 4 9,035
Other 11,967 6,832 1,541 5,405 136 25,882
Total 21,935 10,425 1,663 9,328 140 43,493
Trade receivables (Ek)
31.12.2013
Not expired
Expired not impaired
1-3 months 3-6 months 6 months-1 year Over 1 year Total
Airlines 5,879 2,970 18 - 15 8,883
Franchises 2,641 866 - 1,182 - 4,689
Catering services agreements 2,751 2,931 74 510 19 6,285
Other 14,011 8,038 66 4,369 31 26,515
Total 25,282 14,806 158 6,061 65 46,371
There is no significant concentration of credit risk: the top 10 customers account for 19.2% of total trade receivables, and the largest customer (Tamoil Italia S.p.A.) for 2.71%.
Liquidity risk
Liquidity risk arises when it proves difficult to meet the obligations relating to financial liabilities.
The Group manages liquidity by ensuring that to the extent possible, it always has sufficient funds to meet its obligations on time, without incurring excessive charges or risking damage to its reputation.
The elements that make up the Group’s liquidity are the resources generated or used in operating and investing activities, the characteristics of its debt, the liquidity of its financial investments, and financial market conditions.

Autogrill Group
120
2. Consolidated financial statem
ents
Exposure and maturity data at the end of 2014 and 2013 were as follows:
Non-derivative financial liabilities (Ek)
31.12.2014
Carrying amount
Contractual cash flows
Total 1-3 months 3-6 months6 months-
1 year 1-2 years 2-5 years Over 5 years
Current account overdrafts 40,427 40,427 40,427 - - - - -
Unsecured bank loans 429,464 429,464 96,183 - - 333,281 - -
Lease payments due to others 6,296 6,296 207 161 329 861 810 3,929
Liabilities due to others 289 289 - - - - - 289
Bonds 418,006 418,007 - - - - 129,358 288,649
Trade payables 406,698 406,698 399,061 7,390 223 13 10 -
Due to suppliers for investments 82,481 82,481 80,475 2,000 - - 6 -
Total 1,383,662 1,383,662 616,353 9,551 552 334,155 130,184 292,867
Derivative financial liabilities (Ek)
31.12.2014
Carrying amount
Contractual cash flows
Total 1-3 months 3-6 months6 months-
1 year 1-2 years 2-5 years Over 5 years
Forward foreign exchange derivatives 1,043 1,043 1,043 - - - - -
Interest rate swap 4,321 4,321 3,888 - - - 433
Total 5,364 5,364 1,043 3,888 - - - 433
Non-derivative financial liabilities (Ek)
31.12.2013
Carrying amount
Contractual cash flows
Total 1-3 months 3-6 months6 months-
1 year 1-2 years 2-5 years Over 5 years
Current account overdrafts 41,937 41,937 41,937 - - - - -
Unsecured bank loans 443,360 443,360 76,819 - - - 366,541 -
Lease payments due to others 11,042 11,042 255 247 391 1,700 558 7,892
Liabilities due to others 283 283 - - - - - 283
Bonds 369,911 369,911 - - - - 116,122 253,789
Trade payables 396,204 396,204 388,609 664 6,557 227 144 4
Due to suppliers for investments 56,402 56,402 55,154 1,242 - - 6 -
Total 1,319,139 1,319,139 562,774 2,153 6,948 1,927 483,371 261,968
Derivative financial liabilities (Ek)
31.12.2013
Carrying amount
Contractual cash flows
Total 1-3 months 3-6 months6 months-
1 year 1-2 years 2-5 years Over 5 years
Forward foreign exchange derivatives 336 336 336 - - - - -
Interest rate swap 8,972 8,972 1,197 - - 7,775 - -
Total 9,308 9,308 1,533 - - 7,775 - -

2014 Annual Report
121
2.2
Not
es to
the
cons
olid
ated
fina
ncia
l sta
tem
ents
With regard to exposure to trade payables, there is no significant concentration of suppliers, of which the largest 10 account for 26.11% of the total and the leading supplier (Autostrade per l’Italia S.p.A.) for 7.97%.
The bond regulations call for compliance with certain financial ratios, calculated solely with respect to the companies headed up by HMSHost Corporation. They are not guaranteed by Autogrill S.p.A. There are also limits on the distribution of dividends by HMSHost Corporation to the parent, Autogrill S.p.A., if the leverage ratio of the HMSHost subGroup exceeds a certain amount.
The loan contracts (note XIX) and bonds (note XXI) outstanding at 31 December 2014 require the satisfaction of certain financial ratios, specifically, the leverage ratio (net debt/EBITDA) and interest coverage ratio (EBITDA/net financial expense). These are measured with different criteria and for different groupings of companies depending on the loan and the beneficiary. In particular, Autogrill S.p.A. has outstanding loans for which the above ratios are calculated on figures pertaining to the Autogrill Group as a whole.
The weighted average term of bank loans and bonds at 31 December 2014, including unutilized credit lines, is approximately three years and four months (four years and two months at the end of 2013).
On 6 March 2015, the subsidiary HMSHost Corporation extended the maturity of its $ 250m credit line from 22 March 2016 to 6 March 2020.
On 12 March 2015 Autogrill S.p.A. contracted a new loan in the amount of E 600m. This is comprised of an amortizing term loan of E 200m and a revolving credit facility of E 400m, both maturing in March 2020. It will be used for the early reimbursement of the revolving credit facilities maturing in July 2016 and to finance the Group’s operations.
2.2.8 Disclosure of non-controlling interestsNon-controlling interests refer mainly to investments in US companies held by Accredited Disadvantaged Business Enterprises (ADBE), whose participation in the operation of concessions is regulated by state and federal law. The Group maintains control of these companies and is principally responsible for the concession fees due to the grantor.
At 31 December 2014, these companies had net assets of $ 118.9m ($ 105.8m at 31 December 2013), revenue of $ 569.2m ($ 508.3m in 2013) and profit for the year of $ 48.6m ($ 44.2m the previous year). The equity attributable to non-controlling interests amount to $ 25.4m ($ 22m at 31 December 2013) and the profit to $ 9.9m ($ 9.4m the previous year).

Autogrill Group
122
2. Consolidated financial statem
ents
2.2.9 Segment reportingThe Group operates in the catering sector (“Food & Beverage”) at airports, motorway rest stops and railway stations.
Operations take place at major travel facilities (from airports to motorway rest stops and railway stations), serving a local and international clientele. The business is conducted in Europe by Autogrill S.p.A. (directly in Italy and through subsidiaries in other European countries), and in North America, Scandinavia, Middle East and Asia by HMSHost Corporation and its subsidiaries. Offerings reflect the local setting, with the use of proprietary brands, as well as a more global reach thanks to the use of international brands under license. The operational levers are typically assigned to local organizations that are centralized at the country level and coordinated, at the European level, by central facilities.
Performance is monitored separately for each organization, which corresponds to the country served. “Italy,” “HMSHost North America,” and “HMSHost International” are presented on their own, while the remaining European entities (each of them quite small) are grouped together under the heading “Other European countries.” Costs are shown separately for “European Central Structure,” which mostly takes care of marketing, purchasing, engineering, human resources, organization, and ICT regarding operations in Europe, and for “Corporate” functions, i.e. the centralized units in charge of administration, finance and control, strategic planning, legal affairs, communication, human resources and organization for the Group as a whole.
With respect to the 2013 financial statements, operating segments have been regrouped to reflect the Group’s new organization in three geographical segments: North America, International (Northern Europe, Middle East and Asia), and Europe (which is further split into Italy and other European countries).
Key reporting on operating segments is presented below. The accounting policies used for segment reporting are the same as those applicable to the consolidated financial statements.
Segment (Ek)
2014
HMSHost Europe
Corporate ConsolidatedNorth America International Italy
Other European countries
European central
structure
Total revenue and other operating income 1,852,854 284,012 1,665,420 767,680 - 353 4,570,319
Depreciation, amortization and impairment losses on property, plant, equipment and intangible assets (90,030) (16,274) (47,577) (40,772) - (2,946) (197,600)
Operating profit/(loss) 112,343 18,890 14,300 5,911 (8,977) (23,828) 118,639
Net financial expense (44,393)
Adjustment to the value of financial assets 2,977
Pre-tax profit 77,222
Income tax (40,244)
Profit for the year 36,978

2014 Annual Report
123
2.2
Not
es to
the
cons
olid
ated
fina
ncia
l sta
tem
ents
Segment (Ek)
31.12.2014
HMSHost Europe
Corporate ConsolidatedNorth America International Italy
Other European countries
European central
structure
Goodwill 421,720 58,641 83,631 240,552 - - 804,544
Other intangible assets 12,313 13,038 1,519 16,922 - 19,960 63,752
Property, plant and equipment 422,973 59,607 162,135 175,224 - 14,964 834,903
Financial assets 9,818 1,353 - 3,357 - 8,314 22,843
Non-current assets 866,825 132,639 247,285 436,055 - 43,238 1,726,042
Net working capital (149,486) (39,480) (115,649) (90,054) - (61) (394,730)
Other non-current non-financial assets and liabilities (56,957) (1,005) (57,985) (28,303) - (3,084) (147,334)
Net invested capital 660,381 92,155 73,651 317,698 - 40,094 1,183,979
Segment (Ek)
2013
HMSHost Europe
Corporate ConsolidatedNorth America International Italy
Other European countries
European central
structure
Total revenue and other operating income 1,921,808 235,394 1,775,407 741,077 - 203 4,673,889
Depreciation, amortization and impairment losses on property, plant, equipment and intangible assets (99,258) (10,539) (68,874) (45,503) - (1,578) (225,753)
Operating profit/(loss) 100,791 19,460 4,344 782 (8,459) (28,649) 88,268
Net financial expense (50,471)
Adjustment to the value of financial assets (2,399)
Pre-tax profit 35,398
Income tax (27,065)
Profit from discontinued operations 91,056
Profit for the year 99,389
Segment (Ek)
31.12.2013
HMSHost Europe
Corporate ConsolidatedNorth America International Italy
Other European countries
European central
structure
Goodwill 373,486 54,056 83,631 238,064 - - 749,237
Other intangible assets 13,013 11,829 1,797 18,622 - 16,554 61,816
Property, plant and equipment 380,871 39,480 171,622 177,653 - 12,911 782,537
Financial assets 7,279 717 - 1,850 - 12,177 22,024
Non-current assets 774,649 106,082 257,050 436,189 - 41,642 1,615,613
Net working capital (111,573) (32,405) (122,770) (73,218) - (78) (340,044)
Other non-current non-financial assets and liabilities (49,320) (2,763) (83,555) (21,856) - (567) (158,062)
Net invested capital 613,756 70,913 50,726 341,115 - 40,998 1,117,507

Autogrill Group
124
2. Consolidated financial statem
ents
2.2.10 Seasonal patternsThe Group’s volumes are closely related to the flow of travelers, which is highly seasonal in some businesses, and this in turn affects consolidated results. A breakdown of 2014 results by quarter shows that volumes are concentrated in the second half of the year, and particularly in the third quarter, when business is at a peak due to summer holidays.
2014
(Em) First quarter First half First nine months Full year
Revenue 813.0 1,787.3 2,868.6 3,930.2
% of full year 20.7% 45.5% 73.0% 100%
Operating profit/(loss) (27.2) 14.2 111.3 118.6
% of full year n.s. 12.0% 93.8% 100%
Pre-tax profit/(loss) (36.5) (4.8) 82.5 77.2
% of full year n.s. n.s. 106.9% 100%
Profit/(loss) for the year attributable to owners of the parent (37.1) (23.7) 37.5 25.1
% of full year n.s. n.s. n.s. 100%
Notes:- In order to compare data with the figures shown in the Report on operations, revenue does not include fuel sales made primarily in
Swiss and Italian motorway service areas- Profit/(loss) for the year attributable to owners of the parent excluding minorities
The percentages shown are general indications only and should not be used to predict results or the generation of cash.
Indeed, seasonal trends are further magnified by cash flows, with the first quarter seeing a concentration of annual payments (namely concession fees), both as settlement of amounts accrued in the previous year and as advances on the current year.

2014 Annual Report
125
2.2
Not
es to
the
cons
olid
ated
fina
ncia
l sta
tem
ents2.2.11 Guarantees given, commitments and
contingent liabilities
Guarantees
At 31 December 2014 the guarantees given by the Autogrill Group amounted to E 264,509k (E 225,646k at the end of 2013) and referred to performance bonds and other personal guarantees issued in favor of grantors and business counterparties.
Commitments
Commitments outstanding at 31 December 2014, essentially unchanged since the previous year, concern:• E 2,272k to be paid for the purchase of two commercial properties;• the value of third-party assets in use (E 1,301k); • the value of the assets of leased businesses (E 12,769k);• the value of goods on consignment held at Group locations (E 4,432k).
The Group has also agreed to minimum future payments under operating leases, as detailed in Section 2.2.12.
2.2.12 Operating leasesFor the purposes of these financial statements, operating leases are defined as the various kinds of contract through which Group companies carry out their core business.
The management and provision of catering services along motorways or in airports is assigned by the motorway or airport operator to specialized companies under subconcession arrangements.
In railway stations, in addition to this kind of contract, there are also commercial leases.
It frequently occurs that a subconcession for all the services of an entire motorway service area or airport terminal is assigned to a single entity, which then sub-assigns each individual service to a number of specialized firms.
The most common forms of agreement are commercially described as follows.

Autogrill Group
126
2. Consolidated financial statem
ents
Access concession
An access concession exists when ownership of the land and buildings along the motorway is in the hands of a private firm (like the Autogrill Group), which negotiates access rights with the motorway company with the commitment to sell fuel and lubricants and/or food and beverages to motorway users. The firm accepts the obligation to pay rent to the motorway as well as certain stipulations regarding the way the services are to be provided and the hours of operation.
Area concession
The motorway company authorizes an entity (i) to build a service station and/or shop/restaurant on land which it owns and (ii) to carry out this business against payment of a fee based on turnover, with certain stipulations regarding the way the services are to be provided and the hours of operation.
On expiry of the contract, the assets built for provision of services are to be transferred free of charge to the motorway company.
Usually the holder of an area concession is a petrol company, which in turn can assign management of restaurant services to a specialized firm, generally through a business lease.
Service concession
The motorway operator authorizes separate contractors by means of separate independent contracts to (i) build a service station and/or shop/restaurant on land which it owns and (ii) carry out this business against payment of a fee based on turnover, with certain stipulations regarding the way the services are to be provided and the hours of operation. On expiry of the contract, the assets built for this purpose are to be transferred free of charge to the motorway company.
Service concessions are also used in airport terminals where the contractor is authorized to sell food and beverages after installing the necessary equipment and furnishings at its own expense, against payment of a fee – usually based on turnover – and an agreement to guarantee service during the opening hours specified by the grantor. The contractor may have to transfer the assets free of charge when the concession expires, although this is fairly uncommon.
Business lease and commercial lease
Leasing a business or parts thereof allows an operator to use rights and/or buildings, equipment etc. organized to serve food and beverage products. In some cases the business consists of an authorization to operate and of administrative licenses. In these cases the operator incurs the necessary capital expenditure and provides the service. In other cases, a firm leases a company consisting of both the authorization and the necessary buildings and equipment. Leasing a company in the concession business entails the obligation to ensure continuity of service and payment of a comprehensive fee which includes all amounts due to the concession grantor.

2014 Annual Report
127
2.2
Not
es to
the
cons
olid
ated
fina
ncia
l sta
tem
ents
In a commercial lease, the operator uses buildings for business activity against payment of rent. The premises are equipped and furnished according to the specifications and at the expense of the operator, who must clear the premises when the lease expires.
These kinds of concession are common (i) along motorways, where there are area or service sub-concessions assigned to a petrol company, which then turns to a caterer, and (ii) in cities, railway stations and shopping centers, according to the business objectives of the owner of the property.
Sub-contract
The operator prepares and serves food and beverages using its own equipment and staff, and receives payment based on turnover (sales to the consumer). The party awarding the contract owns the property and has title to all the takings.
The table below gives details by due date of the Group’s future minimum operating lease payments at 31 December 2014:
(Ek)
Year
Total future minimum lease
paymentsFuture minimum
sub-lease payments *Net future minimum
lease payments
2015 375,261 19,500 355,762
2016 339,714 16,517 323,197
2017 312,055 15,950 296,106
2018 271,133 14,140 256,993
2019 226,228 12,113 214,116
After 2019 872,674 29,316 843,358
Total 2,397,065 107,535 2,289,531
* Refers to part of the sub-concessions granted mainly in the USA and Italy, as agreed with the grantor
In 2014, the fees recognized in the income statement amount to E 580,223k for operating leases (including E 353,245k in future minimum lease payments), net of E 46,571k for sub-leases (including E 20,903k in future minimum lease payments).

Autogrill Group
128
2. Consolidated financial statem
ents
2.2.13 Other informationRelated party transactions
Autogrill S.p.A. is controlled by Schematrentaquattro S.p.A., which owns 50.1% of its ordinary shares. Schematrentaquattro S.p.A. is a wholly-owned subsidiary of Edizione S.r.l.
All related-party transactions are carried out in the Company’s interest and at arm’s length.
In 2014 Autogrill S.p.A. had no transactions with its direct parent, Schematrentaquattro S.p.A.
Revenue Other operating incomeLeases, rentals,
concessions and royalties Other operating expense Personnel expense Financial (expense)/income
Income statement (Ek) 2014 2013 2014 2013 2014 2013 2014 2013 2014 2013 2014 2013
Parent:
Edizione S.r.l. - - 92 90 - - 100 40 114 131 - -
Other related parties:
Atlantia Group 39 13 1,061 15,855 78,412 68,702 3,462 3,615 - - (1,384) (1,381)
Benetton Group S.r.l. (formerly Bencom S.r.l.) - - 393 391 - - - - - - - -
Verde Sport S.p.A. 11 9 - 6 - - 45 65 - - - -
Olimpias S.p.A. - - - - - - 80 76 - - - -
World Duty Free Group - - 5,247 1,404 - - 28 - - - 90 52
Edizione Property - - 5 - - - - - - - - -
Gemina Group * - 34 - - - 8,454 - 33 - - - -
Total related parties 50 56 6,799 17,746 78,412 77,156 3,715 3,828 114 131 (1,294) (1,329)
Total Group 4,461,466 4,545,922 108,853 127,967 668,466 677,407 475,363 490,168 1,296,618 1,318,190 (44,393) (50,471)
Incidence - - 6.2% 13.9% 11.7% 11.4% 0.8% 0.8% - - 2.9% 2.6%
Trade receivables Other receivables Financial receivables Trade payables Other payables
Statement of financial position (Ek) 31.12.2014 31.12.2013 31.12.2014 31.12.2013 31.12.2014 31.12.2013 31.12.2014 31.12.2013 31.12.2014 31.12.2013
Parent:
Edizione S.r.l. - - 14,647 14,609 - - - - 126 137
Other related parties:
Atlantia Group 1,032 750 1,058 1,758 - - 34,217 36,545 - -
Benetton Group S.r.l. (formerly Bencom S.r.l.) 329 327 - - - - - - - -
Verde Sport S.p.A. 1 5 - - - - - - - -
Olimpias S.p.A. - - - - - - 66 41 - -
World Duty Free Group - - 2,617 17,956 - 3,868 - - - 1,995
Edizione Property 5 - - - - - - - - -
Total related parties 1,367 1,082 18,323 34,323 - 3,868 34,282 36,586 126 2,132
Total Group 43,493 46,371 176,586 176,310 21,244 20,949 406,698 396,205 315,361 266,890
Incidence 3.1% 2.3% 10.4% 19.5% - 18.5% 8.4% 9.2% - 0.8%
* Income and costs for Gemina Group are shown separately up to the date of merger into the Atlantia Group with effect from 1 December 2013.

2014 Annual Report
129
2.2
Not
es to
the
cons
olid
ated
fina
ncia
l sta
tem
ents2.2.13 Other information
Related party transactions
Autogrill S.p.A. is controlled by Schematrentaquattro S.p.A., which owns 50.1% of its ordinary shares. Schematrentaquattro S.p.A. is a wholly-owned subsidiary of Edizione S.r.l.
All related-party transactions are carried out in the Company’s interest and at arm’s length.
In 2014 Autogrill S.p.A. had no transactions with its direct parent, Schematrentaquattro S.p.A.
Revenue Other operating incomeLeases, rentals,
concessions and royalties Other operating expense Personnel expense Financial (expense)/income
Income statement (Ek) 2014 2013 2014 2013 2014 2013 2014 2013 2014 2013 2014 2013
Parent:
Edizione S.r.l. - - 92 90 - - 100 40 114 131 - -
Other related parties:
Atlantia Group 39 13 1,061 15,855 78,412 68,702 3,462 3,615 - - (1,384) (1,381)
Benetton Group S.r.l. (formerly Bencom S.r.l.) - - 393 391 - - - - - - - -
Verde Sport S.p.A. 11 9 - 6 - - 45 65 - - - -
Olimpias S.p.A. - - - - - - 80 76 - - - -
World Duty Free Group - - 5,247 1,404 - - 28 - - - 90 52
Edizione Property - - 5 - - - - - - - - -
Gemina Group * - 34 - - - 8,454 - 33 - - - -
Total related parties 50 56 6,799 17,746 78,412 77,156 3,715 3,828 114 131 (1,294) (1,329)
Total Group 4,461,466 4,545,922 108,853 127,967 668,466 677,407 475,363 490,168 1,296,618 1,318,190 (44,393) (50,471)
Incidence - - 6.2% 13.9% 11.7% 11.4% 0.8% 0.8% - - 2.9% 2.6%
Trade receivables Other receivables Financial receivables Trade payables Other payables
Statement of financial position (Ek) 31.12.2014 31.12.2013 31.12.2014 31.12.2013 31.12.2014 31.12.2013 31.12.2014 31.12.2013 31.12.2014 31.12.2013
Parent:
Edizione S.r.l. - - 14,647 14,609 - - - - 126 137
Other related parties:
Atlantia Group 1,032 750 1,058 1,758 - - 34,217 36,545 - -
Benetton Group S.r.l. (formerly Bencom S.r.l.) 329 327 - - - - - - - -
Verde Sport S.p.A. 1 5 - - - - - - - -
Olimpias S.p.A. - - - - - - 66 41 - -
World Duty Free Group - - 2,617 17,956 - 3,868 - - - 1,995
Edizione Property 5 - - - - - - - - -
Total related parties 1,367 1,082 18,323 34,323 - 3,868 34,282 36,586 126 2,132
Total Group 43,493 46,371 176,586 176,310 21,244 20,949 406,698 396,205 315,361 266,890
Incidence 3.1% 2.3% 10.4% 19.5% - 18.5% 8.4% 9.2% - 0.8%
* Income and costs for Gemina Group are shown separately up to the date of merger into the Atlantia Group with effect from 1 December 2013.

Autogrill Group
130
2. Consolidated financial statem
ents
Edizione S.r.l.: “Other operating income” refers to services rendered by the parent concerning the use of equipped premises at the Rome offices.
“Personnel expense” refers to the accrual at 31 December 2014 for fees due to a director of Autogrill S.p.A., to be recharged to Edizione S.r.l. where he serves as executive manager.
“Other payables” mostly originate from the same transactions.
The item “Other receivables” also includes:• E 12,467k for the IRES (corporate income tax) refund requested by the consolidating company Edizione S.r.l. on behalf of Autogrill S.p.A., due as a result of the retroactive recognition of the deductibility of IRAP (regional tax) pertaining to personnel expense for the years 2007-2011 (art. 2 of Law 201/2011);• E 2,024k for the IRES refund requested by the consolidating company Edizione S.r.l. on behalf of Autogrill S.p.A., for the deduction from taxable income of the portion of IRAP concerning personnel expense paid from 2004 to 2007 (Law 185/2008).
Atlantia Group: “Other operating income” refers mostly to fees for cleaning services at rest stops, co-marketing fees for customer discounts and promotions, and commissions on sales of Viacards (automatic toll collection cards).
Most of the change on the previous year relates to the inclusion in 2013 only of non-recurring income from having waived the right of pre-emption on the renewal of expiring subconcessions (E 13.8m).
“Other receivables” originate from the same transactions.
“Other operating expense” refers chiefly to the management of motorway locations.
“Leases, rentals, concessions and royalties” refer to concession fees and accessory costs pertaining to the year.
“Trade payables” originate from the same transactions.
“Financial expense” reflects interest accrued at the annual rate of 5.30% in relation to the revised payment schedule for concession fees.
Olimpias S.p.A.: costs refer to the purchase of uniforms for sales personnel and the purchase of sundry materials.
Verde Sport S.p.A.: “Other operating expense” concerns the commercial sponsorship of youth sports at the facilities housed at “La Ghirada - Città dello Sport”.
“Revenue” refers to the sale of products relating to the commercial affiliation contract for the operation of an outlet at those facilities.
Benetton Group S.r.l. (formerly Bencom S.r.l.): “Other operating income” refers to rent and related charges for the sublet of premises in Via Dante, Milan.

2014 Annual Report
131
2.2
Not
es to
the
cons
olid
ated
fina
ncia
l sta
tem
ents
All liabilities are current; the receivable from Benetton Group S.r.l. (formerly Bencom S.r.l.) will be settled in installments until the sub-lease expires in April 2017.
World Duty Free Group: “Other operating income” stems mainly from the provision of administrative, IT and legal advisory services by HMSHost Corporation and Autogrill S.p.A.
Remuneration of Directors and Executives with strategic responsibilities
The following remuneration was paid to members of the Board of Directors and to Executives with strategic responsibilities during the year ended 31 December 2014:
Name Office held Term of officeRemuneration
(E)
Bonus and other
incentives(E)
Non-monetary benefits
(E)Other fees
(E)
Gilberto Benetton Chairman 2014–2016 57,200
Tondato Da Ruos Gianmario CEO 2014–2016 517,200 200,000 13,541 401,099
Alessandro Benetton Director 2014–2016 56,000
Paolo Roverato Director 2014–2016 114,308
Gianni Mion Director 2014–2016 86,054
Tommaso Barracco Director 2014–2016 86,654
Stefano Orlando Director 2014–2016 93,799
Massimo Fasanella d’Amore di Ruffano Director 2014–2016 85,780
Carolyn Dittmeier Director 2014–2016 81,035
Arnaldo Camuffo Director from 2011 to 28.05.2014 38,438
Marco Jesi Director from 2011 to 28.05.2014 37,238
Marco Mangiagalli Director from 2011 to 28.05.2014 37,838
Alfredo Malguzzi Director from 2011 to 28.05.2014 39,038
Neriman Ülsever Director from 28.05.2014 to 2016 33,326
Francesco Umile Chiappetta Director from 28.05.2014 to 2016 48,816
Ernesto Albanese Director from 28.05.2014 to 2016 33,326
Giorgina Gallo Director from 28.05.2014 to 2016 55,961
Total directors 1,502,011 200,000 13,541 401,099
Key managers with strategic responsibilities 636,869 201,400 3,799,363
Total 1,502,011 836,869 214,941 4,200,462
The CEO’s remuneration includes his executive salary from Autogrill S.p.A., shown under “Other fees,” and the amounts accrued under the long-term incentive plan.

Autogrill Group
132
2. Consolidated financial statem
ents
The CEO’s contract states that if he resigns with just cause or is dismissed by the Parent without just cause, the Company will top up to E 2m the standard indemnity in lieu of notice provided for in the national collective managers’ contract for the commercial sector, when lower than this amount.
In 2010, the CEO received 425,000 options under the 2010 stock option plan; 330,073 of the options vested on 20 April 2014. In 2012 the CEO received 225,000 options under the “Leadership Team Long Term Incentive Plan Autogrill (L-LTIP).” In addition, on 16 July 2014 he received 883,495 options under “Wave 1” and 565,217 options under “Wave 2” of the Phantom Stock Option 2014 Plan.
A significant portion of the variable compensation received by the CEO and by executives with strategic responsibilities is tied to the achievement of specific targets established in advance by the Board of Directors, by virtue of their participation in management incentive plans. In particular, the CEO and top managers participated during the year in an annual bonus system involving earnings and financial targets and other strategic objectives for the Group and/or the relevant business unit, as well as individual objectives. This was in addition to the L-LTIP plan, described below.
See the section “Incentive plans for directors and executives with strategic responsibilities” for a description of the plans in force.
Statutory auditors’ fees
The following fees accrued to members of the Board of Statutory auditors in 2014:
Name Office held Term of office Fees (E) Other fees (E)
Marco Giuseppe Maria Rigotti Chairman 19.04.2012–31.12.2014 86,193 -
Luigi Biscozzi Standing auditor 01.01.2012–31.12.2014 57,200 25,011
Eugenio Colucci Standing auditor 01.01.2012–31.12.2014 55,000 16,859
Total Statutory auditors 198,393 41,871
“Other fees” refer to those accrued for statutory auditing duties at the subsidiary Nuova Sidap S.r.l.
Independent auditors’ fees for audit and other services
Type of service Service provider Recipient Fees (Ek)
Auditing Parent's auditors Parent 314
Parent's auditors Subsidiaries 51
Parent's auditors network Subsidiaries 1,754
Attestation Parent's auditors Parent 90
Parent's auditors Subsidiaries 26
Parent's auditors network Subsidiaries 881
Other services Parent's auditors Parent 16
Parent's auditors Subsidiaries 7
Parent's auditors network Parent 32
Parent's auditors network Subsidiaries 18

2014 Annual Report
133
2.2
Not
es to
the
cons
olid
ated
fina
ncia
l sta
tem
entsIncentive plans for Directors and Executives with strategic responsibilities
2010 Stock option plan
On 20 April 2010, the shareholders’ meeting approved a stock option plan entitling executive directors and/or employees with strategic responsibilities of Autogrill S.p.A. and/or its subsidiaries to subscribe to or purchase ordinary Autogrill shares at the ratio of one share per option granted. The options are granted to beneficiaries free of charge and once the vesting period has elapsed, may be exercised between 20 April 2014 and 30 April 2015, at a strike price calculated as the average stock market price for the month preceding the grant date.
The extraordinary shareholders’ meeting of 20 April 2010 also approved a share capital increase against payment to service the plan, valid whether subscribed in full or in part, and excluding subscription rights pursuant to art. 2441(5) and (8) of the Italian Civil Code and art. 134(2) of Legislative Decree 58 of 24 February 1998, by a maximum par value of E 1,040,000 (plus share premium), to be carried out no later than 30 May 2015 through the issue of up to 2,000,000 ordinary Autogrill shares in one or more tranches.
The stock option plan approved by the Annual General Meeting states that the options assigned will only vest if, at the end of the vesting period, the terminal value of Autogrill shares is E 11 or higher. The terminal value is defined as the average official price of Autogrill S.p.A. ordinary shares during the three months prior to the last day of the vesting period, plus the dividends paid during the period lasting from the grant date until the end of the vesting period.
The number of options vested will then correspond to a percentage of the options assigned, ranging from 30% for a terminal value of E 11 per share to 100% for a terminal value of E 17 per share or higher. For each beneficiary there is also a “theoretical maximum capital gain” by virtue of which, regardless of other estimates, the number of options exercisable will be limited to the ratio “theoretical maximum capital gain”/(fair value – strike price) 32.The plan does not allow beneficiaries to request cash payments in alternative to the assignment of shares.
On 10 November 2010, the Board of Directors granted 1,261,000 options, out of the 2,000,000 available, to 11 beneficiaries meeting the requirements of the plan. The options are exercisable at a strike price of E 9.34 per share. On 29 July 2011 the Board of Directors assigned an additional 188,000 options to two other beneficiaries meeting the plan requirements; these can be exercised at a strike price of E 8.91 per share.
On 16 February 2012, the Board of Directors assigned 120,000 options to a new beneficiary at a strike price of E 8.19 per share.
On 26 January 2012, the Board of Directors approved the assignment to a new beneficiary of 120,000 incentive instruments known as “stock appreciation rights”, which can be exercised between 20 April 2014 and 30 April 2015 at a price of E 7.83 per share. These instruments, which allow the payment of a cash benefit (capital gain) instead of the right to acquire shares of the Company, work in a manner consistent with the 2010 stock option plan.
32. As defined by art. 9, para. 4, of D.P.R. 22 December 1986. no. 917

Autogrill Group
134
2. Consolidated financial statem
ents
Changes to 2010 stock option plan
On 6 June 2013 the Annual General Meeting approved the proportional partial demerger of Autogrill S.p.A., and as a result made some changes to the stock option plan approved on 20 April 2010. In accordance with these changes:• the plan’s beneficiaries are entitled, jointly or severally upon achieving the defined performance objectives, to receive one ordinary Autogrill share and one ordinary World Duty Free S.p.A. share for every vested option against payment of the strike price;• the strike price is split proportionally between the Autogrill S.p.A. share price and the World Duty Free S.p.A. share price on the basis of the average official stock market price of the two securities during the first 30 days following the listing of World Duty Free S.p.A. The strike price of Autogrill shares is between E 3.50 and E 4.17, while the strike price for World Duty Free shares is between E 4.33 and E 5.17, depending on the beneficiary and the strike price originally set for each;• the deadline for exercising the options has been extended from 20 April 2015 to 30 April 2018, without altering the start date of 20 April 2014.
An independent external advisor has been hired to calculate the fair value of the stock options, based on the value of shares on the grant date, volatility, estimated dividend payments, the term of the plan and the risk-free rate of return. The calculation was performed using the binomial method.
As a result of the demerger and the changes made to the plan, the average fair value of the options outstanding at 31 December 2014 was E 0.96 for Autogrill S.p.A. shares and E 3.23 for World Duty Free S.p.A. shares.
For the year, the total costs recognized in relation to the payment plan based on Autogrill shares amounted to E 124k.
On 20 April 2014, the vesting period ended in accordance with the stock option plan regulations, and 1,209,294 assigned options were converted into 823,293 “vested options.”
Between 20 April 2014 and 31 December 2014, 134,136 Autogrill S.p.A. options and 290,969 World Duty Free S.p.A. options were exercised by various beneficiaries.
The CEO has exercised 156,833 World Duty Free S.p.A. options.
Movements during the year are shown below:
Autogrill shares World Duty Free shares
Number of options
Fair value existing options
(E) Number of options
Fair value existing options
(E)
Vested options at 20 April 2014 823,293 0.95 823,293 3.99
Options exercized in the first half of 2014 (134,136) (0.95) (290,969) (4.38)
Vested options at 31 December 2014 689,157 0.96 532,324 3.23
Thorough information on 2010 stock option plan is provided in the Information Document prepared in accordance with art. 84-bis (1) and Annex 3A (Schedule 7) of Consob Regulation 11971/1999, which is available to the public at www.autogrill.com.

2014 Annual Report
135
2.2
Not
es to
the
cons
olid
ated
fina
ncia
l sta
tem
ents
New Leadership Team Long Term Incentive Plan (L-LTIP)
During the ordinary and extraordinary shareholders’ meeting of 21 April 2011, the shareholders approved a new share-based incentive plan for the Group’s top management. In addition to cash incentives (the “main plan”) pertaining to 2010-2012, Autogrill’s New Leadership Team Long Term Incentive Plan (L-LTIP) envisages the free assignment of ordinary Autogrill shares subject to certain conditions, including the achievement of specified performance targets during the three-year periods 2011-2013 (“Wave 1”) and 2012-2014 (“Wave 2”).
The shares assigned may be treasury shares or newly issued shares, subsequent to a share capital increase reserved to the plan’s beneficiaries. To this end, the Board of Directors was granted the power, for a period of five years from the date of the shareholders’ approval, to increase share capital in one or more tranches through the issue of up to 3,500,000 ordinary shares to be assigned free of charge to the beneficiaries.
Specifically, the plan calls for the assignment of rights (called “units”) to receive free Autogrill shares through the exercise of options; the rights are conditional, free of charge and not transferable inter vivos. The number of units assigned depends on the category of beneficiary, and the conversion factor from units to options is calculated by applying an individual coefficient taking account of the beneficiary’s position on the pay scale. For each beneficiary, there is a limit to the number of options that may be assigned, based on the level of remuneration. The plan does not allow for cash payments in alternative to the assignment of shares.
The Board of Directors has determined that at the end of the period 2011-2013 and 2012-2014, the ompany had not reached the minimum performance targets required for the implementation of Wave 1 and Wave 2 of the plan. Therefore, no costs or provisions were recognized for the Waves as of 31 December 2014.
Thorough information on the plan is provided in the Infomation Document prepared in accordance with art. 84-bis (1) and Annex 3A (Schedule 7) of Consob Regulation 11971/1999, which is available to the public at www.autogrill.com.
2014 Phantom Stock Option Plan
On 28 May 2014, the shareholders’ meeting approved a new incentive plan referred to as the “2014 Phantom Stock Option Plan.” The options will be assigned free of charge to executive directors and employees with strategic responsibilities of the company and/or its subsidiaries or to members of the management team as named, on one or more occasions, by the Board of Directors.
This plan, which expires on 30 June 2021, is split into three sub-plans or “Waves” which grant each beneficiary the right to receive, for each option exercised, a gross cash amount equal to the difference between the terminal value and the grant value of the Autogrill shares (the “Bonus”), subject to certain conditions and in any case not exceeding a given cap. Specifically, the terminal value of the shares is defined as the average official closing price of the company’s shares at the end of each trading session of the Italian Stock Exchange in the month prior to and inclusive of the exercise date, plus dividends paid from the grant date until the date of exercise. The grant value is defined as the average official closing price of the company’s shares at the end of each trading session of the Italian Stock Exchange in the month prior to and inclusive of the grant date.

Autogrill Group
136
2. Consolidated financial statem
ents
On 16 July 2014, the plan was implemented and the terms and conditions of Wave 1 and Wave 2 were defined.
Under Wave 1 (vesting period from 16 July 2014 to 15 July 2016), a total of 3,268,995 options were assigned, 883,495 of which to the Chief Executive Officer.
Under Wave 2 (vesting period from 16 July 2014 to 15 July 2017), a total of 2,864,467 options were assigned, 565,217 of which to the Chief Executive Officer.
An independent external advisor has been engaged to calculate the fair value of the Phantom stock options, based on the value of shares on the grant date, volatility, estimated dividend payments, the term of the plan and the risk-free rate of return. The calculation was performed using the binomial method.
For 2014, the total costs recognized for this plan amounted to E 1,306k.
Thorough information on 2014 Phantom Stock Option Plan is provided in the Information Document prepared in accordance with art. 84-bis (1) and Annex 3A (Schedule 7) of Consob Regulation 11971/1999, which is available to the public at www.autogrill.com.
2.2.14 Significant non-recurring events and transactions
In 2014, there were no significant non-recurring events or transactions as defined by Consob Resolution 15519 of 27 July 2006 and Consob Communication DEM/6064293 of 28 July 2006.
2.2.15 Atypical or unusual transactionsIn 2014 there were no atypical and/or unusual transactions as defined by Consob Communication DEM/6064293 of 28 July 2006.
2.2.16 Events after the reporting periodSince 31 December 2014, no events have occurred that would have entailed an adjustment to the figures in the financial statements or required additional disclosures in these Notes.
On 28 February 2015 Autogrill S.p.A. transferred to World Duty Free Group the Travel Retail activities operated by HMSHost at the Atlanta and Oakland airports and at the Empire State Building in New York. The transfer completes HMSHost Corp.’s sale of its travel retail operations at US airports to World Duty Free Group, as announced to the market on 6 September 2013. The price agreed for the remaining operations was $ 19m.

2014 Annual Report
137
2.2
Not
es to
the
cons
olid
ated
fina
ncia
l sta
tem
ents2.2.17 Information pursuant to arts. 70 and 71
of Consob Regulation no. 11971/1999On 24 January 2013 the Board of Directors of Autogrill S.p.A. voted to take the option provided for by Consob Resolution 18079 of 20 January 2012 that removes the obligation to make available to the public the disclosure documents required by arts. 70 and 71 of the Listing Rules (Consob Regulation 11971/1999) in the case of significant mergers, demergers, increases in share capital through contributions in kind, acquisitions and disposal.
2.2.18 Authorization for publicationThe Board of Directors authorized the publication of these consolidated financial statements at its meeting of 12 March 2015.

Autogrill Group
138
2. Consolidated financial statem
ents
AnnexesList of consolidated companies and other investments
Company Registered office CurrencyShare/
quota capital% held at
31.12.2014 Shareholders/quota holders
Parent:
Autogrill S.p.A. Novara Euro 68,688,000 50.100% Schematrentaquattro S.p.A.
Companies consolidated line-by-line:
Nuova Sidap S.r.l. Novara Euro 100,000 100.000% Autogrill S.p.A.
Autogrill Austria A.G. Gottlesbrunn Euro 7,500,000 100.000% Autogrill S.p.A.
Autogrill Czech S.r.o. Prague Czk 154,463,000 100.000% Autogrill S.p.A.
Autogrill D.o.o. Ljubljana Euro 1,342,670 100.000% Autogrill S.p.A.
Autogrill Hellas E.P.E. Avlonas Euro 3,696,330 100.000% Autogrill S.p.A.
Autogrill Polska Sp.zo.o. Katowice Pln 14,050,000 100.000% Autogrill S.p.A.
Autogrill Iberia S.L.U. Madrid Euro 7,000,000 100.000% Autogrill S.p.A.
HMSHost Ireland Ltd. Cork Euro 13,600,000 100.000% Autogrill S.p.A.
HMSHost Sweden A.B. Stockholm Sek 2,500,000 100.000% Autogrill S.p.A.
Autogrill Deutschland GmbH Munich Euro 205,000 100.000% Autogrill S.p.A.
Autogrill Catering UK Ltd. London Gbp 217,063 100.000% Autogrill S.p.A.
Restair UK Ltd. (in liquidation) London Gbp 1 100.000% Autogrill Catering UK Ltd.
Autogrill Belux N.V. Antwerp Euro 10,000,000 99.990% Autogrill S.p.A.
0.010% AC Restaurants & Hotels Beheer N.V.
AC Restaurants & Hotels Beheer N.V. Antwerp Euro 3,250,000 99.990% Autogrill Belux N.V
0.010% Autogrill Nederland B.V.
Autogrill Schweiz A.G. Olten Chf 23,183,000 100.000% Autogrill S.p.A.
Restoroute de Bavois S.A. Bavois Chf 2,000,000 73.000% Autogrill Schweiz A.G.
Restoroute de la Gruyère S.A. Pont-en-Ogoz Chf 1,500,000 54.330% Autogrill Schweiz A.G.
Autogrill Nederland B.V. Oosterhout Euro 41,371,500 100.000% Autogrill S.p.A
Autogrill Nederland Hotels B.V. Oosterhout Euro 1,500,000 100.000% Autogrill Nederland B.V.
Autogrill Nederland Hotel Amsterdam B.V. Oosterhout Euro 150,000 100.000% Autogrill Nederland B.V.
Holding de Participations Autogrill S.a.s. Marseille Euro 84,581,920 100.000% Autogrill S.p.A.
Autogrill Aéroports S.a.s. Marseille Euro 2,207,344 100.000% Holding de Participations Autogrill S.a.s.
Autogrill Coté France S.a.s. Marseille Euro 31,579,526 100.000% Holding de Participations Autogrill S.a.s.
Société Berrichonne de Restauration S.a.s. (Soberest)
Marseille Euro 288,000 50.005% Autogrill Coté France S.a.s.
Société Porte de Champagne S.A. (SPC) Perrogney-les-Fontaines
Euro 153,600 53.440% Autogrill Coté France S.a.s.
Société de Restauration de Bourgogne S.a.s. (Sorebo)
Marseille Euro 144,000 50.000% Autogrill Coté France S.a.s.
Société de Restauration de Troyes-Champagne S.A. (SRTC)
Marseille Euro 1,440,000 70.000% Autogrill Coté France S.a.s.

2014 Annual Report
139
Ann
exes
Company Registered office CurrencyShare/
quota capital% held at
31.12.2014 Shareholders/quota holders
Volcarest S.A. Champs Euro 1,050,144 50.000% Autogrill Coté France S.a.s.
Autogrill Restauration Services S.a.s. Marseille Euro 15,394,500 100.000% Holding de Participations Autogrill S.a.s.
Autogrill Gares Métropoles S.àr.l. Marseille Euro 4,500,000 100.000% Autogrill Restauration Services S.a.s.
Autogrill Restauration Carrousel S.a.s. Marseille Euro 2,337,000 100.000% Holding de Participations Autogrill S.a.s.
Société de Gestion Pétrolière Autogrill S.àr.l. (SGPA)
Marseille Euro 8,000 100.000% Autogrill Coté France S.a.s.
Autogrill Commercial Catering France S.àr.l. (in liquidation)
Marseille Euro 361,088 100.000% Holding de Participations Autogrill S.a.s.
Autogrill FFH Autoroutes S.àr.l. Marseille Euro 375,000 100.000% Autogrill Coté France S.a.s.
Autogrill FFH Centres Villes S.àr.l. Marseille Euro 375,000 100.000% Autogrill Restauration Carrousel S.a.s.
Carestel Nord S.àr.l. (in liquidation) Marseille Euro 76,225 99.800% Autogrill Commercial Catering France S.a.s.
HMSHost Corporation Delaware Usd - 100.000% Autogrill S.p.A.
HMSHost International, Inc. Delaware Usd - 100.000% HMSHost Corporation
HMSHost USA, LLC Delaware Usd - 100.000% HMSHost Corporation
Host International, Inc. Delaware Usd - 100.000% HMSHost Corporation
HMSHost Tollroads Inc. Delaware Usd - 100.000% HMSHost Corporation
HMS Airport Terminal Services, Inc. Delaware Usd 1,000 100.000% Host International, Inc.
Host International of Maryland, Inc. Maryland Usd 1,000 100.000% Host International, Inc.
Michigan Host, Inc. Delaware Usd 1,000 100.000% Host International, Inc.
Host Services of New York, Inc. Delaware Usd 1,000 100.000% Host International, Inc.
Host International of Kansas, Inc. Kansas Usd 1,000 100.000% Host International, Inc.
Host Services Inc. Texas Usd - 100.000% Host International, Inc.
HMSHost USA, Inc. Delaware Usd - 100.000% Host International, Inc.
Anton Airfood of Cincinnati, Inc. Kentucky Usd - 100.000% Anton Airfood, Inc.
Anton Airfood, Inc. Delaware Usd 1,000 100.000% HMSHost Corporation
Anton Airfood of Texas, Inc. Texas Usd - 100.000% Anton Airfood, Inc.
Anton Airfood of Newark, Inc. New Jersey Usd - 100.000% Anton Airfood, Inc.
Anton Airfood of JFK, Inc. New York Usd - 100.000% Anton Airfood, Inc.
Anton Airfood of Minnesota, Inc. Minnesota Usd - 100.000% Anton Airfood, Inc.
Palm Springs AAI, Inc. California Usd - 100.000% Anton Airfood, Inc.
Fresno AAI, Inc. California Usd - 100.000% Anton Airfood, Inc.
Anton Airfood of Seattle, Inc. Washington Usd - 100.000% Anton Airfood, Inc.
Anton Airfood of Tulsa,Inc. Oklahoma Usd - 100.000% Anton Airfood, Inc.
Islip AAI, Inc. New York Usd - 100.000% Anton Airfood, Inc.
Host International (Poland) Sp.zo.o. (in liquidation)
Warsaw Usd - 100.000% Host International, Inc.

Autogrill Group
140
2. Consolidated financial statem
ents
Company Registered office CurrencyShare/
quota capital% held at
31.12.2014 Shareholders/quota holders
Shenzhen Host Catering Company, Ltd. (in liquidation)
Shenzhen Usd - 100.000% Host International, Inc.
Host Services Pty, Ltd. North Cairns Aud 6,252,872 100.000% Host International, Inc.
Host International of Canada, Ltd. Vancouver Cad 75,351,237 100.000% Host International, Inc.
Marriott Airport Concessions Pty, Ltd. North Cairns Aud 3,910,102 100.000% Host International, Inc.
HMSHost Services India Private, Ltd. Balgalore Inr 668,441,680 99.990% Host International, Inc.
0.010% HMSHost International, Inc.
HMSHost Singapore Private, Ltd. Singapore Sgd 8,470,896 100.000% Host International, Inc.
Host (Malaysia) Sdn.Bhd. Kuala Lumpur Myr - 100.000% Host International, Inc.
HMSHost New Zealand Ltd. Auckland Nzd 1,520,048 100.000% Host International, Inc.
HMSHost (Shanghai) Enterprise Management Consulting Co., Ltd.
Shanghai Cny - 100.000% Host International, Inc.
HMSHost International B.V. Haarlemmermeer Euro 18,090 100.000% Host International, Inc.
Horeca Exploitatie Maatschappij Schiphol, B.V.
Haarlemmermeer Euro 45,400 100.000% HMSHost International B.V.
HMSHost Yiyecek Ve Icecek Hizmetleri A.S. Istanbul Trl 50,000 100.000% HMSHost International B.V.
Autogrill VFS F&B Co. Ltd. Ho Chi Minh City Euro 5,000,000 70.000% HMSHost International B.V.
HMSHost (Shanghai) Catering Management Co., Ltd.
Shanghai Rmb 7,140,000 100.000% HMSHost International B.V.
HMSHost Hospitality Services Bharath Private, Ltd. Karnataka Inr 500,000 99.000% HMSHost Services India Private Ltd
1.000% Host International, Inc.
NAG B.V. Haarlemmermeer Euro 100 60.000% HMSHost International B.V.
Autogrill Russia LLC St. Petersburg Rub 10,000 100.000% NAG B.V.
HMSHost Finland Oy Helsinki Euro 2,500 100.000% HMSHost International B.V.
PT Autogrill Taurus Gemilang Indonesia Jakarta Euro 1,000,000 49.000% HMSHost International B.V.
HMSHost Nederland B.V. Haarlemmermeer Euro 100 100.000% HMSHost International B.V.
Host-Chelsea Joint Venture #3 Texas Usd - 63.800% Host International, Inc.
Host Bush Lubbock Airport Joint Venture Texas Usd - 90.000% Host International, Inc.
Host/Diversified Joint Venture Michigan Usd 63 90.000% Host International, Inc.
Airside C F&B Joint Venture Florida Usd - 70.000% Host International, Inc.
Host of Kahului Joint Venture Company Hawaii Usd - 90.000% Host International, Inc.
Host/Coffee Star Joint Venture Texas Usd - 50.010% Host International, Inc.
Southwest Florida Airport Joint Venture Florida Usd - 78.000% Host International, Inc.
Host Honolulu Joint Venture Company Hawaii Usd - 90.000% Host International, Inc.
Host/Forum Joint Venture Baltimore Usd - 70.000% Host International, Inc.
HMS/Blue Ginger Joint Venture Texas Usd - 55.000% Host International, Inc.
Host/Java Star Joint Venture Texas Usd - 50.010% Host International, Inc.
Host & Garrett Joint Venture Mississippi Usd - 75.000% Host International, Inc.
Tinsley/Host - Tampa Joint Venture Company Florida Usd - 49.000% Host International, Inc.
Host-Chelsea Joint Venture #1 Texas Usd - 65.000% Host International, Inc.
Host-Tinsley Joint Venture Florida Usd - 84.000% Host International, Inc.
Host/Tarra Enterprises Joint Venture Florida Usd - 75.000% Host International, Inc.
Host/LJA Joint Venture Missouri Usd - 85.000% Host International, Inc.
Seattle Restaurant Associates Olympia Usd - 70.000% Host International, Inc.
Bay Area Restaurant Group California Usd - 49.000% Host International, Inc.

2014 Annual Report
141
Ann
exes
Company Registered office CurrencyShare/
quota capital% held at
31.12.2014 Shareholders/quota holders
Islip Airport Joint Venture New York Usd - 50.000% Anton Airfood, Inc.
HMSHost Coffee Partners Joint Venture Texas Usd - 50.010% Host International, Inc.
Host/JV Ventures McCarran Joint Venture Nevada Usd - 60.000% Host International, Inc.
Host/Howell - Mickens Joint Venture Texas Usd - 65.000% Host International, Inc.
Miami Airport FB Partners Joint Venture Florida Usd - 70.000% Host International, Inc.
HSTA JV Atlanta Usd - 60.000% Host International, Inc.
Host PJJD Jacksonville Joint Venture Florida Usd - 51.000% Host International, Inc.
Host/JQ RDU Joint Venture North Carolina Usd - 75.000% Host International, Inc.
Host CTI Denver Airport Joint Venture Colorado Usd - 90.000% Host International, Inc.
HMS - D/FW Airport Joint Venture Texas Usd - 65.000% Host International, Inc.
HMS - Dallas Fort Worth Airport Joint Venture No. II
Texas Usd - 75.000% Host International, Inc.
Host-Prose Joint Venture III Richmond Usd - 51.000% Host International, Inc.
Host Adevco Joint Venture Arkansas Usd - 70.000% Host International, Inc.
Host Shellis Atlanta Joint Venture Atlanta Usd - 70.000% Host International, Inc.
Host-TFC-RSL, LLC Kentucky Usd - 65.000% Host International, Inc.
Host -Chelsea Joint Venture #4 Texas Usd - 63.000% Host International, Inc.
Host-CMS SAN F&B, LLC Delaware Usd - 65.000% Host WAB SAN FB, LLC
Host GRL LIH F&B, LLC Delaware Usd - 85.000% Host International, Inc.
Host Fox PHX F&B, LLC Delaware Usd - 75.000% Host International, Inc.
Host FDY ORF F&B, LLC Delaware Usd - 90.000% Host International, Inc.
LTL ATL JV, LLC Delaware Usd - 70.000% Host International, Inc.
Host ATLChefs JV 3, LLC Delaware Usd - 95.000% Host International, Inc.
Host ATLChefs JV 5, LLC Delaware Usd - 85.000% Host International, Inc.
Host LGO PHX F&B, LLC Delaware Usd - 80.000% Host International, Inc.
Host H8 Terminal E F&B, LLC Delaware Usd - 60.000% Host International, Inc.
Host-Love Field Partners I, LLC Delaware Usd - 51.000% Host International, Inc.
Host-True Flavors SAT Terminal A FB Delaware Usd - 65.000% Host International, Inc.
Host Havana LAX F&B, LLC Delaware Usd - 90.000% Host International, Inc.
Host-CTI DEN F&B II, LLC Delaware Usd - 80.000% Host International, Inc.
Host TCC BHM F&B LLC Delaware Usd - 70.000% Host International, Inc.
Host Lee JAX FB, LLC Delaware Usd - 70.000% Host International, Inc.
Host/DFW AF, LLC Delaware Usd - 50.010% Host International, Inc.
Host Havana LAX TBIT FB, LLC Delaware Usd - 70.000% Host International, Inc.
Host Houston 8 IAH Terminal B, LLC Delaware Usd - 60.000% Host International, Inc.
HHL Cole’s LAX F&B, LLC Delaware Usd - 80.000% Host International, Inc.
Host CMS LAX TBIT F&B, LLC Delaware Usd - 70.000% Host International, Inc.
Host WAB SAN FB, LLC Delaware Usd - 95.000% Host International, Inc.
Host JQE RDU Prime, LLC Delaware Usd - 85.000% Host International, Inc.
Host Howell Terminal A F&B, LLC Delaware Usd - 65.000% Host International, Inc.
Host MCA TEI FLL FB, LLC Delaware Usd - 76.000% Host International, Inc.
Host MCA SRQ FB, LLC Delaware Usd - 90.000% Host International, Inc.
HOST ECI ORD FB, LLC Delaware Usd - 51.000% Host International, Inc.
WDFG TAC ATL Retail, LLC Delaware Usd - 86.000% Host International, Inc.

Autogrill Group
142
2. Consolidated financial statem
ents
Company Registered office CurrencyShare/
quota capital% held at
31.12.2014 Shareholders/quota holders
Host MGV IAD FB, LLC Delaware Usd - 65.000% Host International, Inc.
Host MGV DCA FB, LLC Delaware Usd - 80.000% Host International, Inc.
HMSHost Family Restaurants, Inc. Maryland Usd 2,000 100.000% Host International, Inc.
SMSI Travel Centres, Inc. Vancouver Cad 10,800,100 100.000% Host International of Canada, Ltd.
HMSHost Family Restaurants, LLC Delaware Usd - 100.000% HMS Host Family Restaurants, Inc.
HMSHost Motorways L.P. Winnipeg Cad - 99.9999% SMSI Travel Centres, Inc.
0.0001% HMSHost Motorways, Inc.
HMSHost Motorways, Inc. Vancouver Cad - 100.000% SMSI Travel Centres, Inc.
HK Travel Centres GP, Inc. Toronto Cad - 51.000% HMSHost Motorways, Inc.
HK Travel Centres L.P. Winnipeg Cad - 50.9999% HMSHost Motorways L.P.
0.0001% HK Travel Centres GP, Inc.
Host of Hartford, Ltd. Connecticut Usd - 75.000% Host International, Inc.
Host Solai MDW FB LLC Delaware Usd - 67.000% Host International, Inc.
Host D&D STL FB, LLC Missouri Usd - 75.000% Host International, Inc.
Host CTI DEN F&B STA, LLC Delaware Usd - 80.000% Host International, Inc.
Host Aranza Howell DFW B&E FB, LLC Delaware Usd - 55.000% Host International, Inc.
Host-DMV DTW FB, LLC (in liquidation) Michigan Usd - 79.000% Host International, Inc.
Companies consolidated using the equity method:
Caresquick N.V. Antwerp Euro 3,300,000 50.000% Autogrill Belux N.V.
Autogrill Middle East, LLC Abu Dhabi Aed 100,000 49.000% HMSHost International B.V.
Dewina Host Sdn. Bhd. Kuala Lumpur Myr 250,000 49.000% Host International, Inc.
HKSC Opco L.P. Winnipeg Cad - 49.000% HMSHost Motorways LP
HKSC Developments L.P. Winnipeg Cad - 49.000% HMSHost Motorways LP
Host Kilmer Service Centres, Inc. Toronto Cad 100 100.000% HKSC Developments L.P.

2014 Annual Report
143
Ann
exes
Certification by the CEO and manager in charge of financial reportingCertification of the consolidated financial statements pursuant to art. 81-ter of Consob Regulation 11971 of 14 May 1999 (as amended)
1. We, the undersigned, Gianmario Tondato Da Ruos as Chief Executive Officer and Alberto De Vecchi as manager in charge of financial reporting of Autogrill S.p.A., hereby declare, including in accordance with art. 154-bis (3) and (4) of Legislative Decree no. 58 of 24 February 1998:• the adequacy of, in relation to the characteristics of the business; and • due compliance with the administrative and accounting procedures for the preparation of the
consolidated financial statements during the course of 2014.
2. No significant findings have come to light in this respect.
3. We also confirm that:3.1 the consolidated financial statements:
a) have been prepared in accordance with the applicable International Financial Reporting Standards endorsed by the European Union pursuant to EC Regulation 1606/2002 of the European Parliament and the Council of 19 July 2002;
b) correspond to the ledgers and accounting entries; c) provide a true and fair view of the financial position, results of operations and cash flows of
Autogrill S.p.A. and of companies included in the consolidation;3.2 the directors’ report includes a reliable description of the performance and financial position of the
issuer and the entities in the scope of consolidation, along with the main risks and uncertainties to which they are exposed.
Milan, 12 March 2015
Gianmario Tondato Da Ruos Alberto De VecchiChief Executive Officer Manager in Charge of Financial Reporting

Autogrill Group
144
2. Consolidated financial statem
ents
External Auditors’ Report

2014 Annual Report
145
Ann
exes

Autogrill S.p.A.Registered officeVia Luigi Giulietti 928100 Novara - Italy
Share capital: E 68,688,000 fully paid-inTax Code – Novara Registrar of Companies: 03091940266VAT no.: 01630730032
HeadquartersCentro Direzionale MilanofioriPalazzo Z, Strada 520089 Rozzano (MI) - Italy
Group Corporate CommunicationsTelephone (+39) 02 48263250
Investor RelationsTelephone (+39) 02 48263250
Group Corporate Affairs (to request copies)Telephone (+39) 02 48263393
website: www.autogrill.com
Co-ordinationzero3zero9 - Milan
DesignInarea - Rome
Layoutst&t - Milan
PrintingGrafiche Antiga (TV)Printed on PSC paperHeaven 42 - Scheufelen
Printed on May 2015

Gruppo A
utogrill
www.autogrill.com
seguici su