autism prevalence in china is ... - molecular autism
TRANSCRIPT

RESEARCH Open Access
Autism prevalence in China is comparableto Western prevalenceXiang Sun1,2,3*, Carrie Allison2, Liping Wei4,5, Fiona E. Matthews6, Bonnie Auyeung2,7, Yu Yu Wu8, Sian Griffiths9,Jie Zhang4, Simon Baron-Cohen2† and Carol Brayne1†
Abstract
Background: Autism prevalence in the West is approximately 1% of school age children. Autism prevalence in Chinahas been reported to be lower than in the West. This is likely due to at least two reasons: (1) most studies in China onlyincluded the special school population, overlooking the mainstream school population; and (2) most studies in Chinahave not used contemporary screening and diagnostic methods. To address this, we tested total autism prevalence(mainstream and special schools) in Jilin City, and mainstream school autism prevalence in Jiamusi and Shenzhen cities.
Methods: The study included a three-step process: (1) screening; (2) clinical assessment of ‘screen positives’ pluscontrols; and (3) research diagnostic assessment of those meeting clinical threshold for concerns at step 2. Prevalenceestimates per 10,000 children aged 6–10 years old were weighted for study design using diagnostic criteria applied atthe research assessment stage.
Results: In Jilin City, 77 cases of autism were identified from a total population of 7258, equating to a prevalence of 108per 10,000 (95% confidence interval (CI) 89, 130). In Shenzhen City: 21,420 children were screened and 35 cases of autismwere identified, resulting in a mainstream prevalence of 42 per 10,000 (95% CI 20–89). In Jiamusi City, 16,358 childrenwere screened, with 10 autism cases being identified, with a mainstream prevalence of 19 per 10,000 (95% CI 10–38).
Conclusions: Results from Jilin City, where both mainstream and special school data were available, revealed asimilar prevalence of autism in China to the West, at around 1%. Results from Shenzhen and Jiamusi cities,where only mainstream data were available, prevalence is also in line with Western estimates. In all threecities, new cases of autism were identified by the study in mainstream schools, reflecting current under-diagnosis.Non-significant variation across different cities is seen indicating the need to explore potential variation of autismacross diverse Chinese regions with large sample sizes to achieve a fully robust national picture.
Keywords: Autism, Screening, Diagnosis, Prevalence, Children, China
IntroductionAutism spectrum conditions (henceforth autism) are char-acterised by impairments in social interaction and com-munication, alongside the presence of unusually repetitivebehaviour and narrow interests, difficulties adjusting tounexpected change, and sensory hyper-sensitivity [1]. Theautism spectrum includes marked heterogeneity in
intelligence and language development. Population-basedepidemiological studies in the West have reported in-creases in the prevalence of autism over time, rangingfrom 30.8 per 10,000 in 2000 [2], to 157 per 10,000 in2009 [3] to 169 per 10,000 in 2018 [4].Autism was first described in Western cultures, and only
later recognised in Asian countries [5]. Understanding theprevalence of autism in Asian countries is important be-cause of its relevance to service planning, and for our un-derstanding of the genetic and environmental contributingfactors of autism in diverse populations. In a South Koreanstudy in 2011, autism population prevalence was reportedto be 264 per 10,000 and 189 per 10,000 (95% CI 143–236)in mainstream schools [6]. This high estimate may have
* Correspondence: [email protected] Baron-Cohen and Carol Brayne are joint senior authors.1Cambridge Institute of Public Health, Department of Public Health andPrimary Care, University of Cambridge, Forvie Site, Robinson Way, CambridgeCB2 0SR, UK2Autism Research Centre, Department of Psychiatry, University of Cambridge,Douglas House, 18b Trumpington Road, Cambridge CB2 2AH, UKFull list of author information is available at the end of the article
© The Author(s). 2019 Open Access This article is distributed under the terms of the Creative Commons Attribution 4.0International License (http://creativecommons.org/licenses/by/4.0/), which permits unrestricted use, distribution, andreproduction in any medium, provided you give appropriate credit to the original author(s) and the source, provide a link tothe Creative Commons license, and indicate if changes were made. The Creative Commons Public Domain Dedication waiver(http://creativecommons.org/publicdomain/zero/1.0/) applies to the data made available in this article, unless otherwise stated.
Sun et al. Molecular Autism (2019) 10:7 https://doi.org/10.1186/s13229-018-0246-0

resulted from the particular screening and assessment in-struments used [7]. In China, most prevalence studies ofautism have only focused on one subtype, that is, childrenwith autism who have intellectual disability, omitting chil-dren without intellectual disability, including those whomay previously have been diagnosed with Asperger syn-drome (Appendix 1). This is despite the fact that 75% ofthe autism spectrum does not have intellectual disability [4,8]. A systematic review reported the prevalence of autismin Mainland China, Hong Kong, and Taiwan to be 26.6 per10,000 [8]. A recent review reported the pooled prevalenceof autism in China was 39.23 per 10,000 [9], which is sig-nificantly lower than estimates from the West, suggestingthe possibility of under-diagnosis. The current study teststwo possible reasons for this lower autism prevalence inChina, namely, that in many studies (1) autism in main-stream schools was overlooked; and (2) contemporaryscreening and diagnostic methods were not used.This study focuses on mainstream schools because the
Sui Ban Jiu Du policy encourages children with disabilitiesto attend mainstream school [10], although in practice chil-dren with moderate to severe autism are rarely enrolled inmainstream schools [11]. We have previously reported anautism prevalence estimate in mainstream primary schoolsin Beijing of 119 per 10,000 (95% CI 53, 265) [14] which isin line with Western autism prevalence estimates. We useda validated screening tool, the Childhood Autism SpectrumTest (CAST), and two research diagnostic assessment tools,
the Autism Diagnostic Observation Schedule (ADOS) [12],and the Autism Diagnostic Interview-Revised (ADI-R) [13].Most of the children identified in this study using thesecontemporary screening and diagnostic measures had notpreviously received an autism diagnosis, confirming under-diagnosis of autism in mainstream schools.Here, we report initial data from the China SCORE
(Social Communication Research and Epidemiology)study, which aims to compare autism prevalence inChina with estimates from the West. First, we reporttotal autism prevalence (mainstream and special schools)in Jilin City. Second, we report autism prevalence inmainstream schools only in Shenzhen and Jiamusi cities.We replicate just the mainstream prevalence in thesetwo cities, because mainstream prevalence has been soneglected in previous studies in China (see Fig. 1).
MethodsScreening instrumentThe CAST is a 37-item parent-completed questionnaire,of which 31 items are scored. Thus, the total scoreranges from 0 to 31. It was originally validated in theUK [15–19]. It has also been used in genetic studies[20]. A Mandarin translation of the CAST has been usedto determine that using a cut-off of 15 (sensitivity = 84%,specificity = 96%), the Mandarin CAST can be used as ascreening instrument in population-based epidemio-logical research for autism in China [21].
Fig. 1 Location of three cities in China studied in phase I of the China SCORE study
Sun et al. Molecular Autism (2019) 10:7 Page 2 of 19

Population sampleWe screened children attending mainstream primaryschools in the three cities. By definition, they are not thechildren reported in previous prevalence studies of childrenwith autism in China attending special education schools.The inclusion criteria for selecting each of the three citieswere as follows: the city should have (1) a median economiclevel (neither extremely affluent nor extremely poor); (2)an approximate sample size of 20,000 children aged 6 to10 years old (children should not have had their 11thbirthday at the time of the study); (3) a professional capacityto participate; (4) a median population mobility. These datawere obtained from the National Statistics Bureau (http://www.stats.gov.cn/english/). Children in Mainland China areonly admitted to primary school after their sixth birthday.In mainstream schools, grades 1 to 4 represent the agegroup 6 to 10 years old. Three cities met these criteria.In Jilin City, all mainstream schools (N = 14) and special
schools from special education (N = 3) in Fengman Dis-trict for children aged 6–10 were invited, and all agreed toparticipate in the study. The local residence records wereassessed and tracked for children with an autism diagnosiswho did not attend school in the target age range.In Shenzhen City, there are six administrative districts.
Longgang District was selected for this study and out ofthe 11 communities in this district, 7 agreed to participate.There are 45 mainstream schools within these 7 commu-nities, all of which agreed to participate. All caregivers ofchildren in grades 1 to 4 were invited to participate inDecember 2013, representing a population of 20,553.In Heilongjiang province, Jiamusi City was selected.
Twenty-seven mainstream primary schools in Jiamusi Citywere invited, and all agreed to participate, representing apopulation of 16,358 in grades 1 to 4 in Jiamusi City. Nospecial schools in Shenzhen and Jiamusi cities are includedin this report.
Case identification (diagnostic methods)Most Western autism prevalence studies (e.g. US and UK)conducted standardized diagnostic instruments (ADOSand ADI-R) together with clinical diagnosis. In previousChinese prevalence studies, clinical diagnosis was adoptedas the gold standard. In order to be comparable with theseexisting studies, both diagnostic approaches were adoptedin this study. This was in part to make sure that we cap-tured all possible cases using a standardized protocolacross each city. The study was conducted in 3 steps:
Step 1: ScreeningIn all three cities in December 2013, the principals ofthe participating schools were contacted and a screeningpackage was provided to the head teachers of classes ingrades 1 to 5 to distribute via students for their parentsto complete at home. Screening data collection and data
entry in Shenzhen City took 1 month to complete. InJiamusi, it took over 3 months to complete. One percentof the data were double entered to quality control thedata entry. A report was provided for all CAST itemswhich were wrongly entered (enter value other than 0 or1 or missing). If questionnaires missed more than fivescorable items, parents were contacted and asked tocomplete the CAST a second time. A randomly selected1% of questionnaires were checked for consistency indata entry compared to the hard copy questionnaires.Data entry was repeated if there was less than 95%agreement between the hard copy and the electronicdata entry.
Step 2: Clinical assessmentFollowing quality checks on the data entry, all children inthe high-score group (CAST ≥15) were invited for a fur-ther assessment. Five percent of children in the borderlinegroup (CAST 12–14) were randomly selected and invitedfor a further assessment. If participation in the borderlinegroup was less than 50%, another random sample of 10%of this borderline group was invited. In order to maximisethe identification of children with autism in the low-scoregroup (CAST ≤11), the school psychologists were asked toselect children for a further assessment if they had previ-ous concerns about the child’s behaviour. The clinical as-sessment team was blind to the screening status of all thechildren during the assessment.A maximum of 30 children from each school in the
low-score group were invited by the school psychologists.This was due to the variability of uptake for the clinical as-sessment in the low-score group and the variable resourceavailability in different regions. Thus, each grade could haveinvited a maximum of eight children. Participating familieswere offered incentives (100 RMB) for taking part in theclinical assessment. DSM-IV-TR and DSM-5 were the clin-ical diagnostic criteria used in this study by the child psy-chiatrists. The clinical assessment team comprised childpsychiatrists with expertise in autism, who were approvedby the China Disabled Persons’ Federation (CDPF).Agreement between clinicians of diagnostic outcome
was established in three stages. First, CDPF in each cityrecommended child psychiatrists with expertise in diag-nosing children with autism. Second, a core clinical expertteam developed a diagnostic agreement test for child psy-chiatrists. We invited six child psychiatrists considered tobe the most experienced in the diagnosis of autism inMainland China to develop a test of diagnostic agreement.Ten children aged six to 10 years old in Shenzhen in April2014 were selected, comprising N = 8 children with aut-ism, N = 1 child with other developmental difficulties notrelated to autism and N = 1 neurotypical child. They wereinitially assessed by the first author and their diagnosesconfirmed using the ADOS and ADI-R.
Sun et al. Molecular Autism (2019) 10:7 Page 3 of 19

Second, they were randomly assigned to, and assessedindependently by, the six child psychiatrists. When onechild psychiatrist conducted a clinical interview, anotherpsychiatrist observed. The diagnoses of the 10 childrenwere discussed and agreed between the first author andthe six child psychiatrists. This process was video recordedand edited to produce a training DVD for other child psy-chiatrists to use to establish diagnostic agreement.Finally, the clinical experts completed the diagnostic
agreement test and joined the clinical assessment team ifs/he achieved diagnostic agreement of 80% or above.This standardised clinical diagnostic protocol was estab-
lished in order to ensure reliability of the clinical diagnosisacross each region. The clinical assessments consisted ofthree parts: a face-to-face interview with parents; direct ob-servation and communication with the child using toys;and questions relating to the child’s general development,together with completing the diagnostic forms. Two stan-dardised diagnostic forms were provided to each childpsychiatrist. One was the DSM-IV-TR criteria and the otherwas DSM-5 criteria. A third document was a supplemen-tary question list based on examples from DSM-5 andDSM-IV-TR items. These questions were drawn from theADI-R. This document was provided as a guide for possiblequestions to enquire about, but was not compulsory for thepsychiatrists to use. The final clinical diagnosis was made inthree categories: autism, suspected autism, and not-autism.The psychiatrist was asked to provide notes on the diagnos-tic form if they believed the child to have a developmentalcondition that was not related to autism.
Step 3: Research diagnostic assessmentsAfter the clinical assessment (step 2), children whose clin-ical diagnostic outcome was autism or suspected of autismwere invited for a research diagnostic assessment usingthe ADOS, the ADI-R. A measure of IQ was obtainedusing the Raven Progress Matrix (RPM) [16]. The Chineseversion of the RPM was used, which is a validated measureand applicable to individuals from the age of 5 to 75 inMainland China [23]. Ten children in Shenzhen Citywhose clinical diagnostic outcome was not autism werealso randomly selected for a research diagnostic assess-ment to confirm whether there were potential cases ofautism being missed by the clinical diagnostic team.ADOS and the ADI-R were conducted by researchers whohad obtained research reliability prior to the study. Autismcases were defined using a consensus case definition.If the child scored above the cut-offs for autism or
autism spectrum on both the ADOS and the ADI-R, aresearch diagnosis of autism was made. If the childscored on both the ADOS and the ADI-R, or if the childscored above the diagnostic algorithm threshold on eitherthe ADOS or the ADI-R, he or she was referred to a thirdclinical child psychiatrist in the clinical team. The third
child psychiatrist used all information available from theassessment together with clinical judgement and consult-ation with DSM-IV-TR/DSM-5 diagnostic criteria. If therewas any disagreement between the clinical diagnosis andresearch diagnosis (using the ADOS and ADI-R), a finaldiagnosis was made by consensus by the two child psychi-atrists (using DSM-IV-TR and DSM-5) and the researchassessment examiner (using the ADOS and ADI-R). InJilin City, children with autism who were tracked from thelocal residence records were reassessed by child psychia-trists using the ADOS and ADI-R. The final diagnosis ofthese children was made by consensus diagnosis. Moredetailed methods are presented in Additional file 1.
Data analysisThe distribution of CAST scores was examined using theskewness-kurtosis test. The impact of non-participation inthe assessment phase was examined by comparing thecharacteristics of participants who took part in the assess-ment with those who were invited but refused to partici-pate. The randomly selected sample based on the randomnumber table (5%) from the borderline group (12–14) andthe low-score group (≤ 11) who participated in the furtherassessment were compared with those who were not in-vited and who refused to participate separately. Differ-ences between children who participated in the clinicaldiagnosis were examined in two steps.For high and low CAST score groups, differences be-
tween children who did and did not complete the clinicalassessments were examined. For the borderline CAST scoregroup, children were divided into three groups: (1) childrenwho were invited and completed the clinical assessments;(2) children who were invited but did not complete the as-sessments; (3) children who were not invited for a clinicalassessment. The skewness-kurtosis test was used to exam-ine the normality of the score distribution.For ordered categorical or continuous and non-normally
distributed variables, the Mann-Whitney test was used tocompare medians for two groups, while the Kruskal-WallisH test was used for multiple groups. Unpaired t tests andone-way analyses of variance (ANOVA) were adopted tocompare means for normally distributed continuous vari-ables, and the chi-square tests were used to examine differ-ences in proportions for nominal or unordered categoricalvariables. Whenever the numbers were small, a Fishers’exact test was used. All the analyses were conducted usingSTATA 14.0.For all missing values on the CAST, a score of 0 was
given to generate a minimum score. A score of 1 wasgiven to generate a maximum score. A middle score wasgenerated using the equation: (minimum +maximum)/2.Inverse probability weighting using sampling weightswas applied to adjust the prevalence estimates for theknown non-response to the invitation for assessment
Sun et al. Molecular Autism (2019) 10:7 Page 4 of 19

within each sampling score group [2, 3]. This strategywas used because of the two-phase sampling strategy.The inverse probability was the empirical weight gener-ated according to the response to the screen and to theparticipation rate in the further assessment phase. A rawprevalence estimate was generated by first using the in-verse probability weighting. Non-response weights werecalculated between those invited for a clinical assess-ment and those that did not take part, allowing for dif-ferences in response for age, sex, education of theparents, and screening score (including missing item in-formation). Any further non-response from the clinicalassessment to the research assessment was also adjustedfor using inverse probability weighting methods. Missingdata were imputed, and an adjusted prevalence was pro-vided after adjusting for age, sex, and the non-responsedifferences. 95% confidence intervals were calculated ac-cordingly by applying the weighted count.
ResultsJilin City: prevalence estimateThe characteristics of the parents are shown in Table 1. Thestudy population in mainstream schools was 7167 (Fig. 2).Of these, 3282 (45.8%) were boys, 2883 (40.2%) were girls,for the rest 1002 (14.0%), and gender information was miss-ing. The mean age of the sample was 8.5 years old (SD=1.1). Occupational and educational level of the parents wasalso collected and divided into five categories [4].The median score on the CAST was 8 (IQR 5, 11; range 0,
23). Of the 6149 screened children from mainstream schoolswhose data were available for analysis (step 1), 477 (7.8%)were in the high-score group on the CAST (≥ 15), 745(12.1%) were in the borderline group (12–14), and 4927(80.1%) were in the low-score group (≤ 11). All 477 childrenin the high-score group completed the clinical assessment(step 2) (participation rate = 100%). In the borderline group,33 children participated of the 37 invited (89%). Nine chil-dren of the 10 invited in the low-score group participated(90%). Seven children were judged at clinical assessment tohave autism and two were judged to have suspected autism,all of whom were from the high-score group. These ninechildren were invited for a research diagnostic assessment(step 3), and they all received a research diagnosis of autism.Thus, when adjusting for non-response, the prevalence
of autism in mainstream primary schools was 14.6 per10,000 in Jilin City. Mean IQ score for the nine childrenwas 105. Using the same three-step design and methods,68 additional children with autism were found from 91children studied from other settings serving this geo-graphical locality. These included 19 from special schools,43 from private intervention centres, and 6 children fromthe community not attending school. These six childrendid not have the resources to attend any schools or inter-vention centres. Thus, the overall prevalence estimate for
autism in Jilin City (total population prevalence) was108.0 per 10,000 (or 1 in 92) (95% CI 87.0, 135.0).
Shenzhen City: prevalence estimate21,420 out of 21,553 (participation rate = 99.4%) screeningquestionnaires were completed and returned to the studyteam from 45 schools (Fig. 3). Of these, 11,878 (55.5%)were boys and 9312 (43.5%) were girls. None of these chil-dren had a diagnosis of autism before this study. For 230(1.1%), gender was missing. Fifty-five children wereexcluded because they were younger than 6 years old and86 were excluded because they were over 11 years old. Sixwere excluded because their year of birth was illegible. Ofthe 20,802 children (step 1) aged 6 to 10 (97.1%), 1187(5.7%) were in the high-score group on the CAST (scoring≥ 15), 2542 (12.2%) were in the borderline group (scoring12–14), and 17,073 (82.1%) were in the low-score group.In the high-score group, N = 1187 were invited for
assessments, of whom 797 took part in the clinicalassessment (step 2), with 114 referred for a research diag-nostic assessment (step 3). One hundred four of thesecompleted the research diagnostic assessment (91.2%),resulting in 34 children being diagnosed with autism.In the borderline group, a random sample of 5% (123 stu-
dents) were invited for a clinical assessment (step 2) and 70completed (56.9%), with three referred for a research diag-nostic assessment (step 3), all of whom completed. Onechild was diagnosed with autism at the research assessment.In the low-score group, 23 children were identified by
teachers with concerns about their behaviour and under-took the clinical assessment (step 2), of whom 6 werereferred for and undertook the research diagnostic as-sessment (step 3). However, none of these six childrenmet autism diagnostic criteria.The 35 cases confirmed by the research diagnostic
assessment equate to a prevalence of 42.3 per 10,000 chil-dren age 6 to 10 in mainstream education (95% CI 20.1–88.6) after adjusting for non-response (or 1 in 238). Theprevalence estimate for boys was 38.8 (95% CI 26.5–56.7)and girls 44.9 (95% CI 10.1–196) per 10,000. Mean IQ scorewas 114 in these 35 children with autism. More detailed re-sults of clinical and research diagnosis are in Tables 2 and 3.
Jiamusi City: prevalence estimate16,358 questionnaires were distributed to 27 schoolswith children aged 6 to 10 years old (Fig. 4). None ofthese children had a diagnosis of autism before thisstudy. All were returned and available for analysis (par-ticipation rate = 100%). Of these, 8326 (50.9%) were boysand 7853 (48.0%) were girls. For 179 (1.1%), gender wasmissing. Age was within the correct range for 15,663 chil-dren (95.8%). The remaining children were excluded be-cause they were younger than 6 years old (n = 195) or olderthan 11 years (n = 695), or their year of birth was illegible
Sun et al. Molecular Autism (2019) 10:7 Page 5 of 19

Table 1 Characteristics of parents in three cities
Characteristics Category Shenzhen City Jiamusi City Jilin City
Number (%) Number (%) Category Number (%)
Mother’s education Junior high school 6980 33.6 6413 41.5 Junior high school 1522 23.7
High school 8316 40.0 5211 33.7 High school 2009 31.3
College 4872 23.4 3373 21.8 College 2061 32.1
Graduate school 154 0.7 252 1.6 Graduate 276 4.3
Missing 479 2.3 219 1.4 Missing 552 8.6
Father’s education Junior high school 4951 23.8 6092 39.4 Junior high school 1104 17.2
High school 8208 39.5 5337 34.5 High school 1900 29.6
College 6604 31.8 3445 22.3 College 2408 37.5
Graduate school 374 1.8 310 2.0 Master or higher 372 5.8
Missing 665 3.2 284 1.8 Missing 636 9.9
Mother’s occupation Government officer 89 0.4 438 2.8 Worker or farmer 1682 26.2
Company clerk 6173 29.7 1858 12.0 Clerk 1438 22.4
Technical staff 1393 21.7
Industry 1475 7.1 1806 11.7 Manager 161 2.5
Self-employed 5461 26.3 4655 30.1 Own-business 995 15.5
Worker 1578 7.6 1354 8.6 Missing 751 11.7
Student 32 0.2 7 0.1
Farmer 937 4.5 2032 13.1
Unemployed 4002 24.1 3109 20.1
Missing 55 0.3 209 1.4
Father’s occupation Government officer 293 1.4 782 5.1 Worker or farmer 1367 21.3
Company clerk 7518 36.1 1628 10.5 Clerk 1830 28.5
Industry 1836 8.8 1634 10.6 Technical staff 1284 20.0
Self-employed 7617 36.6 5022 32.5 Manager 276 4.3
Worker 1690 8.1 2771 17.9 Own-business 1021 15.9
Missing 642 10.0
Student 10 0.1 5 0.0
Farmer 588 2.8 2071 13.4
Unemployed 1199 5.8 1305 8.4
Missing 51 0.3 250 1.6
Mother’s age ≤ 24 61 0.3 36 0.2
25–30 2552 12.3 1981 12.8
31–34 11,921 57.3 8603 55.6
35–40 4816 23.2 945 6.1
≥ 40 410 2.0 2 0.0
Missing 1042 5.0 3901 25.2
Father’s age ≤ 24 32 0.2 25 0.2
25–30 677 3.3 769 5.0
31–34 10,468 50.3 10,229 66.1
35–40 7577 36.4 1589 10.3
≥ 40 985 4.7 2 0.0
Missing 1063 5.1 3854 18.5
Income ≤ 1999 829 4.0 2699 17.5
Sun et al. Molecular Autism (2019) 10:7 Page 6 of 19

(n = 617). Of the 15,663 children within the age range (6–10), 901 (5.8%) fell in the high-score group (≥ 15), 1822(11.6%) were in the borderline group (12–14) and 12,940(82.6%) were in the low-score group (Appendix 1).In the high-score group, 414 (45.9%) of the invited 901
took part in the clinical assessment (step 2), with 20 referredfor and completing a research diagnostic assessment (100%)(step 3), among whom 9 received a diagnosis of autism.In the borderline group, a random sample of 5% (n = 87)
and a second sample of 10% (n = 181) were invited for aclinical assessment (step 2). One hundred forty-four ofthese completed this assessment (8% response (7/87) fromthe first 5% random sample, and 76% (139/181) from thesecond), within which one child was referred for a
research diagnostic assessment (step 3), but this child didnot meet research diagnostic criteria.In the low-score group, 750 children were identified
by teachers and school psychologists as showing con-cerns, and all received a clinical assessment (step 2), ofwhom three were referred for and completed a researchdiagnostic assessment (step 3), with one child meetingautism diagnostic criteria.The 10 cases equate to a prevalence of 19.0 per 10,000
children age 6–10 (95% CI 9.7–37.5), adjusted fornon-response. The prevalence for boys was 35.9 (95%CI17.4–73.8) and girls 3.2 (95%CI 0.4–22.6) per 10,000.Mean IQ for the 10 children was 116. The large differ-ences seen between Jiamusi and Shenzhen cities did not
Table 1 Characteristics of parents in three cities (Continued)
Characteristics Category Shenzhen City Jiamusi City Jilin City
Number (%) Number (%) Category Number (%)
2000–3999 3355 16.1 5252 34.0
4000–5999 3836 18.4 3880 25.1
6000–7999 3050 14.7 1704 11.0
8000–9999 2389 11.5 569 3.7
≥ 10,000 5399 26.0 569 3.7
Missing 1944 9.4 795 5.1
Fig. 2 Flowchart of Jilin City
Sun et al. Molecular Autism (2019) 10:7 Page 7 of 19

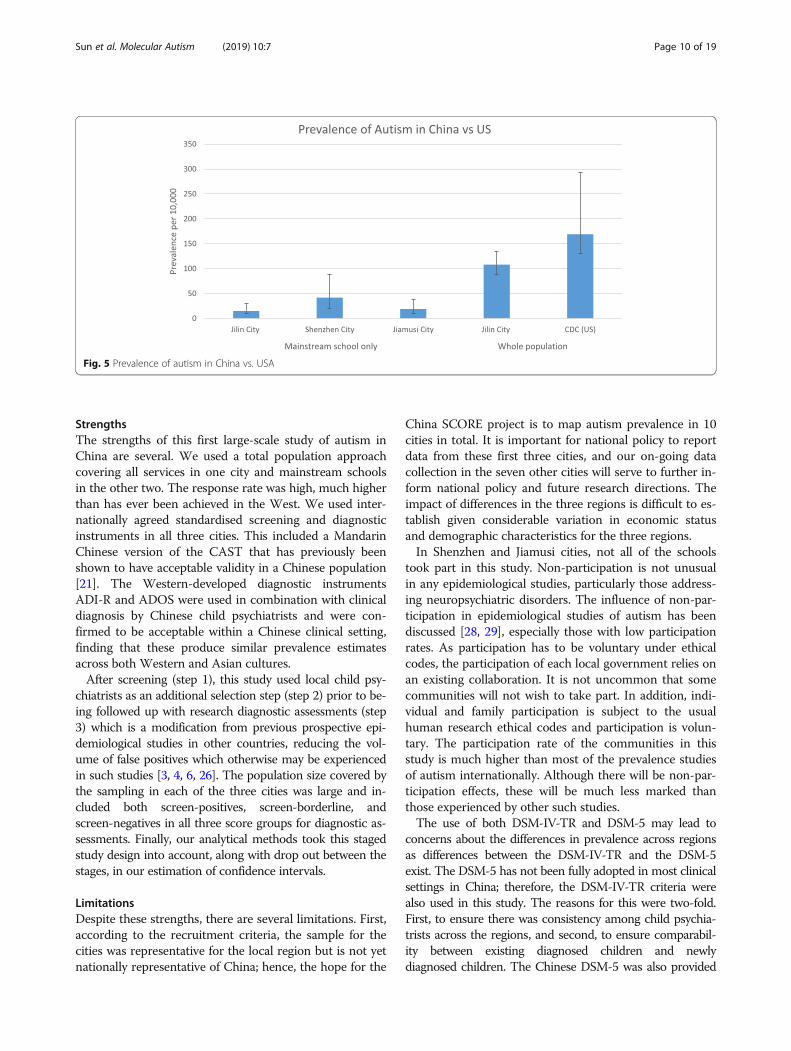
reach statistical significance either as a crude effect(OR = 0.45 95% CI 0.16–1.23, p = 0.12) or after adjustingfor age, sex, income, and education differences betweenthe two regions (OR = 0.39, 95% CI 0.12–1.30, p = 0.13).The results of the three cities are shown in Fig. 5 (withdata from the mainstream schools and from the wholepopulation), together with data from the recent CDCsurvey from the USA for comparison.
Non-respondersIn Shenzhen, non-response to the invitation for a clinicaldiagnosis was related to mother’s education (the higherthe education the less likely the child was to take part,OR = 0.8, p = 0.016). Invited individuals in the borderlinegroup were less likely to respond than those in the high
group (OR = 0.6, p = 0.02). The following variables werenot significantly related to non-response: father’s educa-tion, mother’s or father’s age or occupation, who com-pleted the questionnaire (mother or father), income,being born in the city, age or sex of child (after adjustingfor mother’s education), or CAST score (within groups).However, in Jiamusi, the patterns were slightly different:children were more likely to take part if they were older,and with response differences for both mother’s educa-tion and father’s education, and again with those lesseducated more likely to take part. Income was also inverselyrelated to participation, with those on lowest incomes mostlikely to participate.The following variables were not significantly related
to response rate: mother’s or father’s age, who completed
Fig. 3 Mainstream-school screening in Shenzhen City
Table 2 Clinical and research diagnosis across different CAST score groups in Shenzhen
Shenzhen City Clinical diagnosis Research diagnosis
Non-autism(%)
Autism orsuspectedautism (%)
ADHD Developmental delay(%)
Not assessed(%)
Total(%)
Non-autism(%)
Autism(%)
Missing(%)
Total(%)
High score 670 (56.4) 114 (9.6) 12 (1.0) 1 (0.1) 390 (32.8) 1187 (100.0) 60 (57.7) 34 (32.7) 10 (9.6) 104 (100.0)
Borderline 67 (2.6) 3 (0.1) 0 (0.0) 0 (0.0) 2472 (97.3) 2542 (100.0) 2 (2.6) 1 (0.1) 0 (97.3) 3 (100.0)
Low 17 (0.1) 6 (0.0) 0 (0.0) 0 (0.0) 17050 (99.9) 17073 (100.0) 6 (0.1) 0 (0.04) 0 (99.9) 6 (100.0)
Total 754 (3.6) 123 (0.6) 12 (0.1) 1 (0.0) 19912 (95.7) 20802 (100.0) 87 (3.6) 35 (0.6) 0 (95.7) 113 (100.0)
Sun et al. Molecular Autism (2019) 10:7 Page 8 of 19

the questionnaire, or mother’s occupation. After adjust-ing for the other factors, father’s education and father’soccupation (higher social status occupations were lesslikely to take part), and child’s age were the strongestfactors related to non-response. In addition, the higherthe CAST score the less likely the child was to take part,though this effect was small. More detailed results arepresented in Appendix 2 Detailed results’ tables.
DiscussionKey findingsThere are four key findings from this study. First, resultsfrom Jilin City where both mainstream and specialschool data were available revealed a similar prevalenceof autism in China to the West, at around 1% [24–27].
Second, in Shenzhen and Jiamusi cities, where onlymainstream data were available, prevalence is also in linewith Western estimates [9, 26]. Third, in all three cities,new cases of autism were identified by the study inmainstream schools, reflecting current under-diagnosis.Finally, non-significant variation across different cities isseen indicating the need to explore potential variation ofautism across diverse Chinese regions with large samplesizes to achieve a fully robust national picture.The prevalence estimate in mainstream schools in Jilin
was 14.6 per 10,000. In Shenzhen, it was 42.3 per 10,000and 19.0 per 10,000 in Jiamusi. In Jilin, where prevalenceincluded those children with autism identified from spe-cial education and other settings outside mainstreampopulation, the prevalence estimate was 108 per 10,000.
Fig. 4 Flowchart of Jiamusi City
Table 3 Clinical and research diagnosis across different CAST score groups in Jiamusi
Jiamusi City Clinical diagnosis Research diagnosis
Non-ASC(%)
ASC orsuspectedASC (%)
ADHD DD (%) ID Not assessed(%)
Total(%)
Non-autism(%)
Autism(%)
Missing(%)
Total(%)
High score 390 (43.3) 20 (2.2) 0 (1.0) 1 (0.1) 3 (0.3) 487 (54.1) 901 (100.0) 11 (55.0) 9 (45.0) 0 (0.0) 20 (100.0)
Borderline 143 (7.9) 1 (0.1) 0 (0.0) 0 (0.0) 0 (0.0) 1678 (92.1) 1822 (100.0) 1 (100.0) 0 (0.0) 0 (0.0) 1 (100.0)
Low 747 (5.8) 3 (0.0) 0 (0.0) 0 (0.0) 0 (0.0) 12190 (94.2) 12940 (100.0) 2 (66.7) 1 (33.3) 0 (0.0) 3 (100.0)
Total 1280 (8.2) 24 (0.2) 0 (0.0) 1 (0.0) 3 (0.0) 14355 (91.7) 15663 (100.0) 14 (58.3) 10 (41.7) 0 (0.0) 24 (100.0)
Sun et al. Molecular Autism (2019) 10:7 Page 9 of 19
StrengthsThe strengths of this first large-scale study of autism inChina are several. We used a total population approachcovering all services in one city and mainstream schoolsin the other two. The response rate was high, much higherthan has ever been achieved in the West. We used inter-nationally agreed standardised screening and diagnosticinstruments in all three cities. This included a MandarinChinese version of the CAST that has previously beenshown to have acceptable validity in a Chinese population[21]. The Western-developed diagnostic instrumentsADI-R and ADOS were used in combination with clinicaldiagnosis by Chinese child psychiatrists and were con-firmed to be acceptable within a Chinese clinical setting,finding that these produce similar prevalence estimatesacross both Western and Asian cultures.After screening (step 1), this study used local child psy-
chiatrists as an additional selection step (step 2) prior to be-ing followed up with research diagnostic assessments (step3) which is a modification from previous prospective epi-demiological studies in other countries, reducing the vol-ume of false positives which otherwise may be experiencedin such studies [3, 4, 6, 26]. The population size covered bythe sampling in each of the three cities was large and in-cluded both screen-positives, screen-borderline, andscreen-negatives in all three score groups for diagnostic as-sessments. Finally, our analytical methods took this stagedstudy design into account, along with drop out between thestages, in our estimation of confidence intervals.
LimitationsDespite these strengths, there are several limitations. First,according to the recruitment criteria, the sample for thecities was representative for the local region but is not yetnationally representative of China; hence, the hope for the
China SCORE project is to map autism prevalence in 10cities in total. It is important for national policy to reportdata from these first three cities, and our on-going datacollection in the seven other cities will serve to further in-form national policy and future research directions. Theimpact of differences in the three regions is difficult to es-tablish given considerable variation in economic statusand demographic characteristics for the three regions.In Shenzhen and Jiamusi cities, not all of the schools
took part in this study. Non-participation is not unusualin any epidemiological studies, particularly those address-ing neuropsychiatric disorders. The influence of non-par-ticipation in epidemiological studies of autism has beendiscussed [28, 29], especially those with low participationrates. As participation has to be voluntary under ethicalcodes, the participation of each local government relies onan existing collaboration. It is not uncommon that somecommunities will not wish to take part. In addition, indi-vidual and family participation is subject to the usualhuman research ethical codes and participation is volun-tary. The participation rate of the communities in thisstudy is much higher than most of the prevalence studiesof autism internationally. Although there will be non-par-ticipation effects, these will be much less marked thanthose experienced by other such studies.The use of both DSM-IV-TR and DSM-5 may lead to
concerns about the differences in prevalence across regionsas differences between the DSM-IV-TR and the DSM-5exist. The DSM-5 has not been fully adopted in most clinicalsettings in China; therefore, the DSM-IV-TR criteria werealso used in this study. The reasons for this were two-fold.First, to ensure there was consistency among child psychia-trists across the regions, and second, to ensure comparabil-ity between existing diagnosed children and newlydiagnosed children. The Chinese DSM-5 was also provided
Fig. 5 Prevalence of autism in China vs. USA
Sun et al. Molecular Autism (2019) 10:7 Page 10 of 19

to each psychiatrist to assist the diagnostic process. Childrenwho were suspected to have autism according to eitherDSM-IV-TR or DSM-5 criteria were invited for a researchassessment using the ADOS and the ADI-R. Thus, the po-tential impact due to differences between the DSM-IV-TRand the DSM-5 in this study should be minimised.Missed diagnoses by child psychiatrists during clinical as-
sessments serve to lower prevalence estimates. In thecurrent study, we reduced the likelihood of this happeningby developing a diagnostic agreement test that could beused by all psychiatrists in all participating regions. Psychia-trists recommended by CDPF only joined the final clinicalassessment team if s/he achieved a diagnostic agreement of80% or above. Thus, the final prevalence estimate shouldnot be compromised by changes in personnel between theclinical diagnosis and the research diagnosis.There could be variations in the inclusion of children with
autism in mainstream schools that may have influencedprevalence estimates across the three cities. To date, therehas been no unified healthcare system and health insurancepolicy in Mainland China for autism [9]. The current educa-tion inclusion policy only recommends mainstream schoolsto include children with disabilities, but this is notmandatory [9, 30]. In three cities, the participation rates oflocal schools during the screening and diagnostic phaseswere different. This could be explained by a number of is-sues. First, recognition and awareness of autism within themainstream population in the three cities may be different.Data from the non-responders suggested that in Shenzhen,which is a more advanced city where awareness and under-standing about autism might be higher, the mothers edu-cated to a higher level were more likely to participate. Incontrast, in Jiamusi city where the economic status was rela-tively lower, awareness about autism might be lower, andtherefore parents educated to a higher level and those withhigher socioeconomic status were less likely to participate.Second, involvement and support from the local govern-
ment for this study was different in each city. Third, partici-pation in the study is voluntary, so the willingness of theparents to participate may be different. The attitude of theparents towards incentives could be different. There havebeen studies focusing on the potential selection bias inprevalence studies of autism [28, 29]. Parental denial aboutautism may also contribute to differences in participationrates. It is possible that when parents realised that their childmight have more difficulties than other children, they wereless likely to participate. Thus, in both Shenzhen and Jiamusicities, children who scored in the high score group were lesslikely to participate than those in the borderline score group.These factors might lead to a higher prevalence of autism inmore advanced cities such as Shenzhen city and a lowerprevalence in less developed cities such as Jiamusi city.
Another limitation of this study was that there wasno information available concerning the prevalence of
autism in special education in Shenzhen and Jiamusi cit-ies. The goal of the study was to report the prevalenceof autism in a previously neglected population, i.e., themainstream school population. In China, most of thepreviously identified cases of autism are children withsevere autism, including those with intellectual disability.To date, nearly all of the prevalence studies of autism inChina have been carried out in special education settingsbut not in mainstream settings [8, 9]. In contrast to de-veloped countries, most children with moderate to se-vere autism in China do not attend mainstream schools.They would not be admitted during the applicationprocess for kindergartens and primary schools [9, 30].Children with autism who do not have intellectual dis-
ability are more likely be identified and given a diagnosisof autism in developed countries than in China [30, 31].This is one of the reasons why previous prevalence esti-mates were much lower than those from the developedcountries. In 2015, we reported our pilot study in twomainstream schools in Beijing which showed there werechildren with autism in mainstream schools. The preva-lence in those two schools was 119 per 10,000 [14]. Thecurrent study was carried out in a large mainstreampopulation in those three cities.
ConclusionsThe prevalence estimate indicates that the prevalence ofautism in China is similar to estimates in Western coun-tries. As China has such a large population, addressingthis under-diagnosis of children with autism in main-stream schools would need major improvement in health-care and education systems to support their families.Children with autism in primary schools are mostly chil-dren with average IQ (mean IQ > 100, Additional file 1).These children urgently need support to understand thedifficulties and challenges they might face in the future toprepare themselves for school and the workplace.During previous and current studies, we found there
was a lack of awareness and knowledge among schoolprofessionals about autism [5, 10, 11]. Many schools donot have special education teachers. Many parents hadnever heard of autism prior to the study. If sufficientinformation is provided to parents at the hospital paedi-atric department, this could profoundly improve earlydetection of autism. Recognition of the role that childpsychiatrists play throughout the life-course needs to beimproved in China. Even among school psychologists,many of them had no awareness about symptoms ofautism before we gave them training about screeningand diagnosis. Special teachers and school psychologistsneed to be trained with skills and intervention strategiesto help children who may be struggling because of socialand communication difficulties that may be related toautism.
Sun et al. Molecular Autism (2019) 10:7 Page 11 of 19

Appen
dix
1Prev
alen
cereview
tables
Table
4Summaryof
prevalen
cestud
iesof
autism
spectrum
disordersin
China
(25stud
ies)
Year
Firstauthor
Region
Samplesize
Area
Age
Sample
screen
edScreen
metho
dsScreen
tools
Cut-off
Respon
serate
P/R
Diagn
ostic
tools
Diagn
ostic
criteria
Childho
odautism
prevalen
ce/SE(per
10,000)
ASC
prevalen
ce/SE
(per
10,000)
1987
Tao[25]
Mainland
457,200
Urban
3–8
CR
N/A
N/A
N/A
RN/A
Rutter
0.32
(0.08)
–
2000
Luo[51]
Mainland
10,802
Mixed
2–14
SGQI
ABC
31100%
PN/A
CCMD-2-R,D
SM-III-R
2.8(1.60)
–
2002
Wang[30]
Mainland
3.978
Urban
2–6
KQI
CABS*
798.3%
PCARS
CCMD-2-R
17.9(6.70)
–
2002
Ren[43]
Mainland
3559
Urban
3–5
SGQI
CABS
1499.1%
PN/A
N/A
250(2.31)
–
2003
Wang[52]
Mainland
7488
Mixed
2–6
SGQI
CABS
798.08%
PCARS
CCMD-2-R
12.3(4.05)
–
2003
Chang
[26]
Taiwan
660
Mixed
15–93
CC
ASD
ASQ
5100%
PN/A
DSM
-IV–
60.0(30.06)
2004
Guo
[53]
Mainland
5000
Urban
0–6
WP
QI
CABS
799.1%
PCARS
CCMD-2-R
10(4.47)
–
2004
Guo
[54]
Mainland
3776
Rural
2–6
SGQI
CABS
7100%
PCARS
DSM
-IV8(4.59)
–
2005
Zhang[55]
Mainland
7416
Urban
2–6
SGQI
CABS
799%
PCARS
DSM
-IV11.0(3.85)
–
2005
Zhang[29]
Mainland
1305
Urban
3–7
KQI
CABS
14100%
PN/A
N/A
19.9(2.47)
–
2005
Liu[56]
Mainland
21,866
Mixed
2–6
SGQI
CABS
7100%
PCARS
DSM
-IV13.4(2.47)
15.3(2.64)
2007
Yang
[31]
Mainland
10,412
Urban
3–12
PSQI
ABC
31100%
PN/A
DSM
-IV5.6(2.32)
–
2007
Won
g[22]
Hon
gKo
ng4,247,206
Mixed
0–14
HS
RN/A
N/A
N/A
RCARS,
ADI-R
DSM
-IV–
16.1(0.19)
2008
Zhang[21]
Mainland
8681
Urban
2–3
SGQI
CHAT
N/A
100%
PCARS
DSM
-IV16.1(4.3)
–
2008
Zhang[21]
Mainland
12,430
Urban
4–6
SGQI
CABS
14100%
PCARS
DSM
-IV8.85
(2.7)
–
2009
Zhang[57]
Mainland
5000
Urban
0–6
SGQI
CABS
799.98%
PCARS
CCMD-2-R
10.0(4.47)
–
2009
Wang[28]
Mainland
4156
Urban
2–6
KQI
CABS
14100%
PN/A
N/A
19.5(6.84)
–
2010
Li[58]
Mainland
8006
Mixed
1.5–3
SGQI
CHAT
N/A
92.99%
PCARS
DSM
-IV26.2(5.71)
–
2010
Wu[59]
Mainland
8532
Urban
0–3
SGQI
CHAT
N/A
100%
PCARS
DSM
-IV8.2(3.10)
–
2010
Yu[33]
Mainland
7059
Mixed
2–6
SGQ
CABS
789.7%
PN/A
DSM
-IV21.2(5.47)
22.7(5.66)
2010
Che
n[32]
Mainland
7034
Mixed
2–6
SGQ
CABS
798.78%
PCARS
DSM
-IV14.2(4.49)
24.2(5.86)
2011
Wang[27]
Mainland
7500
Urban
2–6
KQI
CABS
1487.8%
PN/A
DSM
-IV29.5(6.26)
75.4(9.99)
2011
Liang[60]
Mainland
2485
Urban
3–6
KQI
CABS
14100%
PN/A
DSM
-IV,
ICD-10
14.1(7.53)
–
2011
Li[24]
Mainland
616,940
Mixed
0–17
SGQI
ABC
N/A
N/A
PN/A
ICD-10
2.38
(0.20)
–
2011
Chien
[23]
Taiwan
372,642
Mixed
0–17
HS
RN/A
N/A
N/A
RN/A
ICD-9
–28.7(0.88)
–,da
tano
tavailable.
Samplescreen
ed:C
clinical
patie
nts,SG
stratifiedge
neralp
opulation,
Kkind
erga
rten
s,WPwho
lepo
pulatio
n,PS
prim
aryscho
ols,HSpo
pulatio
nin
health
system
;screenmetho
ds:
Rrecords,QIq
uestionn
aire-based
interview,C
clinicalreferral,Q
questio
nnaire
distrib
ution.AB
CAutism
Beha
viou
rCh
ecklist,CA
BSClan
cyAutism
Beha
viou
ralScale,A
SDASQAutism
Spectrum
Disorde
rin
Adu
ltsScreen
ingQue
stionn
aire,M
-CHAT
TheMod
ified
ChecklistforAutism
inTo
ddlers,C
ARSCh
ildho
odAutism
Ratin
gScale,Ppe
rspe
ctive,Rretrospe
ctive,CA
STChildho
odAutism
Spectrum
Test,A
DOS
Autism
Diagn
ostic
Observatio
nSche
dule,A
DI-R
Autism
Diagn
ostic
Interview-Revised
,DSM
-IV-TRDiagn
ostic
andStatistic
Man
ualo
fMen
talD
isorde
rs,4th
Edition
,TextRe
vision
,DSM
-VDiagn
ostic
and
StatisticalMan
ualo
fMen
talD
isorde
rs,5th
Edition
,ICD
-10Internationa
lClassificatio
nof
Disease-10threvision
Sun et al. Molecular Autism (2019) 10:7 Page 12 of 19

Table
5Summaryof
prevalen
cestud
iesof
autism
spectrum
disordersin
Chine
sepo
pulatio
nsbe
tween2012
and2016
(10stud
ies)
Year
Firstauthor
Region
Samplesize
Area
Age
Sample
screen
edScreen
metho
dsScreen
tools
Respon
serate
P/R
Diagn
ostic
tools
Diagn
ostic
criteria
Childho
odautism
prevalen
ce/SE(per
10,000)
ASC
prevalen
ce/SE
(per
10,000)
2012
Uncertain
Mainland
148,030
Ningxia
0–14
WP
RABC
S–
RCARS
ICD-10
5.2
–
2013
Lai
Taiwan
4,004,997
Taiwan
3–17
WP
R–
–R
––
–
2014
Che
nMainland
5500
Zhuh
ai1.5–3
SGQ
M-CHAT
90.9%
PCARS
DSM
-IV–
29.5
2014
Den
gMainland
4980
Hen
yang
3–6
KQ
CABS
98.3%
PCARS
DSM
-IV16.8
62.7
2015
Wang
Mainland
8000
Zaozhu
ang
2–6
KQ
CABS
88.2%
PCARS
DSM
-V–
66.3
2015
Jiang
Mainland
10,385
Shangh
ai4–6
KQ
CABS
93.1%
PADI-R
DSM
-V–
9.3
2015
Yang
Mainland
15,200
Shen
zhen
4K
91.2%
PABC
–Uncertain
(questionable
autism
2.6%
)Uncertain
2015
Wang
Mainland
51,968
Shantou
3–6
WP
––
–R
––
–26.7
2015
Sun
Mainland
737
Beijing
6–10
WP
QCAST
97%
PADOS,ADI-R
DSM
-IV–
119
2016
Wang
Mainland
7463
Jilin
6–11
SGQ
CAST
86.8%
P–
CCMD-3
–63.7
–,da
tano
tavailable.
Samplescreen
ed:C
clinical
patie
nts,SG
stratifiedge
neralp
opulation,
Kkind
erga
rten
s,WPwho
lepo
pulatio
n,PS
prim
aryscho
ols,HSpo
pulatio
nin
health
system
;screenmetho
ds:R
records,QI
questio
nnaire-based
interview,C
clinicalreferral,Q
questio
nnaire
distrib
ution.AB
CAutism
Beha
viou
rCh
ecklist,CA
BSClan
cyAutism
Behaviou
ralScale,ASD
ASQAutism
Spectrum
Disorde
rin
Adu
ltsScreen
ingQue
stionn
aire,M
-CH
ATTh
eMod
ified
ChecklistforAutism
inTo
ddlers,CAR
SChildho
odAutism
Ratin
gScale,Ppe
rspe
ctive;Rretrospe
ctive,CA
STCh
ildho
odAutism
Spectrum
Test,ADOSAutism
Diagn
ostic
Observatio
nSche
dule,ADI-R
Autism
Diagn
ostic
Interview-Revised
,DSM
-IV-TRDiagn
ostic
andStatistic
Man
ualo
fMen
talD
isorde
rs,4th
Edition
,TextRe
vision
,DSM
-VDiagn
ostic
andStatisticalMan
ualo
fMen
talD
isorde
rs,5th
Edition
,ICD
-10Internationa
lClassificationof
Disease-10threvision
Sun et al. Molecular Autism (2019) 10:7 Page 13 of 19

Appendix 2
Table 6 Age and sex distribution of Shenzhen City sample
Age Sex Missing Total (%)
Boys Girls
6 2179 1879 7 4065 (19.0)
7 3237 2459 16 5712 (26.7)
8 3110 2387 20 5517 (25.8)
9 2454 1968 12 4434 (20.7)
10 632 420 2 1054 (4.9)
Others 266 199 173 638 (3.0)
Total 11,878 9312 230 21,420 (100)
Sun et al. Molecular Autism (2019) 10:7 Page 14 of 19

Table 7 Characteristics of Shenzhen sample within age range during clinical assessments
Variables n (%) Group 1: CAST ≥ 15 Group 2: 12–14 Group 3: ≤ 11
Completed Notcompleted
Invited andcompleted
Invited but notparticipated
Notinvited
Invited Notinvited
Number 796 (67) 391 (33) 70 (3) 53 (2) 2419 (95) 23 (0.1) 17,050 (99.9)
CAST score Median (IQR) 16 (15,17) 16 (15.17) 13 (12, 14) 13 (12, 14) 13 (12, 13) 13 (12, 14) 13 (12, 13)
Mean (SD) 15.5 (3.7) 15.8 (3.0) 12.2 (2.5) 12.6 (1.7) 12.6 (1.6) 12.2 (2.5) 12.6 (1.6)
Age Mean (SD) 8.2 (1.1) 8.3 (1.1) 7.9 (1.1) 8.4 (1.0) 8.2 (1.1) 7.9 (1.1) 8.2 (1.1)
Sex
Boys 527 (66) 265 (68) 40 (57) 35 (66) 1548 (64) 22 (96) 9185 (54)
Girls 241 (30) 126 (32) 30 (43) 18 (34) 866 (36) 1 (4) 7840 (46)
Missing 28 (3.5) 0 (0) 0 (0) 0 (0) 5 (0.2) 0 (0) 25 (0.2)
Mother’s age
≤ 24 5 (0.6) 1 (0.3) 0 (0) 0 (0) 11 (0.5) 0 (0.0) 44 (0.3)
25–30 88 (11.1) 47 (12.0) 8 (11.4) 5 (9.4) 337 (13.9) 4 (17.4) 2063 (12.1)
31–34 419 (52.6) 211 (54.0) 35 (50.0) 31 (58.5) 1330 (55.0) 12 (52.2) 9883 (58.0)
35–40 184 (23.1) 110 (28.1) 14 (20.0) 12 (22.6) 565 (23.4) 7 (30.4) 3924 (23.0)
≥ 41 19 (2.4) 2 (0.5) 3 (4.3) 1 (1.9) 40 (4.3) 0 (0.0) 345 (2.0)
Missing 81 (10.2) 20 (5.1) 10 (14.3) 4 (7.6) 136 (5.6) 0 (0.0) 791 (4.6)
Father’s age
≤ 24 2 (0.3) 1 (0.3) 0 (0.0) 0 (0.0) 6 (0.3) 0 (0.0) 23 (0.1)
25–30 21 (2.6) 8 (2.1) 1 (1.4) 2 (3.8) 92 (3.8) 2 (8.7) 551 (3.2)
31–34 393 (49.4) 183 (46.8) 34 (48.6) 30 (56.6) 1215 (50.2) 9 (39.1) 8604 (50.5)
35–40 265 (33.3) 169 (43.2) 21 (30.0) 18 (34.0) 869 (37.0) 11 (47.8) 6197 (36.4)
≥ 41 45 (5.7) 12 (3.1) 5 (7.1) 2 (3.8) 85 (3.5) 1 (4.4) 835 (4.9)
Missing 70 (8.8) 18 (4.6) 9 (12.9) 1 (1.9) 125 (5.2) 0 (0.0) 840 (4.9)
Mother’s education
Junior high or lower 366 (46.0) 168 (43.0) 35 (50.0) 18 (34.0) 1023 (42.29) 11 (47.8) 5359 (31.4)
High school 252 (31.7) 130 (33.3) 25 (35.7) 21 (39.6) 908 (37.5) 8 (34.8) 6972 (40.9)
College or university 116 (14.6) 71 (18.2) 5 (7.1) 12 (22.6) 416 (17.2) 4 (17.4) 4248 (24.9)
Graduate school 8 (1.0) 6 (1.5) 0 (0.0) 1 (1.9) 14 (0.6) 0 (0.0) 125 (0.7)
Missing 54 (6.8) 16 (4.1) 5 (7.1) 1 (1.9) 58 (2.4) 0 (0.0) 346 (2.0)
Father’s education
Junior high or lower 264 (33.1) 115 (29.4) 22 (31.4) 16 (30.2) 729 (30.1) 10 (43.5) 3795 (22.3)
High school 285 (35.8) 144 (36.83) 30 (42.9) 1040 (40.9) 988 (40.8) 7 (30.4) 6732 (39.5)
College or university 175 (22.0) 101 (25.8) 14 (20.0) 627 (24.7) 602 (24.9) 4 (17.4) 5697 (33.4)
Graduate school 14 (1.8) 10 (2.6) 1 (1.4) 29 (1.1) 26 (1.1) 0 (0.0) 321 (1.9)
Missing 58 (7.3) 21 (5.4) 3 (4.3) 79 (3.1) 74 (3.1) 2 (8.7) 505 (3.0)
Mother’s occupation
Public servant hired bythe government
6 (0.8) 1 (0.3) 0 (0.0) 0 (0.0) 18 (0.7) 0 (0.0) 64 (0.4)
Company clerks 213 (26.8) 93 (23.8) 13 (18.6) 13 (18.6) 611 (25.3) 3 (13.0) 5226 (30.7)
Industry workers 45 (5.7) 28 (7.2) 6 (8.6) 6 (8.6) 157 (6.5) 2 (8.7) 1232 (7.2)
Self-employed 191 (24.0) 109 (27.9) 21 (30.0) 21 (30.0) 669 (27.7) 6 (26.1) 4451 (26.1)
Other worker 79 (9.9) 27 (6.9) 3 (4.3) 3 (4.3) 237 (9.8) 3 (13.0) 1224 (7.2)
Student 1 (0.1) 1 (0.3) 0 (0.0) 0 (0.0) 3 (0.1) 0 (0.0) 27 (0.2)
Farmer 49 (6.2) 28 (7.2) 11 (15.7) 11 (15.7) 158 (6.5) 2 (8.7) 684 (4.0)
Sun et al. Molecular Autism (2019) 10:7 Page 15 of 19

Table 7 Characteristics of Shenzhen sample within age range during clinical assessments (Continued)Variables n (%) Group 1: CAST ≥ 15 Group 2: 12–14 Group 3: ≤ 11
Completed Notcompleted
Invited andcompleted
Invited but notparticipated
Notinvited
Invited Notinvited
Unemployed 206 (25.9) 103 (26.3) 16 (22.9) 16 (22.9) 558 (23.1) 7 (30.4) 4102 (24.1)
Missing 6 (0.8) 1 (0.3) 0 (0.0) 0 (0.0) 8 (0.3) 0 (0.0) 40 (0.2)
Father’s occupation
Public servant hired bythe government
8 (1.0) 5 (1.3) 0 (0.0) 0 (0.0) 35 (1.5) 1 (4.4) 244 (1.4)
Company clerks 236 (29.7) 108 (27.6) 23 (32.9) 14 (26.4) 741 (30.6) 11 (47.8) 6385 (37.5)
Industry workers 66 (8.3) 49 (12.5) 8 (11.4) 4 (7.6) 219 (9.1) 1 (4.4) 1489 (8.7)
Self-employed 272 (34.2) 148 (37.9) 25 (35.7) 24 (45.3) 900 (37.2) 6 (26.1) 6242 (36.6)
Other worker 95 (11.9) 34 (8.7) 3 (4.3) 6 (11.3) 262 (10.8) 3 (13.0) 1287 (7.6)
Student 2 (0.3) 0 (0.0) 0 (0.0) 8 (0.1)
Farmer 36 (4.5) 16 (4.1) 6 (8.6) 1 (1.9) 111 (4.6) 0 (0.0) 418 (2.5)
Unemployed 75 (9.4) 31 (7.9) 5 (7.1) 4 (7.6) 148 (6.1) 1 (4.4) 935 (5.5)
Missing 6 (0.8) 0 (0.0) 0 (0.0) 0 (0.0) 3 (0.1) 0 (0.0) 42 (0.3)
Income
≤ 1999 46 (5.8) 31 (7.9) 4 (5.7) 4 (7.6) 135 (5.6) 0 (0.0) 609 (3.6)
2000–3999 181 (22.7) 89 (22.8) 17 (24.3) 14 (26.4) 480 (19.8) 5 (21.7) 2569 (15.1)
4000–5999 156 (19.6) 81 (20.7) 16 (22.9) 12 (22.6) 515 (21.3) 9 (39.1) 3047 (17.9)
6000–7999 104 (13.1) 38 (9.7) 10 (14.3) 7 (13.2) 336 (13.9) 3 (13.0) 2552 (15.0)
8000–9999 68 (8.5) 36 (9.2) 4 (5.7) 4 (7.6) 227 (9.4) 1 (4.4) 2049 (12.0)
≥ 10,000 112 (14.1) 69 (17.7) 10 (14.3) 6 (11.3) 500 (20.7) 3 (13.0) 4699 (27.6)
Missing 129 (16.2) 47 (12.0) 9 (12.9) 6 (11.3) 226 (9.3) 2 (8.7) 1525 (8.9)
Table 8 Age and sex distribution of Jiamusi City sample
Age Sex Missing Total (%)
Boys Girls
6 1918 1916 10 3844 (23.5)
7 1930 1730 11 3671 (22.4)
8 1952 1810 10 3772 (23.1)
9 1875 1908 6 3789 (23.2)
10 230 161 1 392(2.4)
Others 421 328 141 890 (5.4)
Total 8326 7853 179 16,358 (100)
Sun et al. Molecular Autism (2019) 10:7 Page 16 of 19

Table 9 Characteristics of Jiamusi sample within age range during clinical assessments
Variables n (%) Group 1: CAST ≥ 15 Group 2: 12–14 Group 3: ≤ 11
Completed Notcompleted
Invited andcompleted
Invited but notparticipated
Notinvited
Invited Notinvited
Number 414 (46) 487 (54) 144 (8) 124 (7) 1554 (85) 750 (6) 12,190 (94)
CAST score Median (IQR) 16 (15,17) 16 (15.17) 12 (12, 13) 13 (12, 14) 13 (12, 13) 7 (5,9) 7 (5, 9)
Mean (SD) 16 (2.6) 16 (3.9) 12 (1.8) 12 (2.1) 12 (1.8) 7 (2.4) 6 (2.5)
Age Mean (SD) 8.2 (1.3) 7.8 (1.7) 7.9 (1.5) 7.8 (1.3) 8.0 (1.3) 7.9 (1.1) 8.2 (1.1)
Sex
Boys 260 (63) 337 (69) 80 (56) 63 (51) 921 (59) 376 (50) 5979 (49)
Girls 151 (36) 148 (30) 64 (44) 59 (48) 625 (40) 373 (48) 6189 (46)
Missing 3 (0.7) 2 (0.4) 0 (0) 2 (1.6) 8 (0.5) 1 (0.3) 22 (0.2)
Mother’s age
≤ 24 3 (0.7) 2 (0.4) 0 (0) 0 (0) 4 (0.3) 2 (0.3) 27 (0.2)
25–30 64 (15.5) 84 (17.3) 28 (19.4) 16 (12.9) 237 (15.3) 149 (19.9) 1462 (12.0)
31–34 215 (51.9) 230 (47.2) 87 (60.4) 61 (49.2) 831 (53.5) 444 (59.2) 6811 (55.9)
35–40 37 (8.9) 31 (6.4) 10 (6.9) 7 (5.7) 112 (7.2) 50 (6.7) 713 (5.9)
≥ 41 0 (0) 0 (0) 0 (0) 0 (0) 0 (0) 0 (0.0) 2 (0.0)
Missing 95 (23.0) 140 (28.8) 19 (13.2) 40 (32.3) 370 (23.8) 105 (14.0) 3175 (26.1)
Father’s age
≤ 24 2 (0.5) 3 (0.6) 0 (0.0) 0 (0.0) 6 (0.4) 1 (0.1) 14 (0.1)
25–30 32 (7.7) 37 (7.6) 12 (8.3) 12 (9.7) 108 (7.0) 70 (9.3) 532 (4.4)
31–34 262 (63.3) 280 (57.5) 105 (72.9) 75 (60.5) 937 (60.3) 534 (71.2) 8128 (66.7)
35–40 50 (12.1) 52 (10.7) 16 (11.1) 12 (9.7) 188 (12.1) 68 (9.1) 1223 (10.0)
≥ 41 0 (0.0) 0 (0.0) 0 (0.0) 0 (0.0) 0 (0.0) 0 (0.0) 2 (0.2)
Missing 68 (16.4) 115 (23.6) 11 (7.6) 25 (20.2) 315 (20.3) 77 (10.3) 2291 (18.8)
Mother’s education
Junior high or lower 223 (53.9) 225 (46.2) 97 (67.4) 56 (45.2) 804 (51.7) 496 (66.1) 4583 (37.6)
High school 133 (32.1) 160 (32.9) 36 (25.0) 44 (35.5) 455 (29.3) 194 (25.9) 4258 (34.9)
College or university 37 (32.1) 79 (16.2) 4 (2.8) 20 (16.1) 231 (14.9) 48 (6.4) 2997 (24.6)
Graduate school 6 (1.5) 7 (1.4) 2 (1.4) 1 (0.8) 18 (1.2) 6 (0.8) 217 (1.8)
Missing 15 (3.6) 16 (3.3) 5 (3.5) 3 (2.4) 46 (3.0) 6 (0.8) 135 (1.1)
Father’s education
Junior high or lower 220 (53.1) 209 (42.9) 99 (68.8) 51 (41.1) 743 (47.8) 492 (65.6) 4349 (35.7)
High school 124 (30.0) 152 (31.2) 36 (25.0) 52 (41.9) 506 (32.6) 197 (26.3) 4335 (35.6)
College or university 47 (11.4) 96 (19.7) 5 (3.5) 17 (13.7) 241 (15.5) 44 (5.9) 3047 (25.0)
Graduate school 6 (1.5) 10 (2.1) 2 (1.4) 2 (1.6) 20 (1.3) 8 (1.1) 264 (2.2)
Missing 17 (4.1) 20 (4.1) 2 (1.4) 2 (1.6) 44 (2.8) 9 (1.2) 195 (1.6)
Mother’s occupation
Public servant hired bythe government
15 (3.6) 18 (3.7) 0 (0.0) 4 (3.2) 34 (2.2) 10 (1.3) 363 (3.0)
Company clerks 19 (4.6) 40 (8.2) 8 (5.6) 10 (8.1) 144 (9.3) 66 (8.8) 1586 (13.0)
Industry workers 26 (6.3) 44 (9.0) 5 (3.5) 8 (6.5) 134 (8.6) 31 (4.1) 1578 (13.0)
Self-employed 103 (24.9) 141 (29.0) 32 (22.2) 48 (38.7) 460 (29.6) 188 (25.1) 3735 (30.6)
Other worker 53 (12.8) 44 (9.0) 26 (18.1) 8 (6.5) 156 (10.0) 82 (10.9) 996 (8.2)
Student 0 (0.0) 0 (0.0) 0 (0.0) 0 (0.0) 0 (0.0) 0 (0.0) 7 (0.1)
Farmer 99 (23.9) 80 (16.4) 27 (18.8) 24 (19.4) 270 (17.4) 156 (20.8) 1415 (11.6)
Sun et al. Molecular Autism (2019) 10:7 Page 17 of 19

Additional file
Additional file 1: Supplementary information. (DOCX 28 kb)
AbbreviationsADI-R: Autism Diagnostic Interview-Revised; ADOS: Autism DiagnosticObservation Schedule; ANOVA: One-way analyses of variance; CAST: ChildhoodAutism Spectrum Test; CDPF: China Disabled Persons’ Federation; DSM-IV-TR: Diagnostic and Statistical Manual of Mental Disorders, 4th Edition, Text Revision;DSM-V: Diagnostic and Statistical Manual of Mental Disorders 5th edition;RPM: Raven Progress Matrix; SCORE: Social Communication Research andEpidemiology
AcknowledgementsWe are grateful to the children and families that participated in this study.We thank the clinicians, research examiners, and the cooperation of theCDPF and local CDPF of each study region. We are grateful to Sally Rogers,Fanny Chan, Patrick Leung, Meixiang Jia, and Zhixiang Zhang for theirsupport. We acknowledge the generous support of Drs. Dennis and MireilleGillings in strengthening the collaboration between SBC, CB, and XS, andbetween the University of Cambridge, the Chinese University of Hong Kong(CUHK), and Peking University.
FundingThe funding source had no role in this study design, data collection, dataanalysis, data interpretation, or writing of the report. The correspondingauthor had full access to all the data in the study and had final responsibilityfor the decision to submit for publication.
XS was supported by the International Development Fund-Cambridge-CUHKCollaboration on Autism Research in Hong Kong and China during the earlystage of the writing up. Then XS was supported by the MIND Institute, Univer-sity of California, Davis, the Psychology Department at CUHK and the Star KayBridge Centre for Children with Autism in China during the later stage of thewriting up. SBC, CA, BA, and CB were supported by the Autism Research Trust,and the MRC. FEM is supported by the MRC (research grant U105292687). Inaddition, the research was supported by the National Institute for Health Re-search (NIHR) Collaboration for Leadership in Applied Health Research and Care(CLAHRC) East of England at Cambridgeshire and Peterborough NHS Founda-tion Trust. The views expressed are those of the authors and not necessarilythose of the NHS, the NIHR, or the Department of Health. The study also bene-fitted from support from the NIHR Cambridge Biomedical Research Centre.
Availability of data and materialsThe datasets generated and/or analysed during the current study are notpublicly available due to limitations imposed on the use of data by theethics committee, but they are available from the corresponding author onreasonable request.
Authors’ contributionsXS and FEM conducted the analysis, and all co-authors contributed to thedrafting of the paper. XS coordinated data collection. CB, SBC, CA, and XSdesigned this study. LW contributed to the study design and coordinationof research diagnosis. BA provided advice to the research proposal. YYW con-ducted the training of research diagnosis with XS, and provided advice ofclinical diagnosis. SG contributed to the coordination of collaboration be-tween Cambridge University and the Chinese University of Hong Kong.JZ contributed to the research diagnosis.
Table 9 Characteristics of Jiamusi sample within age range during clinical assessments (Continued)Variables n (%) Group 1: CAST ≥ 15 Group 2: 12–14 Group 3: ≤ 11
Completed Notcompleted
Invited andcompleted
Invited but notparticipated
Notinvited
Invited Notinvited
Unemployed 87 (21.0) 109 (22.4) 46 (31.9) 20 (16.1) 325 (20.9) 215 (28.7) 2355 (19.3)
Missing 12 (2.9) 11 (2.3) 0 (0.0) 2 (1.6) 31 (2.0) 2 (0.3) 155 (1.3)
Father’s occupation
Public servant hired bythe government
6 (1.5) 23 (4.7) 0 (0.0) 4 (3.2) 51 (3.3) 10 (1.3) 696 (5.7)
Company clerks 32 (7.7) 38 (7.8) 10 (6.9) 10 (8.1) 124 (8.0) 41 (5.5) 1385 (11.4)
Industry workers 22 (5.3) 52 (10.7) 8 (5.6) 7 (5.6) 138 (8.9) 29 (3.9) 1386 (11.4)
Self-employed 103 (24.9) 126 (25.9) 33 (22.9) 41 (33.1) 472 (30.4) 253 (33.7) 4016 (33.0)
Other worker 99 (23.9) 81 (16.6) 38 (26.4) 26 (21.0) 283 (18.2) 155 (20.7) 2084 (17.1)
Student 0 (0.0) 0 (0.0) 0 (0.0) 0 (0.0) 0 (0.0) 0 (0.0) 5 (0.0)
Farmer 97 (23.4) 76 (15.6) 35 (24.3) 20 (16.1) 274 (17.6) 156 (20.8) 1444 (11.9)
Unemployed 38 (9.2) 70 (14.4) 19 (13.2) 13 (10.5) 163 (10.5) 99 (13.2) 913 (7.5)
Missing 17 (4.1) 21 (4.3) 1 (0.7) 3 (2.4) 49 (3.2) 7 (0.9) 261 (2.1)
Income
≤ 1999 128 (30.9) 141 (29.0) 40 (27.8) 34 (27.4) 346 (22.3) 191 (25.5) 1869 (15.3)
2000–3999 150 (36.2) 161 (33.1) 49 (34.0) 45 (36.3) 550 (35.4) 311 (41.5) 4035 (33.1)
4000–5999 62 (15.0) 79 (16.2) 26 (18.1) 23 (18.6) 318 (20.5) 147 (19.6) 3270 (26.8)
6000–7999 22 (5.3) 26 (5.3) 10 (6.9) 8 (6.5) 121 (7.8) 43 (5.7) 1493 (12.3)
8000–9999 7 (1.7) 19 (3.9) 1 (0.7) 2 (1.6) 44 (2.8) 17 (2.3) 485 (4.0)
≥ 10,000 10 (2.4) 19 (3.9) 3 (2.1) 7 (5.7) 51 (3.3) 7 (0.9) 478 (3.9)
Missing 35 (8.5) 42 (8.6) 15 (10.4) 5 (4.0) 124 (8.0) 34 (4.5) 560 (4.6)
Sun et al. Molecular Autism (2019) 10:7 Page 18 of 19

Ethics approval and consent to participateThis study was approved by the Research Ethics Committee at the ChineseUniversity of Hong Kong and the Peking University Institutional ReviewBoard. Consent was provided to participants via the screening packagebefore participating. Participants were asked to indicate whether theycontinued to consent at the end of the study.
Consent for publicationNot applicable.
Competing interestsThe authors declare that they have no competing interests.
Publisher’s NoteSpringer Nature remains neutral with regard to jurisdictional claims in publishedmaps and institutional affiliations.
Author details1Cambridge Institute of Public Health, Department of Public Health andPrimary Care, University of Cambridge, Forvie Site, Robinson Way, CambridgeCB2 0SR, UK. 2Autism Research Centre, Department of Psychiatry, Universityof Cambridge, Douglas House, 18b Trumpington Road, Cambridge CB2 2AH,UK. 3Department of Psychology, The Chinese University of Hong Kong, 3rdFloor, Sino Building, Shatin, NT, Hong Kong. 4Centre for Bioinformatics,School of Life Sciences, Peking University, Beijing 100871, People’s Republicof China. 5National Institute of Biological Sciences, Beijing, China. 6Institute ofHealth and Society, Newcastle University, Newcastle NE4 5PL, UK.7Department of Psychology, School of Philosophy, Psychology and LanguageSciences, University of Edinburgh, Edinburgh EH8 9JZ, UK. 8YuNing PsychiatryClinic, YuNing Growing With You Mental Health Centre, Taipei, Taiwan. 9TheJockey Club School of Public Health and Primary Care, The ChineseUniversity of Hong Kong, Shatin, NT, Hong Kong.
Received: 7 July 2018 Accepted: 22 November 2018
References1. American Psychiatric Association. DSM-5. Autism Spectrum Disorder.
Arlington: American Psychiatric Association; 2013.2. Baron-Cohen S, Wheelwright S, Cox A, et al. Early identification of autism by
the Checklist for Autism in Toddlers (CHAT). J R Soc Med. 2000;93(10):521–5.3. Baron-Cohen S, Scott FJ, Allison C, et al. Prevalence of autism-spectrum
conditions: UK school-based population study. Br J Psychiatry. 2009;194(6):500–9.
4. Baio JB, et al. Centre for Disease Control and Prevention. Prevalence ofautism spectrum disorder among children aged 8 years - autism anddevelopmental disabilities monitoring network, 11 sites, United States, 2018.MMWR Surveill Summ. 2018;67:1–23.
5. Sun X, Allison C. A review of the prevalence of autism spectrum disorder inAsia. Res Autism Spectr Disord. 2009;4(2):156–67.
6. Kim YS, Leventhal BL, Koh YJ, et al. Prevalence of autism spectrum disordersin a total population sample. Am J Psychiatry. 2011;168(9):904–12.
7. Fombonne E. Is autism getting commoner? Br J Psychiatry. 2008;193(1):59.8. Sun X, Allison C, Matthews FE, et al. Prevalence of autism in mainland
China, Hong Kong and Taiwan: a systematic review and meta-analysis. MolAutism. 2013;4(1):7.
9. Wang F, Lu L, Wang S-B, et al. The prevalence of autism spectrum disordersin China: a comprehensive meta-analysis. Int J Biol Sci. 2018;14(7):717–25.
10. Sun X, Allison C, Auyeung B, Baron-Cohen S, Brayne C. A review ofhealthcare service and education provision of autism Spectrum condition inmainland China. Res Dev Disabil. 2012;34(1):469–79.
11. Sun X, Allison C, Auyeung B, Matthews F, Baron-Cohen S, Brayne C. What isavailable for case identification in autism research in mainland China? ResAutism Spectr Disord. 2013;7(5):579–90.
12. Lord C, Rutter M, DiLavore P, Risi S. Autism Diagnostic Observation Schedule(ADOS). Western Psychological Services: Los Angeles; 2001.
13. Rutter M, LeCouteur A, Lord C. Autism Diagnostic Interview-Revised Manual.Western Psychological Services: Los Angeles; 2003.
14. Sun X, Allison C, Matthews FE, et al. Exploring the underdiagnosis andprevalence of autism spectrum conditions in Beijing. Autism Res. 2015;8(3):250–60.
15. Scott FJ, Baron-Cohen S, Bolton P, Brayne C. The CAST (Childhood AspergerSyndrome Test): preliminary development of a UK screen for mainstreamprimary-school age children. Autism. 2002;6:9–31.
16. Williams J, Scott F, Stott C, Allison C, Bolton P, Baron-Cohen S. The CAST(Childhood Asperger Syndrome Test): test accuracy. Autism. 2005;9:45–68.
17. Williams J, Allison C, Scott F, Stott C, Bolton P, Baron-Cohen S, et al. TheChildhood Asperger Syndrome Test (CAST): test–retest reliability. Autism.2006;10:415–27.
18. Allison C, Williams J, Scott F, Stott C, Bolton P, Baron-Cohen S, et al. Thechildhood Asperger syndrome test (CAST): test–retest reliability in a highscoring sample. Autism. 2007;11:173–85.
19. Sun X, Allison C, Auyeung B, Matthews FE, Norton S, Baron-Cohen S.Psychometric properties of the Mandarin version of the Childhood AutismSpectrum Test (CAST): an exploratory study. J Autism Dev Disord. 2014;44(7):1565–76.
20. Ronald A, Happé F, Plomin R. Eur Child Adolesc Psychiatry. 2008;17:473.21. Sun X, Allison C, Auyeung B, Matthews FE, Baron-Cohen S, Brayne C. The
Mandarin Chinese version of the childhood autism spectrum test (CAST):test-retest reliability. Res Dev Disabil. 2013;34(10):3267–75.
22. Raven J, Raven JC, Court JH. Raven manual: standard progressive matrices.Oxford: Oxford Psychologists Press; 1998.
23. Raven J. The Raven’s progressive matrices: change and stability over cultureand time. Cogn Psychol. 2000;41(1):1–48.
24. Centres of Disease Control and Prevention. Prevalence of autism spectrumdisorders--Autism and Developmental Disabilities Monitoring Network, 14sites, United States, 2008. MMWR Surveill Summ. 2012;61(3):1–19.
25. Baird G, Simonoff E, Pickles A, et al. Prevalence of disorders of the autismspectrum in a population cohort of children in South Thames: the SpecialNeeds and Autism Project (SNAP). Lancet. 2006;368(9531):210–5.
26. Fombonne E. Epidemiology of pervasive developmental disorders. PediatrRev. 2009;65(6):591–8.
27. Centers for Disease Control and Prevention. Prevalence of autism spectrumdisorder among children aged 8 years - autism and developmentaldisabilities monitoring network, 11 sites, United States, 2010. MMWR SurveillSumm. 2014;63(2):1–21.
28. Haapea M, Miettunen J, Veijola J. et al. Non-participation may bias theresults of a psychiatric survey: an analysis from the survey includingmagnetic resonance imaging within the Northern Finland 1966 BirthCohort. Soc Psychiat Epidemiol. 2007;42: 403.
29. Lundberg I, Damström Thakker K, Hällström T. et al. Determinants of non-participation, and the effects of non-participation on potential cause-effectrelationships, in the PART study on mental disorders. Soc PsychiatEpidemiol. 2005;40:475.
30. Sun X, Allison C, Auyeung B, Matthews F, Murray S, Baron-Cohen S, BrayneC. Service provision for autism in Mainland China: A service providers’perspective, Res Dev Disabil. 2012;34(1):440-51.
31. Sun X, Allison C, Auyeung B, Matthews FE, Baron-Cohen S, Brayne C. Serviceprovision for autism in mainland China: preliminary mapping of servicepathways. Soc Sci Med. 2013;98:87–94.
Sun et al. Molecular Autism (2019) 10:7 Page 19 of 19