authors - science club · 2016-09-01 · the responsibility of the authors and do not necessarily...
TRANSCRIPT

AuthorsRebecca Daugherty, PhDSuzanne Olds, PhD Mary Abbott Hess, LHD, MS, RD, LD, FADAJulianne HatfieldAmy Sebeson Nick SkertichRebekah WardMegan BoyleMichael Kennedy, PhD
Learn more about the Science Club initiative at www.scienceclub.northwestern.edu
OH
O-Na+
NN
O
OO
O
O=
==
==
S –
O-Na+S
O
CH2OH
OH
O
OH
OH
CH2OH
O
OH
OH
O
CH2OH
OH
O
OH
OH
OH
O-Na+
NN
O
OO
O
O=
=
=
= =
S –
O-Na+S
HO
O
=
O
=
NH2
O-Na+
HO
O
=
O
=
NH2
O-Na+

Food science scienceclub.northwestern.edu 2
About Science Club
DisclaimerThe information contained in this activity is intended as an instructional resource for informal science educators. It should in no way be construed as medical advice, opinion, diagnosis, or treatment. All activities in this guide should be closely supervised by knowledgeable adults, and recommended safety practices followed. Northwestern University and the National Institutes of Health cannot be held responsible for any injury or accident that may result from the activities in this guide.
AcknowledgementsScience Club is supported by a Science Education Partnership Award (SEPA) from the National Center for Research Resources (NCRR), a component of the National Institutes of Health (NIH). Its contents are solely the responsibility of the authors and do not necessarily represent the official views of NCRR or NIH.
The authors would also like to acknowledge the contributions of Megan Boyle (Northwestern University), Mitchell Day (McCormick Boys & Girls Club), Jennifer Koerner (Chicago Public Schools), Jennifer Lewin (Chicago Public Schools), and Les Dames d’Escoffier Chicago.
Center for Genetic MedicineNorthwestern UniversityRobert H. Lurie Medical Research Center, 7-125303 East Superior StreetChicago, IL 60611cgm.northwestern.edu
McCormick Boys & Girls Club4835 North Sheridan RoadChicago, ILbgcc.org
Original February 2012Revised June 2012
Science Club is an afterschool science program developed by the Center for Genetic Medicine at Northwestern University and the Robert R. McCormick Boys & Girls Club in Chicago, Illinois.
It utilizes a mentor-based approach to provide fun, inquiry-based activities for middle school youth. On a weekly basis throughout the academic year, Northwestern science graduate students and staff travel to the McCormick Club to serve as youth mentors, guiding them through the initiative’s curriculum. Field trips and social activities also promote mentor-youth relationship development.
At the conclusion of each quarter, Science Club members have the opportunity to share the results of their inquiry with fellow students, Boys & Girls Club members, and parents.
Food science scienceclub.northwestern.edu 3
Overview
About The Science of FoodThe Science of Food is a project-based informal science education unit that challenges students to examine their favorite foods and design healthier versions of these recipes. Along the way, students will learn about the science of food through hands-on cooking and baking experimentation. Students will test their knowledge in a final recipe competition, where each group prepares their healthy alternative recipe for a panel of judges.
The objectives of the unit include learning about USDA nutrition recommendations, understanding nutrition labels, and the consequences of an unhealthy diet. During food experimentation, students will learn about techniques such as carbonation and leavening as well as topics such as phase transition and our sense of taste.
The curriculum was designed for a mentor-led small group setting (3–4 youth per mentor). Mentors should feel free to adapt the activities and challenges according to the abilities and interests of the group. The activities have been used successfully for youth in grades 5–8.
PedagogyThe curriculum follows the Legacy Cycle framework derived from How People Learn (Bransford, Brown, and Cocking, 1999). The Legacy Cycle helps ensure that the unit incorporates the four “centerednesses” of the How People Learn theory:
Knowledge-centeredness: Appropriate information is presented in a sequenced and organized way.
•Student-centeredness:Thelessonseeksoutstudents’priorconceptionsandhelpsstudentsconnectwithpriorknowledge.•Assessment-centeredness:Thelearningexperienceprovidesstudentswithopportunitiestochecktheirownunderstanding
and provides mentors the opportunity to assess effectiveness of their teaching.
•Community-centeredness:Studentsareprovidedwithopportunitiestolearncollaboratively.
All lessons in Food Science allow students the opportunity to compile and discuss their current knowledge with warm-up questions and provide formative assessment through a concluding discussion.
Food science scienceclub.northwestern.edu 4
Table of ContentsLesson 1: ................................................................. 5The science of Taste Students are introduced to the Grand Challenge- to learn about the science behind kid-friendly foods and design healthy alternatives to their favorite foods. In this lesson, students will learn about their sense of taste and prepare a fast food hamburger. (90 minutes)
Lesson 2: ...............................................................11The science of sodaStudents will learn about soda and the health risks associated with high sugar consumption, while exploring carbonation as they make their own soda. (90 minutes)
Lesson 3: ...............................................................17The science of Ice CreamStudents learn about phase changes and fats in our food while preparing liquid nitrogen ice cream. (90 minutes)
Lesson 4: ...............................................................22The science of PancakesStudents will learn how to make light and fluffy pancakes through the use of leaveners and different flours. They will design their own experiments as they learn about the nutrition of baked goods. (90 minutes)
Lesson 5: ...............................................................28The science of snack Foods Students will learn about food additives, chemicals added to food to enhance flavor, texture, and shelf-life. They will try to re-create their favorite snack flavor powder while learning about the downside of eating highly processed foods. (90 minutes)
Lessons 6 & 7: ......................................................28The Final Recipe ChallengeBased on their cooking and nutrition knowlege, students are challenged to re-design their favorite food recipe to make it healthier. Each group will develop one recipe, calculate its nutritional content, and prepare it for a panel of judges. (Two 90-minute sessions)
Pages marked in the upper right hand corner with a gear icon are designed to be shared with youth as worksheets or informational guides
Food science scienceclub.northwestern.edu 5
What You Need to Know:
Americans eat a variety of foods and while many of these foods are enjoyable, they are not all good for our health. Our bodies need a mix of nutrients to stay healthy and the U.S. Department of Agriculture (USDA) recommends that we eat lots of fruits, vegetables, low-fat meats, and whole grains. But if we need these nutritious foods for our health, why do we prefer to eat unhealthy food?
For this Grand Challenge, students will examine and cook their favorite foods. They will learn about the science behind these foods as well as some health consequences associated with eating them. At the end of the module, each group will develop a healthier way to make one of their favorite foods.
In Lesson 1, students will explore the science of hamburgers. Fast food hamburgers are typically made from 85/15 (or 85% meat, 15% fat) ground beef, formed into thin patties. To determine the reason why these restaurants prefer thin patties, groups will prepare hamburger patties of different thicknesses and then compare how long it takes each patty to reach an internal temperature of 160 ºF, the temperature at which
Lesson 1: The Science of Hamburgers
Lesson Objectives• Introduce the Grand Challenge: learn about the science of
food and develop healthy alternatives to popular kid foods• Answer the question: What is the effect of hamburger patty
thickness on cooking time?
bacteria are killed and ground beef is safe to eat. Since they will be working with raw meat, students will also be introduced to food safety techniques. The USDA nutrition recommendations will also be discussed.
Materials ¨ Poster ¨ Markers ¨ Copy of USDA My Plate food guide ¨ GloGerm lotion ¨ Blacklight ¨ Handsoap ¨ Supplies and ingredients for making
hamburgers (see attached recipe) ¨ Experimental data table (optional) ¨ Pencils ¨ Laptops ¨ Digital Cameras
Prep Work ¨ Make copies of handouts ¨ Collect ingredients for hamburger
recipe ¨ Set-up cooking stations
Time 60–90 minutes (total)
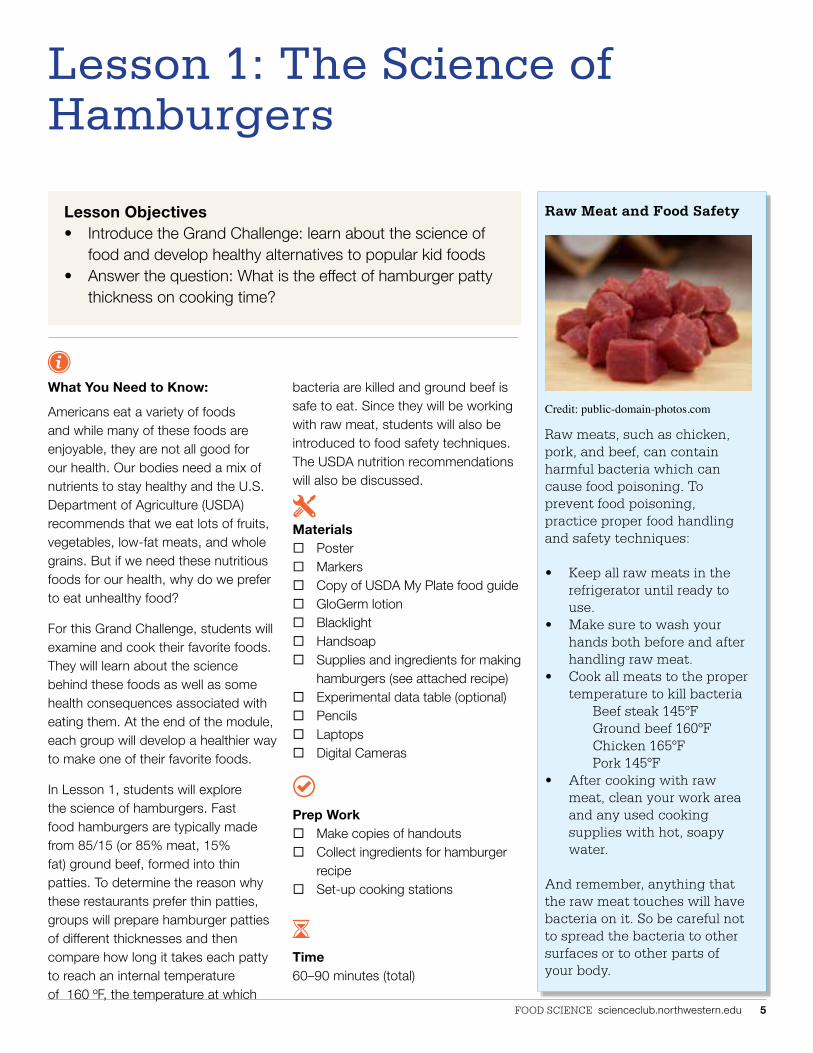
Raw Meat and Food Safety
Credit: public-domain-photos.com
Science of hamburgers-
Cooking temp sidebar
Types of ground meat
Raw meats, such as chicken, pork, and beef, can contain harmful bacteria which can cause food poisoning. To prevent food poisoning, practice proper food handling and safety techniques:
• Keep all raw meats in the refrigerator until ready to use.
• Make sure to wash your hands both before and after handling raw meat.
• cook all meats to the proper temperature to kill bacteria
Beef steak 145ºF Ground beef 160ºF chicken 165ºF Pork 145ºF • After cooking with raw
meat, clean your work area and any used cooking supplies with hot, soapy water.
And remember, anything that the raw meat touches will have bacteria on it. so be careful not to spread the bacteria to other surfaces or to other parts of your body.

Food science scienceclub.northwestern.edu 6
Warm-Up Questions
What are your favorite foods?
What do you cook at home, at school, or at the Boys & Girls Club?
Procedure1. Start a discussion about food
using the Warm-Up Questions. Record the kids’ favorite foods on a poster board.
2. Once you’ve finished the poster, show the kids the USDA My Plate diagram (page 7) and discuss which foods are considered to be healthy. Now, go through each food item on your group’s poster and decide which foods are healthy and which are unhealthy. Most likely there will be a lot of unhealthy foods on the poster. Why are these foods unhealthy? Introduce the Grand Challenge- to learn about the science and nutrition of some popular foods and then make them healthier.
3. As an example of an unhealthy food, discuss the fast food hamburger. Begin by looking at the ingredients and nutrition label for a Big Mac (page 8). What are the ingredients in a fast food hamburger? Which food groups are represented? Some unhealthy elements to discuss include fat, salt, refined grains, and few vegetables. Use the infographic to learn more about hamburgers.
4. Your group is almost ready to cook hamburgers but before you begin, it is important to talk about food safety. Food safety note: Raw meat can contain E.coli bacteria, which can cause food poisoning. Make sure that the kids wear gloves when handling meat and thorougly wash their hands, utensils, and their work area after they are done cooking. What is the proper technique for washing your hands? Use the GloGerm lotion and blacklight to evaluate your handwashing technique. Slather your hands in the lotion and examine the fluorescent lotion under a blacklight. Now, wash your hands at the sink and dry them off. Examine your hands again under the light. Did all of the glowing lotion come off? How could you improve your handwashing approach?
5. To further prevent food poisoning, it is important to get rid of any potential E. coli in the hamburger patty. Cooking the hamburger to an internal temperature of 160 ºF will kill the E.coli and make them safe to eat.
6. Based on this information, why do you think that fast food restaurants choose to make thin hamburger patties? Hint, hint: they are called fast food restaurants.
7. Design an experiment with your group to determine the effect of hamburger patty thickness on
hamburger cooking time (to 160ºF). Follow the instructions on page 9 while making your hamburgers. Make sure to empahsize the following:• What is the scientific question
you are testing?• How are you going to measure
the internal temperature of the meat as it is cooking?
• How are you going to change and measure your variable of meat thickness? Are there other variables that need to be held constant?
• How are you going to measure the time it takes to reach an internal temperature of 160ºF?
• Is one repitition of this experiment enough to make a conclusion?
• What can you conclude from your experiments?
8. Show your group how to draw a data table and record your data in the table. If there is time, graph the change in meat temperature over time.
9. Write a Science Club journal post to summarize your data.
Concluding Discussion
What are some important rules to keep in mind when cooking and working with food?
Experimental Question: What is the effect of hamburger patty thickness on cooking time?
Lesson 1: The Science of Hamburgers, continued

United States Department of Agriculture “My Plate”Nutrition Recommendations
USDA “My Plate” (www.choosemyplate.gov/)
Food groups on the USDA “My Plate”: Fruits, vegetables, grains, protein, dairy
Foods not represented on the USDA “My Plate”: Fats, sugars

Nutrit ion FactsBigMac®
Serving Size 7.5 oz (214 g)
Amount Per ServingCalories 540 Calories from Fat 260
% Daily Value*
Total Fat 29 g
Saturated Fat 10 g
Trans Fat 1.5 g
Cholesterol 75 mg
Sodium 1040 mg
Total Carbohydrate 45 g
Dietary Fiber 3 g
Sugars 9 g
Protein 25 g
Vitamin A 6% Vitamin C 2%Calcium 25% Iron 25%* Percent Daily Values are based on a 2,000 calorie diet. Your daily values may be higher or lower depending on your calorie needs.
INGREDIENTS: 100% Beef Patty (100% Pure uSDa inSPecteD Beef; no fillerS, no extenDerS. PrePareD with grill SeaSon-ing- Salt, Black PePPer); Big Mac Bun (BleacheD wheat flour, MalteD Barley flour, niacin, reDuceD iron, thiaMin Mononitrate, riBoflavin, folic aciD, water, high fructoSe corn SyruP anD/or Sugar, SoyBean oil anD/or canola oil, containS 2% or leSS of the following: Salt, calciuM Sulfate, calciuM carBonate, wheat gluten, aMMoniuM Sulfate, aMMoniuM chloriDe, Dough conDition-erS- May contain one or More of the following: SoDiuM Stearoyl lactylate, DateM, aScorBic aciD, azoDicarBonaMiDe, Mono- anD DiglyceriDeS, ethoxylateD MonoglyceriDeS, MonocalciuM PhoSPhate, enzyMeS, guar guM, calciuM PeroxiDe, calciuM ProPionate anD/or SoDiuM ProPionate, Soy lecithin, SeSaMe SeeD); PaSteurizeD ProceSS aMerican cheeSe (Milk, water, Milkfat, cheeSe culture, SoDiuM citrate, Salt, citric aciD, SorBic aciD, SoDiuM PhoSPhate, color aDDeD, lactic aciD, acetic aciD, enzyMeS, Soy lecithin); Big Mac Sauce (SoyBean oil, Pickle reliSh [DiceD PickleS, high fructoSe corn SyruP, Sugar, vinegar, corn SyruP, Salt, calciuM chloriDe, xanthan guM, PotaSSiuM SorBate, SPice extractiveS, PolySorBate 80, DiStilleD vinegar, water, egg yolkS, high fructoSe corn SyruP, onion PowDer, MuStarD SeeD, Salt, SPiceS, ProPylene glycol alginate, SoDiuM Benzoate, MuStarD Bran, Sugar, garlic PowDer, vegetaBle Protein (hyDrolyzeD corn, Soy anD wheat), caraMel color, extractiveS of PaPrika, Soy lecithin, turMeric, calciuM DiSoDiuM eDta); Pickle SliceS (cucuMBerS, water, DiStilleD vinegar, Salt, calciuM chloriDe, aluM, PotaSSiuM SorBate, natural flavorS, PolySorBate 80, extractiveS of turMeric); lettuce; onionS.
45%
50%
25%
43%
15%
13%
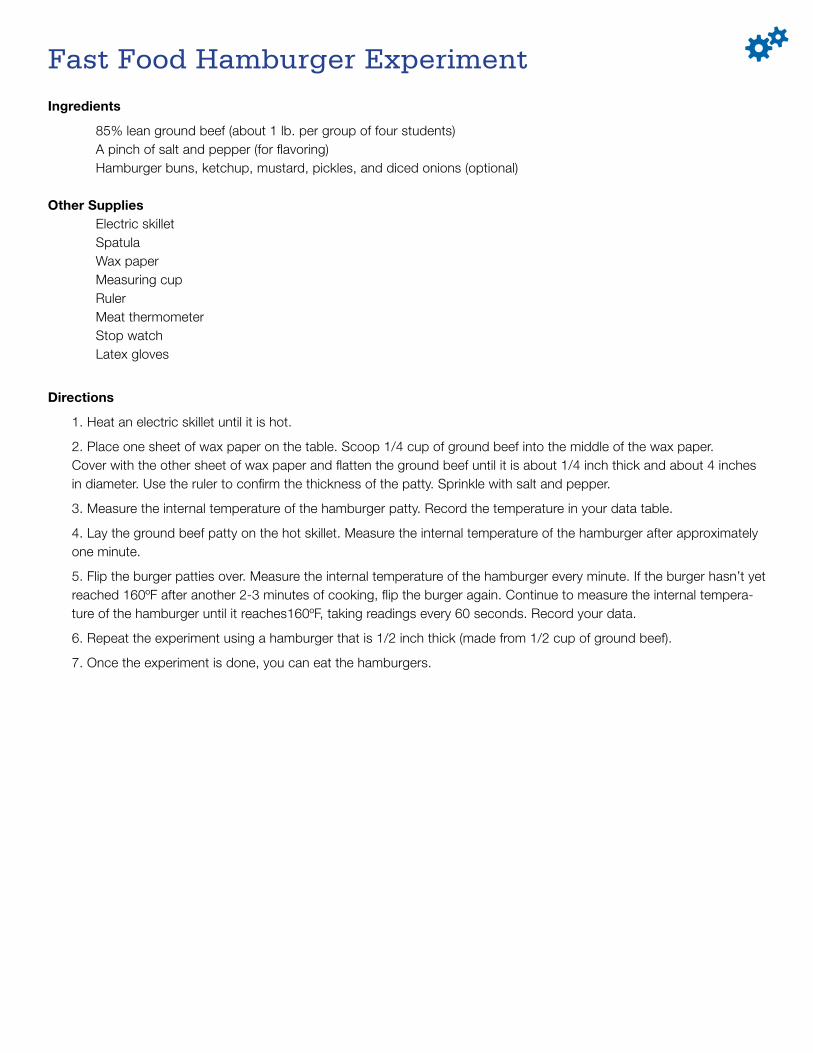
Fast Food Hamburger Experiment
Ingredients
85% lean ground beef (about 1 lb. per group of four students) A pinch of salt and pepper (for flavoring) Hamburger buns, ketchup, mustard, pickles, and diced onions (optional) Other Supplies Electric skillet Spatula Wax paper Measuring cup Ruler Meat thermometer Stop watch Latex gloves
Directions
1. Heat an electric skillet until it is hot.
2. Place one sheet of wax paper on the table. Scoop 1/4 cup of ground beef into the middle of the wax paper. Cover with the other sheet of wax paper and flatten the ground beef until it is about 1/4 inch thick and about 4 inches in diameter. Use the ruler to confirm the thickness of the patty. Sprinkle with salt and pepper.
3. Measure the internal temperature of the hamburger patty. Record the temperature in your data table.
4. Lay the ground beef patty on the hot skillet. Measure the internal temperature of the hamburger after approximately one minute.
5. Flip the burger patties over. Measure the internal temperature of the hamburger every minute. If the burger hasn’t yet reached 160ºF after another 2-3 minutes of cooking, flip the burger again. Continue to measure the internal tempera-ture of the hamburger until it reaches160ºF, taking readings every 60 seconds. Record your data.
6. Repeat the experiment using a hamburger that is 1/2 inch thick (made from 1/2 cup of ground beef).
7. Once the experiment is done, you can eat the hamburgers.
Food science scienceclub.northwestern.edu 10
Lesson 2: The Science of Soda
What You Need to KnowEveryone enjoys the fizzy fun of soda and about half of us consume a soda everyday (CDC). Drinking lots of soda is bad for your health- soda consumption is linked with obesity and diabetes. But what is in your soda and why it is bad for you?
There are three main parts to soda: carbonation, sugar, and acidity.• Carbonation: The fizziness of
soda is called carbonation and is added by dissolving carbon dioxide gas into the liquid. By itself, carbonation isn’t bad for you.
• Sugar: The average can of soda contains as much sugar as a candy bar and the sugar usually comes from high fructose corn syrup. Sugar has a lot of calories, which can lead to weight gain. In small amounts, sugar is okay but if you drink one soda every day for a month, you could gain a pound.
• Acidity: The average pH of soda is 2.5, which makes it very acidic. The carbonation process creates carbonic acid, plus soda companies add citric acid or phosphoric acid to make the soda taste better. But the acids can erode tooth enamel, damage the
Lesson Objectives• Learn about the nutritional contents of soda and its associated
health issues • Answer the questions: what is the effect of sugar and/or
carbonation on soda flavor? how does carbonation affect pH?
digestive system and can even lead to kidney damage.
In this lesson, each group will learn about the nutrition of soda and experiment with soda to determine how the amount of sugar affects soda flavor and how carbonation changes the taste and pH of soda.
Materials ¨ Measuring cups ¨ Small cups and plastic spoons ¨ Balance and weigh boats ¨ Measuring cup with mL markings ¨ Fizz Giz (www.fizzgiz.com), other
soda carbonating device, or grocery store carbonated water
¨ pH strips ¨ Flavor extracts ¨ Dropper or transfer pipets
Prep Work ¨ Buy a Fizz Giz and prepare soda
bottle caps for carbonating. ¨ Collect all ingredients and
assemble stations. ¨ Measure 1ml of each extract into
separate tubes or cups
Time60–90 minutes (total)
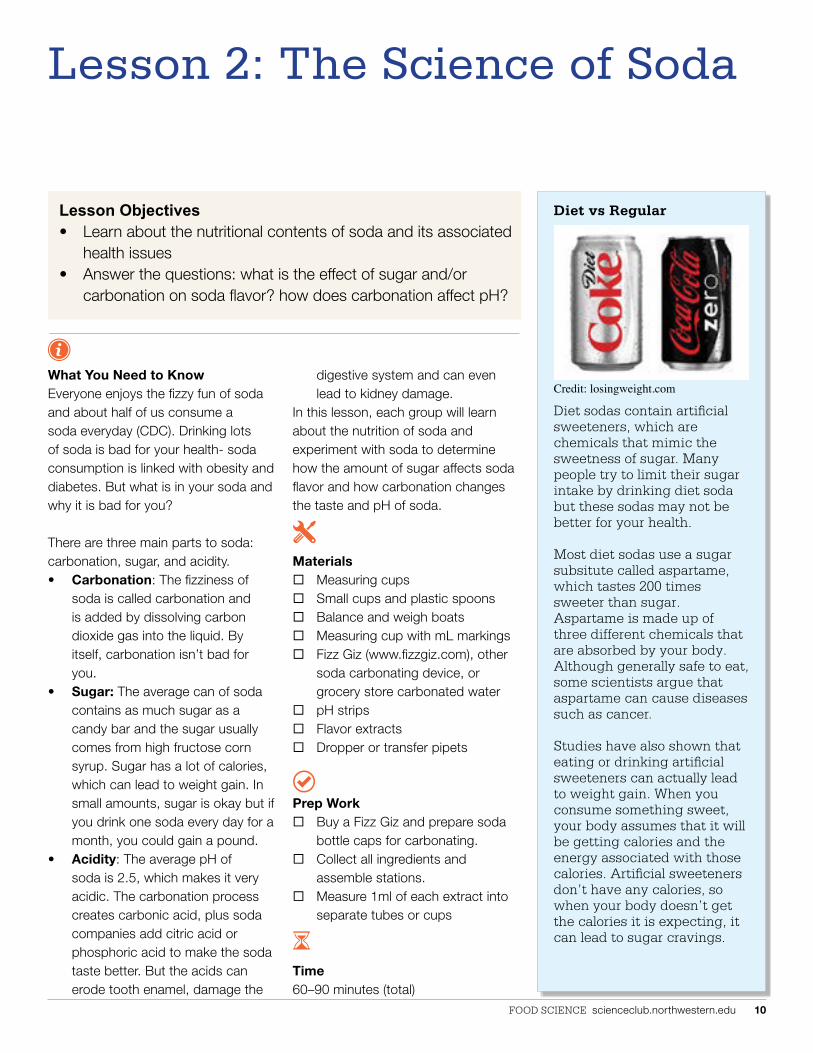
diet sodas contain artificial sweeteners, which are chemicals that mimic the sweetness of sugar. Many people try to limit their sugar intake by drinking diet soda but these sodas may not be better for your health.
Most diet sodas use a sugar subsitute called aspartame, which tastes 200 times sweeter than sugar. Aspartame is made up of three different chemicals that are absorbed by your body. Although generally safe to eat, some scientists argue that aspartame can cause diseases such as cancer.
studies have also shown that eating or drinking artificial sweeteners can actually lead to weight gain. When you consume something sweet, your body assumes that it will be getting calories and the energy associated with those calories. Artificial sweeteners don’t have any calories, so when your body doesn’t get the calories it is expecting, it can lead to sugar cravings.
Diet vs Regular
Credit: losingweight.com

Food science scienceclub.northwestern.edu 11
Warm-Up Questions Do you drink soda? How often?
What is your favorite kind of soda?
Procedure1. Use the warm up questions to
start a discussion about soda. Ask the kids if they think their favorite sodas have a lot of sugar in them.
2. Have the kids guess the amount of sugar in a can of soda. Use the measuring cups on your table to help with guessing. Have kids look at the nutrition label for Dr. Pepper (page 12) and then weigh out the amount of sugar in one 355ml can. Was it more or less than expected?
3. The American Heart Association recommends that we eat and drink no more than 36 grams of sugar (excluding the sugars naturally present in fruits and other foods) a day. What happens when we get more sugar than that in a day? Discuss how sugar can be bad for our health – obesity, diabetes, etc.
4. Continue examining the nutrition label for soda. What else is in soda? Use the infographic to learn more about soda. In this lesson, each group will try to answer these questions- Why does soda have so much sugar? Why is soda so acidic?
5. Use an experimental approach to investigate sugar and acidity in
soda. Practice converting the general questions in step 4 into experimental questions. It helps to give the kids a prompt, such as “What is the effect of X on Y?” If your group has trouble with this, use one of the following experimental questions : 1) What is the effect of the amount of sugar on soda flavor? and 2) What is the effect of carbonation on soda acidity and flavor?
Experiment 1: What is the effect of the amount of sugar on soda flavor?• Have the kids make a prediction-
how will the amount of sugar affect flavor?
• Make four sugar solutions: 0g sugar in 100ml of water 5.5g sugar in 100ml of water 11g sugar in 100ml water* 22g sugar in 100ml water * Same as a can of soda• Note: discuss controls and
variables with your group. Why are we testing 0g of sugar? Why do we always use 100ml of water?
• Taste the solutions. Are the solutions too sweet, not sweet enough, or just right? Rate the flavor of the solutions on a scale of 1-10 (1=awful, 10=great). Record your data in a data table.
Experiment #2: What is the effect of carbonation on soda acidity and/or flavor?
• Pick one of the sugar water solutions from Experiment #1.
• Make 200ml of that solution. Put 100ml of the sugar water in a small plastic soda bottle. Reserve the
Lesson 2: The Science of Soda, continued
other 100ml. Carbonate the solution in the plastic soda bottle using a Fizz Giz. Alternatively, you can add the sugar to 100ml of tap water and compare that to sugar in 100ml of carbonated water.
• Measure the pH of the two solutions using pH strips. Record your data in a data table. How does carbonation change the pH?
• Taste the two solutions. Rate the flavor on a scale of 1-10 (1=awful, 10=great) and record in your data table. How did carbonation change the flavor?
• To further test soda acidity, try adding a small amount (<1g) of citric acid to 100ml of sugar water. How does the citric acid change the pH and flavor?
6. As an optional activity, develop a soda flavor using the available extracts. Use a dropper to add a few drops of extract to 100ml of sugar water solution. Taste the solution. Does it need more of the same flavoring? Does it need a different flavoring extract? Continue to add extract, one drop at a time, until you reach the desired result. Record your recipe for soda flavoring.
7. Write a journal post to summarize your data from your experiments.
Concluding Discussion Based on your experiment, why does soda have so much sugar? How does carbonation affect the acidity and flavor of a sugar water solution?

Nutrit ion FactsServing Size 1 355ml (12 ounce) can
Amount Per ServingCalories 160 Calories from Fat 0
% Daily Value*
Total Fat 0 g
Saturated Fat 0 g
Trans Fat 0 g
Cholesterol 0 mg
Sodium 55 mg
Total Carbohydrate 40 g
Dietary Fiber 0 g
Sugars 40 g
Protein 0 g
* Percent Daily Values are based on a 2,000 calorie diet. Your daily values may be higher or lower depending on your calorie needs.
NutritionData.com
INGREDIENTS: CARBONATED WATER, HIGH FRUCTOSE CORN SYRUP, CARAMEL COLOR, PHOSPHORIC ACID, ARTIFICIAL AND NATURAL FLAVORS, SODIUM BENZOATE (PRESERVATIVE), CAFFEINE.
Dr. Pepper
0%
0%
0%
2%
13%
0%
Food science scienceclub.northwestern.edu 13
Lesson 3: The Science of Ice Cream
What You Need to Know Ice cream has been enjoyed for centuries and now on average, each American eats 48 pints of ice cream per year. Although tasty, ice cream can be extremely high in fat and cholesterol. Diets rich in fat can lead to conditions such as obesity and heart disease, which has been a leading cause of death in the United States. But what are fat and cholesterol?
Fats and cholesterol are both compounds that come from plant and animal cells, where in small amounts, they are actually necessary for keeping cells healthy. Fat and cholesterol are also found in many foods, including oil, butter, and cream. Humans like fatty foods since fat tastes really good to us. Our taste buds can actually detect fats in food, leading some scientists to argue it is our “sixth taste.” Since fat tastes so yummy, we want to eat a lot of it but this can be bad for our health.
In this lesson, students will learn more about fat and our sense of taste by making ice cream. This lesson plan uses liquid nitrogen to make ice cream but an alternative approach is also provided in the supplemental materials. Groups will experiment
Lesson Objectives• Learn more about fats and cholesterol• Understand the phase changes that occur while making ice
cream• Answer the question: What is the effect of fat on ice cream
flavor?
with different ice cream recipes to determine how fat affects ice cream flavor and in the process, they will learn about the science of ice cream crystallization and phase transitions.
Materials ¨ Stainless steel bowls ¨ Wooden spoons ¨ Measuring cups and spoons ¨ Liquid nitrogen ¨ Ingredients for ice cream recipes ¨ Eyedroppers ¨ Small Dixie cups ¨ Small bowls ¨ Plastic Spoons ¨ Safety goggles ¨ Insulated gloves
Prep Work ¨ Gather ingredients for ice cream ¨ Prepare 4 ice cream mixtures
(using the attached recipes) ¨ Acquire liquid nitrogen the morning
of the activity and prepare safety supplies
Time60–90 minutes (total)
Phase Transitions
elements can exist in three phases depending on the temperature of their surroundings: a solid, a liquid, or a gas. At cold temperatures, compounds generally exist as solids, like ice. At high temperatures, compounds exist as gases, like steam. At intermediate temperatures, compounds exist as liquids, like water. When compounds change from one form to another, they undergo one of the following “phase transitions”:
• Boiling/vaporization- liquid to gas
• Condensing- gas to liquid• Melting- solid to liquid• Freezing- liquid to solid• Sublimation- solid
transitions directly to a gas• Deposition- gas
transitions directly to solid
not all compounds need to be hot to boil (or vaporize), it depends on their properties. nitrogen forms weak chemical bonds compared to water. it takes less energy to pull nitrogen molecules apart. For example, water boils at 100 degrees celsius (212 degrees Fahrenheit), whereas nitrogen boils at -196 degrees celsius (-320 degrees Fahrenheit). This is why liquid nitrogen bubbles at room temperature, and you see the formation of vapor.
Food science scienceclub.northwestern.edu 14
• What is the variable that they are testing?
• What are the controls in the experiment? Why are we testing ice cream with just skim milk?
• Are there other variables that should be held constant? What are they?
5. Have the kids make a prediction- which mixture will have the best flavor? Why?
6. Begin experimenting by making Dippin’ Dots with the different recipes. To make the Dippin’ Dots:• Pour about 50mL of each ice
cream mixture into a separate small cup. Make sure to label the cup.
• Place a stainless steel bowl in the center of the table. Pour in a small amount of liquid nitrogen, about 1/2 inch deep
• Test one of the mixtures at a time. Use the eye dropper to quickly squeeze droplets of the mixture into the liquid nitrogen to form DippinDots.
• When all of the liquid nitrogen has evaporated, have each student taste the DippinDots and rate the flavor on a scale of 1-10. Record your data in a data table and take the average of each group members score. Record any other observations about the ice cream.
• Repeat with the remaining three ice cream mixtures.
Warm-Up Questions How often do you eat ice cream? What are your favorite flavors?
Is ice cream healthy? What are the healthy/unhealthy ingredients?
Procedure1. Begin a discussion about ice
cream using the warm-up questions. Ask the kids- what is in ice cream? Examine the nutrition labels and ingredients from Baskin Robbins ice cream (page 15). Use the infographic to learn more about ice cream.
2. Have the kids ever tried low-fat ice cream, frozen yougurt, or sorbet? What did they think of it? Discuss with the kids the fat content of ice cream. The challenge for today’s lesson is to answer the question- how does fat content affect ice cream flavor?
3. To perform the ice cream experiments, each group will work with liquid nitrogen. Safety note: Liquid nitrogen is -196oC (-320oF) and can cause frostbite. It is important to wear goggles and be very careful when stirring and working with it. Only adults will get to pour the liquid nitrogen.
4. Discuss the experimental design with the kids. They will be testing four different ice cream mixtures. Show them the recipes for the mixtures. Emphasize these points:
Lesson 3: The Science of Ice Cream, continued
7. During the experiment, the kids might have questions about the liquid nitrogen vapor and what the liquid nitrogen is doing to the ice cream. Discuss the phase changes that are occuring, using the sidebar for additional information.
8. If you do not have access to liquid nitrogen, use one of the alternative ice cream making methods described on page 17. Continue with the experiment as described.
9. Once the taste tests are complete, review your data. Take averages of the group taste ratings and if there is time, graph your group’s results. Discuss the the fat content of each ice cream mixture (page 19). How did fat affect the taste of the ice cream? Use your data to reach a conclusion.
10. As an optional activity, introduce the risks associated with eating too much fat. Discuss whether there are ways to make the ice cream healthier while still keeping it tasty.
11. Write a Science Club journal post to record your experiment.
Concluding Discussion Based on your experiment, how could ice cream be made healthier?
Why is it important to regulate fat intake?

Nutrit ion FactsServing Size 4 oz scoop (113g)
Amount Per ServingCalories 300 Calories from Fat 140
% Daily Value*
Total Fat 15 g
Saturated Fat 10 g
Trans Fat 0 g
Cholesterol 50 mg
Sodium 135 mg
Total Carbohydrate 36 g
Dietary Fiber 0 g
Sugars 30 g
Protein 5 g
Vitamin A 8% Vitamin C 2%
Calcium 15% Iron 2%* Percent Daily Values are based on a 2,000 calorie diet. Your daily values may be higher or lower depending on your calorie needs.
INGREDIENTS: creaM, nonfat Milk, cookie Dough [wheat flour, Brown Sugar, Margarine (PalM oil, water, SoyBean oil, Salt, Mono anD DiglyceriDeS, Soy lecithin an eMulSifier, SoDiuM Benzoate (PreServative), citric aciD, natural anD artificial flavor, Beta carotene (color), vitaMin a PalMitate, whey), Sugar, chocolate flavoreD chiPS (Sugar, Partially hyDrogenateD PalM kernel oil, cocoa, cocoa (ProceSSeD with alkali), DextroSe, Soy lecithin an eMulSifier), PaSteurizeD eggS, nonfat Dry Milk, corn Starch, natural anD artificial flavor, Baking SoDa, Baking PowDer (SoDiuM BicarBonate, aluMinuM Sulfate, calciuM carBonate, corn Starch, MonocalciuM PhoSPhate), anD Salt], Sugar, corn SyruP, chocolate flavoreD chiPS (Sugar, Partially hyDrogenateD PalM kernel oil, cocoa (ProceSSeD with alkali), DextroSe, Soy lecithin an eMulSifier), whey PowDer, eMulSifier/StaBilizer BlenD (celluloSe guM, Mono anD DiglyceriDeS, guar guM, carrageenan, PolySorBate 80), natural anD artificial flavor, natural flavor, caraMel color, annatto color.
Baskin Robbins® Chocolate Chip Cookie Dough Ice Cream
23%
50%
17%
6%
12%
0%

Lesson 3Ice Cream Recipes Ice Cream: Mixture 1(8, ½ cup servings)
Ingredients:• 2/3 cup sugar• 1/8th teaspoon of salt• 1 2/3 cups whipping cream• 1 1/3 cups half-and-half• 1 ½ teaspoon vanilla extract
Ice Cream: Mixture 2(8, ½ cup servings)
Ingredients:• 2/3 cup sugar• 1/8th teaspoon of salt• 3 cups half-and-half• 1 ½ teaspoon vanilla extract
Ice Cream: Mixture 3(8, ½ cup servings)
ngredients:• 2/3 cup sugar• 1/8th teaspoon of salt• 3 cups whole milk• 1 ½ teaspoon vanilla extract
Ice Cream: Mixture 4(8, ½ cup servings)
Ingredients:• 2/3 cup sugar• 1/8th teaspoon of salt• 3 cups skim milk• 1 ½ teaspoon vanilla extract
To make the ice cream mixtures, combine ingredients in a bowl, bottle, or storage container. Stir until the sugar has dissolved in the milk. Store mixtures in the refridgerator until ready to use.
Food science scienceclub.northwestern.edu 17
Alternative Methods for Making Ice Cream
The Plastic Baggie MethodSource: http://familyfun.go.com/recipes/homemade-ice-cream-in-a-bag-684806/
Materials Ingredients for ice cream mixtures (enough for 1 cup of each mixture per group) Kosher or rock salt Ice cubes 1 gallon-sized Ziploc bag (per mixture) 1 pint-sized Ziploc bag (per mixture)
Procedure1. Combine ice cream ingredients as described in the recipe.2. Pour 1 cup of each ice cream mixture into a separate pint-sized Ziploc bag. Seal the bag tightly.3. Combine 1/2 cup of salt and enough ice cubes to fill the gallon-sized Ziploc bag halfway. Place the sealed smaller bag
inside. Seal the larger bag and shake the two bags until the ice cream mixture hardens, about 5 minutes. The ice cream will have the consistency of soft serve ice cream.
4. Take the smaller bag out of the larger bag and use the ice cream for taste test experiments.
The Paint Can MethodSource: http://crafts.kaboose.com/coffee-can-ice-cream.html
Materials Ingredients for ice cream mixtures (enough for 1 cup of each mixture per group) Kosher or rock salt Ice cubes 1 clean gallon-sized paint can with lid 1 clean pint-sized paint can with lid
Procedure1. Combine ice cream ingredients as described in the recipe.2. Pour 1 cup of each ice cream mixture into the pint-sized paint can. Seal the can with the lid. Hammer gently to make
sure the lid is on completely. 3. Combine 1/2 cup of salt and enough ice cubes to fill the gallon-sized paint can halfway. Place the sealed smaller can
inside. Seal the larger can and lightly hammer the lid. Shake or roll the two cans until the ice cream mixture hardens, about 15-30 minutes. Note: this process will be noisy. When done, the ice cream will have the consistency of soft serve ice cream.
4. Take the smaller can out of the larger can and use the ice cream for taste test experiments.

ICe
Crea
mra
Te T
aST
e
(sca
le o
f 1 to
10)
Oth
er O
bser
vatio
ns
mix
ture
1
mix
ture
2
mix
ture
3
mix
ture
4
Le
sso
n 3
Ta
ste
Te
st T
ab
le
Have
the
stud
ents
rate
the
flavo
rs o
f the
four
ice
crea
m m
ixtu
res o
n a
scal
e of
1 to
10
(10
bein
g th
e ta
sties
t).
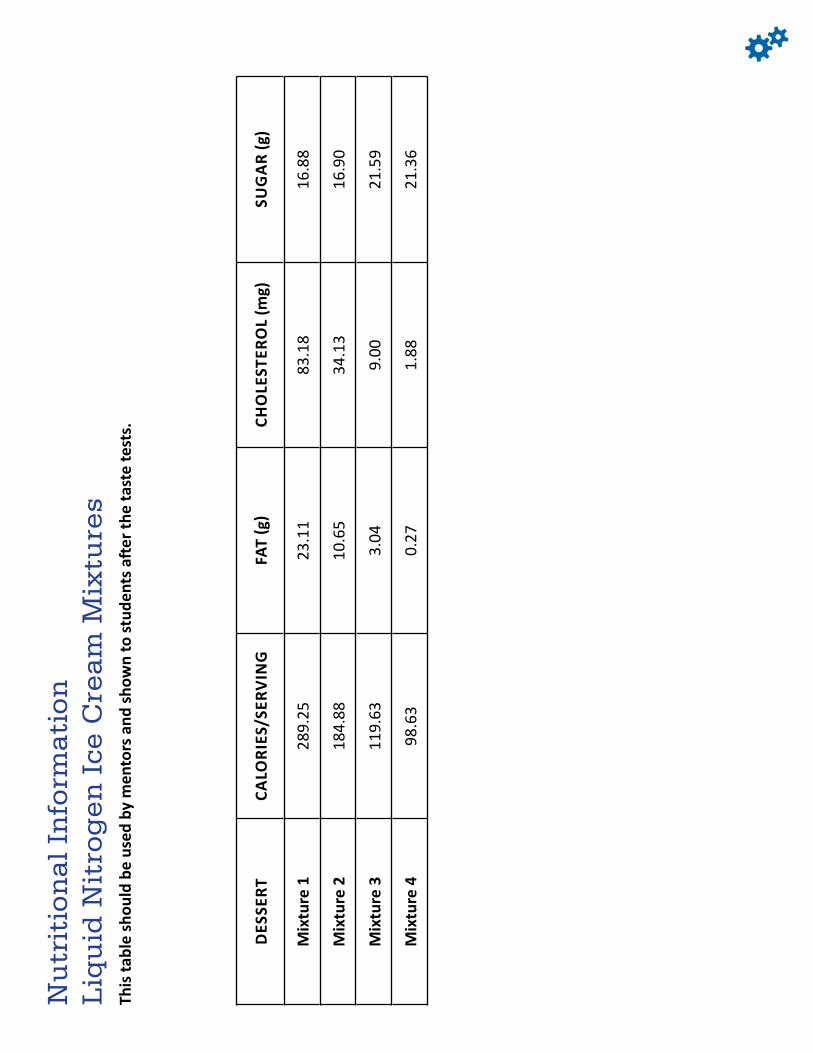
DeS
SerT
Calo
rIeS
/Ser
vIn
gFa
t (g
)Ch
ole
STer
ol
(mg)
Sug
ar
(g)
mix
ture
128
9.25
23.1
183
.18
16.8
8
mix
ture
218
4.88
10.6
534
.13
16.9
0
mix
ture
311
9.63
3.04
9.00
21.5
9
mix
ture
498
.63
0.27
1.88
21.3
6
Nu
trit
ion
al
Info
rma
tio
nL
iqu
id N
itro
ge
n I
ce C
rea
m M
ixtu
res
th
is ta
ble
shou
ld b
e us
ed b
y m
ento
rs a
nd sh
own
to st
uden
ts a
fter t
he ta
ste
test
s.

Food science scienceclub.northwestern.edu 20
Lesson 4: The Science of Pancakes
What You Need to KnowBaked goods, such as cookies, cake, and pancakes, contain a lot of sugar and fat, which makes them delicious but also unhealthy (as previously discussed). They also contain flour, which is usually made from refined wheat grain. Refined grains are ones that have been processed to remove the outer layers of the grain, called the bran and germ. These layers contain fiber, which keeps our digestive systems healthy, reduces cholesterol, and controls our blood sugar. Refined grains do not have much fiber, which means they don’t contribute to our health. The USDA recommends that we eat more fiber and whole grains in our diets.
Another key component of baked goods is a leavening agent. Leavening agents are substances added to baked goods to make them light and fluffy. Leavining agents produce gas, which gets trapped in the dough and causes it to expand. There are several types of leavening: • Mechanical Leaveners: Whisking
creams, eggs, or sugar and butter together adds air bubbles to the mixture.
• Biological Leaveners: Yeast is an
Lesson Objectives• Learn about chemical reaction behind leavening agents• Learn about refined vs. whole grain flours• Answer the question: What is the effect of leavening agents
or different types of flour on pancake fluffiness?
organism that produces carbon dioxide through fermentation.
• Chemical Leaveners: Baking powder and baking soda both generate carbon dioxide when mixed with the right ingredients.
The flour and leavening agents used in preparing baked goods will affect both the taste and the texture of the food. In this lesson, groups will experiment with leavening as well as different grains to determine their effect on the fluffiness of pancakes.
Materials
¨ Ingredients for pancake recipe ¨ Whisk ¨ Electric griddles or flat pans to use
with hot plates ¨ Measuring cups and spoons ¨ Mixing bowls ¨ Rulers
Prep Work ¨ Buy ingredients ¨ Prepare for pancake cooking
stations
Both baking soda and baking powder produce carbon dioxide gas in the presence of moisture. But moisture alone is not enough to activate these leavening agents- an acid is needed too. Think about what happens when baking soda is mixed with vinegar- you get lots of bubbles. The same thing happens while baking and all those bubbles help make fluffly cakes, cookies, and pancakes.
Recipes with baking soda often include an acidic ingredient, such as buttermilk, cream of tartar, or vinegar, to create carbon dioxide bubbles.
in contrast to that, baking powder contains an acid already. Baking powder is a mix of baking soda, an acidic salt, and cornstarch. When water hits the baking powder, the baking soda and the acidic salt combine to create the carbon dioxide gas.
Credit: bigoven.com
Baking Powder vs. Baking Soda
Time60–90 minutes (total)
Food science scienceclub.northwestern.edu 21
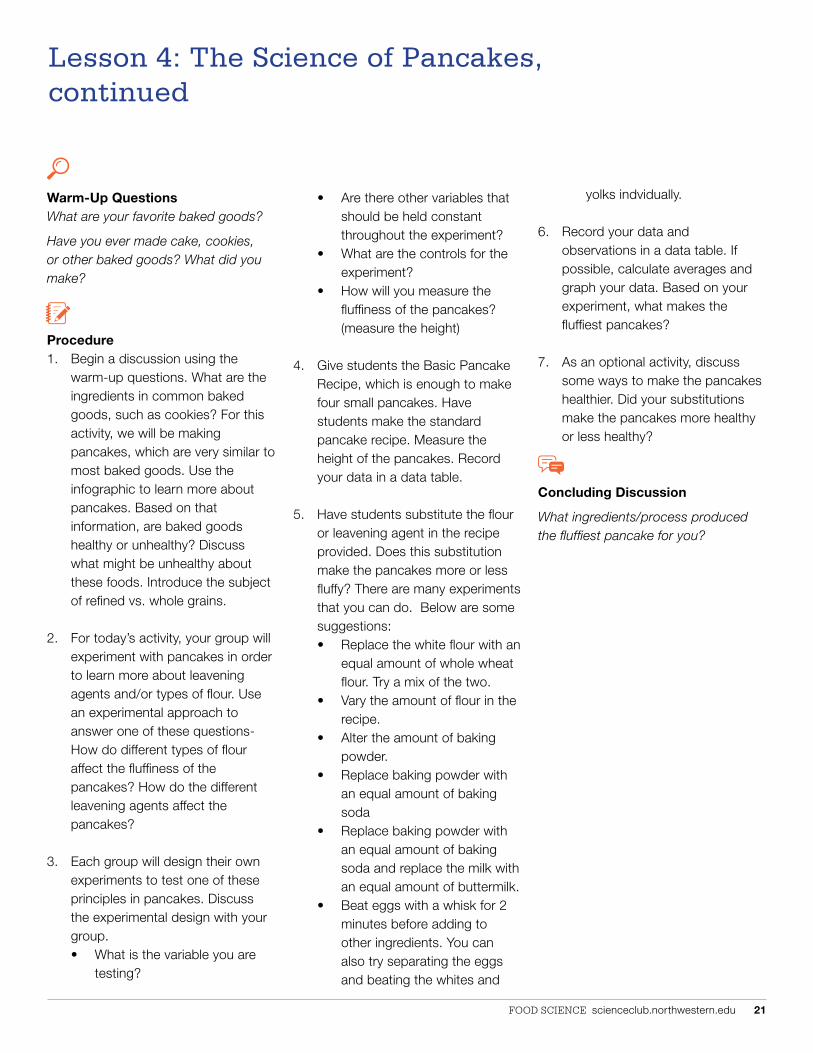
yolks indvidually.
6. Record your data and observations in a data table. If possible, calculate averages and graph your data. Based on your experiment, what makes the fluffiest pancakes?
7. As an optional activity, discuss some ways to make the pancakes healthier. Did your substitutions make the pancakes more healthy or less healthy?
Concluding Discussion
What ingredients/process produced the fluffiest pancake for you?
Warm-Up Questions What are your favorite baked goods?
Have you ever made cake, cookies, or other baked goods? What did you make?
Procedure 1. Begin a discussion using the
warm-up questions. What are the ingredients in common baked goods, such as cookies? For this activity, we will be making pancakes, which are very similar to most baked goods. Use the infographic to learn more about pancakes. Based on that information, are baked goods healthy or unhealthy? Discuss what might be unhealthy about these foods. Introduce the subject of refined vs. whole grains.
2. For today’s activity, your group will experiment with pancakes in order to learn more about leavening agents and/or types of flour. Use an experimental approach to answer one of these questions- How do different types of flour affect the fluffiness of the pancakes? How do the different leavening agents affect the pancakes?
3. Each group will design their own experiments to test one of these principles in pancakes. Discuss the experimental design with your group. • What is the variable you are
testing?
• Are there other variables that should be held constant throughout the experiment?
• What are the controls for the experiment?
• How will you measure the fluffiness of the pancakes? (measure the height)
4. Give students the Basic Pancake Recipe, which is enough to make four small pancakes. Have students make the standard pancake recipe. Measure the height of the pancakes. Record your data in a data table.
5. Have students substitute the flour
or leavening agent in the recipe provided. Does this substitution make the pancakes more or less fluffy? There are many experiments that you can do. Below are some suggestions:• Replace the white flour with an
equal amount of whole wheat flour. Try a mix of the two.
• Vary the amount of flour in the recipe.
• Alter the amount of baking powder.
• Replace baking powder with an equal amount of baking soda
• Replace baking powder with an equal amount of baking soda and replace the milk with an equal amount of buttermilk.
• Beat eggs with a whisk for 2 minutes before adding to other ingredients. You can also try separating the eggs and beating the whites and
Lesson 4: The Science of Pancakes, continued

Nutrit ion FactsServing Size 3 pancakes (short stack) without syrup**
Amount Per ServingCalories 490
% Daily Value*
Total Fat 18 g
Saturated Fat 8 g
Trans Fat 1 g
Cholesterol 80 mg
Sodium 1610 mg
Total Carbohydrate 69 g
Dietary Fiber 4 g
Sugars 13 g
Protein 13 g
Vitamin A 0% Vitamin C 0%
Calcium 0% Iron 0%* Percent Daily Values are based on a 2,000 calorie diet. Your daily values may be higher or lower depending on your calorie needs.
NutritionData.com
IHOP Buttermilk Pancakes
28%
40%
27%
67%
23%
16%
** 1 fl oz (2 Tablespoons) of Regular Old Fashioned Maple Pancake Syrup adds 110 calories, 27 g carbohydrate, and 18g sugar.
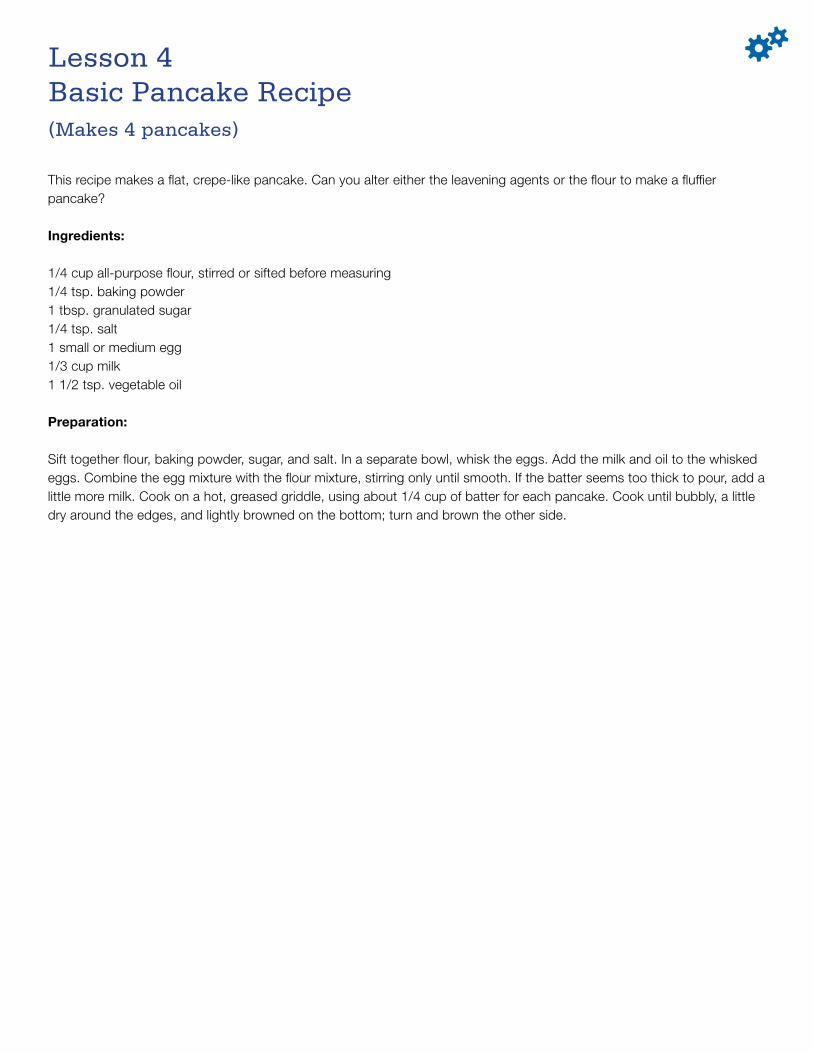
This recipe makes a flat, crepe-like pancake. Can you alter either the leavening agents or the flour to make a fluffier pancake?
Ingredients:
1/4 cup all-purpose flour, stirred or sifted before measuring1/4 tsp. baking powder1 tbsp. granulated sugar1/4 tsp. salt1 small or medium egg1/3 cup milk1 1/2 tsp. vegetable oil
Preparation:
Sift together flour, baking powder, sugar, and salt. In a separate bowl, whisk the eggs. Add the milk and oil to the whisked eggs. Combine the egg mixture with the flour mixture, stirring only until smooth. If the batter seems too thick to pour, add a little more milk. Cook on a hot, greased griddle, using about 1/4 cup of batter for each pancake. Cook until bubbly, a little dry around the edges, and lightly browned on the bottom; turn and brown the other side.
Lesson 4Basic Pancake Recipe (Makes 4 pancakes)

Pan
Cake
Pan
Cake
flu
ffIn
eSS
raTe
Ta
STe
(sca
le o
f 1 to
10)
Le
sso
n 4
Ta
ste
Te
st T
ab
le
Food science scienceclub.northwestern.edu 25
Lesson 5: The Science of Snack Foods
What You Need to Know Potato chips, corn chips, and popcorn are common favorite snacks among Americans, yet their consumption comes at a cost. The average snack food is high in salt, which has been shown to contribute to obesity, hypertension, diabetes, heart attack and stroke. Salt activates our taste buds and enhances flavor detection.
Other chemicals added to snack food also make them taste better. stay fresh, add color or create a more pleasant texture. These chemicals, called food additives, are most often found in flavor powders covering snack foods and there are a lot of them. The Flamin’ Hot powder on Cheetos contains 23 ingredients while sour cream and onion potato chips have 14 different ingredients in the flavor powder. One common additive, glutamate, comes in the form of monosodium glutamate (MSG, also known as Accent), yeast extract, or whey protein concentrate and it enhances the umami flavor in food. Combined, salt and food additives create yummy snacks that are highly addictive but maybe not so good for our health.
In this lesson, students will experiment
Lesson Objectives• Explore the concept of a serving size.• Learn about salt and food additives in snack foods • Answer the question: How do salt or MSG affect the flavor of
snack foods?
with salt and MSG to determine how these additives affect food flavor. They will also learn about serving sizes and our desire to eat more than we should.
Materials ¨ Various bags of chips, including
unsalted, salted, and flavored ¨ Paper plates ¨ Scales ¨ Bags of unsalted, unflavored
popcorn ¨ Ingredients for flavor powder
recipes ¨ Spray bottles filled with water ¨ Small paper bags
Prep Work ¨ Place bags of chips, popcorn,
paper plates, and a scale at each table.
¨ Measure 1 tbsp. of each seasoning into a small cup. Prepare one cup of each seasoning per group.
Time
60–90 minutes total.
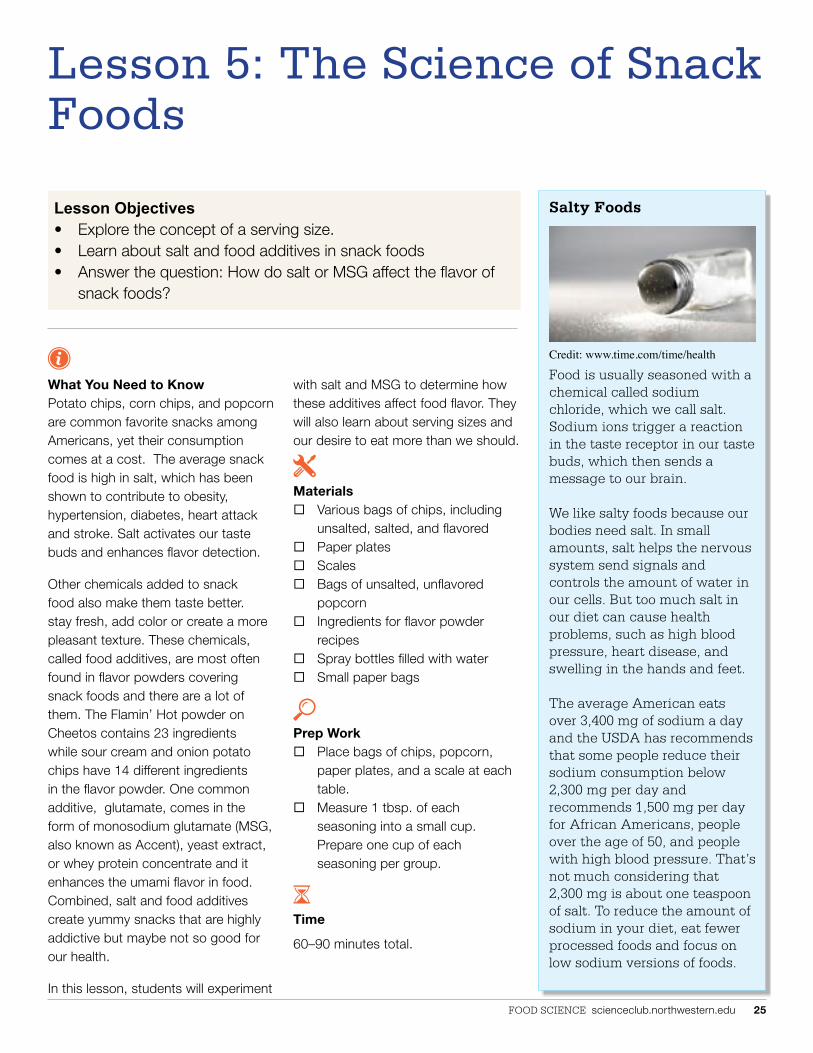
Salty Foods
Food is usually seasoned with a chemical called sodium chloride, which we call salt. sodium ions trigger a reaction in the taste receptor in our taste buds, which then sends a message to our brain.
We like salty foods because our bodies need salt. in small amounts, salt helps the nervous system send signals and controls the amount of water in our cells. But too much salt in our diet can cause health problems, such as high blood pressure, heart disease, and swelling in the hands and feet.
The average American eats over 3,400 mg of sodium a day and the UsdA has recommends that some people reduce their sodium consumption below 2,300 mg per day and recommends 1,500 mg per day for African Americans, people over the age of 50, and people with high blood pressure. That’s not much considering that 2,300 mg is about one teaspoon of salt. To reduce the amount of sodium in your diet, eat fewer processed foods and focus on low sodium versions of foods.
Credit: www.time.com/time/health

Food science scienceclub.northwestern.edu 26
small paper bag. Next lightly spray the popcorn with water before placing in the paper bag. Shake it up and rate the flavor of the different recipes. Record your data in a data table.
7. Based on your experiment, what is the effect of salt or MSG on the flavor of snack foods? What amount of salt or MSG makes the best flavor?
8. As an optional activity, discuss the nutrition of snack foods and look at the recipes from your experiment. Do you think that you made healthy or unhealthy recipe? What are some ways to make snack foods healthier?
9. Write a journal post to share your experiment and discuss your data.
Concluding Discussion
Why do you think the chip and popcorn companies use so many different ingredients?
Warm-Up Questions How often do you eat chips? What are your favorite kinds?
If you have a small bag of chips or popcorn do you feel like that is enough or do you want more?
Procedure1. Begin a discussion about snack
foods using the warm-up questions. How often and in what quantity do the kids eat chips and popcorn?
2. What is a serving size? Do a demonstration with the kids to illustrate the difference between what we want to eat and what is recommended on the nutrition label. • Using a family size bag of
chips, let the students take as many chips as they would like to eat and put them on a plate. Let them weigh and record the weights of their servings.
• Look at the nutrition label on the bag of chips. Weigh out the recommended serving size. How is that different from the amount the kids pulled out?
• Calculate the amount of calories and fat in the kids’ desired serving.
• Compare the nutrition information for popular snack foods using the included tables on pages 27 and 28.
3. Do the flavors on chips and popcorn make them more appealing? Do a taste test to compare potato chips without salt, with salt, and with other flavorings. Have the kids record taste scores for the different chips. Which one tastes the best? Do some people like the flavorful chips more than others?
4. Look at the ingredient list for Flamin’ Hot Cheetos, Sour Cream and Onion potato chips, and Cool Ranch Doritos. What is in these foods? Use the infographics to learn more about snack foods.
5. Perform an experiment to determine how salt or monosodium glutamate (MSG or Accent) affects the flavor of snack food. Use one of the included flavor powder recipes and design an experiment to test the effect of salt or MSG. An easy approach is to vary either the amount of salt or MSG in the recipe. Discuss the experimental design with your group:• What is the variable that you
are testing? How many variables can you test at one time?
• What are some other variables that need to be held constant?
• What are your controls?• How are you going to measure
the effect on flavor?
6. Make your flavor powders and use them to coat plain microwave popcorn. Mix the seasoning in a
Lesson 5: The Science of Snack Foods, continued
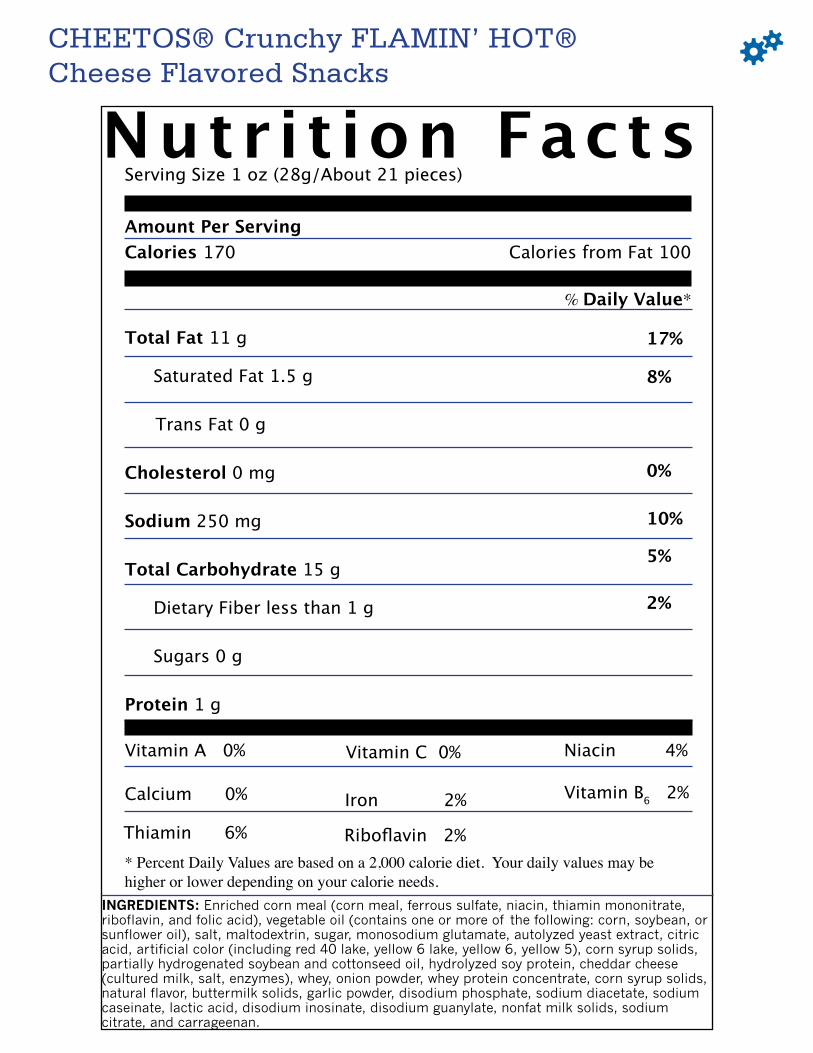
Nutrit ion FactsServing Size 1 oz (28g/About 21 pieces)
Amount Per ServingCalories 170 Calories from Fat 100
% Daily Value*
Total Fat 11 g
Saturated Fat 1.5 g
Trans Fat 0 g
Cholesterol 0 mg
Sodium 250 mg
Total Carbohydrate 15 g
Dietary Fiber less than 1 g
Sugars 0 g
Protein 1 g
Vitamin A 0% Vitamin C 0%
Calcium 0% Iron 2%
* Percent Daily Values are based on a 2,000 calorie diet. Your daily values may be higher or lower depending on your calorie needs.
INGREDIENTS: Enriched corn meal (corn meal, ferrous sulfate, niacin, thiamin mononitrate, riboflavin, and folic acid), vegetable oil (contains one or more of the following: corn, soybean, or sunflower oil), salt, maltodextrin, sugar, monosodium glutamate, autolyzed yeast extract, citric acid, artificial color (including red 40 lake, yellow 6 lake, yellow 6, yellow 5), corn syrup solids, partially hydrogenated soybean and cottonseed oil, hydrolyzed soy protein, cheddar cheese (cultured milk, salt, enzymes), whey, onion powder, whey protein concentrate, corn syrup solids, natural flavor, buttermilk solids, garlic powder, disodium phosphate, sodium diacetate, sodium caseinate, lactic acid, disodium inosinate, disodium guanylate, nonfat milk solids, sodium citrate, and carrageenan.
CHEETOS® Crunchy FLAMIN’ HOT® Cheese Flavored Snacks
Thiamin 6% Riboflavin 2%
17%
8%
0%
10%
5%
2%
Niacin 4%
Vitamin B6 2%
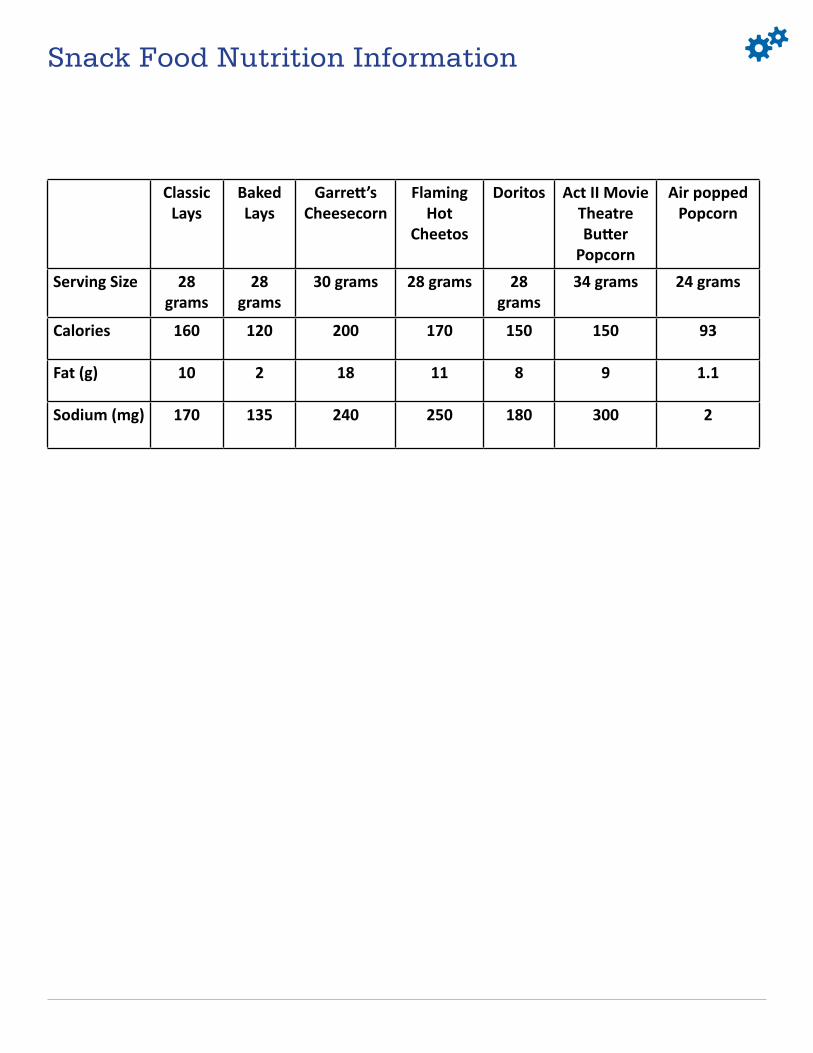
Snack Food Nutrition Information
Classic lays
Baked lays
Garrett’s Cheesecorn
flaming hot
Cheetos
Doritos act II movie Theatre Butter
Popcorn
air popped Popcorn
Serving Size 28 grams
28 grams
30 grams 28 grams 28 grams
34 grams 24 grams
Calories 160 120 200 170 150 150 93
fat (g) 10 2 18 11 8 9 1.1
Sodium (mg) 170 135 240 250 180 300 2
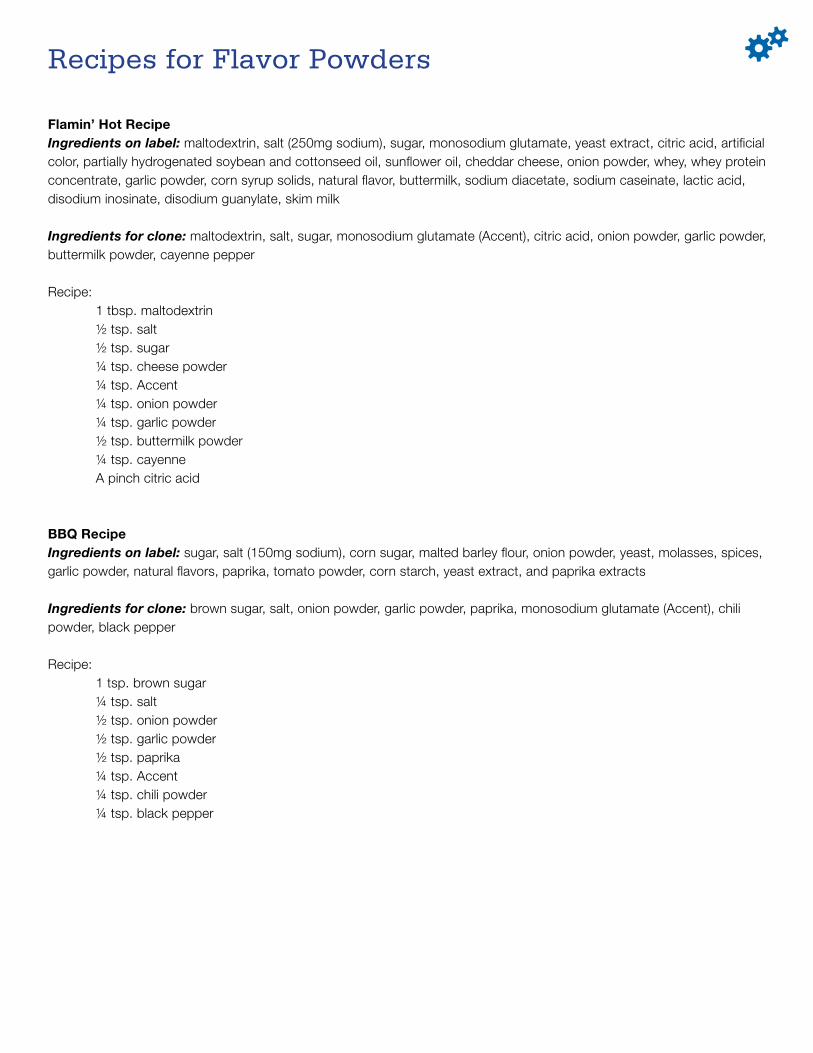
Recipes for Flavor Powders
Flamin’ Hot RecipeIngredients on label: maltodextrin, salt (250mg sodium), sugar, monosodium glutamate, yeast extract, citric acid, artificial color, partially hydrogenated soybean and cottonseed oil, sunflower oil, cheddar cheese, onion powder, whey, whey protein concentrate, garlic powder, corn syrup solids, natural flavor, buttermilk, sodium diacetate, sodium caseinate, lactic acid, disodium inosinate, disodium guanylate, skim milk
Ingredients for clone: maltodextrin, salt, sugar, monosodium glutamate (Accent), citric acid, onion powder, garlic powder, buttermilk powder, cayenne pepper
Recipe: 1 tbsp. maltodextrin ½ tsp. salt ½ tsp. sugar ¼ tsp. cheese powder ¼ tsp. Accent ¼ tsp. onion powder ¼ tsp. garlic powder ½ tsp. buttermilk powder ¼ tsp. cayenne A pinch citric acid
BBQ RecipeIngredients on label: sugar, salt (150mg sodium), corn sugar, malted barley flour, onion powder, yeast, molasses, spices, garlic powder, natural flavors, paprika, tomato powder, corn starch, yeast extract, and paprika extracts Ingredients for clone: brown sugar, salt, onion powder, garlic powder, paprika, monosodium glutamate (Accent), chili powder, black pepper
Recipe: 1 tsp. brown sugar ¼ tsp. salt ½ tsp. onion powder ½ tsp. garlic powder ½ tsp. paprika ¼ tsp. Accent ¼ tsp. chili powder ¼ tsp. black pepper
Food science scienceclub.northwestern.edu 30
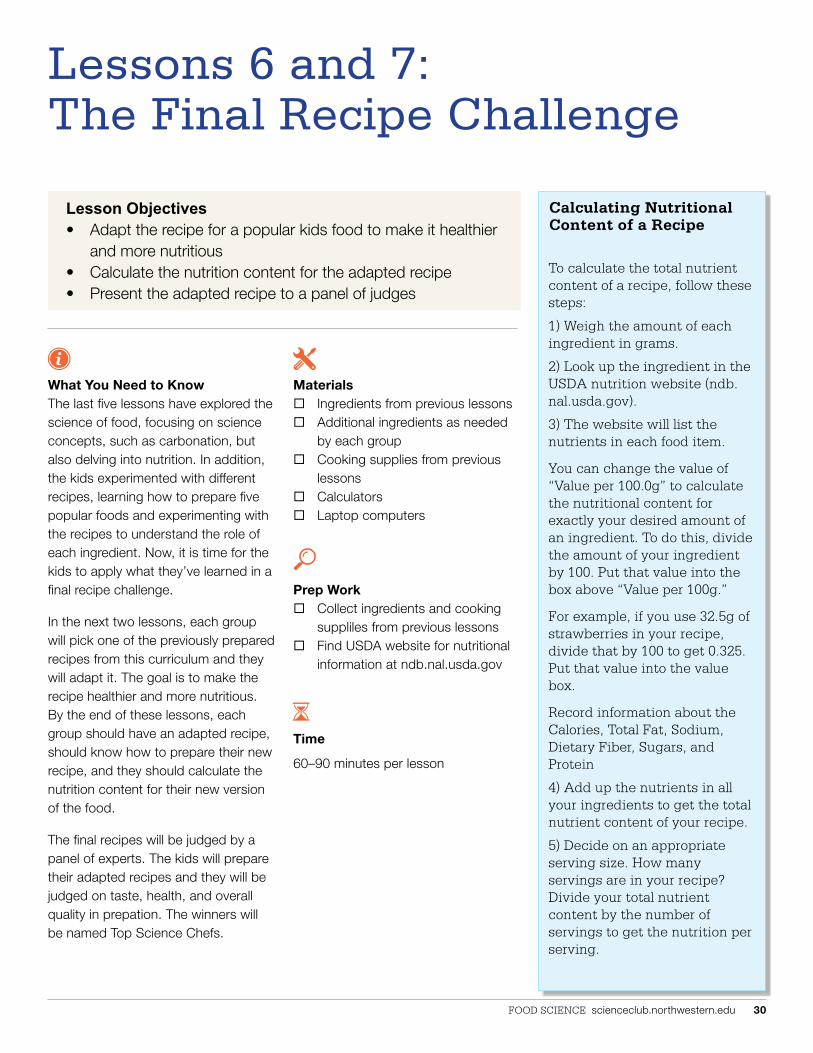
Lessons 6 and 7: The Final Recipe Challenge
What You Need to Know The last five lessons have explored the science of food, focusing on science concepts, such as carbonation, but also delving into nutrition. In addition, the kids experimented with different recipes, learning how to prepare five popular foods and experimenting with the recipes to understand the role of each ingredient. Now, it is time for the kids to apply what they’ve learned in a final recipe challenge.
In the next two lessons, each group will pick one of the previously prepared recipes from this curriculum and they will adapt it. The goal is to make the recipe healthier and more nutritious. By the end of these lessons, each group should have an adapted recipe, should know how to prepare their new recipe, and they should calculate the nutrition content for their new version of the food.
The final recipes will be judged by a panel of experts. The kids will prepare their adapted recipes and they will be judged on taste, health, and overall quality in prepation. The winners will be named Top Science Chefs.
Lesson Objectives• Adapt the recipe for a popular kids food to make it healthier
and more nutritious• Calculate the nutrition content for the adapted recipe • Present the adapted recipe to a panel of judges
Materials ¨ Ingredients from previous lessons ¨ Additional ingredients as needed
by each group ¨ Cooking supplies from previous
lessons ¨ Calculators ¨ Laptop computers
Prep Work ¨ Collect ingredients and cooking
suppliles from previous lessons ¨ Find USDA website for nutritional
information at ndb.nal.usda.gov
Time
60–90 minutes per lesson
Calculating Nutritional Content of a Recipe
To calculate the total nutrient content of a recipe, follow these steps:
1) Weigh the amount of each ingredient in grams.
2) Look up the ingredient in the UsdA nutrition website (ndb.nal.usda.gov).
3) The website will list the nutrients in each food item.
You can change the value of “Value per 100.0g” to calculate the nutritional content for exactly your desired amount of an ingredient. To do this, divide the amount of your ingredient by 100. Put that value into the box above “Value per 100g.”
For example, if you use 32.5g of strawberries in your recipe, divide that by 100 to get 0.325. Put that value into the value box.
Record information about the calories, Total Fat, sodium, dietary Fiber, sugars, and Protein
4) Add up the nutrients in all your ingredients to get the total nutrient content of your recipe.
5) decide on an appropriate serving size. How many servings are in your recipe? divide your total nutrient content by the number of servings to get the nutrition per serving.

Food science scienceclub.northwestern.edu 31
Lessons 6 and 7: The Science of Snack Foods, continued
Warm-Up Questions Which was your favorite recipe to prepare- hamburgers, soda, ice cream, pancakes, or snack foods?
What are some ways to make foods healthier?
Procedure1. Begin a discussion about the
recipes we prepared in the last five lessons. What did they make? What were some of the ingredients in those foods? Could those foods be made healthier?
2. Introduce the Challenge activity- to change one of the recipes to make it healthier and more nutritious.
3. As part of this challenge, each group will need to adapt one recipe, calculate its nutritional content, and present their recipe to a panel of judges.
4. To begin, each group will be randomly assigned a recipe to adapt. Look at the recipe again. Which ingredients are unhealthy? Which ones are healthy?
5. Brainstorm some ways to make the recipe healthier. Could you reduce the amount of fat, sugar, salt, or processed ingredients in the recipe? Could you increase the amount of whole grains, fruits, or vegetables? Look at the available healthy ingredients to get inspiration.
6. Write a rought draft of your healthier recipe. How is the new recipe healthier or more nutritious than the original recipe?
7. Try to make the new recipe. How does it taste? Are there improvements that could be made to the recipe?
8. Once your group has tried making the recipe, edit the new recipe as needed.
9. Now your group is ready to prepare its presentation materials. They will need to have 1) a printed copy of the recipe, 2) a printed nutrition content form, and 3) a description of how their recipe is healthier than the original.
10. To calculate the nutritional content, use the sidebar on page 30 for reference. You can also calculate the nutritional content of your new recipe and the original recipe. Compare the numbers. How is your new recipe more healthy or nutritous than the original?
11. Discuss with the judging criteria for the Final Recipe Challenge (see sidebar and rubric on page 33). Help your kids write and practice a very short presentation for the judges that includes how they changed the recipe and why that change makes it healthier.
Concluding Discussion What are some ways that you can include healthier foods in your diet?
each group has been assigned a recipe for the Final Recipe challenge. The goal is to make the recipe healthier but also tasty.
For the final challenge, groups will compete against each other in five categories: 1) hamburgers, 2) soda, 3) ice cream, 4) pancakes, and 5) snack foods. They will create a new healthy recipe, calculate its nutritional content, and prepare the recipe for a panel of judges.
The groups will give a brief introduction to their new recipe.
The judges will evaluate the recipes based on:
Health and Nutrition: How healthy is the new recipe compared to the original recipe?
Taste: Judges will rate the taste of each food. did the adjustments to make the food healthier also make it taste worse?
Overall Preparation: How well did each group prepare their foods? Were the pancakes burned? Were the hamburgers cooked through?
The winners of each category will be named Top science chefs.
Final Recipe Challenge:Judging Criteria
Nutrit ion FactsServing Size
Amount Per ServingCalories Calories from Fat
% Daily Value*
Total Fat
Saturated Fat
Trans Fat
Cholesterol
Sodium
Total Carbohydrate
Dietary Fiber
Sugars
Protein
* Percent Daily Values are based on a 2,000 calorie diet. Your daily values may be higher or lower depending on your calorie needs.
NutritionData.com
INGREDIENTS:

Food science scienceclub.northwestern.edu 33
Final Recipe ChallengeScore Sheet
Group Number: _________________________ Food:_____________________________
Nutrition Score:_______
Score Criteria
1 Did not improve nutrition
2 Made slight modifications to recipe
3 Significantly improved one nutritional component
4 Improved two nutritional components
5 Improved three or more nutritional components
Taste Score:_______
Score Criteria
1 Tastes awful, inedible
2 Not very flavorful
3 Some things I liked, other things I didn’t
4 Tastes good, few things I didn’t like
5 Delicious! I could eat it all day.
Overall preparation Score:________
Score Criteria
1 Inedible, no creativity
2 Edible but not cooked properly, no creativity
3 Edible but prepared with small mistakes, little creativity
4 Properly cooked, some originality
5 Perfectly cooked, very creative or original
Presentation Score:________
Score Criteria
1 Did not understand the recipe, nutrition, or the cooking technique at all, poor presentation
2 Exhibited some understanding of recipe, nutrition, and/or technique, okay presentation
3 Mostly understood the recipe, nutrition, and technique, good presentation
4 Understood the recipe, nutrition, and technique, used proper vocabulary, good presentation
5 Thorough understanding of the recipe, its nutrition, and the technique, excellent presentation
Final Score:___________