author's response to reviews impact of breast cancer stage, …1… · ·...
TRANSCRIPT
Author's response to reviews
Title:Impact of breast cancer stage, time from diagnosis and chemotherapy onplasma and cellular biomarkers of hypercoagulability
Authors:
Mourad Chaari ([email protected])Ines Ayadi ([email protected])Aurelie Rousseau ([email protected])Elmina Lefkou ([email protected])Patrick Vanderden ([email protected])Fatoumata Sidibe ([email protected])Hela Ketatni ([email protected])Vassiliki Galea ([email protected])Amir Khaterchi ([email protected])Racem Bouzguenda ([email protected])Mounir Frikha ([email protected])Lilia Ghorbal ([email protected])Jamel Daoud ([email protected])Choumous Kallel ([email protected])Martin Quinn ([email protected])Joseph Gligorov ([email protected])Jean Pierre Lotz ([email protected])Mohamed Hatmi ([email protected])Ismail Elalamy ([email protected])Grigoris Gerotziafas ([email protected])
Version:5Date:14 November 2014
Author's response to reviews: see over
1
Impact of breast cancer stage, time from diagnosis and chemotherapy on plasma and
cellular biomarkers of hypercoagulability
Mourad Chaari1,2, Ines Ayadi3, Aurelie Rousseau4, Elmina Lefkou1, Patrick Vandreden5,
Fatoumata Sidibe1, Hela Ketatni1, Vassiliki Galea1, Amir Khaterchi 1, Racem Bouzguenda3,
Mounir Frikha3, Lilia Ghorbal6, Jamel Daoud6, Choumous Kallel3 , Martin Quinn1, Joseph
Gligorov2,7, Jean Pierre Lotz7, Mohamed Hatmi8, Ismail Elalamy1,4, Grigoris T Gerotziafas1,4
1Service d’Hématologie Biologique Hôpital Tenon, Hôpitaux Universitaires Est
Parisien, Assistance Publique Hôpitaux de Paris, France.
2Laboratoire d'hématologie, Hôpital universitaire Habib Bourguiba, Sfax, Tunisia.
3Service de Carcinologie, Hôpital universitaire Habib Bourguiba, Sfax, Tunisia.
4INSERM U938, Faculté de Médecine Pierre et Marie Curie, Université Paris VI,
France.
5Research and Development, Diagnostica Stago, Gennevilliers, France.
6Service de radiothérapie carcinologique, Hôpital universitaire Habib Bourguiba,
Sfax
7Service d'Oncologie Médicale et de Thérapie Cellulaire, Hôpitaux Universitaires de
l'Est-Parisien, Institut Universitaire de Cancérologie, Université Pierre et Marie Curie
APREC
8Département Infection et Epidémiologie, Institut Pasteur, Paris, France
Correspondence to
Grigoris T Gerotziafas, MD, PhD, Service d'Hématologie Biologique, Hôpital Tenon,
4, rue de la Chine, INSERM U938 UPMC, Paris, Cedex 20, France.
tel: +33156016197; +33156018063 fax: +33156016044
e-mail : [email protected]
2
Abstract
Introduction. In breast cancer patients VTE risk increases during chemotherapy and in
advanced stage. Routine pharmacological thromboprophylaxis is not recommended but
individualized risk assessment is encouraged. The incorporation of hypercoagulability
biomarkers could increase the sensitivity of the risk assessment models (RAM) to identify
patients at VTE risk. To this aim we investigated the impact of cancer-related characteristics
on the biomarkers of hypercoagulability.
Methods. Thrombin generation (TG) assessed with the Thrombogramme-Thrombinoscope®,
the levels of platelet derived microparticles (Pd-MP) assessed with flow cytometry, the
procoagulant phospholid dependent clotting time (PPL-ct) measured with prothrombinase
activity based clotting assay from Diagnostica Stago and D-Dimers (measured with the mini-
Vidas assay from Biomerieux) were assessed in a cohort of 62 women with breast cancer and
in 30 age matched healthy women. These biomarkers were analyzed in relation to the stage,
the time elapsed since the diagnosis and the chemotherapy.
Results. Patients showed significantly higher TG, Pd-MP, D-Dimers levels and shortened PPL-
ct compared to the control group. The PPL-ct was inversely correlated with the levels of Pd-
MP, which were increased in 97% of patients. TG and D-Dimers were increased in 76% and
59% of patients respectively. In any stage of the breast cancer (local, regional and
metastatic) thrombogram parameters were significantly increased as compared to the
control group. There was no significant difference of thrombin generation in patients with
local, regional of metastatic stage. There was no significant difference in Pd-MP or Pd-
MP/PS+ between the subgroups of patients with local or regional stage of cancer. Patients
with metastatic disease had significantly higher levels of Pd-MP and Pd-MP/PS+ compared to
those with regional stage. The concentration of D-Dimers tended to increase in patients with
metastatic stage. In patients on chemotherapy with less than 6 months since diagnosis TG
was significantly higher as compared to those on chemotherapy who diagnosed in interval >
6 months (1627 ± 335 nM.min versus 1402 ± 327 nM.min, respectively; p<0.05). Patients
with metastatic disease had significantly higher levels of Pd-MP and D-Dimers compared to
those with non-metastatic disease. The presence of cardiovascular risk factors did not
influence TG and Pd-MP levels but was associated with increase of D-Dimers.
Conclusion. The present study showed that the stage of breast cancer, the time elapsed
since the diagnosis and the administration of chemotherapy are determinants of cellular and
3
plasma hypercoagulability. The levels and the procoagulant activity of Pd-MP are
interconnected with the biological activity and the overall burden of cancer. TG reflects the
procoagulant properties of both breast cancer and chemotherapy in the initial period of
cancer diagnosis. Thus the weighted incorporation of the biomarkers of cellular and plasma
hypercoagulabilty in RAM for VTE might improve their predictive value.
Key-words: Breast cancer, venous thromboembolism, thrombin generation, microparticles,
D-Dimers, risk assessment model
Introduction
The close association of cancer with hypercoagulability and the risk of thrombosis
have been recognized since the 19th century [1-3]. The risk of venous thromboembolism
(VTE) is about 7-fold higher in cancer patients compared to controls [4,5]. VTE significantly
affects morbidity and is the second cause of mortality in hospitalized cancer patients [6-9].
Many aspects of the interplay between cancer and blood coagulation have been elucidated
by experimental, clinical and epidemiological studies [10,11]. The histological type, the
burden of cancer cells, the stage of the disease, the use of chemotherapy and the time since
diagnosis are determinants of the VTE risk [12].
Breast cancer is the commonest malignancy in women and is considered to be
associated with low VTE risk as compared to other malignancies. In women with newly
diagnosed breast cancer the cumulative incidence of VTE is less than 1% [10, 12]. However
VTE risk increases by 4- to 6-fold during chemotherapy as well as in advanced stage or
metastatic disease [14]. Routine administration of thromboprophylaxis is not recommended
in women with breast cancer undergoing adjuvant chemotherapy since there are no relevant
clinical trials assessing the efficacy and safety of antithrombotic agents in this context [13].
However, expert consensus statements encourage an individualized approach for the
identification of patients at risk of VTE who are eligible for pharmacological
thromboprophylaxis [15]. To this aim, Korhana et al have developed and prospectively
validated a risk assessment model that stratifies cancer patients to high, moderate or low
risk for VTE prior to chemotherapy initiation [16].
Thrombosis is a multifactorial disease occurring when the Virchow’s triade (blood
hypercoagulability, vessel wall lesion and alteration of blood flow) is fulfilled. However,

4
current risk assessment models for VTE in cancer patients are restricted to some clinical risk
factors and are missing the evaluation of blood borne hypercoagulability, although this is
one of the basic components of Virchow’s triad. The expression of tissue factor (TF) by
cancer cells as well as the formation of procoagulant microparticles derived from activated
platelets, are pivotal events leading to enhanced thrombin generation in patients with
cancer [reviewed in 17-20]. TF-induced activation of blood coagulation in cancer patients
leads to sustained thrombin generation and fibrin formation [21]. The D-Dimers are
degradation products of cross-linked fibrin, indicating either enhanced fibrin formation or
activation of the fibrinolytic system, or increased levels of fibrinogen and likely reflect the
biological activity of cancer cells [22]. Increased concentration of D-Dimers in plasma has
been observed in patients with breast, prostate or bowel cancer [23].
It has been reported that incorporation of biomarkers of cellular or plasma
hypercoagulability increases the sensitivity of the risk assessment models to identify cancer
patients at risk for VTE [24]. The aim of the present study was to investigate the potential
relation between cancer-related characteristics and the biomarkers of plasma and cellular
hypercoagulability. The capacity of thrombin generation in patients’ plasma, the
concentration of procoagulant platelet-derived microparticles expressing phosphatidylserin
(Pd-MP/PS+) in plasma, the procoagulant phospholid (PPL) dependent clotting time and D-
Dimers were assessed in a cohort of women suffering from breast cancer. These biomarkers
of plasma and cellular hypercoagulability were analyzed in relation to the stage of the
disease, the time elapsed since diagnosis and the administration of chemotherapy.
Methods
Cancer patients
Out-patients with histologically proven breast cancer were enrolled in the study from
January to June 2012. Patients were considered under chemotherapy if they had received a
chemotherapy cycle 21 days earlier. The exclusion criteria were: age less than 18 years,
recent (<6 months) documented episode of VTE (deep venous thrombosis and/or pulmonary
embolism) or acute coronary syndrome, confirmed pregnancy, major psychiatric disorders,
life expectancy less than 3 months, active anticoagulant treatment, recent (<3 months)
hospitalization for acute medical illness or major surgery, recent surgery (<2 months).

5
Classification of the patients. Patients were classified for post hoc analysis according to the
tumor, node, metastases (TNM) system of stratification: Local stage was defined by the
absence of axillary nodes and distant metastasis (TxN0M0). Regional stage was defined by
the presence of axillary node(s) and the absence of distant metastasis (TxN+M0). The
metastasis stage was defined by the presence of one or more distant metastases (TxNxM+)
[25]. Patients were also stratified according to the presence or not of at least one
cardiovascular risk factor. Stratification according to hormone positive or negative receptor
breast carcinoma was not possible since data were not available for all patients.
Control group
The control group consisted of 30 age-matched healthy women who did not have breast
cancer and who were not taking any medication for at least one month before blood
sampling. Healthy volunteers had normal prothrombin time (PT) and activated partial
thromboplastin time (aPTT) and had no personal history of thrombotic or hemorrhagic
episodes. The values obtained in this population, comparable in age to the breast cancer
patients, were used to establish reference intervals for the assays. All patients and healthy
individuals gave written informed consent for participation in the study.
Blood samples
Blood samples were obtained by traumatic puncture of the antecubital vein, using a 20-
gauge needle, and placed into siliconized vacutainer tubes containing 0.129 mol/L trisodium
citrate (from Becton and Dickinson France) as anticoagulant, in a ratio of nine parts of blood
to one part of citrate. Platelet poor plasma (PPP) was obtained after double centrifugation of
citrated whole blood for 20 minutes at 2000g. Platelet-free plasma was prepared
immediately after blood sampling using a 2-step centrifugation procedure: initially at 1500g
for 15 minutes at 20°C to prepare platelet rich plasma and then at 13000g for 2 minutes at
20°C to prepare PFP. Samples were aliquoted and frozen at -80°C until assayed. All
measurements were done in thawed plasma samples. All PPP samples were from vein
punctures performed for routine evaluation of blood coagulation tests. Blood anticoagulated
with EDTA was used for the determination of complete blood count. This study was

6
approved by the ethics committee of Tenon University Hospital and was performed in
accordance with the principles embodied in the Declaration of Helsinki.
Thrombin generation in plasma
Thrombin generation in PPP was assessed using the Calibrated Automated Thrombogram
assay (CAT®, Diagnostica Stago, France) as described by Hemker et al [26]. Briefly 80 µl of PPP
was added to 20 µl of PPP-reagent 5 pM® (Thrombinoscope b.v., Maastricht, Netherlands),
that is a mixture of TF (5 pM final concentration in plasma) and phospholipids (4 µM final
concentration in plasma). Each patient’s plasma was studied in duplicate. In a third well, PPP
reagent 5 pM® was replaced with the same volume of Thrombin Calibrator®
(Thrombinoscope bv, Maastricht, Netherlands) to correct thrombin generation curves for
substrate consumption and the inner filter fluorescence effects. Thrombin generation was
triggered with a 20 µl solution containing CaCl2 (16.7 mM final concentration) and the
fluorogenic substrate Z-Gly-Gly-Arg-AMC (417 pM final concentration). Fluorescence was
measured using a Fluoroscan Ascent®fluorometer (ThermoLabsystems, Helsinki, Finland).
Acquisition of thrombin generation parameters was performed using the appropriate
software (Calibrated Automated Thrombogram®bv, Maastricht, Netherlands). Among
thrombogram parameters we analyzed the endogenous thrombin potential (ETP) that
reflects the integral thrombin activity, the Peak concentration of thrombin and the mean
rate index (MRI), which reflects the rate of the propagation phase of thrombin generation
[calculated by the formula MRI=Peak/(ttPeak – lag-time)].
Microparticle labelling and flow cytometry analysis
Platelet-derived microparticles were measured in platelet free plasma using a flow
cytometry assay as described by Robert et al [27]. Briefly, for Pd-MP/PS+ labelling, 30 µL of
fresh PFP was incubated with 10 µL of a solution of phycoerythrin (PE) bound monoclonal
antibody against platelet glycoprotein IIb (CD41). For the detection of phosphatidylserine
expression by Pd-MP the plasma samples were additionally spiked with 10 µL of fluoresce in
isothiocyanate (FITC) labelled recombinant human annexin V. Anti-CD41 monoclonal
antibody was purchased from BioCytex (Marseille, France). Human annexin V-FITC kit was
obtained from AbCys (Paris, France). Concentration-matched isotype antibodies (IgG1–PE, 15
ng/µL, clone 2DNP-2H11, from BioCytex) or Annexin V-FITC with phosphate-buffered saline

7
without calcium were used as controls. Analyses were performed on Cytomics FC500 flow
cytometer (Beckman-Coulter, Villepinte, France). To limit background noise from dust and
crystals, the instrument was operated using a 0.22 µm filtered sheath fluid (IsoflowTM;
Beckman-Coulter, France). The software packages CXP ACQUISITION® and CXP ANALYSIS®
(Beckman-Coulter, France) were used for data acquisition and analysis, respectively.
Standardization of the Pd-MP protocol was done using a blend of mono-disperse fluorescent
beads (Megamix, BioCytex Marseille, France) of three diameters (0.5, 0.9 and 3 µm).
Forward scatter and side scatter parameters were plotted on logarithmic scales to best cover
a wide size range. Pd-MP were defined as single positive CD41+ events. CD41 positivity was
displayed on single parameter histograms. Pd-MP/PS+ were defined as dual-positive
phosphatidylserine PS+/CD41 events as displayed on dual-color fluorescence plots after
staining with annexin V-FITC and CD41-PE. In each studied sample 30 μl of counting beads
with an established concentration close to 1000 beads/μl (Flow CountTMFluorosphores
Beckman-Coulter) were added in order to express counts as absolute numbers of
microparticles per microliter of PFP. All plasma samples were assessed for Pd-MP within one
week after blood collection and after one cycle of freezing /thawing. Application of the same
experimental conditions reduced the impact of the eventual error introduced by the
freezing/thawing on Pd-MP concentration.
Assessment of procoagulant phospholipid dependent activity in plasma
Procoagulant phospholipid-dependent clotting time (PPL) was measured in thawed PPP
using the factor Xa - based coagulation assay (PPL clotting time) STA®Procoag-PPL,
(DiagnosticaStago, Asnières, France) in which shortened clotting times are associated with
increased levels of procoagulant phospholipids. The PPL clotting time was performed
according to the manufacturer's instructions on a STA®-R analyser.
D-Dimers
The concentration of D-Dimers in platelet poor plasma was determined using the enzyme
linked fluorescent assay on a mini VIDAS system (bio-Merieux, Paris, France). The assay
employs a quantitative sandwich enzyme immunoassay technique combining a bound anti-
D-Dimer monoclonal immunoglobulin with an unbound enzyme labeled anti-D-dimer
monoclonal immunoglobulin. Results are reported in ng/mL of fibrinogen equivalent units.

8
According to manufacturer’s instructions, D-Dimers concentrations equal or lower than 500
ng/ml were considered as normal.
Routine biochemical and hematological assessment
Blood samples were also obtained for the assessment of transaminase levels (ASAT and
ALAT), CRP, urea and creatinine. Routine hemogram parameters as well as prothrombin time
(expressed as percentage of prothrombin) and activated partial thromboplastin time
(expressed as ratio of patients/control values), were also analyzed. Routine hematological
and biochemical measurements were performed with standardized assays existing in the
central hematological and biochemical hospital laboratory.
Statistical analysis
The potential changes of the studied biomarkers in the group of breast cancer patients
versus the control group as well as in the subgroups of patients stratified according to the
stage of the cancer, the chemotherapy and the time since the diagnosis were unknown.
Consequently, determination of the sample size according to a power analysis based on the
predicted differences of the studied biomarkers in function of cancer related variables was
not feasible. For this reason, the sample size for each one of the main groups (patients and
controls) and consequently for the subgroups of patients, was based on the minimum
number of individuals required in order to apply the statistical tests which were used.
Continuous variables are expressed by means ± standard deviation. In the groups of patients
and controls comparisons between continuous variables were performed using Student’s t-
test when they were normally distributed and Mann-Whitney test when they were
abnormally distributed and when variables had a coefficient of variation higher than 100%.
One way ANOVA test was used to determine the possible differences among subgroups of
patients (defined according the stage of cancer the presence of chemotherapy and the time
since diagnosis and controls). Homogeneity of the values was tested with Levene test for
equality of errors in variances and normality of residues was verified by the Shapiro-Wilk
test. The Kruskal-Wallis test was used when no homogeneity was documented. For
significant variables post hoc LSD test was applied to compare differences between groups.
Multiple comparisons and Spearman coefficient correlations were calculated. When
appropriate, the upper and lower normal limits (UNL and LNL respectively) for the studied
9
biomarkers of hypercoagulability were defined respectively as upper and lower limit of the
95% confidence interval (CI) of normal values obtained by performing the corresponding
tests in the control group (healthy volunteers). Thrombin generation was considered as
increased when at least one of the studied parameters (ETP, Peak or MRI) showed a value
higher than the UNL. Two-sided p-value <0.05 was considered significant. Statistical analysis
was performed using SPSS 20.0 (SPSS Inc., Chicago, IL).

10
Results
Patients characteristics
A total of 62 women with breast cancer were included in the study. The mean age of
the breast cancer group and the control group was not significantly different (52 ± 11 years
and 55 ± 10 years respectively; p>0.05). Basic hematological parameters in the breast cancer
group were within the normal range and not significantly different compared to the control
group. The body mass index was also not significantly different between the two groups. The
CRP levels were above the normal in 8 our 62 patients (12%).
Patients were stratified in subgroups according to the stage of the disease as follows:
13 had a local stage, 29 had a regional stage and 20 had metastatic disease. In the subgroup
with metastatic stage disease, 95% had bone metastasis and 40% also had liver or lung
metastases. Age, BMI and basic hematological parameters were not significantly different
among these subgroups, as well as between each subgroup and the control group. Patients
were also stratified to those who were on active chemotherapy (n= 41)
Patients were also stratified according to the time elapsed since the diagnosis of
cancer: <6 months (n=27) and more than 6 months (n= 35; of home 10 patients were
diagnosed 6-12 months, 13 patients were diagnosed 12-36 months and 12 patients were
diagnosed more than 36 months before the inclusion in the study). Invasive ductal
carcinoma of the breast was diagnosed in 90% of patients. Curative surgery was performed
in 82% of the patients included in the study. All surgical procedures were completed at least
2 months before enrolment. In 42 out of 62 patients (67%) at least one cardiovascular risk
factor was present. Demographic and clinical characteristics of the studied groups are
summarized in Table 1.
Thrombin generation in breast cancer patients
Thrombin generation was significantly increased in breast cancer patients as
compared to the control group (Table 2). The MRI was significantly higher in the group of
patients as compared to the control group (159 ± 47 nM/min versus 109 ± 33 nM/min
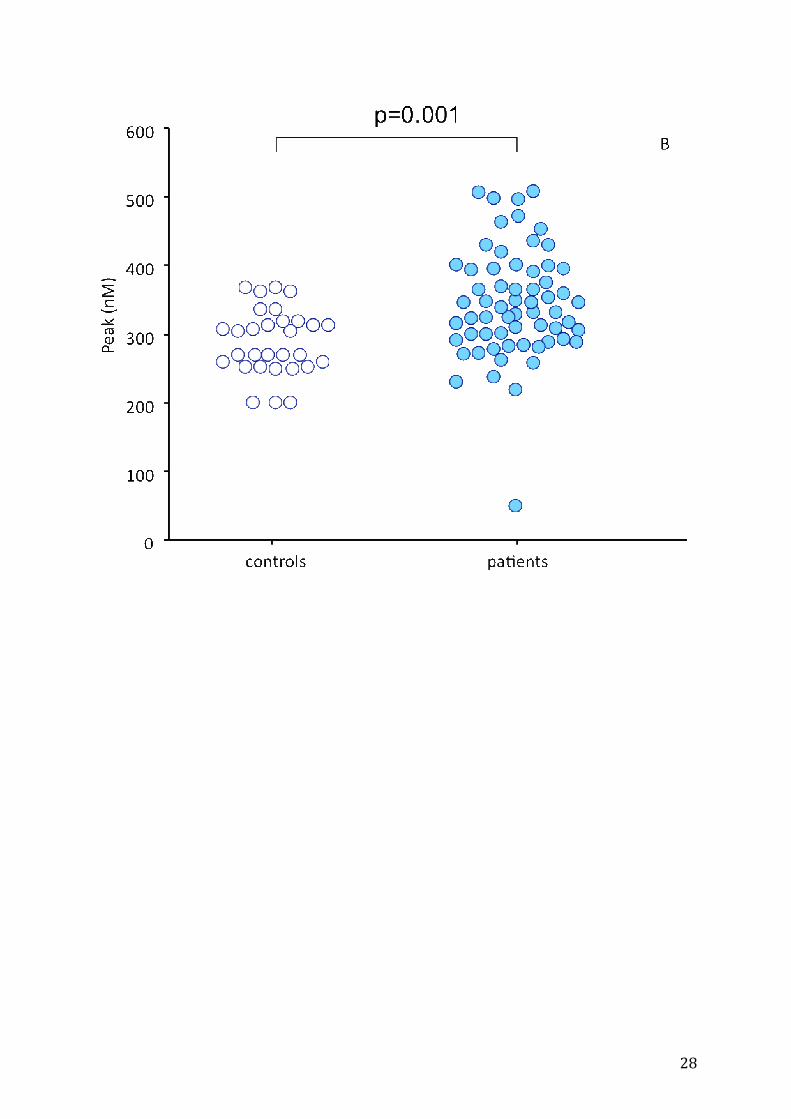
respectively; p<0.001). The Peak was also higher in cancer patients as compared to the
control group (341 ± 65 nM versus 288 ± 48 nM, respectively; p=0.001). The ETP was not

11
significantly different between the cancer group and the control group (1531 ± 337 nM.min
versus 1498 ±225 nM.min).
The distribution of the individual values of thrombogram parameters in cancer
patients and controls is shown in Figure 1. Representative thrombograms of patients with
increased and normal thrombin generation profile are depicted in Figure 2. The MRI was
higher than the UNL in 47 patients (76%). The Peak was higher than the UNL in 42 patients
(68%). The ETP was higher than the UNL in 25 patients (40%). Among patients with high
thrombin generation 21 (33%) had the three parameters of thrombogram (MRI, Peak and
ETP) higher than the UNL. In 21 patients (33%) the MRI and the Peak was higher than the
UNL.
Influence of stage, time and chemotherapy on thrombin generation
In any stage of the breast cancer (local, regional and metastatic) thrombogram
parameters were significantly increased as compared to the control group (Table 2).
Thrombin generation was significantly higher in patients with newly diagnosed breast cancer
(< 6 months) as compared to those in whom the time elapsed since the diagnosis was more
than 6 months. Similarly thrombin generation in the subgroup of newly diagnosed patients
(< 6 months) on chemotherapy was significantly higher as compared to those on active
chemotherapy in whom the time elapsed since the diagnosis of breast cancer was more than
6 months. (Table 3, Figure 3).
No significant differences of thrombogram parameters were observed between
subgroups of patients with local or regional stage of the disease. The subgroup of patients
with metastatic stage was not analysed because it included only 4 newly diagnosed patients
(less than 6 months) and 10 patients on active chemotherapy. Thus the impact of the
metastatic stage on thrombin generation was confounded.
Procoagulant platelet-derived microparticles in breast cancer patients
In the control group the concentration of Pd-MP and Pd-MP/PS+ was 756 ± 429/μl
and 695 ± 361/μL respectively. In the breast cancer group Pd-MP and Pd-MP/PS+ were
significantly increased (p<0.001) compared to the control group (Table 2). The concentration
of Pd-MP and Pd-MP/PS+ was higher than the UNL in 97% and 93% of patients respectively.

12
Accordingly, the PPL clotting time was significantly shorter in patients as compared to the
control group (43.5 ± 10 sec versus 72.8 ± 9.9; p=0.03). The PPL clotting time was
significantly correlated with both Pd-MP and Pd-MP/PS+ (r2=0.7; p<0.0001). In 51 patients
(82%) the PPL clotting time was shorter than the LNL of the assay.
Influence of stage, time and chemotherapy on platelet-derived microparticles
There was no significant difference in Pd-MP or Pd-MP/PS+ between the subgroups of
patients with local or regional stage of cancer. Patients with metastatic disease had
significantly higher levels of Pd-MP and Pd-MP/PS+ compared to those with regional stage
(Table 2).
The concentration of Pd-MP and Pd-MP/PS+ was not influenced by the time since the
diagnosis of the breast cancer (Table 3). The stratification of each subgroup according to the
administration of chemotherapy did not show any significant difference between the
subgroups (Table 3). The PPL clotting time, similarly to Pd-MP, was not influenced by
chemotherapy and time since diagnosis but it was significantly shorter in patients with
metastatic disease as compared to those with local stage (Table 2).
D-Dimer levels in breast cancer patients
The concentration of D-Dimers was significantly increased in cancer patients (1250 ± 1773
ng/ml) compared to the control group (230 ± 50 ng/ml; p<0.05). The concentration of D-
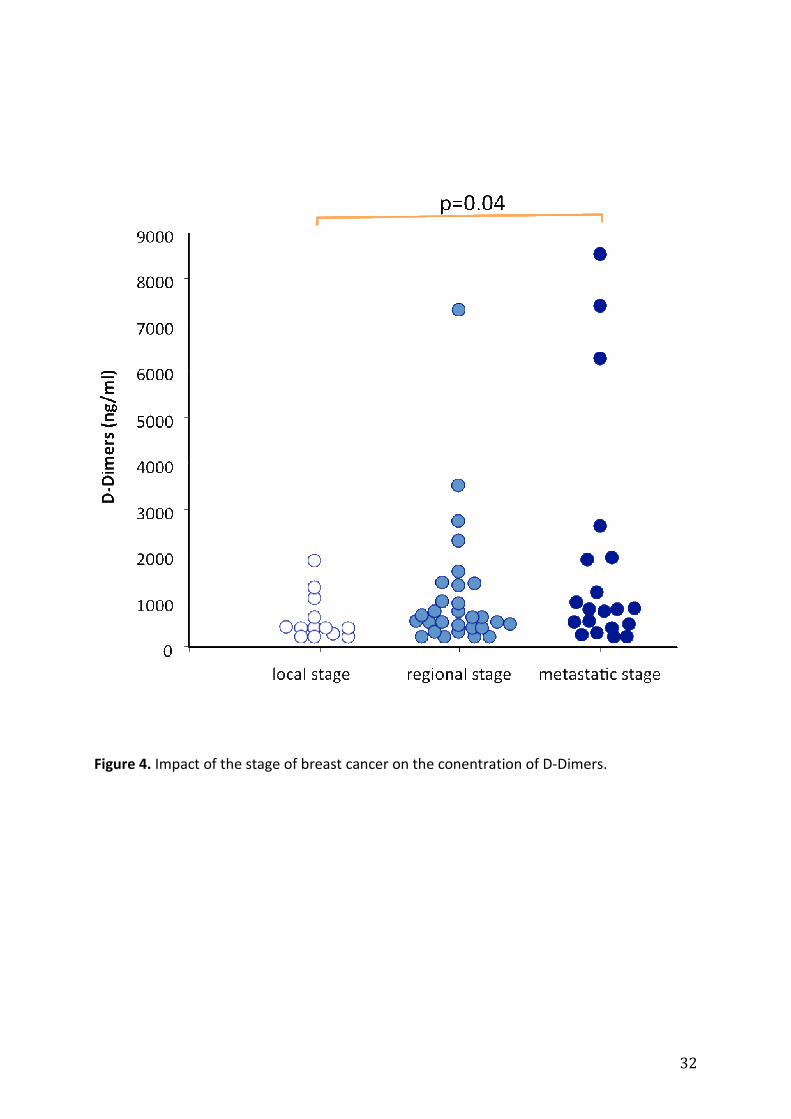
Dimers tended to increase in advanced stages of the disease (Table 2). However no
significant difference was observed between the subgroups of patients with local and
regional stage (605 ± 499 ng/ml versus 1123 ± 1429 ng/ml; p>0.05). The concentration of D-
Dimers in patients with metastatic stage (1853 ± 2497 ng/ml) was significantly higher as
compared to that in patients with local stage (p=0.049). The concentration of D-Dimers in
patients with regional stage was not significantly different as compared to patients with
metastatic stage (Figure 4). The analysis of the data from the subgroup of the patients on
chemotherapy showed a similar trend of elevation of D-Dimers in parallel with the stage of
the cancer.
In patients with localized disease receiving chemotherapy, the concentration of D-Dimers
was significantly lower (410 ng/mL, range 220-1230 ng/mL) compared to patients on
chemotherapy for metastatic disease (1920 ng/mL , range, 242-6547 ng/mL, p=0.033). The
13
time since diagnosis of cancer did not show any significant influence on D-Dimer levels in the
subgroup of patients having chemotherapy.
In 32 patients (52%) the concentration of D-Dimers in plasma was higher than the age
adapted upper normal cut-off level. In 29 patients (46%) the concentration of D-Dimers and
at least one parameter of thrombogram were higher than the UNL of the corresponding test.
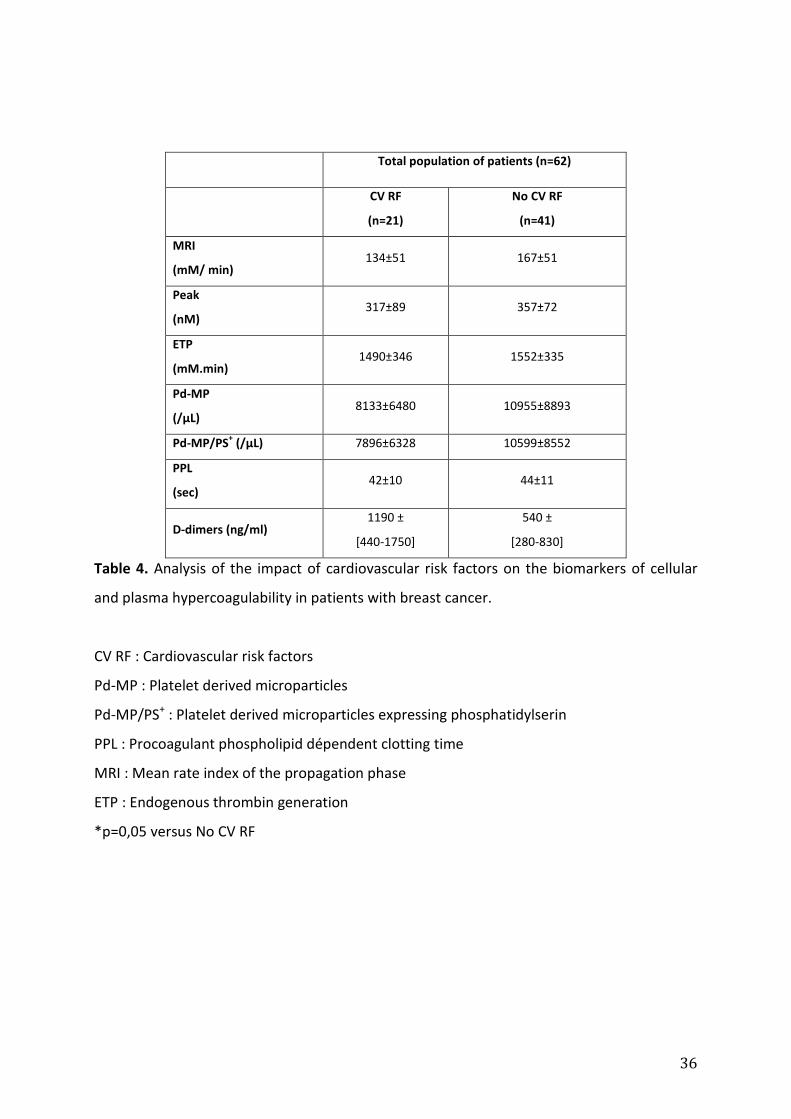
Cardiovascular risk factors and markers of cellular and plasma hypercoagulability in breast
cancer patients
Thrombin generation, PPL clotting time and the concentration of Pd-MP, PdMP/PS+
were not significantly different between the subgroup of patients with at least one risk
factor of cardiovascular disease compared to those who did not have any cardiovascular risk
factor. In contrast, the concentration of D-Dimers was significantly higher in patients with
breast cancer who had at least one cardiovascular risk factor as compared to those who did
not have any cardiovascular risk factor (Table 4).
Correlation of cellular and plasma markers of hypercoagulability with routine
hematological and biochemical parameters.
Age and BMI of patients did not correlate with any of the studied biomarkers of
hypercoagulability. Among thrombogram parameters the Peak and the ETP were
significantly correlated with the CRP (r=0.3; p=0.028 and 0.019 respectively). The peak was
also correlated with the ASAT levels (r=0.3; 0= 0.03).
The concentration of D-Dimers was inversely correlated with Hb (r=0.52; p<0.0005) and
positively correlated with the concentration of transaminases. In addition, alkaline
phosphatase was correlated with the concentration of D-Dimers (r=0.38; p<0.005). The
levels of D-Dimers did not correlate with creatinine, urea and CRP.
The concentration of Pd-MP and Pd-MP/PS+ was inversely correlated with Hb (r=-0.3;
p=0.01) and positively correlated with the platelet count (r=0.3; p=0.02).
All the other hematological and biochemical parameters did not correlate with thrombin
generation parameters and Pd-MP or PPL clotting time. None of thrombin generation
parameters was correlated with the concentration of D-Dimers or Pd-MP or with aPTT or PT.

14
Discussion
The present study demonstrates that blood hypercoagulability in breast cancer
patients is consisted of cellular and plasma components and is characterized by marked
increase of procoagulant Pd-MP, enhanced thrombin generation and increased degradation
of fibrin. The stage of the disease, the administration of chemotherapy and the time elapsed
since the diagnosis, have a significant but variable impact on the cellular and plasma
components of hypercoagulability.
Almost all breast cancer patients showed high levels of procoagulant Pd-MP and
short PPL clotting time in plasma. Thus, in patients with breast cancer, platelet activation
leading to the release of microparticles expressing phosphatidylserine is a principal
characteristic of blood borne hypercoagulability. This finding is in accordance with previous
studies which showed that breast cancer patients treated with chemotherapy or receiving
adjuvant endocrine therapy have increased numbers of Pd-MP and a high microparticle-
dependent thrombin generation [28]. Our study shows that the increase of Pd-MP is related
to the underlying cancer rather than to the anticancer treatment. Indeed, the stage of the
disease has a significant influence on the concentration of the procoagulant Pd-MP and the
PPL clotting time. Patients with metastatic disease had significantly higher concentrations of
Pd-MP and shorter PPL clotting time compared to those with localized stage. Interestingly,
chemotherapy did not induce any significant change on the concentration of Pd-MP or the
PPL clotting time. These findings are in accordance with previous studies [29-32] and support
the hypothesis that Pd-MP concentration and the PPL clotting time are biomarkers that
reflect the close association between the burden of cancer cells and platelets. Whether the
release of procoagulant microparticles by platelets stems from the direct interaction of
platelets with breast cancer cells or is the consequence of an inflammatory reaction
triggered by cancer merits further investigation. In favor of the former hypothesis is that
most of the patients in our study showed CRP levels within the normal range. In addition, no
correlation was found between Pd-MP or PPL-clotting time and CRP. The concept that
platelet activation is a dominant phenomenon in cancer is supported by several recent
studies conducted in patients with other types of cancer and may have therapeutic
implications in the management of cellular derived hypercoagulability and cancer [33-36].
Platelet-derived microparticles manifested significant procoagulant activity as
documented by the almost linear, inverse correlation between the concentration of both Pd-

15
MP and Pd-MP/PS+ with the PPL clotting time. However, neither Pd-MP nor PPL-clotting time
was correlated with thrombin generation. In our study, thrombogram-thrombinoscope assay
was performed in platelet poor plasma using 5 pm of TF and a saturating concentration of
procoagulant phospholipids (4μM). Preliminary experiments from our group showed that in
these experimental conditions, the thrombogram assay is not sensitive to the procoagulant
activity of microparticles present in the plasma samples (data not shown). Consequently, the
two settings of tests describe different components of hypercoagulability; the cellular and
the plasma one.
Thrombin generation was significantly increased in patients with breast cancer as
compared to the control group. About 76% of patients had the mean rate index (MRI) of the
propagation phase of thrombin generation higher than the upper normal limit showing that
the increase of thrombin generation is also a major element of the hypercoagulability in
breast cancer. The present study documents that a significant cellular and plasma
hypercoagulability occurs within the first six months from the diagnosis of breast cancer.
Indeed, the increase of thrombin generation was marked in patients diagnosed with cancer
within less than 6 months from the inclusion as compared to those to whom the time
elapsed since the diagnosis of cancer was longer than 6 months. In addition, thrombin
generation was significantly increased in patients with recently diagnosed cancer who were
on active chemotherapy as compared to those who were on chemotherapy while the cancer
was diagnosed in an interval longer than 6 months from the inclusion. These data lead to the
conclusion that during the six months after the diagnosis, the breast cancer cells and
chemotherapy are combined stimuli of cellular and plasma hypercoagulability. The Vienna
Cancer and Thrombosis Study (CATS), which prospectively evaluated the capacity of
biomarkers of hypercoagulability to detect the risk of VTE in cancer patients, showed that
high thrombin generation is an independent risk factor for VTE [44]. The data presented
herein underline the presence of significant increase of thrombin generation and enhanced
platelet activation during the first six months after the diagnosis of breast cancer. This period
is characterized in breast cancer patients by a substantially increased risk of VTE [12, 37-43].
The subgroup analysis failed to demonstrate an increase of thrombin generation in patients
with metastatic disease versus to those without metastasis; although this was the case for
the Pd-MP. This is probably due to the heterogeneity of the subgroup of patients with
metastasis. This subgroup was composed by a small number of patients recently diagnosed

16
with cancer and also by a small number of patients on active chemotherapy. As mentioned
above, the time since the diagnosis inferior than six months and the administration of
chemotherapy are major determinants for the increase of thrombin generation.
Consequently the composition of the subgroup of patients with metastatic disease was a
confounder for the evaluation of the impact of the stage on thrombin generation. The
presence of cardiovascular risk factors was not associated with any significant impact on
either thrombin generation or the concentration of Pd-MP and the PPL clotting time. This
finding further supports the concept that the increase of Pd-MP concentration and the
enhancement of thrombin generation are related to the characteristics of the cancer (i.e.
time since diagnosis, stage and active chemotherapy). The poor correlation between Pd-MP
and the studied biochemical parameters of inflammation, renal and liver function further
enhances the assumption that platelet related hypercoagulability is closely associate with
cancer. Thrombin generation showed also a weak correlation with CRP and liver function. In
the majority of the patients these markers were within the normal range. Thus plasma
hypercoagulability in the studied cohort of breast cancer patients also stems from the
interactions of cancer cells with plasma and the impact of chemotherapy rather thanfrom an
inflammatory state.
Breast cancer patients also showed enhanced fibrin degradation documented by the
significant increase of D-Dimers concentration in patients’ plasma as compared to healthy
age-matched individuals. In 59% of patients D-Dimers concentration was higher than the
upper normal limit. The D-Dimers concentration in patients with metastatic disease was
higher as compared to that in patients with localized cancer. The concentration of D-Dimers
did not correlate with the Pd-MP concentration, the PPL clotting time or the enhancement of
thrombin generation. In 46% of patients a combined increase of D-Dimers and thrombin
generation was observed documenting a dissociation between these biomarkers which
apparently measure different aspects of the interactions between breast cancer cells, blood
coagulation, platelets and fibrinolysis. The elevation of D-Dimers, particularly in the
advanced stage of the disease, is in accordance with previous studies which demonstrated
that the augmentation of D-Dimers might be in part a reflection of ongoing fibrinogen
metabolism within the actively remodeled tumor stroma [45]. The increase of D-Dimers is
related to the clinically measured growth rate of breast cancer, the tumor volume, the
progression rate and the survival in patients with metastatic breast cancer [45,46]. Tumor

17
cells possess strong procoagulant activities that induce local activation of the coagulation
system and deposition of fibrin, which has an important role in the formation of tumor
stroma and hematogenous spread of tumor cells [47]. The Vienna Cancer and Thrombosis
Study (CATS) showed that enhanced activation of coagulation and fibrinolysis, as reflected by
high levels of D-dimers, is independently associated with an unfavorable prognosis in
patients with solid cancers and is not necessarily mediated by the increased risk of VTE [48].
Our data, being in accordance with these evidence allow to conclude that in breast cancer
patients the D-Dimers is a biomarker which is related with a global biological activity of
cancer cells which is not restricted to plasma hypercoagulability. Noteworthy in our study,
the presence of cardiovascular risk factors was linked with a significant increase of the
concentration of D-Dimers revealing that the D-Dimers is a less specific biomarker for cancer
induced hypercoagulability.
The identification of breast cancer patients at risk of VTE and the optimization of
thromboprophylaxis is a puzzling exercise because VTE risk varies according to the type of
cancer and is potentially influenced by its evolution, the histology and the localization of the
cancer, the duration and the intensity of chemotherapy or other adjuvant treatments. The
development of Risk Assessment Models (RAM) for VTE risk stratification adapted for cancer
patients and their prospective clinical validation is required. Such a RAM - focused on cancer
patients receiving chemotherapy - has been proposed and prospectively validated by
Khorana [16]. This model includes some clinical risk factors such as the site of cancer, the
body mass index, the increased pre-chemotherapy platelet and leukocyte counts. However,
other variables related to the malignant disease which contribute to the VTE risk (i.e. the
stage, the type of anticancer therapy etc) are lacking. In addition, the Khorana RAM does not
include breast cancer. The data from our study show that patients with breast cancer show
cellular and plasma blood borne hypercoagulability which is influenced by the stage of the
disease, the time elapsed from the diagnosis and the administration of chemotherapy. The
weighted incorporation of the studied biomarkers of cellular and plasma hypercoagulability
in association with the clinical characteristics of breast cancer and the other intrinsic risk
factors for VTE present in patients could formulate a new specific RAM for breast cancer
patients. To this aim a prospective studied is needed.
Conclusions

18
The present study identified the most appropriate biomarkers for the diagnosis of
blood borne hypercoagulability related to breast cancer. The concentration and the
procoagulant activity of Pd-MP are interconnected with the biological activity and the overall
burden of cancer cells. Assessment of thrombin generation is related with both the
procoagulant characteristics of breast cancer andthe procoagulant effect of anticancer
treatment administration within 6 months after the diagnosis of the disease. Thus the
weighted incorporation of the biomarkers of cellular and plasma hypercoagulabilty in risk
assessment models for VTE might lead to the elaboration of a breast cancer specific RAM
with improved predictive value.
19
List of abbreviations
aPTT : activated partial thromboplastin time
ETP : endogenous thrombin potential
LNL : lower normal limit
MRI : mean rate index
Pd-MP: platelet derived microparticles
Pd-MP/PS+ : platelet derived microparticles expressing phosphatidylserin
PPL : procoagulant phospholid dependent clotting time
PPP: platelet poor plasma
PT : prothrombin time
RAM : Risk Assessment Model
TF : tissue factor
TNM : tumor, node, metastases
UNL : upper normal limit
VTE : venous thromboembolism
Conflict of Interest
The authors do not have any conflict of interest for this study

20
Authors' contributions
MC has made substantial contributions to study design and organization, acquisition,
analysis and interpretation of data, has been involved in drafting the manuscript
IA had substantial contribution to the recruitment of patients
AR carried out the assessment of thrombin generation and procoagulant phospholipid
clotting time and had substantial contribution in the acquisition and the analysis of the
respective data
PV has made substantial contributions to interpretation of data, has been involved in
drafting the manuscript
EL has made substantial contribution in drafting the manuscript and revising it critically for
important intellectual content
FS had substantial contribution to the recruitment of patients
HK carried out the assessment of D-Dimers and had substantial contribution in the
acquisition and the analysis of the respective data
VG participated in the statistical analysis and had substantial contribution in the
interpretation of the data
AK carried out the flow cytometry assay and had substantial contribution in the acquisition
and the analysis of the respective data
RB had substantial contribution to the recruitment of patients
MF had substantial contribution to the recruitment of patients
LG had substantial contribution to the recruitment of patients
JD had substantial contribution to the recruitment of patients
CK had substantial contribution to the recruitment of patients
MQ performed the statistical analysis and has been involved in the data base construction
JG has made substantial contributions to conception, design, interpretation of data
JPL has made substantial contributions to conception, design, interpretation of data
MH has made substantial contribution to interpretation of data
IE has made substantial contribution to design and interpretation of data
GG has made substantial contributions to conception and design of the study, analysis and
interpretation of data, has been involved in drafting the manuscript has given final approval
of the version to be published, agreed to be accountable for all aspects of the work in
ensuring that questions related to the accuracy or integrity of any part of the work are
appropriately investigated and resolved
Acknowledgement. The authors acknowledge Professor Gordon Wishard for the
critical reading of the manuscript. The authors are also grateful to Marie-Paule Roman
and Severin Bouffard for the excellent technical assistance.
21
References
1. Trousseau A. Phlegmasia alba dolens. In Trousseau A, editor Clinique medicale de
l’Hotel Dieu de Paris. Paris : Ballier 1865 :654-712.
2. Boulliaud M. De l’oblitération des veins et de son influence sur la formation des
hydropisies partielles. Arch Gen Med 1823 ;1 :188-204.
3. Illtyd J, Matheson N. thrombophlebitis in cancer. The Practitioner 1935.
4. Heit JA, Mohr DN, Silverstein MD, et al. Predictors of recurrence after deep vein
thrombosis and pulmonary embolism: a population-based cohort study. Arch Intern
Med. 2000;160: 761-768.
5. Blom JW, Doggen CJ, Osanto S, Rosendaal FR. Malignancies, prothrombotic
mutations, and the risk of venous thrombosis. JAMA. 2005;293:715-22.
6. Cronin-Fenton DP, Søndergaard F, Pedersen LA, Fryzek JP, Cetin K, Acquavella J,
Baron JA, Sørensen HT. Hospitalisation for venous thromboembolism in cancer
patients and the general population: a population-based cohort study in Denmark,
1997-2006. Br J Cancer,2010 Sep 28;103:947-53.
7. Buller HR, van Doormaal FF, van Sluis GL, Kamphuisen PW. Cancer and thrombosis:
from molecular mechanisms to clinical presentations. J Thromb Haemost 2007;5:246-
54.
8. Zwicker JI, Furie BC, Furie B. Cancer-associated thrombosis. Crit Rev Oncol Hematol
2007; 62 : 126-36.
9. Ten Cate H, Falanga A. Overview of the postulated mechanisms linking cancer and
thrombosis.Pathophysiol Haemost Thromb. 2008;36:122-30.
10. Wun T, White RH. Venous thromboembolism (VTE) in patients with cancer:
epidemiology and risk factors. Cancer Invest. 2009;27 Suppl 1:63-74.
11. Zwicker JI, Furie BC, Furie B. Cancer-associated thrombosis. Crit Rev Oncol Hematol
2007; 62 : 126-36.
22
12. Chew HK, Wun T, Harve DJ, Zhou H et al. Incidence of Venous Thromboembolism and
the Impact on Survival in Breast Cancer Patients. J Clin Oncol 2007;25:70-76.
13. Tran BH, Nguyen TJ, Hwang BH, Vidar EN, Davis GB, Chan LS, Woo K, Wong AK. Risk
factors associated with venous thromboembolism in 49,028 mastectomy patients.
Breast. 2013;22:444-8.
14. Rickles FR, Levine MN. Epidemiology of thrombosis in cancer. Acta Haematol
2001;106:6-12.
15. Farge D, Debourdeau P, Beckers M, Baglin C, Bauersachs RM, Brenner B, Brilhante D,
Falanga A, Gerotziafas GT, Haim N, Kakkar AK, Khorana AA, Lecumberri R, Mandala
M, Marty M, Monreal M, Mousa SA, Noble S, Pabinger I, Prandoni P, Prins MH, Qari
MH, Streiff MB, Syrigos K, Bounameaux H, Büller HR. International clinical practice
guidelines for the treatment and prophylaxis of venous thromboembolism in patients
with cancer. J Thromb Haemost. 2013;11:56-70.
16. Khorana AA, Kuderer NM, Culakova E, Lyman GH et al. Development and validation of
a predictive model for chemotherapy-associated thrombosis. Blood 2008;111:4902–
7.
17. Schaffner F, Ruf W. Tissue factor and PAR2 signaling in the tumor microenvironment.
ArteriosclerThrombVasc Biol. 2009;29:1999-2004.
18. Nurden AT. Platelets, inflammation and tissue regeneration. ThrombHaemost.
2011;105 (Suppl 1):S13-33.
19. Owens AP 3rd, Mackman N. Microparticles in hemostasis and thrombosis. Circ Res.
2011;108:1284-97.
20. Rauch U, Nemerson Y. Circulating tissue factor and thrombosis. Curr Opin Hematol
2000;7:273-7.
21. Butenas S, Orfeo T, Mann KG. Tissue factor activity and function in blood coagulation.
Thromb Res 2008;122 (Suppl 1):S42-6.
23
22. Ay C, Dunkler D, Pirker R, Thaler J, Quehenberger P, Wagner O, Zielinski C, Pabinger I.
High D-dimer levels are associated with poor prognosis in cancer patients.
Haematologica. 2012;97:1158-64.
23. Knowlson L, Bacchu S, Paneesha S, McManus A, Randall K, Rose P. Elevated D-dimers
are also a marker of underlying malignancy and increased mortality in the absence of
venous thromboembolism. J Clin Pathol. 2010;63:818-22.
24. Ay C, Dunkler D, Marosi C, Chiriac AL, Vormittag R, Simanek R, Quehenberger P,
Zielinski C, Pabinger I. Prediction of venous thromboembolism in cancer patients.
Blood. 2010; 116: 5377-5382.
25. Hermanek P, Hutter RVP, Sobin LH, Wagner G et al. TNM atlas. Guide illustré de la
classification TNM/pTNM des tumeurs malignes. 4e éd. Paris : Springer-Verlag
France ; 1998.
26. Hemker HC, Giesen P, Al Dieri R, et al. Calibrated automated thrombin
generationmeasurement in clotting plasma. Pathophysiol Haemost Thromb
2003;33:4–15.
27. Robert S, Poncelet P, Lacroix R, Arnaud L, Giraudo L, Hauchard A, Sampol J, Dignat-
George F. Standardization of platelet-derived microparticle counting using calibrated
beads and a Cytomics FC500 routine flow cytometer: a first step towards multicenter
studies? J Thromb Haemost. 2009;7:190-7.
28. Trappenburg MC, van Schilfgaarde M, Bredewold EO, van Aalderen MC, Spronk HM,
Ten Cate H, Leyte A, Terpstra WE. Elevated numbers and altered subsets of
procoagulant microparticles in breast cancer patients using endocrine therapy.
Thromb Res. 2011;127:363-9.
29. Helley D, Banu E, Bouziane A, Banu A, Scotte F, Fischer AM, Oudard S. Platelet
microparticles: a potential predictive factor of survival in hormone-refractory
prostate cancer patients treated with docetaxel-based chemotherapy. Eur Urol
2009;56:479-484.

24
30. Varon D, Shai E. Role of platelet-derived microparticles in angiogenesis and tumor
progression. Discov Med. 2009;8:237-41.
31. Rak J. Microparticles in cancer. Semin Thromb Hemost. 2010;36:888-906.
32. Toth B, Liebhardt S, Steinig K, Ditsch N, Rank A, Bauerfeind I, Spannagl M, Friese K,
Reininger AJ. Platelet-derived microparticles and coagulation activation in breast
cancer patients. Thromb Haemost. 2008;100:663-9.
33. Tseng CC, Wang CC, Chang HC, Tsai TH, Chang LT, Huang KT, Leu S, Yen CH, Liu SF,
Chen CH, Yang CT, Yip HK, Lin MC. Levels of circulating microparticles in lung cancer
patients and possible prognostic value. Dis Markers. 2013;35:301-10.
34. Papageorgiou C, Van Dreden P, Marret E, Bonnet F, Robert F, Spyropoulos A, Galea V,
Elalamy I, Hatmi M, Gerotziafas G. Lobectomy and postoperative thromboprophylaxis
with enoxaparin improve blood hypercoagulability in patients with localized primary
lung adenocarcinoma. Thromb Res. 2013;132:584-91.
35. Lechner D, Weltermann A. Chemotherapy-induced thrombosis: a role for
microparticles and tissue factor? Semin Thromb Hemost. 2008;34:199-203.
36. Kim HK, Song KS, Park YS, et al. Elevated levels of circulating platelet microparticles,
VEGF, IL-6 and RANTES in patients with gastric cancer: possible role of a metastasis
predictor. Eur J Cancer 2003; 39: 184–191.
37. Pabinger I, Thaler J, Ay C. Biomarkers for prediction of venous thromboembolism in
cancer. Blood. 2013 Sep 19;122:2011-8.
38. Ferroni P, Martini F, Portarena I, Grenga I, Riondino S, La Farina F, Laudisi A, Guadagni
F, Roselli M. Early changes of a novel APC-dependent thrombin generation assay
during chemotherapy independently predict venous thromboembolism in cancer
patients--a pilot study. Support Care Cancer. 2012;20:2713-20.
39. Roselli M, Ferroni P, Riondino S, Mariotti S, Laudisi A, Vergati M, Cavaliere F,
Palmirotta R, Guadagni F.Impact of chemotherapy on activated protein C-dependent
thrombin generation--association with VTE occurrence. Int J Cancer. 2013;133:1253-
8.

25
40. Mukherjee SD, Swystun LL, Mackman N, Wang JG, Pond G, Levine MN, Liaw PC.
Impact of chemotherapy on thrombin generation and on the protein C pathway in
breast cancer patients. Pathophysiol Haemost Thromb. 2010;37:88-97.
41. Swystun LL, Mukherjee S, Liaw PC. Breast cancer chemotherapy induces the release
of cell-free DNA, a novel procoagulant stimulus. J Thromb Haemost. 2011;9:2313-21.
42. Mukherjee SD, Swystun LL, Mackman N, Wang JG, Pond G, Levine MN, Liaw PC.
Impact of chemotherapy on thrombin generation and on the protein C pathway in
breast cancer patients. Pathophysiol Haemost Thromb. 2010;37:88-97.
43. Nijziel MR, van Oerle R, Christella M, Thomassen LG, van Pampus EC, Hamulyák K,
Tans G, Rosing J. Acquired resistance to activated protein C in breast cancer patients.
Br J Haematol. 2003;120:117-22.
44. Ay C, Dunkler D, Simanek R, Thaler J, Silvia Koder, Christine Marosi, Christoph
Zielinski, and Ingrid Pabinger. Prediction of Venous Thromboembolism in Patients
With Cancer by Measuring Thrombin Generation: Results From the Vienna Cancer
and Thrombosis Study. J Clin Oncol 2011;29:2099-103.
45. Dirix LY, Salgado R, Weytjens R, Colpaert C, Benoy I, Huget P, van Dam P, Prové A,
Lemmens J, Vermeulen P. Plasma fibrin D-dimer levels correlate with tumour volume,
progression rate and survival in patients with metastatic breast cancer. Br J Cancer.
2002;86:389-95.
46. Dirix LY, Salgado R, Weytjens R, Colpaert C, Benoy I, Huget P, van Dam P, Prové A,
Lemmens J, Vermeulen P. Plasma fibrin D-dimer levels correlate with tumour volume,
progression rate and survival in patients with metastatic breast cancer. Br J Cancer.
2002;86:389-95.
47. Palumbo JS, Kombrinck KW, Drew AF, Grimes TS, Kiser JH, Degen JL, Bugge TH.
Fibrinogen is an important determinant of the metastatic potential of circulating
tumor cells. Blood. 2000;96:3302-9.

26
48. Ay C, Dunkler D, Pirker R, Thaler J, Quehenberger P, Wagner O, Zielinski C, Pabinger I.
High D-dimer levels are associated with poor prognosis in cancer patients.
Haematologica. 2012;97:1158-64.

27
28

29
Figure 1. Distribution of individual values of thrombin generation rate (frame A), Peak of
thrombin (frame B) and ETP (frame C) in the control group (open cycles) and in the group of
patients (dark cycles).

30
Figure 2. Representative thrombograms from a healthy individual (a) and four patients with
high thrombin generation (b, c,d,e).

31
Figure 3. Impact of the interval since the diagnosis (shorter of longer than 6 months) on the
ETP in patients on chemotherapy.
32
Figure 4. Impact of the stage of breast cancer on the conentration of D-Dimers.

33
Control
group
(n=30)
All patients
(n=62)
Localized
Stage
(n=13)
Regional
Stage
(n=29)
Metastatic
Stage
(n=20)
Age (year) 55 ± 10 52± 11 53 ± 10 54 ± 11 49 ± 13
BMI (Kg/m2) 27 ± 6 28 ± 4.7 29.6 ± 4.7 27.6 ± 4.2 27.7 ± 5.6
Hemoglobin (g/dL)
Leukocytes (109/L)
Platelets (109/L)
11.6±2
7.3 ± 1.8
270±62
11.5 ± 1.5
7.1 ± 4.8
242 ± 96
11.2 ± 1.1
7.2 ± 2.4
262 ± 65
11.8 ± 1.4
7.1 ± 2.8
264 ± 98
11.3 ± 1.8
7.1 ± 5
198 ± 98
PT (% of prothrombin) 100±8 92±8.3 94±6 95±7 89±11
aPTT ratio 1±0.2 0.9±0.06 0.9±0.05 0.9±0.06 0.9±0.08
Fibrinogen (g/L) 3.9±0.6 4.4±1.2 4±0.8 4.7±1.4 4.4±1.1
CRP (mg/L) - 14.5±50 32±99 7±20 10±15
ALAT (IU/L) - 25±13 30±16 24±10 25±15
ASAT (IU/L) - 36±23 31±18 34±17 43±32
Creatinine (μmol/L) - 65±17 67±23 67±17 62±13
Urea (mg/dL) - 5±2 5±1.6 5.5±2.7 5±2.2
Time since diagnosis (n)
0-6 months
6-12 months
12-36 months
> 36 months
-
27
10
13
12
8
2
3
0
15
7
5
2
4
1
5
10
Cardiovascular risk factors (n)
-Hypertension
-Varicose veine
-Hyperlipidemia
-Diabetes
no
no
no
no
14
8
4
6
3
1
1
1
9
6
3
3
2
1
0
2
Table 1. Demographic data, clinical characteristics and routine hematological and
biochemical parameters of breast cancer patients and controls. Data are presented as
mean±sd.

34
Control
group
(n=30)
(95% CI)
Breast cancer group (n=62)
All patients
(n=62)
(95% CI)
Local
Stage (n=13)
(95% CI)
Regional
Stage (n=29)
(95% CI)
Metastatic
Stage (n=20)
(95% CI)
MRI
(nM/ min)
109±33
(96,5 – 121)
159±47**
(139 – 168)
172±55§*
(138 - 205)
146±56§
(122 – 168)
162±49**
(126 – 180)
Peak
(nM)
288±48
(269 – 305)
341±65*
(323 – 365
369±75**
(323 - 414)
334±90§§
(301 – 371)
343±69§
(306 – 370)
ETP
(nM.min)
1498±225
(1413 – 1581)
1531±337
(1448 – 1623)
1626±332
(1424 – 1826)
1499±374
(1366 – 1656)
1515±285
(1369 – 1650)
Pd-MP
(/μL)
756±429
(650 – 1100)
10015±8223§§
(7890 – 12138)
9370±7724
(4702 – 14038)
7847±6479***
5334 – 10359)
13650±9864
(8895 – 18404)
Pd-MP/PS+
(/μL)
695±361
(550 – 1020)
9698±7931§§
7649 – 11746)
9115±7428
4626 – 13604)
7570±6241***
(5150 – 9991)
13231±9512
(8646 – 17816)
PPL
(sec)
72.8 ± 9.9
(59 – 66)
43,5± 10,3
(41 – 46)
45±10,2
(39 – 51)
44,3±9,8
40 – 48)
41,3±11,3$
(35 – 47)
D-Dimers
(ng/ml)
230 ± 50
(279 – 340)
1250 ± 1773
(767 – 1648)
605 ± 499***
(303 – 907)
1123 ± 1429
(503 – 1572)
1853 ± 2497
(703 – 3154)
Table 2. Biomarkers of cellular and plasma hypercoagulability in patients and controls.
Values are depicted as mean±sd. The 95% Confidence Interval of the mean (95%CI) is also
shown.
* p=0,001 versus controls, ** p<0,001 versus controls, § p<0,01 versus controls, §§ p<0,05
versus controls, *** p<0,05 versus metastatic stage, $ p<0,05 versus local stage.

35
All patients
(n=62)
Patients on chemotherapy
(n=41)
0-6 months
(n=27)
>6months
(n=35)
0-6 months
(n=20)
>6months
(n=21)
MRI (nM/ min) 160±60* 153±48 161±55* 148±52
Peak (nM) 353±92* 336±70* 362±73* 324±74
ETP(nM.min) 1593±340* 1483±332 1627±335* 1402±327
Pd-MP (/μL) 10098±7057 9946±9175 10054±7769 9026±7469
Pd-MP/PS+
(/μL) 9731± 6821 9671±8841 9695±7488 8793±7265
PPL (sec) 43,9 ± 10,8 43,3 ± 10,1 43,3 ± 12,3 44,7 ± 10,8
Table 3. Thrombogram parameters and Pd-MP levels in all patients and in patients on
chemotherapy according to the time since the diagnosis (less than 6 months or more).
Values are mean±sd. *p<0,05 versus >6 months.
36
Total population of patients (n=62)
CV RF
(n=21)
No CV RF
(n=41)
MRI
(mM/ min) 134±51 167±51
Peak
(nM) 317±89 357±72
ETP
(mM.min) 1490±346 1552±335
Pd-MP
(/μL) 8133±6480 10955±8893
Pd-MP/PS+ (/μL) 7896±6328 10599±8552
PPL
(sec) 42±10 44±11
D-dimers (ng/ml) 1190 ±
[440-1750]
540 ±
[280-830]
Table 4. Analysis of the impact of cardiovascular risk factors on the biomarkers of cellular
and plasma hypercoagulability in patients with breast cancer.
CV RF : Cardiovascular risk factors
Pd-MP : Platelet derived microparticles
Pd-MP/PS+ : Platelet derived microparticles expressing phosphatidylserin
PPL : Procoagulant phospholipid dépendent clotting time
MRI : Mean rate index of the propagation phase
ETP : Endogenous thrombin generation
*p=0,05 versus No CV RF