author's personal copy - wellesley...
TRANSCRIPT

Author's personal copy
Economics of Education Review 32 (2013) 122– 139
Contents lists available at SciVerse ScienceDirect
Economics of Education Review
jou rna l h omepa g e: www.elsev ier .com/ locate /econedurev
The impact of Chile’s school feeding program on education outcomes
Patrick J. McEwan !
Department of Economics, Wellesley College, 106 Central St., Wellesley, MA 02481, United States
a r t i c l e i n f o
Article history:Received 19 May 2012Received in revised form 27 August 2012Accepted 27 August 2012
JEL classification:I25I38
Keywords:ChileSchool feeding programsRegression-discontinuityImpact evaluation
a b s t r a c t
Chile operates one of the oldest and largest school feeding programs in Latin America, tar-geting higher-calorie meals to relatively poorer schools. This paper evaluates the impactof higher-calorie meals on the education outcomes of public, rural schools and their stu-dents. It applies a regression-discontinuity design to administrative data, including schoolenrollment and attendance, first-grade enrollment age and grade repetition, and fourth-grade test scores. There is no evidence, across a range of specifications and samples, thatadditional calories affect these variables. The paper suggests that the focus of Chilean policyshould further shift to the nutritional composition of school meals, rather than the caloriccontent.
© 2012 Elsevier Ltd. All rights reserved.
1. Introduction
Governments and development organizations devotesubstantial resources to the provision of free schoolmeals to poor children, in both less-developed and richercountries. In 2008, the World Food Programme (WFP)operated school feeding programs in 68 poor countries,including most of Africa (WFP, 2008). In comparativelyhigher-income countries of Latin America, school feedingprograms are just as common, and more likely to be fundedand operated on a large scale by government agencies(Bundy et al., 2009). And, in the U.S., the National SchoolLunch Program (NSLP) subsidizes meal provision in 99%of public schools, with participation of more than half ofstudents (Currie, 2003; Schanzenbach, 2009). Despite theubiquity of school feeding programs, we know surprisinglylittle about their causal impact on education outcomes,especially academic achievement. This is especially trueof the mature, large-scale school feeding programs indeveloped countries.
! Tel.: +1 781 283 2987; fax: +1 781 283 2177.E-mail address: [email protected]
In the U.S., Hinrichs (2010) uses a 1960s modificationof the NSLP funding formula to find that it had long-run effects on school attainment.1 Using Virginia data,Fgilio and Winicki (2005) find that schools threatened withaccountability sanctions tended to increase the caloric con-tent of meals – but not other nutrients – and that thismay have boosted high-stakes test scores. The effect couldstem from a short-run effect of glucose levels on stu-dent cognition. Using a difference-in-differences strategy,Belot and James (2011) found that a British program thataffected the nutritional content of school meals in a singleborough of London apparently raised test scores and low-ered absences.
In poorer countries, Afridi (2011) finds that a nationalmeal program in India led to attendance increases amonggirls (but not boys), while He (2009) finds that a Sri Lankan
1 A larger literature focuses on the health outcomes of the U.S. break-fast and lunch programs. For example, Hinrichs (2010) finds no long-termhealth impacts; Bhattacharya, Currie and Haider (2006) finds that theSchool Breakfast Program increases nutrient intake but not calories, usinga sibling difference approach; and Schanzenbach (2009) finds that schoollunches increase obesity rates using a discontinuity strategy.
0272-7757/$ – see front matter © 2012 Elsevier Ltd. All rights reserved.http://dx.doi.org/10.1016/j.econedurev.2012.08.006

Author's personal copy
P.J. McEwan / Economics of Education Review 32 (2013) 122– 139 123
national program led to increased enrollments, but that theincreases were apparently the result of existing studentssorting between treated and untreated schools. Random-ized evaluations of small-scale interventions in very poorsettings – usually WFP or researcher-initiated programs inAfrica – show some effects on attendance rates, fewer onenrollments,2 and from zero to small effects on measuresof cognitive ability and academic achievement.3
This paper adds to the literature by rigorously eval-uating one of the oldest, largest, and, some argue, mostefficiently managed school feeding programs. In 2002, theWorld Food Programme selected Chile’s School FeedingProgram, operated by the government agency JUNAEB, asone of the top-five in the world.4 JUNAEB has operatedsince 1964, with the explicit goal of improving educa-tion outcomes of low-income children attending publiclyfunded schools (JNUAEB, 2005; Kain, Uauy, & Taibo, 2002;Vial, Muchnik, & Kain, 1991). In recent years, JUNAEB hasdelivered free meals to one-third of primary school stu-dents, targeting schools using a poverty index. The poorestschools receive meal rations with relatively higher caloriccontent. The targeting rule is an implicit judgment thatcaloric intake is deficient among these students.
This paper leverages discontinuous variation in the foodcalories of meal rations to identify impacts on a broadset of primary education outcomes that include enroll-ment, grade repetition, attendance, and test scores on thenational fourth-grade assessment. In the 2000 school year,the agency calculated a school-level “vulnerability” index(scaled 0–100) and used it to assign one of several types ofmeal rations during the 2001–2005 school years. Schoolswith an index of 68 or higher received individual mealrations of 1000 kcal/day. Schools with an index of lessthan 68 (but 20 or higher) received rations of 700 kcal/day.Schools with an index of less than 20 received one of sev-eral options, from zero to 700 kcal/day, further dependingon conditions described in Section 4. The proportion ofstudents within each school allocated meal rations varied
2 There are no full-sample enrollment effects in Uganda and Bur-kina Faso (Alderman, Gilligan, & Lehrer, 2008; Kazianga, de Walque, &Alderman, 2009). In Burkina Faso there are large enrollment effects in thesubsample of girls and, in Kenya, substantial effects on school participa-tion (Vermeersch & Kremer, 2005). Attendance effects are slightly moreconsistent. Besides the Kenyan effects on school participation, there aresome positive attendance effects in the Jamaican, Peruvian, and Ugandanexperiments, but negative effects in the Burkina Faso study (Jacoby et al.,1996; Powell et al., 1998).
3 In full sample estimates, there are no statistically significant effectsin Burkina Faso (Kazianga et al., 2009), Kenya (Vermeersch and Kremer,2005), Jamaica (Powell et al., 1998), or Peru (Jacoby et al., 1996). AnotherKenyan experiment finds modest but statistically significant effects ofsome treatments on some tests (Whaley et al., 2003), and a Ugandastudy finds effects on one test instrument among several (Alderman et al.,2008). Vermeersch and Kremer (2005) do find large effects on curriculum-based tests when teachers are more experienced, and Adelman, Alderman,Gilligan, and Lehrer (2008) and Adelman, Gilligan, and Lehrer (2008) findmath and literacy effects among age-based subsamples.
4 In 2004, JUNAEB was a founding member of the Latin AmericanFeeding Network (www.larae.org), headquartered in Santiago. Chile’scombinational auction system for awarding territorial meal contracts toprivate firms has received international accolades (Catalán et al., 2009;Epstein et al., 2002).
continuously with the index, with more rations providedto poorer schools.
The rules unwittingly facilitated a regression-discontinuity design. Using administrative data fromJUNAEB, I verify that actual program assignment followedthe stated rules. In 2001–2005, the food calories of schoolmeal rations increased sharply in the vicinity of eachcutoff, although the proportion of students allocated mealsnear each cutoff was similar. Thus, this paper’s estimatesreflect the impact of providing meals with different caloriccontents to similar proportions of students within schools.The estimates at the higher cutoff (68) are larger (about170 food calories), more robust to alternate specifications,and more precisely estimated. Hence, this paper focuseson the local experiment at 68, in a sample dominatedby rural, public schools. The magnitude of the treatmentrepresents, on average, over 10% of the recommendeddaily caloric intake for children in early primary grades.5
I compare the education outcomes of schools and theirstudents on either side of the assignment cutoff, using a richset of administrative data from JUNAEB and the Ministry ofEducation collected between 2001 and 2005. Dependentvariables measured at the school level include enrollmentin grade 1, enrollment in all primary grades 1–8, and aver-age daily attendance. Dependent variables measured at thestudent level include the first-grade enrollment age andgrade repetition of multiple cohorts of first-graders, as wellas the fourth-grade test scores of the 2002 cohort of first-graders. Overall, the results provide no evidence that anexogenous increase in food calories affected a range of pri-mary education outcomes.
The results are perhaps not surprising. Chile hasattained universal primary school enrollment, and there isa little scope for treated schools to increase enrollments,unless accomplished by poaching students from otherschools (He, 2009). And though more children sufferedfrom caloric deficiencies during JUNAEB’s early history,recent data suggest that rates of child wasting and stuntingare low, and that rates of childhood obesity have reachedlevels of developed countries (Kain, Uauy, Lera, Taibo, &Albala, 2005; Kain, Lera, Rojas, & Uauy, 2007; Musgrove,1993; Uauy & Kain, 2002). Also like developed countries,Chile is confronting a perceived stagnation in academicperformance, but widespread child malnutrition cannotfully explain these patterns. Indeed, Chile has focused onreforms to the structure of educational markets – suchas vouchers – and on direct investments in the quality ofinstruction (McEwan, Urquiola, & Vegas, 2008).
Still, the Chilean case is interesting because it provides acautionary tale of what might occur in developing countriesthat expand popular feeding programs while maintaininga focus on addressing caloric deficiencies – even as rates ofchild malnutrition and stunting decline. The results suggestthat continuing to provide supplemental calories is unlikelyto affect education outcomes. On the other hand, limitedevidence suggests that a renewed focus on the nutritional
5 Moderatively active girls and boys, ages 4–8, require 1400–1600 calo-ries per day according to recent guidelines (U.S. Department of Agriculture& U.S. Department of Health and Human Services, 2010).

Author's personal copy
124 P.J. McEwan / Economics of Education Review 32 (2013) 122– 139
quality of meals could have such an effect on learning (Belot& James, 2011). More disconcertingly, simply providingmore calories plausibly contributes to rising rates of child-hood obesity. In the U.S., Schanzenbach (2009) finds thatincreases of as little as 40 calories per day in school lunchescould increase obesity rates by 2 percentage points. Thereis no comparable estimate in Chile, but the mean increaseof about 170 calories in the poorest schools provides causefor concern. The national debate in Chile has shifted to thecauses and consequences of childhood obesity, but JUNAEBfaces challenges in modifying an enormously popular socialprogram.
The paper proceeds in Section 2 by reviewing empiricalliterature on the potential impact of school meals on edu-cation outcomes. Section 3 provides background on Chile’sschool system and child feeding programs. Section 4 pro-vides a detailed description of the JUNAEB’s school feedingprogram, and describes its assignment to schools and chil-dren. Sections 5 and 6 review the regression-discontinuitydesign and data, respectively. Section 7 presents the empir-ical findings, while Section 8 summarizes and concludes.
2. The potential impact of school feeding oneducation outcomes
There are three pathways by which school mealscould affect student learning (for related overviews, seeAlderman, Gilligan, & Lehrer, 2008; Bundy et al., 2009).First, in-school meals are a conditional transfer to chil-dren. Thus, school meals may induce families to enroll theirchildren in school, to enroll their children sooner, or, con-ditional on enrollment, to encourage regular attendance.The availability of meals could also produce unexpectedconsequences, especially when not all schools providefree meals and when few rules govern school attendancezones and fees. For example, families may transfer betweentreated and untreated schools, and rising demand fortreated schools could increase fees (He, 2009; Vermeersch& Kremer, 2005). Section 3 confirms that enrollment ratesare high in Chile, suggesting that any increased enrollmentsdue to school meals are likely the result of student sor-ting between schools. There is potentially greater scopefor meals to increase regular attendance, conditional onenrollment.
Second, there is evidence that short-term attention andmemory are adversely affected by skipping breakfast. Lab-oratory experiments suggest that even “empty calories”instead of a morning fast can improve short-term func-tioning among children and young adults (Pollitt, Cueto,& Jacoby, 1998). If energy sources contribute to moreeffective work during the school day, then they couldproduce sustained gains in test scores. In apparent recog-nition of this, Virginia schools increased the calories ofschool meals on high-stakes testing days, although thisshort-term response was more characteristic of a “gam-ing” response, rather than an investment in human capital(Fgilio & Winicki, 2005). Overall, this literature implies thatthe timing of meals during the school day is relevant tounderstanding the potential impact in Chile, a point towhich I return in the next section.
Third, sustained exposure to nutritious food could pre-vent or ameliorate malnutrition. Child nutrition, in turn,could affect learning via increased attendance, cognitivedevelopment, or academic achievement (see Glewwe, 2005for a review of the mostly non-experimental evidence).Nutritional gains could be blunted if supplemental caloriesor nutrients do not “stick” to children because householdsrespond by reallocating across their members, but the bestevidence suggests that at least half the calories and nutri-ents are actually received by children.6 As described inthe introduction, this paper’s analyses focus on the effectsof increased calories, rather than a qualitative change thenutritional content of meals. Given this, it is possible thathigher-calorie meals contribute to higher rates of obesityand worse child health (Schanzenbach, 2009).
3. Schools and feeding programs in Chile
3.1. Background on Chilean schools
The Chilean school calendar is March to November,with approximately 180 days of instruction. Schooling isdivided into three levels: pre-primary, 8 years of primaryor “basic” education (ages 6–13); and 4 years of secondaryeducation (ages 14–17). In 2000, the baseline year of thisstudy, only primary education was mandatory. Table 1 con-firms that net primary enrollment rates are generally over98% of appropriately aged children.7 Pre-primary and sec-ondary enrollment rates are lower: 55% of 4–5 year olds areenrolled in some form of pre-primary, and 80% of 16–17year olds are enrolled in secondary.
A 1980s reform decentralized control of national publicschools to more than 300 municipal governments (McEwanet al., 2008). The revenues of municipal (public) schools anda new category of private subsidized schools were deter-mined thereafter by a per-student subsidy multiplied byaverage attendance. Private subsidized schools are man-aged by a diverse group of for-profit and not-for-profitorganizations, both religious and secular. A third, smallercategory of private tuition schools receives no governmentsubsidy, charges tuition, and does not participate in gov-ernment programs.
3.2. Child feeding programs
The Chilean government operates two food distribu-tion programs for children. First, the Ministry of Healthadministers the National Complementary Feeding Program(PNAC, or the Programa Nacional de Alimentación Comple-
6 Jacoby (2002) finds that child caloric intake in the Philippines risesby essentially the same amount as feeding program calories, albeit lessso among poorer families. In Guatemala, households reduced the caloricintake of children by about half the amount of a food supplement, but80% of the supplement’s protein was received by children (Islam andHoddinott, 2009). Afridi (2010) finds that Indian families reduce children’scaloric intake in the home, but that overall children’s daily nutrient intakeincreases by 49–100% of the in-school transfers.
7 The lower enrollment rate among 6–7 year-olds is an artifact of house-hold survey’s timing, since many surveyed 6 year-olds in November 2000– the end of the school year – had not been eligible to enroll in the firstgrade at the beginning of the year (McEwan and Shapiro, 2008).

Author's personal copy
P.J. McEwan / Economics of Education Review 32 (2013) 122– 139 125
Table 1Net school enrollment and program participation in 2000.
Age group Percent of age group enrolled in school Percent of age group participating in feeding program
Free school meal(s) in:
Pre-primary Primary (grades 1–8) Secondary PNAC Pre-primary Primary (grades 1–8) Secondary
0–1 2.7% – – 81.5% 1.4% – –2–3 18.9% 0.1% – 69.1% 9.5% – –4–5 54.6% 1.4% – 59.5% 22.6% 0.5% –6–7 21.7% 75.4% – – 5.7% 27.0% –8–9 – 99.4% – – – 37.3% –
10–11 – 99.3% – – – 41.4% –12–13 – 98.1% 0.4% – – 39.5% 0.0%14–15 – 44.5% 49.9% – – 18.8% 12.0%16–17 – 5.1% 80.3% – – 2.6% 20.9%18–19 – 0.8% 37.1% – – 0.4% 10.2%
Source: CASEN household survey, 2000, and author’s calculations.Note: Survey weights are applied. “Free meals” may include PAE or another intervention.
mentaria). PNAC provides take-home food rations to allchildren between 0 and 5 years old, as well as pregnantand nursing women (Kain & Uauy, 2001; Uauy & Kain,2002). PNAC rations are only available to families obtain-ing regular check-ups at Ministry-operated health centers,leading to self-exclusion among higher-income or privatelyinsured families. Even so, program participation is substan-tial: 82% of children ages 0–1 had obtained PNAC rations inthe three months prior to a household survey, declining to60% among the 4–5 year-old cohort (Table 1).
Second, the National Board of School Assistance andScholarships (JUNAEB), an independent unit of the Min-istry of Education, operates the School Feeding Program orPrograma de Alimentación Escolar (PAE).8 In 1980, JUNAEBbegan contracting with private suppliers of schools meals,later implementing a combinational auction to award mealcontracts to competing private firms (Epstein, Henríquez,Catalán, Weintraub, & Martínez, 2002). JUNAEB nutrition-ists establish minimum standards for meals, including (1)food calories and nutritional content; (2) food structure,including minimum or maximum frequencies of certainfoods; (3) quality thresholds of ingredients; and (4) min-imum acceptable operating conditions and food serviceinfrastructure. Recipient schools are divided into territorialunits, and firms can submit multiple bids for 1–8 territorialunits, which are accepted or rejected in their entirety. A lin-ear programming model ultimately identifies the least-costcombination of meal providers (Catalán et al., 2009).
The food calories of daily meal rations vary acrossschools (JUNAEB, 2000; Kain et al., 2002). In 2000,pre-primary schools were eligible to receive break-fast and lunch (or lunch and a snack) with a total of700 kcal/day. Primary schools were eligible to receiveone of three options: (1) breakfasts with 250 kcal/day;(2) breakfast/lunch or lunch/snack combinations with700 kcal/day; and (3) breakfast/lunch or lunch/snack com-binations with 1000 kcal/day. Finally, secondary schoolswere eligible for breakfasts of 350 kcal/day or lunchesof 650 kcal/day. As Section 2 noted, the timing of schoolmeals during the day is potentially important, and the
8 JUNAEB is the Junta Nacional de Auxilio Escolar y Becas.
meal combinations for options (2) and (3) imply differenttiming. At the time of this study, Chilean schools operatedon a mix of half-day shifts (morning or afternoon) andfull-day shifts, and the timing of meals was apparentlydetermined by shifts. Further below I demonstrate thatthe proportion of schools using the full-day shift, amongother school attributes, was similar across schools withlower- and higher-calorie rations. Thus, the effect ofhigher-calorie meal rations can be considered an averageeffect across schools with different shift schedules.
Table 1 reports the percentage of age cohorts thatreceived free school meals in 2000, using household surveydata. Overall, 23% of 4–5 year-olds receive free meals (or41% of children attending pre-primary education). Thirty-seven percent of 8–9 year-olds receive free meals (38% ofthe cohort attending primary school), and 21% of 16–17year-olds receive free meals (26% of children attending sec-ondary school). This paper assesses PAE in primary schools.
4. Assignment of PAE to primary schools andstudents
4.1. Assignment to primary schools
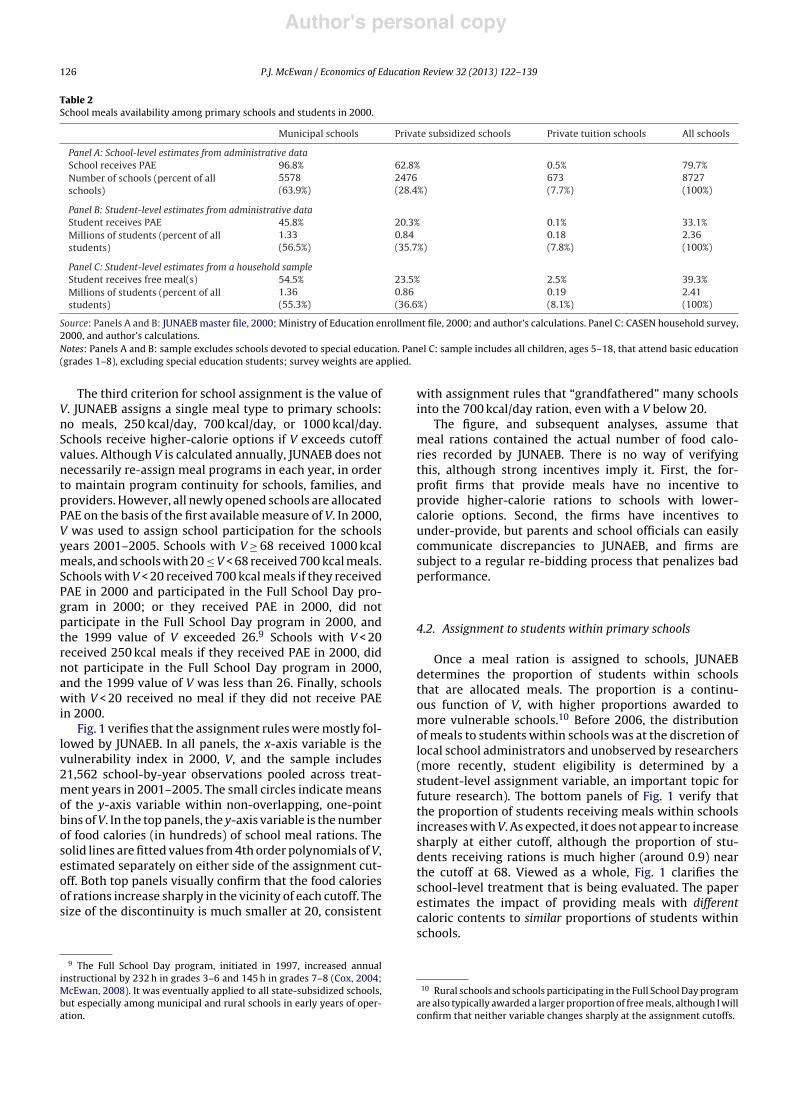
Three criteria govern primary school participation inPAE. First, publicly funded schools are eligible, exclud-ing the roughly 8% of students attending private tuitionschools. Second, publicly funded schools must participatein an annual First Grade Survey used to calculate a vul-nerability index (V), scaled from 0 (least vulnerable) to100 (most vulnerable). The index is a weighted averageof socioeconomic and anthropometric variables derivedfrom survey data on first-graders, collected in the first twomonths of every school year (Kain et al., 2002). Some pri-vate subsidized schools never participate in the survey andexclude themselves from PAE eligibility. Table 2 examinesthe first two criteria using administrative data from 2000.Of 8727 primary schools in Chile, 80% offer some variantof PAE (see panel A). However, coverage is nearly universalamong the population of municipal primary schools (97%),less so among private subsidized schools (63%), and almostnil among private tuition schools.
Author's personal copy
126 P.J. McEwan / Economics of Education Review 32 (2013) 122– 139
Table 2School meals availability among primary schools and students in 2000.
Municipal schools Private subsidized schools Private tuition schools All schools
Panel A: School-level estimates from administrative dataSchool receives PAE 96.8% 62.8% 0.5% 79.7%Number of schools (percent of allschools)
5578 2476 673 8727(63.9%) (28.4%) (7.7%) (100%)
Panel B: Student-level estimates from administrative dataStudent receives PAE 45.8% 20.3% 0.1% 33.1%Millions of students (percent of allstudents)
1.33 0.84 0.18 2.36(56.5%) (35.7%) (7.8%) (100%)
Panel C: Student-level estimates from a household sampleStudent receives free meal(s) 54.5% 23.5% 2.5% 39.3%Millions of students (percent of allstudents)
1.36 0.86 0.19 2.41(55.3%) (36.6%) (8.1%) (100%)
Source: Panels A and B: JUNAEB master file, 2000; Ministry of Education enrollment file, 2000; and author’s calculations. Panel C: CASEN household survey,2000, and author’s calculations.Notes: Panels A and B: sample excludes schools devoted to special education. Panel C: sample includes all children, ages 5–18, that attend basic education(grades 1–8), excluding special education students; survey weights are applied.
The third criterion for school assignment is the value ofV. JUNAEB assigns a single meal type to primary schools:no meals, 250 kcal/day, 700 kcal/day, or 1000 kcal/day.Schools receive higher-calorie options if V exceeds cutoffvalues. Although V is calculated annually, JUNAEB does notnecessarily re-assign meal programs in each year, in orderto maintain program continuity for schools, families, andproviders. However, all newly opened schools are allocatedPAE on the basis of the first available measure of V. In 2000,V was used to assign school participation for the schoolsyears 2001–2005. Schools with V " 68 received 1000 kcalmeals, and schools with 20 # V < 68 received 700 kcal meals.Schools with V < 20 received 700 kcal meals if they receivedPAE in 2000 and participated in the Full School Day pro-gram in 2000; or they received PAE in 2000, did notparticipate in the Full School Day program in 2000, andthe 1999 value of V exceeded 26.9 Schools with V < 20received 250 kcal meals if they received PAE in 2000, didnot participate in the Full School Day program in 2000,and the 1999 value of V was less than 26. Finally, schoolswith V < 20 received no meal if they did not receive PAEin 2000.
Fig. 1 verifies that the assignment rules were mostly fol-lowed by JUNAEB. In all panels, the x-axis variable is thevulnerability index in 2000, V, and the sample includes21,562 school-by-year observations pooled across treat-ment years in 2001–2005. The small circles indicate meansof the y-axis variable within non-overlapping, one-pointbins of V. In the top panels, the y-axis variable is the numberof food calories (in hundreds) of school meal rations. Thesolid lines are fitted values from 4th order polynomials of V,estimated separately on either side of the assignment cut-off. Both top panels visually confirm that the food caloriesof rations increase sharply in the vicinity of each cutoff. Thesize of the discontinuity is much smaller at 20, consistent
9 The Full School Day program, initiated in 1997, increased annualinstructional by 232 h in grades 3–6 and 145 h in grades 7–8 (Cox, 2004;McEwan, 2008). It was eventually applied to all state-subsidized schools,but especially among municipal and rural schools in early years of oper-ation.
with assignment rules that “grandfathered” many schoolsinto the 700 kcal/day ration, even with a V below 20.
The figure, and subsequent analyses, assume thatmeal rations contained the actual number of food calo-ries recorded by JUNAEB. There is no way of verifyingthis, although strong incentives imply it. First, the for-profit firms that provide meals have no incentive toprovide higher-calorie rations to schools with lower-calorie options. Second, the firms have incentives tounder-provide, but parents and school officials can easilycommunicate discrepancies to JUNAEB, and firms aresubject to a regular re-bidding process that penalizes badperformance.
4.2. Assignment to students within primary schools
Once a meal ration is assigned to schools, JUNAEBdetermines the proportion of students within schoolsthat are allocated meals. The proportion is a continu-ous function of V, with higher proportions awarded tomore vulnerable schools.10 Before 2006, the distributionof meals to students within schools was at the discretion oflocal school administrators and unobserved by researchers(more recently, student eligibility is determined by astudent-level assignment variable, an important topic forfuture research). The bottom panels of Fig. 1 verify thatthe proportion of students receiving meals within schoolsincreases with V. As expected, it does not appear to increasesharply at either cutoff, although the proportion of stu-dents receiving rations is much higher (around 0.9) nearthe cutoff at 68. Viewed as a whole, Fig. 1 clarifies theschool-level treatment that is being evaluated. The paperestimates the impact of providing meals with differentcaloric contents to similar proportions of students withinschools.
10 Rural schools and schools participating in the Full School Day programare also typically awarded a larger proportion of free meals, although I willconfirm that neither variable changes sharply at the assignment cutoffs.

Author's personal copy
P.J. McEwan / Economics of Education Review 32 (2013) 122– 139 127
Fig. 1. Meal assignment (pooled school observations in 2001–2005) Note: “Hundreds of kcal/day” indicates the food calories of the daily meal rationprovided to a school (0, 250, 700, or 1000) in the 2001–2005 school years. “Proportion” indicates the proportion of students within schools allocated thedaily meal ration in the 2001–2005 school years. In this and subsequent figures, circles are means of the y-axis variable within non-overlapping 1 pointbins of the 2000 vulnerability index. Lines are fitted values from 4th order polynomials of the 2000 vulnerability index, estimated on either side of therespective cutoff.
4.3. PAE coverage in 2000
Table 2 summarizes the overall percentage of studentsreceiving free meals in 2000, the combined result of schooland student assignment. In panel B, administrative datashow that 33% of Chile’s 2.36 million primary studentswere allocated a meal ration by JUNAEB, ranging from 46%of municipal students to 0.1% of private paid students. Inpanel C, weighted estimates from a household survey cor-roborate these findings. A somewhat larger 39% of studentsreport receiving a free meal in school, ranging from 55% ofmunicipal students to 3% of private tuition students. Thehousehold survey question does not state whether the freemeal was directly subsidized by JUNAEB. Conservatively,about one-third of Chile’s primary students received schoolmeals via PAE in 2000. The evidence confirms that JUNAEBdisproportionately targets these meals to students attend-ing state-subsidized schools and to schools with highervalues of the vulnerability index (V).
5. Empirical strategy
5.1. Identification and estimation
Impact evaluations of school feeding programs typicallybegin with the regression:
O = + !T + X $ + " (1)
where O is a outcome measured at the school level, suchas enrollment or average attendance; T is a measure of
school treatment status; and X is a vector of control vari-ables such as student poverty (school-level subscripts areomitted). If program assignment occurs on the basis ofomitted variables that also influence O, then cov(T, ") /= 0,and the treatment effect ! does not have the desired causalinterpretation.
In Chile, discontinuous assignment rules introduceexogenous variation in schools’ T. Henceforth I define T asdaily food calories (in hundreds) of a school meal ration. Iformally test for discontinuous variation in T at each cutoffby estimating:
T = ıxDx + f (V) + ", where x % h # V < x + h. (2)
V is the 2000 vulnerability index; Dx = 1{V " x} indicatesvalues of the assignment variable (V) that exceed cutoffsat either x = 20 or x = 68; and f(V) is a continuous functionof the assignment variable. The regression is estimated in apooled sample of school-level observations between 2001and 2005, further defined by the cutoff x and bandwidth h.
I report estimates from three variants of this regression.First, a global polynomial specification assumes that f(V) isa piecewise 4th order polynomial, and applies a large band-width of x = 20.11 Fig. 1 already illustrated fitted values fromthis specification. Second, I report global estimates thatcontrol for baseline school variables, mainly to improveprecision. Third, a local linear specification assumes that
11 Specifically, f (V) = ˇ0 + ˇ1V + ˇ2V2 + ˇ3V3 + ˇ4V4 + Dx[ˇ5(V % x) +ˇ6(V % x)2 + ˇ7(V % x)3 + ˇ8(V % x)4].

Author's personal copy
128 P.J. McEwan / Economics of Education Review 32 (2013) 122– 139
f(V) is a piecewise 1st order polynomial, and applies asmaller bandwidth of x = 3. In choosing this bandwidth, Iwas guided by the cross-validation procedure describedin Lee and Lemieux (2010), and applied to school-leveldependent variables. The optimal bandwidths were similaracross a range of variables. In robustness checks, I confirmthat results are not sensitive to the order of polynomial orthe bandwidth.
To formally test for differences in outcomes measuredat the school level, including enrollment and average dailyattendance, I estimate the reduced-form regression:
O = #xDx + g(V) + $, where x % h # V < x + h, (3)
and apply the same procedures just described. Note that(#x/ıx) is the effect of a 100-calorie increase in meal rationsamong schools induced to participate by a small changein V (assuming that Eqs. (2) and (3) are estimated withthe same sample and polynomial specification of V). Thispaper does not report these estimates because the reduced-form estimates from Eq. (3) are generally not statisticallydistinguishable from zero.
5.2. Internal validity
The causal interpretation of #x rests on the assump-tion that cov(Dx, $) = 0. Presuming that g(V) is correctlyspecified, the condition might be violated if agents canprecisely manipulate values of the assignment variable V,which is calculated using data from an annual First GradeSurvey. For example, highly motivated schools could solicitenrollments from poor students or alter individual surveyresponses to qualify for higher-calorie meals. For severalreasons this is unlikely.
First, schools were unaware in early 2000 of the impend-ing program reassignment in 2001. Second, even armedwith such knowledge, it is unlikely that schools couldprecisely manipulate their program status. Schools wereunaware of the precise assignment cutoffs or the statisti-cal procedure used to aggregate student-level data into thefinal measure of V, both of which change over time (Kainet al., 2002). Schools might raise or lower V through a con-certed effort at manipulation of student survey data, but theprecise value of V relative to an assignment cutoff is noisy.This implies that final assignment resembles the “local”randomized experiment described by Lee (2008) and Leeand Lemieux (2010). Third, JUNAEB itself had little incen-tive to manipulate V, since the index is publicly available inChile and widely scrutinized by schools and researchers.
Nonetheless, I apply two checks of internal validityimplied by the research design. First, I examine the smooth-ness of baseline school variables around the cutoffs, byestimating Eq. (3) with baseline covariates as dependentvariables. Second, I inspect a histogram of V for evidence ofbunching of schools on either side of assignment cutoffs.The absence of bunching does not rule out manipula-tion (since schools could sort in both directions), but itspresence suggests ex ante manipulation of V that couldintroduce imbalance in observed or unobserved back-ground variables around the cutoffs.
5.3. Student-level regressions
I also estimate Eq. (3) with data on student-leveloutcome variables, including first-grade enrollment age,grade repetition, and test scores (the data are describedin Section 6). There is an additional source of bias inthese regressions. Suppose that higher-calorie meals causehigher first-grade enrollments in treated schools, relativeto untreated schools. Student sorting may also change theobserved or unobserved attributes of entering students,which may be correlated with student outcomes such asgrade repetition and test scores. To assess this issue, I usestudent-level background variables from multiple yearsof the First Grade Survey – applied at the beginning ofeach school year – to directly assess whether incomingfirst-grade students differ substantially in their socioeco-nomic status or baseline nutritional status across treatedand untreated schools. I further use these baseline studentvariables as controls in regressions that estimate effects onfourth-grade test scores.
6. Data
6.1. School variables
Table 3 reports descriptive statistics on school-levelvariables in 2000, the baseline year. The same variablesare available in treatment years between 2001 and 2005,except attendance which is available from 2003 to 2005.Unless otherwise noted, all regressions pool observationsacross available treatment years, with standard errors clus-tered at the school level.
Administrative files of the Ministry of Education report:(1) whether the school is private; (2) whether the schoolis rural; (3) whether the school operates a kindergartenor preschool (inferred from positive enrollments in anypreschool grade); and (4) the school’s administrativeregion (from 1 to 13). A separate Ministry of Education fileindicates whether the school participated in Chile’s “FullSchool Day” program in 2000. JUNAEB administrative filesinclude (1) each school’s V in 2000, (2) the meal programin which the school participated in each year, and (3) theproportion of students in each school that were allocated ameal ration in each year.
Ministry of Education files further report school enroll-ment in grade 1 and school enrollments in all primarygrades (1–8). Finally, school-level average daily attendance(first available in 2003) is recorded in subsidy paymentfiles, since publicly funded schools receive monthly pay-ments based on average attendance. There are evidentincentives for schools to inflate attendance. However,school reports are subject to audits, and schools facefines if attendance is inflated. Moreover, it is unlikely thatincentives to over-report differ sharply in the vicinity ofassignment cutoffs.
The first column reports means on the universe of 8727primary schools in Chile, while additional columns reportmeans on subsamples of schools with a valid V in 2000,and thus eligible for formula-based assignment. This paperfocuses on the subsample of schools within 20 points of theassignment cutoff at 68. In comparison to other schools,

Author's personal copy
P.J. McEwan / Economics of Education Review 32 (2013) 122– 139 129
Table 3Summary statistics for primary school variables in 2000.
All primary schools in 2000 Primary schools with a vulnerability index (V) in 2000
All 0 #V < 40 48 #V < 88
Municipal (public) school 0.64 0.74 0.52 0.83Private subsidized school 0.28 0.26 0.47 0.17Private tuition school 0.08 0.00 0.00 0.00Rural school 0.53 0.62 0.03 0.88Full school day in 2000 0.42 0.49 0.06 0.69On-site preschool in 2000 0.12 0.15 0.23 0.09Vulnerability index, 2000 – 57.3 23.8 70.4
(24.1) (10.4) (10.9)D20 – 0.90 0.63 –D68 – 0.42 – 0.60
Meal program0 kcal 0.20 0.07 0.23 0.01250 kcal 0.01 0.01 0.03 0.00700 kcal 0.33 0.38 0.72 0.221000 kcal 0.46 0.54 0.03 0.77
Proportion receiving meals within school 0.59 0.69 0.28 0.86(0.39) (0.33) (0.22) (0.20)
Enrollment, grade 1 32.6 31.5 76.4 11.7(42.2) (41.6) (48.0) (16.3)
Enrollment, grades 1–8 269.9 260.4 626.7 98.2(337.8) (334.3) (368.2) (138.9)
Average daily attendance – 285.9 700.3 103.7(377.5) (427.4) (155.0)
No. of schools 8727 7440 1972 4469
Notes: Standard deviations are in parentheses for non-dichotomous variables. The sample sizes for the proportion receiving meals are, respectively, 8725,7438, 1971, and 4468. The sample sizes for average daily attendance are, respectively, 7118, 1924, and 4309. Average daily attendance is from 2003, thefirst year in which data are available.
note that these schools are substantially more likely tobe public, located in rural areas, and with relatively smallenrollments (an average of 12 first-graders, compared witha sample-wide average of 33).
6.2. Student variables
Table 4 describes student variables extracted from themicro data of JUNAEB’s First Grade Survey in 2000, con-ducted in the first two months of the school year. Thesurveys are also available in treatment years from 2001to 2004. Unless noted otherwise, the student-level regres-sions use a pooled sample of student observations from allavailable treatment years, clustering standard errors at theschool level.
The survey data include (1) years of mother’s schooling,(2) a female indicator, (3) height-for-age Z-scores, and (4)weight-for-height Z-scores.12 Height-for-age is a measureof nutritional deprivation during the first several years oflife, while weight-for-height is a better indicator of recentnutritional deprivation. Because the survey occurs early inthe school year, one cannot expect either anthropometric
12 JUNAEB reports students’ gender, day of birth, height, and weight.Using these variables, I calculated Z-scores with EpiInfo software and theCDC/WHO 1978 reference data, using official guidelines in WHO (1995)to code outliers as missing.
measure, but especially the less malleable height-for-age,to be affected by 0–2 months of the meal program.
I then calculated each student’s first-grade enrollmentage as the days elapsed between birth and March 1 of theirfirst year enrolled in grade 1, divided by 365.25 (also seeMcEwan & Shapiro, 2008). The survey reports each first-grade student’s national identification number. I use thisnumber, along with the 1999–2004 surveys, to infer thefirst academic year that each student enrolled in grade 1.Similarly, I infer that a student repeated first grade if thesame student appeared in a subsequent round of the FirstGrade Survey.
Finally, the Ministry of Education’s SIMCE (Sistema deMedición de la Calidad de la Educación) applies tests tothe population of fourth-grade students in some years. Imatched the 2002 cohort of first-graders to 2005 fourth-grade test scores using national identification numbers.Not all students are present in the 2005 data, primarilybecause of grade repetition. Once matched, I obtained fourtest score variables. First, I derived an indicator of whether2002 first-graders participated in the 2005 fourth-gradeassessment, a proxy of grade repetition by the fourth grade.Second, I derived an indicator of whether fourth-gradetest-takers switched schools between grades 1 and 4. How-ever, in subsequent analyses, I always assigned students totheir original, first-grade school, since switching could havebeen an endogenous response to meal program provision.This preserves the internal validity of the intention-to-treat estimates, although it may attenuate those estimates.

Author's personal copy
130 P.J. McEwan / Economics of Education Review 32 (2013) 122– 139
Table 4Summary statistics for first-grade student variables in 2000.
First-grade students in primary schools with a vulnerability index (V) in 2000
All 0 #V < 40 48 #V < 88
Years of mothers’ schooling 8.56 9.85 6.29(3.32) (2.79) (3.02)[238,450] [144,396] [63,315]
Height-for-age Z-score %0.03 0.12 %0.29(1.08) (1.06) (1.07)[235,916] [142,649] [62,823]
Weight-for-height Z-score 0.71 0.78 0.61(1.39) (1.40) (1.36)[230,647] [141,399] [59,569]
Female student 0.49 0.50 0.48[238,394] [144,349] [63,313]
First-grade enrollment age 6.38 6.27 6.64(0.77) (0.39) (1.26)[224,308] [141,981] [53,669]
Repeated first grade 0.03 0.02 0.05[238,518] [144,433] [63,336]
Notes: Standard deviations are in parentheses for non-dichotomous variables. Sample sizes are in brackets. See text for variable definitions.
Finally, I extracted the original fourth-grade language andmathematics scale scores.
7. Results
7.1. Program assignment
Table 5 empirically confirms that food calories in aschool’s meal ration increase sharply at each assignmentcutoff, but especially at 68. In column 1, the coefficient onD20 indicates a 91 calorie increase, but it is only marginallysignificant. Controlling for background covariates (column2) and applying a local linear specification (column 3)slightly reduce its size and, in the latter case, render it
statistically insignificant. In contrast, the coefficients onD68 are larger (about 170 calories), highly significant, andstable across specifications.
At each cutoff, the coefficients from pooled observationsconceal treatment slippage across school years. If one esti-mates regressions separately by treatment year, the largestcoefficient on D20 reflects an increase of 103 kcal (t = 2.33)in 2001, while the smallest is 30 kcal (t = 0.58) in 2005. Theslippage is less marked around the 68 cutoff, with magni-tudes ranging from 143 kcal in 2005 to 193 kcal in 2001, allhighly significant.
Columns 4–6 next examine whether sharp increases inthe food calories of meals are accompanied by similarlysharp changes in the proportion of students within each
Table 5Meal assignment (pooled school observations, 2001–2005).
Dependent variable:
Hundreds of kcal/day in school meal ration Proportion of students within school allocated meals
(1) (2) (3) (4) (5) (6)
D20 0.914*** 0.796*** 0.739 0.050*** 0.039 0.031(0.467) (0.438) (0.459) (0.029) (0.028) (0.031)
N (schools-by-year) 9697 9697 1526 9660 9660 975Bandwidth 20 20 3 20 20 3Order of polynomial 4 4 1 4 4 1Controls No Yes Yes No Yes Yes
D68 1.648* 1.677* 1.667* %0.020 %0.017 %0.032***
(0.172) (0.159) (0.155) (0.020) (0.019) (0.018)N (schools-by-year) 21,562 21,562 3437 21,202 21,202 3371Bandwidth 20 20 3 20 20 3Order of polynomial 4 4 1 4 4 1Controls No Yes Yes No Yes Yes
Notes: Robust standard errors are in parentheses, adjusted for school-level clustering. Each cell reports the coefficient on Dx from a separate estimate ofEq. (2), controlling for a piecewise polynomial of V. Additional controls include dummy variables indicating years, regions, private schools, rural schools,schools participating in the Full School Day program in 2000, and schools with an on-site preschool in 2000. Samples are defined by cutoff and bandwidth(see text).
* Indicates statistical significance at 1% level.** Indicates statistical significance at 5% level.
*** Indicates statistical significance at 10% level.

Author's personal copy
P.J. McEwan / Economics of Education Review 32 (2013) 122– 139 131
school that are allocated a meal (the official program guide-lines deny this possibility). Fig. 1 did not appear to indicateany appreciable breaks, although the proportion of stu-dents covered is much higher around 68 (nearly 90%) thanaround 20 (about one-fourth). Table 5 confirms that mea-sured differences are generally small, though marginallysignificant in two specifications.
The rest of the paper focuses on the local experimentat 68, given the larger and more precise estimates offood calorie differences in school rations, as well as agreater proportion of students within each school eligi-ble to receive meals (and, hence, higher expected caloriesamong enrolled students). It constitutes the strongest testof whether higher-calorie meals affect student choices andlearning. However, all the estimates subsequently reportedwere replicated at the lower cutoff, without notable differ-ences in the results.
7.2. Internal validity
Fig. 2 and Table 6 assess whether school-level back-ground variables vary discontinuously at 68. A visualexamination of variable means within 1-point bins doesnot show any compelling evidence of discontinuous vari-ation in either private status or rural location. Table 6confirms this empirically for several school backgroundvariables, with small, statistically insignificant point esti-mates in global and local specifications.
Fig. 3 reports a histogram of V within the same 1-pointbins. There is no clear evidence of bunching of observa-tions to the right of left of either assignment threshold,which would be consistent with ex ante manipulation ofV by either schools or JUNAEB. The data are noisy (partly
Table 6Smoothness of school baseline variables (school observations, 2000).
Dependent variable: (1) (2)
Rural schoolD68 %0.013 %0.014
(0.037) (0.036)
Private schoolD68 %0.040 %0.046
(0.049) (0.050)
On-site preschool in 2000D68 %0.016 0.002
(0.039) (0.039)
Full School Day in 2000D68 %0.015 %0.001
(0.062) (0.063)
N (schools) 4469 711Bandwidth 20 3Order of polynomial 4 1
Notes: Robust standard errors are in parentheses. Each cell reports thecoefficient on D68 from a separate estimate of Eq. (3), controlling for apiecewise polynomial of V (the order is specified in final row). Samplesare defined by bandwidth (see text).* Indicates statistical significance at 1% level.** Indicates statistical significance at 5% level.*** Indicates statistical significance at 10% level.
owing to the relative undersmoothing of 1 point bins), butno more so around the cutoff than at other parts of thedistribution of V.
Beyond assessing internal validity, Fig. 2 clarifies thesubpopulation of Chilean schools to which results can begeneralized. Around the cutoff at 68, schools are over-whelmingly rural and public. At 20, the opposite is true:schools are mainly urban and about half are private. There
Fig. 2. Baseline school variables in 2000.

Author's personal copy
132 P.J. McEwan / Economics of Education Review 32 (2013) 122– 139
Fig. 3. Histogram of vulnerability index (V) in 2000.
are two implications. First, Chilean schools and studentsaround 68 more closely resemble the target population ofschool feeding programs in poorer settings of Latin Amer-ica.
Second, rural schools in Chile operate in less competitivelocal schooling markets (McEwan et al., 2008), with feweropportunities for meal rations to induce “poaching” of stu-dents from schools with less generous meals (He, 2009). Asa simple confirmation of this point, I obtained the latitudeand longitude of 424 schools in Chile’s sixth region, a mostlyagricultural zone located to the south of Santiago (McEwanet al., 2008). Among schools near the assignment cutoffat 68, the closest school of any type is about 3 km away,on average, and the closest private school is about 15 kmaway, on average. Both distances are larger than compara-ble means – less than a kilometer – for the predominantlyurban schools near the cutoff of 20.
7.3. School enrollment and attendance
Fig. 4 and Table 7 report discontinuity estimates forenrollment in grade 1, total primary enrollments in grades1–8, and average daily attendance recorded at the schoollevel. Fig. 4 reveals a negative gradient between enrollmentmeasures and V, highlighting the pitfalls of naïve compar-isons of school enrollments by meal ration. There is no clearevidence of sharp changes in the same measures around68. In column 3, the estimated coefficients of %0.7, 4.2,and 5.0 are small relative to sample means of the threedependent variables (12, 98, and 104, respectively).13 Still,a note of caution is warranted since estimates are rela-tively imprecise. Again looking at column 3, the right endsof each coefficient’s 95% confidence intervals are 1.6, 17.5and 21.7, respectively, which would constitute increases ofbetween 13% and 21%. Thus, we cannot rule out modestpositive (or negative) effects in these specifications. This is
13 The available attendance variable includes average daily attendancein all grades offered at a school (not just 1–8). Hence, it is possible for thevariable to exceed official enrollment in grades 1–8.
counter-balanced by a later robustness check that incorpo-rates baseline data from 2000 (see below). It finds similarlysmall coefficients for enrollment, but with much smallerstandard errors.
Zero or very small effects on enrollment would be notbe unexpected. Even in rural areas, primary enrollment isuniversal, especially in early grades. Further, there is lessscope for inter-school sorting and “poaching” because ruralschools are dispersed and less likely to be private. The find-ings on attendance are more surprising, especially sinceattendance effects are among the most robust findings ofexperiments in other countries. However, it is plausiblethat the meal itself provides the largest incentive to attend,rather than simply increasing its calories, as occurs near thecutoff at 68. Even if families are not indifferent to the highercaloric content of some meals, it is plausible that familiescannot easily distinguish between the two types of mealsrations, 700 kcal and 1000 kcal. It also bears emphasis thatChile’s attendance-based finance rules provide financialincentives for administrators to encourage student atten-dance, independently of meal provision.
7.4. Student sorting on observed variables
Suppose that higher-calorie meals did have modesteffects on new school enrollments. It seems unlikelythat the mean attributes of newly enrolled first-graderswould remain unchanged. Parents of malnourished chil-dren may be more likely to take advantage of higher-caloriemeals; conversely, more educated parents may confrontfewer economic or informational constraints to choosinga school with higher-calorie meals. To assess whether sor-ting occurs, I successively estimate Eq. (3) with four studentvariables from the First Grade Survey, collected in the firsttwo months of the school year. Mother’s schooling and gen-der are time-invariant, but two anthropometric measuresof nutrition are less so. The height-for-age Z-score reflectsmalnutrition in early childhood, and is unlikely show evi-dence of “catch-up” in 1–2 months of PAE treatment in thefirst grade. Thus, it is a reasonable measure of nutritionalstatus of incoming students. Weight-for-height Z-scores

Author's personal copy
P.J. McEwan / Economics of Education Review 32 (2013) 122– 139 133
Fig. 4. School enrollment and attendance (pooled school observations in 2001–2005).
may respond more quickly to calories consumed, but it isstill unlikely that less than 40 days of moderately increasedcaloric intake could produce notable gains.
Before proceeding, it is helpful to note that Chile’s inci-dence of malnutrition is among the lowest in Latin America,and has been since at least 1980s (Musgrove, 1993). Thisis reflected in the nutritional indicators of children evenbefore they are potentially exposed to PAE in primaryschools. Using this paper’s student sample from 2001, only
3.3% of incoming first-graders are stunted (height-for-ageZ-score < %2) and 2.4% are wasted (weight-for-height Z-score < %2). On the other hand, 16.7% of the sample is obese,given weight-for-height Z-scores > 2. Indeed, the publichealth debate in Chile, as in the U.S., focuses on childhoodobesity and its likely determinants (Kain et al., 2005, 2007;Uauy & Kain, 2002).
To visually assess whether there are discontinuities, Ipooled first-grade observations between 2001 and 2004.
Table 7Reduced-form regressions for enrollment and attendance (pooled school observations, 2001–2005).
Dependent variable (1) (2) (3)
Enrollment in grade 1D68 0.531 0.221 %0.736
(1.719) (1.324) (1.200)N (schools-by-year) 21,562 21,562 3437
Enrollment in grades 1–8D68 6.080 3.408 %4.193
(15.701) (11.838) (11.066)N (schools-by-year) 21,562 21,562 3437
Average daily attendanceD68 11.723 9.584 %4.990
(19.206) (14.490) (13.597)N (schools-by-year) 12,714 12,714 2024
Bandwidth 20 20 3Order of polynomial 4 4 1Controls No Yes Yes
Notes: Robust standard errors are in parentheses, adjusted for school-level clustering. Each cell reports the coefficient on D68 from a separate estimate ofEq. (3), controlling for a piecewise polynomial of V. School-level controls are in the note to Table 5. Samples are defined by bandwidth (see text). The samplefor average daily attendance only includes pooled school observations from 2003 to 2005.* Indicates statistical significance at 1% level.** Indicates statistical significance at 5% level.*** Indicates statistical significance at 10% level.

Author's personal copy
134 P.J. McEwan / Economics of Education Review 32 (2013) 122– 139
Table 8Reduced-form regressions for student variables (pooled first-grade student observations, 2001–2004).
Dependent variable (1) (2) (3)
Years of mothers’ schoolingD68 0.028 0.135 0.028
(0.295) (0.244) (0.232)N (students-by-year) 192,050 192,050 26,646
Height-for-age Z-scoreD68 0.082 0.071 0.052
(0.062) (0.059) (0.057)N (students-by-year) 190,193 190,193 26,379
Weight-for-height Z-scoreD68 %0.041 %0.004 0.077
(0.110) (0.097) (0.088)N (students-by-year) 188,002 188,002 26,113
FemaleD68 0.008 0.008 0.003
(0.016) (0.016) (0.015)N (students-by-year) 192,060 192,060 26,647
First-grade enrollment ageD68 0.027 0.038 0.039
(0.024) (0.024) (0.022)N (students-by-year) 191,233 191,233 26,522Repeated first gradeD68 %0.008 %0.004 %0.010
(0.013) (0.013) (0.012)N (students-by-year) 146,762 146,762 20,265
Bandwidth 20 20 3Order of polynomial 4 4 1Controls No Yes Yes
Notes: Robust standard errors are in parentheses, adjusted for school-level clustering. Cells report the coefficient on D68 from a separate estimate of Eq.(3), controlling for a piecewise polynomial of V. School-level controls are in the note to Table 5. Controls for first-grade enrollment age and repeated firstgrade regressions further include quadratics in both Z-scores, dummy variables indicating years of mother’s schooling and female, and dummy variablesindicating missing values of these variables. Samples are defined by bandwidth (see text). The sample for repeated first grade only includes observationsfrom 2001 to 2003.* Indicates statistical significance at 1% level.** Indicates statistical significance at 5% level.*** Indicates statistical significance at 10% level.
The figures – omitted for brevity – provided no evidenceof discontinuous variation, although they confirmed thatmean height-for-age Z-scores are not far below zero, evenin predominantly rural and public schools, and that meanweight-for-height Z-scores are substantially above zero,consistent with high rates of childhood obesity cited above.The empirical specifications in Table 8 confirm that coeffi-cient magnitudes are close to zero.
7.5. Enrollment age and first-grade repetition
The final rows of Table 8 assess whether there arediscontinuities in first-graders’ enrollment age or the prob-ability of repeating grade 1. One might predict that higher-calorie meals are an inducement to enroll children on time.However, the majority of first-graders in Chile alreadyenroll on time, similar to the U.S. or Argentina (McEwan& Shapiro, 2008). Indeed, there is a nearly flat relationshipbetween the enrollment age of first-graders and V, withno evidence of a discontinuity (the figure is omitted forbrevity).14 Table 8 confirms that the coefficients are close
14 Evidence from other countries usually shows a positive gradi-ent between poverty and enrollment age. As one explanation for this
to zero. The overall first-grade repetition rate is lower inChile (about 3%) than in most Latin American countries,though it is just over 5% when V = 68. Table 8 reports a dis-continuity of just %0.008 in the base specification. None ofthe coefficients are statistically distinguishable from zero.
7.6. Test score outcomes
Despite Chile’s success over many decades in raising pri-mary school enrollment and attendance, the performanceof Chilean students on international learning assessmentshas been low and stagnant over time, even compared tolower-income neighbors (McEwan et al., 2008). There isconsiderable interest, therefore, in evaluating the impactof education programs on student achievement.
Fig. 5 and Table 9 presents results from the analysis offour test score outcomes among the 2002 cohort of first-graders. Of the 2002 cohort of first-graders, 78% took thefourth-grade tests in 2005. There are three reasons whythe match rate is not 100%. First, SIMCE coverage is almost
correlation, Glewwe and Jacoby (1995) posit that families of malnour-ished children – gauged by low height-for-age – may delay enrollment asa rational investment in their child’s readiness for primary schooling.

Author's personal copy
P.J. McEwan / Economics of Education Review 32 (2013) 122– 139 135
Fig. 5. Students’ fourth-grade test score outcomes in 2005.
universal, but still may exclude some rural students inisolated schools. Second, there are matching errors, givenmisreported national identification numbers. In neithercase should we expect that test-taking probabilities varysharply around the assignment cutoffs. Third, students may
not have taken the fourth-grade test on time because theyrepeated one or more grades.
The upper-left panel of Fig. 5 and the estimatesin Table 9 show small and statistically insignificanteffects on the probability of taking a fourth-grade test, a
Table 9Reduced-form regressions for student test score variables (first-grade cohort, 2002).
Dependent variable: (1) (2) (3)
Took a grade 4 test in 2005D68 0.007 %0.003 0.030
(0.037) (0.036) (0.035)N (students) 49,341 49,341 6967
Switched schools by grade 4 in 2005D68 %0.042 %0.046 %0.041
(0.046) (0.044) (0.047)N (students) 34,491 34,491 4812
Grade 4 language score in 2005D68 %3.714 %3.734 %5.355
(4.369) (4.519) (3.824)N (students) 34,237 34,237 4785
Grade 4 math score in 2005D68 %3.400 %3.049 %6.777
(5.190) (5.339) (4.698)N (students) 34,162 34,162 4767
Bandwidth 20 20 3Order of polynomial 4 4 1Controls No Yes Yes
Notes: Robust standard errors are in parentheses, adjusted for school-level clustering. Each cell reports the coefficient on D68 from a separate estimate of Eq.(3), controlling for a piecewise polynomial of V. School-level controls are in the note to Table 5. Student-level controls include quadratics in both Z-scores,dummy variables indicating years of mother’s schooling and female, and dummy variables indicating missing values of student-level variables. Samplesare defined by bandwidth (see text). The means (standard deviations) of each dependent variable are 0.70, 0.26, 242 (50), and 232 (52), respectively.* Indicates statistical significance at 1% level.** Indicates statistical significance at 5% level.*** Indicates statistical significance at 10% level.

Author's personal copy136
P.J.
McEw
an
/
Economics
of
Education
Review
32 (2013) 122– 139
Table 10Robustness and heterogeneity.
Dependent variable (1) (2) (3) (4) (5) (6) (7) (8) (9) (10) (11) (12) (13) (14)Panel A: School variablesHundreds of kcal/day in ration 1.797* 1.677* 1.744* 1.822* 1.667* 1.651* %0.152 1.863* – – – – – –
(0.183) (0.159) (0.127) (0.126) (0.155) (0.259) (0.186) (0.104)Proportion within schoolallocated meal
%0.007 %0.017 %0.024 %0.006 %0.032*** %0.050*** %0.042*** %0.021** – – – – – –(0.021) (0.019) (0.016) (0.015) (0.018) (0.030) (0.022) (0.010)
Enrollment in grade 1 0.108 0.221 0.165 0.009 %0.736 1.071 %0.969 0.211 – – – – – –(1.449) (1.324) (1.040) (0.955) (1.200) (2.298) (1.299) (0.347)
Enrollment in grades 1–8 1.590 3.408 3.339 1.856 %4.193 11.507 %5.816 1.142 – – – – – –(12.93) (11.84) (9.33) (8.70) (11.07) (20.41) (11.36) (1.97)
Average daily attendance 7.870 9.584 6.424 5.296 %4.990 13.882 – – – – – – – –(15.86) (14.49) (11.41) (10.71) (13.60) (25.13)
Panel B: Student variablesYears of mother’s schooling 0.152 0.135 0.045 0.047 0.028 0.106 %0.123 0.210 – – – – – –
(0.270) (0.244) (0.194) (0.183) (0.232) (0.399) (0.233) (0.127)Height-for-age Z-score 0.053 0.071 0.061 0.094** 0.052 %0.003 %0.096 0.069 – – – – – –
(0.065) (0.059) (0.047) (0.047) (0.057) (0.088) (0.071) (0.050)Weight-for-height Z-score %0.021 %0.004 0.107 0.009 0.077 0.020 0.090 0.075 – – – – – –
(0.105) (0.097) (0.072) (0.068) (0.088) (0.125) (0.116) (0.070)Female 0.011 0.008 0.008 0.008 0.003 %0.024 0.001 0.009 – – – – – –
(0.016) (0.016) (0.014) (0.013) (0.015) (0.028) (0.024) (0.013)First-grade enrollment age 0.059** 0.038 0.025 0.028 0.039 0.085** %0.073 %0.140 0.056** 0.018 0.072* 0.009 0.048 0.004
(0.028) (0.024) (0.019) (0.017) (0.022) (0.039) (0.117) (0.080) (0.024) (0.025) (0.026) (0.021) (0.024) (0.022)Repeated first grade %0.021 %0.004 %0.002 %0.010 %0.010 0.023 0.009 0.006 %0.016 %0.003 %0.007 %0.014 %0.014 0.004
(0.017) (0.013) (0.010) (0.010) (0.012) (0.022) (0.021) (0.012) (0.014) (0.013) (0.014) (0.015) (0.013) (0.015)Took 4th grade test in 2005 0.005 %0.003 %0.007 %0.001 0.030 %0.036 – – 0.016 0.041 0.021 0.046 0.050 %0.029
(0.042) (0.036) (0.028) (0.028) (0.035) (0.063) (0.041) (0.041) (0.042) (0.042) (0.037) (0.054)Switched schools by 2005 %0.013 %0.046 %0.010 %0.011 %0.041 %0.091 – – %0.054 %0.032 %0.061 %0.025 %0.033 %0.077
(0.051) (0.044) (0.036) (0.037) (0.047) (0.071) (0.052) (0.056) (0.050) (0.061) (0.047) (0.079)Grade 4 language score %6.351 %3.734 %5.133 %3.276 %5.355 %14.30** – – %5.180 %5.282 %6.767 %3.633 %6.869 0.041
(5.003) (4.519) (3.164) (3.095) (3.824) (7.228) (4.599) (5.069) (4.488) (5.452) (4.011) (6.088)Grade 4 math score %8.402 %3.049 %3.188 %2.721 %6.777 %18.948 – – %5.075 %8.692 %5.802 %8.582 %8.046 %0.862
(6.157) (5.339) (3.818) (3.704) (4.698) (9.675) (5.811) (5.782) (5.376) (6.070) (5.065) (6.548)
Bandwidth 20 20 20 5 3 1 3 3 3 3 3 3 3 3Order of polynomial 5 4 3 1 1 1 1 1 1 1 1 1 1 1Sample/method 2000 sample “Diff-in-disc” Male Female Low HFA High HFA Low m.s. High m.s.
Notes: Robust standard errors are in parentheses, adjusted for school-level clustering. Each cell reports the coefficient on D68 from a separate estimate of Eq. (3), controlling for a piecewise polynomial of V.Regressions include school and student controls listed in the notes to Tables 5 and 9.
* Indicates statistical significance at 1% level.** Indicates statistical significance at 5% level.
*** Indicates statistical significance at 10% level.

Author's personal copy
P.J. McEwan / Economics of Education Review 32 (2013) 122– 139 137
grade repetition proxy. I next examine whether, amongtest-takers, there is a discontinuity in the probability ofswitching schools between first and fourth grades, perhapsin response to different meal rations. Overall, about 26% ofstudents who took the test switched schools between first-and fourth-graders (although student observations arealways matched to their first-grade schools). There is noevidence in the figure or table that switching probabilitiesare affected by exogenous exposure to higher-caloriemeals.
Finally, in the analysis of language and mathematicsscores in fourth grade, I assign students to their originalfirst-grade schools. In Fig. 5, the test-score discontinuitiesare slightly negative. In the final rows of Table 9, the pointestimates are consistently negative, even after controllingin columns 2 and 3 for a wide range of baseline variables(see the table note). Given a standard deviation of 50 onboth tests, the negative coefficients are not more than10% of a standard deviation. The right ends of 95% confi-dence intervals, though positive, are only about 4–5% of astandard deviation, suggesting little scope for noteworthyeffects on test scores.
7.7. Robustness and heterogeneity
Table 10 reports the results of several robustness checks,applied to all school and student dependent variables. Eachcell reports the coefficient on D68 from a separate regres-sion. Each regression uses the largest available sample ofpooled school or student observations and includes con-trols for school and student variables (the samples andcontrols are described in earlier tables). First, columns 1–3report regressions that control for 5th, 4th, and 3rd orderpolynomials of V, respectively, using the largest bandwidth.The results with higher- and lower-order polynomials arenot substantially different from the paper’s main results.Second, columns 4, 5, and 6 report local linear results insamples defined by bandwidths of 5, 3, and 1, respec-tively. Estimates from the smallest bandwidth yield largerenrollment effects, but these and other coefficients are sub-stantially less precise. The coefficients on test scores are notpositive in any specification.
Third, column 7 reports a falsification test for depend-ent variables measured in 2000, the pre-treatment baselineyear in which V was measured. The first row confirms theanticipated result that there is no jump in the calories ofmeal rations at 68. Also as expected, there are no “effects”on 2000 values of dependent variables in the vicinityof 68.
Fourth, column 8 pursues an extension of the falsifi-cation check, by pooling observations from 2000, whenavailable, with observations from available treatment years(as described in the corresponding table for each depend-ent variable). In addition to other controls, described inprior tables, the regressions include year fixed effects, thedummy variable D68, and an interaction between D68 anda dummy indicating school years after 2000. The inter-action term measures the “difference-in-discontinuities”between the pre-assignment year, and all post-assignmentyears. The results do not overturn the basic conclusionsfrom the prior estimates. However, in the case of both
enrollment outcomes, the estimates are considerably moreprecise.
Fifth, columns 9–14 report estimates for student-leveloutcomes within subsamples defined by gender, above-median and below-median height-for-age, and above-median and below-median years of mother’s schooling.The results counter-intuitively suggest positive effects onenrollment age among boys and relatively shorter children,although the coefficients are still quite small relative to thesample standard deviation. All coefficients on test scoresare still slightly negative and statistically insignificant.
8. Conclusions
School feeding programs are popular with parents, edu-cators, and politicians, but there is insufficient evidenceon whether they affect education outcomes, especially formature, government-run programs in developed countries.Belot and James (2011) report evidence that improving thequality of schools meals in a London borough improved testscores and reduced absences. A small number of random-ized experiments, primarily conducted in very poor Africansettings, find some effects on student attendance, fewer onenrollments, and anywhere from zero to small effects onmeasures of cognitive ability and achievement outcomes.
This paper applies a regression-discontinuity design toevaluate Chile’s large-scale plan that awards meal rationswith varying caloric content to schools, depending on theirmeasured “vulnerability.” The paper focuses on a subsetof public and rural schools on the margin of receiving1000 kcal/day rations instead of 700 kcal. I verify that thefood calories of rations do, in fact, rise sharply in the vicin-ity of the assignment threshold, by about 170 food calories.I then compare school and student outcomes on a widevariety of measures, with global polynomial and local lin-ear specifications. The outcomes include school enrollmentand attendance, students’ first-grade enrollment age andgrade repetition, and fourth-grade test score outcomesincluding national mathematics and language tests. Over-all, the results show no effects of higher-calorie meals oneducation outcomes.
To explain the absence of effects, especially on learning,it would be useful to know the program’s actual impact onnutrients and calories consumed and, eventually, on nutri-tion and health. Given data constraints, I have no evidenceon whether added school meal calories are reallocated fromchildren within households. However, the best recent evi-dence from other countries suggests that at least half ofmeal calories and nutrients end up “sticking” to child recip-ients (Afridi, 2010; Islam & Hoddinott, 2009; Jacoby, 2002).
Presuming that children consume additional caloriesand nutrients in treated schools, it is still plausible thatlearning does not increase. Baseline levels of primaryenrollment are already high in Chile; most first-gradersenroll on time and early grade repetition is relatively low. Inthis setting, another mechanism for learning increases overearly primary grades is through improved nutrition. How-ever, extreme forms of child malnutrition (such as stuntingor wasting) have largely been eliminated among Chileanchildren, perhaps due to an extensive program of earlychildhood take-home rations or simply declining poverty

Author's personal copy
138 P.J. McEwan / Economics of Education Review 32 (2013) 122– 139
over the last two decades (Uauy & Kain, 2002). Indeed, Chilenow confronts rates of childhood obesity that exceed 15%among incoming first-grade students, much like the U.S.In this context, it is plausible that additional food calo-ries exacerbate these challenges among a population ofrelatively poorer, but not necessarily malnourished, chil-dren. The latter hypothesis cannot be fully explored in thispresent paper.
While perhaps not surprising, the paper’s results oneducation outcomes should be viewed in the larger con-text of Chilean development. JUNAEB has provided schoolfeeding programs since the mid-1960s, when Chile’s realper capita income was roughly one-third as large as itwas during the period of the evaluation. It is possible,and consistent with emerging African results, that earlierversions of the program were more effective in raisingeducation outcomes when Chile had higher poverty rates,higher rates of malnutrition, and lower school enrollments.Thus, the results provide a cautionary tale for countrieswith rapidly growing incomes. An early focus on caloriccontent of meals may have outlived its policy usefulness,especially as a means of drawing children into the schoolsetting. To better focus on learning outcomes, and per-haps address the emerging challenges of childhood obesity,school feeding programs could instead focus on improv-ing the nutritional content of meals (Belot & James, 2011;Schanzenbach, 2009).
Acknowledgements
I am grateful to Kristin Butcher, Adrienne Lucas, MariaPerez, Joseph Shapiro, and seminar participants at Brown,the Inter-American Development Bank, and the Universityof Connecticut for their comments. JUNAEB and the Min-istry of Education of Chile generously provided data, andthe Spencer Foundation provided financial support. Theseindividuals and organizations are not responsible for thefindings or interpretations of this paper.
References
Adelman, S., Alderman, H., Gilligan, D. O., & Lehrer, K. (2008). Theimpact of alternative food for education programs on learning achieve-ment and cognitive development in Northern Uganda. Unpublishedmanuscript, University of Maryland, World Bank, International FoodPolicy Research Institute, and University of British Columbia.
Adelman, S. W., Gilligan, D. O., & Lehrer, K. (2008). How effective arefood for education programs? A critical assessment of the evidencefrom developing countries. In Food policy review #9. Washington, DC:International Food Policy Research Institute.
Afridi, F. (2010). Child welfare programs and child nutrition: Evidencefrom a mandated school meal program in India. Journal of DevelopmentEconomics, 92(2), 152–165.
Afridi, F. (2011). The impact of school meals on school participation:Evidence from rural India. Journal of Development Studies, 47(11),1636–1656.
Alderman, H, Gilligan, D. O., & Lehrer, K. (2008). The impact of alterna-tive food for education programs on school participation and educationattainment in Northern Uganda. Unpublished manuscript, World Bank,International Food Policy Research Institute, and University of BritishColumbia.
Belot, M., & James, J. (2011). Healthy school meals and educational out-comes. Journal of Health Economics, 30, 489–504.
Bhattacharya, J., Currie, J., & Haider, S. J. (2006). Breakfast of champions?The School Breakfast Program and the nutrition of children and fam-ilies. Journal of Human Resources, 41(3), 445–466.
Bundy, D., Burbano, C., Grosh, M., Gelli, A., Jukes, M., & Drake, L. (2009).Rethinking school feeding: Social safety nets, child development and theeducation sector. Washington, DC: World Food Programme and theWorld Bank.
Catalán, J., Epstein, R., Guajardo, M., Yung, D., Henríquez, L., Martínez, C.,et al. (2009 April). No such thing as a free lunch? OR/MS Today, 32–35.
Cox, C. (2004). Innovation and reform to improve the quality of primary edu-cation: Chile. Paper prepared for the 2005 Education for All GlobalMonitoring Report.
Currie, J. (2003). U.S food and nutrition programs. In R. A. Moffitt (Ed.),Means-tested transfer programs in the United States (pp. 199–289).Chicago: University of Chicago Press.
Epstein, R., Henríquez, L., Catalán, J., Weintraub, G. Y., & Martínez, C. (2002).A combinational auction improves school meals in Chile. Interfaces,32(6), 1–14.
Figlio, D. N., & Winicki, J. (2005). Food for thought? The effects of schoolaccountability plans on school nutrition. Journal of Public Economics,89(2–3), 381–394.
Glewwe, P. (2005). The impact of child health and nutrition oneducation in developing countries: Theory, econometric issues,and recent empirical evidence. Food and Nutrition Bulletin, 26(2),S235–S250.
Glewwe, P., & Jacoby, H. G. (1995). An economic analysis of delayedprimary enrollment in a low income country: The role of earlychildhood nutrition. Review of Economics and Statistics, 77(1),156–169.
He, F. (2009). School feeding programs and enrollment: Evidence from SriLanka. Unpublished manuscript, Columbia University.
Hinrichs, P. (2010). The effects of the National School Lunch Program oneducation and health. Journal of Policy Analysis and Management, 29(3),479–505.
Islam, M., & Hoddinott, J. (2009). Evidence of intrahousehold flypapereffects from a nutrition intervention in rural Guatemala. EconomicDevelopment and Cultural Change, 57(2), 215–238.
Jacoby, H. G. (2002). Is there an intrahousehold ‘flypaper effect’? Evidencefrom a school feeding programme. Economic Journal, 112, 196–221.
Jacoby, E., Cueto, S., & Pollitt, E. (1996). Benefits of a school breakfast pro-gramme among Andean children in Huaraz, Peru. Food and NutritionBulletin, 17(1), 54–64.
Junta Nacional de Auxilio Escolar y Becas (JUNAEB). (2000). Balance degestión integral, ano 2000 Junta Nacional de Auxilio Escolar y Becas. San-tiago: Gobierno de Chile, Ministerio de Educación, Junta Nacional deAuxilio Escolar y Becas.
Junta Nacional de Auxilio Escolar y Becas (JUNAEB). (2005). Guia de aten-ción al usuario 2005–2006. Santiago: JUNAEB.
Kain, B. J., Lera, M. L., Rojas, P. J., & Uauy, D. R. (2007). Obesidad en preesco-lares de la región metropolitana de Chile. Revista Médica de Chile, 135,63–70.
Kain, J., & Uauy, R. (2001). Targeting strategies used by the Chilean NationalSupplementary Feeding Programme. Nutrition Research, 21, 677–688.
Kain, J., Uauy, R., Lera, L., Taibo, M., & Albala, C. (2005). Trends in heightand BMI of 6-year-old children during the nutrition transition in Chile.Obesity Research, 13(12), 2178–2186.
Kain, J., Uauy, R., & Taibo, M. (2002). Chile’s school feeding programme:Targeting experience. Nutrition Research, 22, 599–608.
Kazianga, H., de Walque, D., & Alderman, H. (2009). Educational and healthimpacts of two school feeding schemes: Evidence from a randomized trialin rural Burkina Faso. Policy Research Working Paper 4976. Washing-ton, DC: World Bank.
Lee, D. S. (2008). Randomized experiments from non-random selection inU.S. House elections. Journal of Econometrics, 142(2), 675–697.
Lee, D. S., & Lemieux, T. (2010). Regression discontinuity designs in eco-nomics. Journal of Economic Literature, 48(2), 281–355.
McEwan, P. J. (2008). Can schools reduce the indigenous test scoregap? Evidence from Chile. Journal of Development Studies, 44(10),1506–1530.
McEwan, P. J., & Shapiro, J. S. (2008). The benefits of delayed primary schoolenrollment: Discontinuity estimates using exact birth dates. Journal ofHuman Resources, 43(1), 1–29.
McEwan, P. J., Urquiola, M., & Vegas, E. (2008). School choice, stratifi-cation, and information on school performance: Lessons from Chile.Economía, 8(2), 1–27.
Musgrove, P. (1993). Feeding Latin America’s children. World BankResearch Observer, 8(1), 23–45.
Pollitt, E., Cueto, S., & Jacoby, E. R. (1998). Fasting and cognition in well-and undernourished schoolchildren: A review of three experimentalstudies. American Journal of Clinical Nutrition, 67, 779S–784S.
Powell, C. A., Walker, S. P., Chang, S. M., & Grantham-McGregor, S. M.(1998). Nutrition and education: A randomized trial of the effects of

Author's personal copy
P.J. McEwan / Economics of Education Review 32 (2013) 122– 139 139
breakfast in rural primary school children. American Journal of ClinicalNutrition, 68, 873–879.
Schanzenbach, D. W. (2009). Do school lunches contribute to childhoodobesity? Journal of Human Resources, 44(3), 684–709.
Uauy, R., & Kain, J. (2002). The epidemiological transition: Need to incor-porate obesity prevention into nutrition programmes. Public HealthNutrition, 5(1A), 223–229.
U.S. Department of Agriculture, & U.S. Department of Health and HumanServices. (2010). Dietary guidelines for Americans (7th ed.). Washing-ton, DC: U.S. Government Printing Office.
Vermeersch, C., & Kremer, M. (2005). School meals, educational achieve-ment and school competition. Policy Research Working Paper 3523.Washington, DC: World Bank.
Vial, I., Muchnik, E., & Kain, J. (1991). The evolution of Chile’s main nutritionintervention programmes. Food and Nutrition Bulletin, 13(3)
Whaley, S. E., Sigman, M., Neumann, C., Bwibo, N., Guthrie, D., Weiss,R. E., et al. (2003). The impact of dietary intervention on the cogni-tive development of Kenyan school children. Journal of Nutrition, 133,3965S–3971S.
World Food Programme (WFP). (2008). 2008 figures on WFP School FeedingProgrammes. WFP.
World Health Organization (WHO) (1995). Physical status: The use andinterpretation of anthropometry. Report of a WHO Expert Committee,WHO Technical Report Series.