author's personal copy - utoledo engineeringaazad/pdf/lsgl-paper.pdf · author's personal...
TRANSCRIPT

This article was published in an Elsevier journal. The attached copyis furnished to the author for non-commercial research and
education use, including for instruction at the author’s institution,sharing with colleagues and providing to institution administration.
Other uses, including reproduction and distribution, or selling orlicensing copies, or posting to personal, institutional or third party
websites are prohibited.
In most cases authors are permitted to post their version of thearticle (e.g. in Word or Tex form) to their personal website orinstitutional repository. Authors requiring further information
regarding Elsevier’s archiving and manuscript policies areencouraged to visit:
http://www.elsevier.com/copyright

Author's personal copy
Conductivity of strontium- and lithium-doped-lanthanum orthogallate(La0.9Sr0.1Ga1−yLiyO3−δ; y=0.05 and 0.10) synthesized via
metal nitrate–glycine gel route
Abdul-Majeed Azad ⁎, Muralidharan Ramachandran, Neil Schweitzer 1
Department of Chemical Engineering, 3052 Nitschke Hall, The University of Toledo, 2801 W. Bancroft St., Toledo, OH 43606-3390, USA
Received 11 April 2007; received in revised form 24 August 2007; accepted 27 August 2007
Abstract
Strontium- and magnesium-doped-lanthanum orthogallate have emerged as promising alternative solid electrolytes for solid-oxide fuel cells inthe intermediate-temperature regime. In accordance with the theoretical consideration, doping by a monovalent ion at the B-site is envisaged toincrease the defect concentration and enhance the oxide ion conductivity. With this aim, strontium- and lithium-doped-lanthanum orthogallateformulations (La0.9Sr0.1Ga1−yLiyO3−δ; y=0.05 and 0.10) were synthesized via soft-chemistry route of metal nitrate–glycine combustion.Systematic phase and microstructural evolution as a function of processing temperature was followed by X-ray diffraction and scanning electronmicroscopy of the calcined and sintered samples. Electrical characterization on the sintered sample by the 4-point DC and AC impedancemeasurements in the temperature range of 550–850 °C showed that Li-doping at B-site in LaGaO3 yielded conductivity higher than that of yttria-stabilized zirconia, but somewhat inferior to the Mg-doped analogs.© 2007 Published by Elsevier B.V.
Keywords: Doped-lanthanum orthogallate; Solid-oxide fuel cells; Soft-chemistry synthesis; X-ray diffraction; Electron microscopy; Electrical conductivity
1. Introduction
Among several material-related problems encountered bypresent days' high temperature (1000 °C) yttria-stabilizedzirconia (YSZ) electrolyte-based SOFCs, the interaction andpronounced thermal expansion mismatch among cell compo-nents are the most significant [1–5]. An effective way ofdiminishing the impact of these mitigating factors is to lower theoperating temperature to about 800 °C. This calls for thedevelopment of new material formulations. It is well known thatthe solid solution range of a perovskite structure could beextended greatly by balancing the oxygen vacanciescorresponding to ionic substitution at the A- and the B-site
[6]. It was proposed that a predominant and exclusive oxide ionconductor could be realized by doping LaGaO3 with Mg-ions atthe Ga-site [7], thereby providing an alternative oxygen ionmembrane for solid-oxide fuel cell (SOFC) application. Basedon this it has been shown that LaGaO3 doped with Sr for La (A-site) and Mg for Ga (B-site) exhibits high and exclusive oxideion conductivity, and studies published during the past decade,have shown that doped-LaGaO3 is indeed a viable alternative tothe high temperature yttria-stabilized zirconia (YSZ) electrolytein the intermediate-temperature ceramic solid-oxide fuel cells(IT-SOFCs) [8–20]. The rare-earth orthogallates (RGaO3,R=La to Lu) are known to crystallize in perovskite structuresthat are either cubic or orthorhombic (pseudocubic). These havebeen grown as single crystals and their structural aspects studiedin detail for almost half a century [21–26]. The conductivity offormulations partially doped with Mg2+ ions at the B-site andwith Sr2+ ions at the A-site were found to be better orcomparable to that exhibited by YSZ. Other compositionswherein the B-site cation (Ga3+) is partially substituted by Ni2+
or Zn2+ and Fe3+ or Cr3+ have also been synthesized and
Available online at www.sciencedirect.com
Solid State Ionics 178 (2007) 1476–1486www.elsevier.com/locate/ssi
⁎ Corresponding author. Tel.: +1 419 530 8103.E-mail address: [email protected] (A.-M. Azad).
1 Current address: Department of Chemical Engineering, 3230 H.H. DowBldg., The University of Michigan, 2300 Hayward St., Ann Arbor, MI 48109-2136, USA.
0167-2738/$ - see front matter © 2007 Published by Elsevier B.V.doi:10.1016/j.ssi.2007.08.007

Author's personal copy
their microstructural and electrical characterization carriedout [27–35]. Advancing the state-of-the-art, composite anode(Ni-LSGX) and cathode (LSM-LSGX) formulations, where Xis an aliovalent cation of ionic size comparable to that ofGa3+, have been fabricated and tested in button fuel cellformats [36–39].
It has been observed that the synthesis of doped-LaGaO3
invariably leads to the formation of La4Ga2O9 (La2O3:Ga2O3=2:1) as the most prominent impurity phase, irrespectiveof the method of synthesis. When the A-site is partiallysubstituted by an aliovalent ion such as strontium, other phasessuch as LaSrGaO4, are also formed. A microstructural evidenceof the formation and increasing amount of unwanted phaseswith systematic increase in the dopant concentration in theLa0.9Sr0.1Ga1−xMgxO3−δ (0.2≤x≤0.5; δ=oxygen non-stoichi-
ometry factor) system has been reported by Azad and Er [40],where the formulations were shown to have undergone drasticmicrostructural changes in the sintered bodies both in terms ofthe morphological features and abnormal grain growth. Theseimpurity phases which are either semiconducting or insulatingin nature, tend to disappear (via reaction) at higher tempera-tures. However, if their residual concentration is appreciable, itwould have a direct and undesirable influence on theconductivity of the electrolyte composition.
A clear understanding of the reaction pathways leading to theimpurity phases would certainly provide a mechanism tosuppress their formation to begin with. With this aim the studyreported in this communication, using pure lanthanum ortho-gallate as the model system and that on the A- and B-sitesubstituted formulations was undertaken. In order to avoid the
Fig. 1. Systematic progress (L to R) of gel formation leading to exothermic combustion and ceramic phase formation from the metal nitrate–glycine precursor solutionat ∼ 200 °C.
1477A.-M. Azad et al. / Solid State Ionics 178 (2007) 1476–1486

Author's personal copy
use of extreme processing conditions, which generally lead toimpure materials, the materials were synthesized by a soft-chemistry route, viz., the metal nitrate–glycine combustiontechnique. The as-combusted and the processed powders werethoroughly characterized by simultaneous TG-DSC (thermo-gravimetry-differential scanning calorimetry), XRD (X-raydiffraction), laser-Raman spectroscopy and density measure-ments. The morphological features in the calcined powders andthe sintered compacts were ascertained by scanning electronmicroscopy (SEM), while the technique of ICP-MS was em-
ployed for the compositional analyses. Electrical conductivityof the sintered bodies was measured by the 4-point DC and ACimpedance techniques.
2. Experimental
Lanthanum nitrate (La(NO3)3·6H2O, purity 99.9%), galliumnitrate (Ga(NO)3)3·xH2O; x=7.7–9.6, purity 99.999%), stron-tium nitrate (Sr(NO3)2, purity 99.999%), lithium nitrate (Li(NO3),purity 99.999%), glycine (CH2NH2COOH, purity 98.5+%) from
Fig. 2. Simultaneous TG-DSC scans of the as-combusted gel.
Fig. 3. XRD signature of the as-combusted gel and the combusted powder after calcination at 700 °C/4 h in air.
1478 A.-M. Azad et al. / Solid State Ionics 178 (2007) 1476–1486
Author's personal copy
Alfa-Aesar, and ammonium nitrate (NH4NO3, purity 99.3%)from Fischer Scientific, were used as the starting material for thesynthesis of pure (xSr, xLi=0) and doped (xSr=0.10 and yLi=0.05and 0.01) lanthanum orthogallate utilizing the followingcombustion reactions:
9½LaðNO3Þ3d6H2O� þ 9½GaðNO3Þ3d9:6H2O�þ 32CH2NH2COOH þ 9NH4NO3→9LaGaO3
þ 238:4H2O þ 64CO2 þ 52N2 ð1Þ
0:9½LaðNO3Þ3d6H2O� þ 0:1SrðNO3Þ2þ 0:95½GaðNO3Þ3d7:7H2O� þ 0:05LiNO3
þ ð13=4ÞCH2NH2COOHþ ð1=8ÞNH4NO3→La0:9Sr0:1Ga0:95Li0:05O2:9
þ ð67=8ÞH2O þ 12:715H2O þ ð13=2ÞCO2
þ ð9:3=2ÞN2 ð2Þ
0:9½LaðNO3Þ3d6H2O� þ 0:1SrðNO3Þ2þ 0:9½GaðNO3Þ3d7:7H2O� þ 0:1LiNO3
þ ð13=4ÞCH2NH2COOHþ ð3=8ÞNH4NO3→La0:9Sr0:1Ga0:9Li0:1O2:85
þ ð71=8ÞH2O þ 12:33H2O þ ð13=2ÞCO2
þ ð9:7=2ÞN2 ð3Þ
As can be seen, the stoichiometry was so chosen that theamount of ammonium nitrate was minimized and that all thebyproducts were gaseous water, carbon dioxide and nitrogen.Glycine was used a fuel for the combustion reaction whileammonium nitrate served as the initiator/igniter.
Appropriate amounts of the chemicals were weighed anddissolved separately in minimum amount of de-ionized water bygentle but constant stirring for 1 h. The clear solutions werecombined and further stirred for additional 1 h to ensure athorough and homogenous mixing of all the constituents on an
ionic level. The solution (in 40 mL aliquots) was placed in a1000 mL capacity beaker and heated gradually on a hotplate upto∼ 200 °C (2°/min) in a fume hood. Aluminum foil in the formof a snuggly fitting long hollow cylinder was fitted at the openend of the beaker in order to avoid/minimize the loss of solidmaterial from getting airborne due to the reactive exothermiccombustion. As the water evaporation in the mixture nearedcompletion, the solution turned brownish, became a viscous,and somewhat frothy gel which finally combusted into visibleflames, releasing copious amount of gases as per the reactionsshown above. After the combustion was complete, the resultinglight, dry and fluffy powder was collected and crushed in amortar and pestle, ball-milled for 1 h followed by sievingthrough a 325 mesh.
A portion of the as-combusted powder was used for analysisby TG-DSC, XRD and Raman spectroscopy, while the largerportion was calcined in a range of temperatures to examine thesystematic evolution of phase structure and their crystallinity
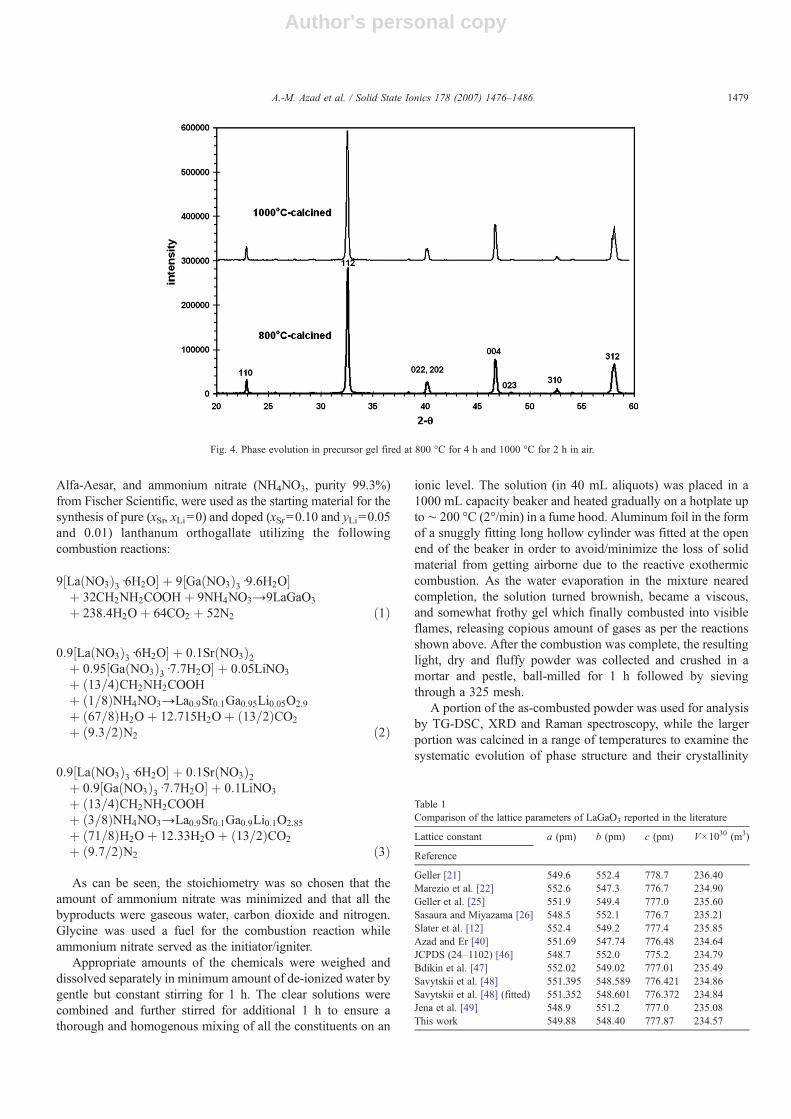
Fig. 4. Phase evolution in precursor gel fired at 800 °C for 4 h and 1000 °C for 2 h in air.
Table 1Comparison of the lattice parameters of LaGaO3 reported in the literature
Lattice constant a (pm) b (pm) c (pm) V×1030 (m3)
Reference
Geller [21] 549.6 552.4 778.7 236.40Marezio et al. [22] 552.6 547.3 776.7 234.90Geller et al. [25] 551.9 549.4 777.0 235.60Sasaura and Miyazama [26] 548.5 552.1 776.7 235.21Slater et al. [12] 552.4 549.2 777.4 235.85Azad and Er [40] 551.69 547.74 776.48 234.64JCPDS (24–1102) [46] 548.7 552.0 775.2 234.79Bdikin et al. [47] 552.02 549.02 777.01 235.49Savytskii et al. [48] 551.395 548.589 776.421 234.86Savytskii et al. [48] (fitted) 551.352 548.601 776.372 234.84Jena et al. [49] 548.9 551.2 777.0 235.08This work 549.88 548.40 777.87 234.57
1479A.-M. Azad et al. / Solid State Ionics 178 (2007) 1476–1486

Author's personal copy
via powder X-ray diffraction. Phase identification was carriedout by power X-ray diffraction on a Scintag 2000 machine atroom temperature, in the range of 20–60° (2–θ) at a scan rate of1° min−1, using monochromatic CuKα1 (λ=1.5406 Å) radia-tions and Ni filter. The X-ray data were used to derive the latticeparameters and unit cell volume. The as-combusted gel andthe calcined samples were subjected to Raman spectroscopicmeasurement to discern the presence/absence of any functionalgroups and the carbon impurities in the ceramic powders. Thepowder density measurements were carried out on an AccuPyc
1330 Automatic Gas Pycnometer (Micromeritics, Norcross,GA, USA) and the morphological features in the as-combustedand calcined powders as well as those in the sintered bodieswere ascertained by scanning electron microscopy (PhilipsXL30 SEM). The calcined material was crushed, homogenizedby thorough mixing, mixed with small amount of aqueoussolution of polyvinyl alcohol (PVA) as binder and pressedinto pellets by uniaxial pressing with a force of 6000 lb followedby cold isostatic pressing at 25,000 psi. The pellets weresintered in air at 1450 °C for 2 h. The density of the sintered
Fig. 5. Systematic variation of crystallographic density of REGaO3 for La to Lu (○) [26]; ♦ is the density value computed from X-ray data and▴ is the pycnometricpowder density of LaGaO3 measured experimentally in this work.
Fig. 6. Room temperature Raman spectra of the as-combusted gel and the samples fired at 800 °C/4 h and 1000 °C/2 h.
1480 A.-M. Azad et al. / Solid State Ionics 178 (2007) 1476–1486

Author's personal copy
bodies was measured by Archimedes principle using a Mettlerkit. The 4-point DC conductivity measurements were carriedout on rectangular bars cut from sintered discs using an Agilent34401A digital multimeter, while the AC impedance datawere collected on the sintered pellets using a Solartron 1260impedance analyzer in the frequency range of 10−3 Hz to106 Hz.
3. Results and discussion
3.1. Pure lanthanum orthogallate (LaGaO3)
The chronological progress of the organometallic nitrate–glycine complex through the stages of solution, gelation andcombustion is shown in Fig. 1.
Fig. 7. Morphological features in the as-combusted gel of the glycine–nitrate precursor (top) and the gel fired at 800 °C/4 h (bottom left) and 1000 °C/2 h (bottomright).
Fig. 8. Comparative XRD patterns of the 5 mol% Li-doped-lanthanum orthogallate powders calcined at different temperature; as prep: as-combusted gel, 8004:calcined at 800 °C/4 h, 9002: calcined at 900 °C/2 h, and 9008: calcined at 900 °C/8 h.
1481A.-M. Azad et al. / Solid State Ionics 178 (2007) 1476–1486

Author's personal copy
A simultaneous TG-DSC scan on the as-combusted gelcollected on a simultaneous thermal analyzer (TA Instruments,Model SDT Q600) in air at a heating rate of 10°/min is shownin Fig. 2. Though the sample continued to lose weight up toabout ∼ 1200 °C, the overall weight loss in the entiretemperature range is only about ∼ 3%. Moreover, the DSCprofile shows very small heat changes. Therefore, the observedweight changes are mostly the loss of moisture or that ofadsorbed gases from the combustion reaction Eq. (1) in thelower temperature regime and are not accompanied by anysignificant decomposition, compound formation or phasetransformation. This indicates that the combustion reaction at∼ 200 °C was complete and did lead to the formation of thelanthanum orthogallate as a dominant phase with no discern-able remnant of the undecomposed glycine complex in thecombusted gel.
This conclusion is strengthened by the XRD patternscollected on the as-combusted gel as well as on the powdersfired at 700 °C for 4 h, shown in Fig. 3. For the readyidentification, peaks belonging to the target phase have beenindexed. It can be seen that LaGaO3 is formed as a majorityphase even in the as-combusted powder. The un-indexed peakswere identified as those belonging to lanthanum oxide andgallium oxide which are noticeably present even in the powdercalcined at 700 °C for 4 h.
Based on these results and in order to discern the heattreatment that would lead to phase-pure LaGaO3, small portionsof the powder from combusted gel were fired for 4 h at 800 and900 °C and for 2 h at 1000 °C. The XRD patterns of the powderscalcined at 800 and 1000 °C are shown in Fig. 4.
It is evident that lanthanum orthogallate of extremely highphase purity could be derived by firing the as-combusted
Fig. 9. Comparative XRD patterns of the 10 mol% Li-doped-lanthanum orthogallate powders calcined at different temperature; as prep: as-combusted gel, 8002:calcined at 800 °C/2 h, 8004: calcined at 800 °C/4 h, 9002: calcined at 900 °C/2 h and, 9004: calcined at 900 °C/4 h.
Fig. 10. SEM images of the LSGL1 powders: (left) as-combusted gel, and (right) calcined at 900 °C/8 h.
1482 A.-M. Azad et al. / Solid State Ionics 178 (2007) 1476–1486

Author's personal copy
precursor to as low a temperature as 800 °C for 4 h. There was nochange in the XRD signature of the powders fired at temperatureshigher than 800 °C, as seen from Fig. 4. This is in an obvious andadvantageous contrast to the traditional ceramic processing routeof ‘heat-and-beat’, where the powder mixtures are required to beheated several times at much higher temperatures with multipleintermittent grinding and homogenization. Even the precursorsderived via co-precipitation, such as mixed oxalate, ought to becalcined at relativelymuch higher temperatures than reported herein order to obtain the target compound with such a high purity.Similar solution–combustion-synthesis scheme has beenemployed by several groups in the past for the preparation ofperovskite-based systems [41–44].
The XRD data on the powders calcined at 800 °C and abovewere used to determine the lattice parameters of the unit cell ofthe LaGaO3 synthesized in this work and are given as:a= 549.881(2) × 10−12 m, b= 548.400(0) × 10−12 m andc=777.872(0)×10−12 m. From these, the unit cell volumewas computed as 234.571×10⁻³⁰ m3 [45]. These values areshown in Table 1 along with those reported by other investigators,for ready comparison.
As can be seen from Table 1, there is a total consensus aboutthe crystal structure and lattice parameters of lanthanumorthogallate, though there are some reported disagreementsregarding those of the doped-LaGaO3 phase.
Surprisingly, there is no data reported in the literature on thedensity of LaGaO3 powder. Geller [21] has listed a value of7.21 g cm−3 for the X-ray density of LaGaO3, presumably forthe single crystal sample. Based on the reported crystallographicdata on rare-earth orthogallates (REGaO3, where RE=La to Lu)[22], their theoretical densities were calculated by using therelationship:
qðgcm�3Þ ¼ Z �MWðg=molÞN0ð=molÞ � Vcðcm3Þ ð5Þ
where Z=coordination number (= 4) for perovskite belongingto the space group Pbnm, N0 = Avagadro's number(= 6.023×10²³/mol), and Vc=unit cell volume.
A plot of X-ray density thus calculated vs. atomic number ofthe rare-earth element in the orthogallate is found to be linearand is shown in Fig. 5.
Using the unit cell volume computed in the present work(and listed in Table 1), a density of 7.27 g cm−3 was obtainedwhich is in excellent agreement with 7.21 g cm−3 [21] and7.26 g cm−3 [48]. The density of the calcined powderwas measured in a pycnometric setup and was found to be7.18 g cm−3, again in excellent agreement with the calculatedcrystallographic data. Jena et al. [49], on the other hand,synthesized LaGaO3 by the co-precipitation of metal hydroxideswhich reportedly formed a ‘distorted cubic’ (orthorhombic)single phase only above 1350 °C; they classify LaGaO3
‘sintered’ for 5 h at 1000 and 1200 °C as cubic with the latticeparameter a=3.8784(1)Å. The density values quoted by theseauthors vary from 4.558 to 5.041 to 6.378 g cm−3 at 1000 °C,1200 °C and 1350 °C, respectively. In the light of the powderdensity measured in the present work that compares well withthose computed from single crystal lattice data, it appears thatthe samples of Jena et al. [49] are significantly porous; forexample, the sintered density at 1350 °C is ∼ 89% theoretical.The impact of such high porosity on the electrical conductivitydata of the doped materials will be discussed subsequently.
Fig. 6 shows the Raman spectra (LabRam, Jobin-YvonHoriba Inc., using 633 nm excitation laser; wave number range:200–4000 cm−1) collected on the samples calcined at 800 °C/4 h and 1000 °C/2 h along with the spectrum on as-combustedgel.
The Raman signatures of the two calcined samples areidentical indicating that the chemical states and compositions ofthe end products are one and the same. On the other hand, whilethe as-combusted gel also has some characteristics peakscommon with those in the fired samples (albeit of lowerintensity), presence of additional peaks points out that there areimpurity phases present at this stage. It should be pointed out
Fig. 11. Scanning electron micrograph of the LSGL2 powder calcined at 900 °C/8 h.
Fig. 12. XRD patterns of the LSGL samples sintered at 1450 °C/2 h.
Table 2Cell constants, volume and density of the pure and doped compositions
Parameter LG LSGL1 LSGL2
a 5.524 5.543 5.543b 5.492 5.516 5.516c 7.774 7.821 7.821Volume 235.85 239.13 239.13ρ (g/cm3) 7.226 6.853 6.744
1483A.-M. Azad et al. / Solid State Ionics 178 (2007) 1476–1486

Author's personal copy
that in the lower wavenumber regime (b 1000 cm−1 and notshown here) the Raman excitations typical of lanthanum oxide[50,51] or gallium oxide [52–54], were totally absent in thefired samples. These experimental findings corroborate theobservation made in the light of X-ray diffraction resultsdiscussed above.
The morphological features of lanthanum orthogallate inthe as-combusted gel are shown in Fig. 7 (top) and those ofthe fired samples in Fig. 7 (bottom). Submicron particles withuniform and narrow particle size distribution can be clearlyseen in the agglomerates.
3.2. Li-doped-lanthanum orthogallate (La0.9Sr0.1Ga1−yLiyO3−δ)
The XRD patterns of La0.9Sr0.1Ga0.95Li0.05O2.90 (LSGL1)and La0.9Sr0.1Ga0.90Li0.10O2.85 (LSGL2) powders calcined at800 and 900 °C for different duration are compared with thoseof the as-combusted gels in Figs. 8 and 9, respectively.
A careful analysis of the diffraction pattern collected on theas-combusted gel revealed the formation of the targeted phase
along with La4Ga2O9. Thus, it appears that the formation of thisphase is inevitable when working with doped-lanthanum gallatesystem as reported by others [54–56]. Furthermore, Li2CO3 wasalso detected (in addition to La4Ga2O9) in the calcined powderswhose concentration (in terms of peak intensity) increasedmonotonically as lithium doping increased. The analysis of thediffractograms shown in Figs. 8 and 9 further suggests that theamount of the target phase in calcined samples increasedprogressively, compared to that in the as-prepared samples.
The SEM images shown in Fig. 10 compare the morpho-logical features of the as-combusted LSGL1 gel with those incalcined powder. These micrographs show that the particle sizein the material derived via soft-chemistry route is much smallercompared to that generally seen in the solid-state reaction-derived samples. Also, the particle size distribution is narrow(varying between 200 to 500 nm). Hence, the nitrate–glycinegel route offers a clear advantage over the solid-state reactionwhich requires calcination at much higher temperatures thanemployed hitherto. The morphological features of the calcinedLSGL2 powders are shown in Fig. 11.
The XRD signatures of the sintered bodies are shown inFig. 12.
A comparison of the diffractograms shown in Fig. 12, withthose for the calcined samples shown earlier, reveals that theexpected phase purity in the sintered samples was achieved witha small amount of the impurity phase (La4Ga2O9). Thediffraction data was used to determine the cell constants andthe unit cell volume of the doped formulations, which are givenin Table 2 along with those of pure lanthanum orthogallate.
The calculations show that the cell parameters remainunaltered up to a Li-doping of 10 mol%; however, the density
Fig. 13. SEM images of the sintered (1450 °C/2 h) LSGL1 pellet; left: surface and right: fractured (unpolished) cross-section.
Fig. 14. Temperature dependence of conductivity for the sintered LSGL1 andLSGL2 in the temperature range 450–850 °C; solid symbols represent 4-pointDC measurements and open symbols represent the impedance data. Forcomparison, Arrhenius plots for YSZ (this work), La0.9Sr0.05Ga0.8Li0.01O3−δ
[49] and several representative Mg-doped-LaGaO3 formulations are alsoincluded.
Table 3ICP-MS results (in ppm) on the LSGL compositions
Treatment Sample La Sr Ga Li
As-prepared LSGL1 96 6.992 50.73 0.1326LSGL2 95.72 6.997 48.99 0.4192
Calcined LSGL1 99.27 7.238 53.06 0.0837LSGL2 99.7 7.265 50.84 0.3631
Sintered LSGL1 97.08 7.135 51.43 0.0047LSGL2 93.24 7.025 46.66 0.022
1484 A.-M. Azad et al. / Solid State Ionics 178 (2007) 1476–1486

Author's personal copy
showed a monotonic decrease. These observations should besubstantiated in the light of other characterizations, such asmicrostructural, chemical and electrical measurements.
The electron micrographs collected on the sintered samplesshow the material possessing rather small (≤ 1 μm) grains, asseen from Fig. 13. In order to assess the uniformity ofdensification in the bulk of the samples, images were alsocollected on the fractured (but unpolished) surfaces as well.
Solid electrolytes for use as oxide ion membranes in SOFCsare required to have a fully dense microstructure. The presenceof pores in the structure and the impurity phase, if present, willreflect on the conductivity of these formulations. Fig. 14 showsthe conductivity of the two doped compositions, measured byusing 4-point as well as the impedance technique.
The activation energy calculated from the Arrhenius plots(σT=Aexp Ea
T
� �) are 1.11, 0.74, 0.76, and 0.86 eV, for YSZ,
La0.9Sr0.1Ga0.95Li0.05O2.9 (LSGL1) La0.9Sr0.1Ga0.90Li0.10O2.85
(LSGL2) and La0.9Sr0.05Ga0.8Li0.01O3−δ, respectively. Theconductivity of the LSGL1 and LSGL2 is seen to decreasewith increasing Li concentration. This is contrary to theexpected trend, since the conductivity should ideally increasewith the level of B-site substitution by an aliovalent ion byvirtue of increase in the oxygen ion vacancies. The comparativeArrhenius plots also show that both the compositions (LSGL1and LSGL2) have better conductivity than YSZ up to 650 °C.However, when compared with the much studied Mg-doped-lanthanum gallate compositions, the conductivity of evenLSGL1 is about an order of magnitude lower [57]. This is infundamental contradiction with the theoretical predictions of thedefect equilibria that monovalently doped-lanthanum gallatewould have superior conductivity than the divalently dopedanalog due to the higher concentration of oxygen ion vacanciesin the former. Among all, the conductivity reported by Jena etal. [49] on La0.9Sr0.05Ga0.8Li0.01O3−δ is the most inferior. Assuch, it is rather difficult to justify the stoichiometry of thissample, since the material balance at both A- and B-sites cannotbe justified unless the composition is cation-deficient at both A-and B-sites. The authors [49], however, do not shed any light onthis aspect. Furthermore, as stated above, the sample wassintered at 1350 °C and achieved a density of∼ 89% theoretical.Thus, the inferior conductivity observed by Jena et al. [49]could be an artifact of significant porosity in conjunction withrather low level of lithium dopant concentration.
In order to understand the observed anomaly in themeasured conductivity data, a thorough and systematic com-positional analysis of the powder and the sintered samples is
warranted. For that purpose, the as-prepared, calcined andsintered samples were analyzed using inductively coupledplasma-mass spectrometry (ICP-MS) and the results are pre-sented in Table 3.
The compositional analysis of the as-prepared and thecalcined powder samples show that the composition of all themetallic constituents are in the expected range within the limitsof experimental errors except for Li. The amount of Lidecreased from that in the as-prepared to the calcined powdersand further in the sintered bodies. It is reasonable to speculatethat as far as lithium is concerned, the good agreement amongthe expected values and those in the as-prepared and calcinedpowders is due to the fact that lithium was present in the lattersamples albeit as Li2CO3. It may be recalled that this wasevidenced in the XRD signatures of all the calcined samples.Giving the cognizance to the fact that Li2CO3 melts at 723 °Cand boils at 1310 °C, it is likely to have escaped during sinteringbefore in lieu of being incorporated completely into thestructure of lanthanum gallate. This theory is corroborated bythe lower than expected density values in the calcined powdersand sintered bodies. As seen from Table 4, the low densityvalues of the as-prepared and the calcined powders are due tothe presence of the impurity phases such as La4Ga2O9 andLi2CO3. The effect of the presence of Li2CO3 is morepronounced in the as-combusted and calcined powders becauseof its lower density (2.11 g/cm3). The density of the sinteredbodies is significantly lower than the theoretical values (shownwithin parentheses, derived from XRD data) and could beexplained due to the aforementioned loss of lithium at hightemperatures leading to the presence of pores seen in the elec-tron micrographs shown above.
These density values together with the microstructuralartifacts and compositional analyses corroborate the unexpect-edly somewhat inferior conductivity of the Li-doped-LaGaO3.
4. Conclusions
High phase purity undoped and Li-doped-lanthanum ortho-gallate have been prepared by a soft-chemistry route employingthe nitrate–glycine combustion of the precursor solution at∼ 200 °C. The formation of the target compound was evidenteven in the as-combusted gel. Systematic heat treatment of thegel in the temperature range of 700–1000 °C followed by XRDand Raman spectroscopy on the fired samples revealed thatsingle-step calcination at 800–900 °C for 4 h is adequate toyield the desired perovskite. The 4-point DC and AC impedancemeasurements in the temperature range of 550–850 °C showedthat the conductivity of the Li-doped-LaGaO3 was higher thanthat of yttria-stabilized zirconia up to 650 °C, but lower than thatof the Mg-doped analogs. Corroboration based on the XRD,SEM and ICP-MS analyses suggests that loss of lithium in thesintered samples is the likely cause of this anomaly.
Acknowledgments
The authors wish to thank Drs. Chris Caspers and BillWalker of Federal-Mogul (Toledo) for assisting with the use of
Table 4Density values of the La0.9Sr0.1Ga1−yLiyO3−δ powders and sintered bodies
Sample Treatment Density (g/cc)
LSGL1 As-prepared 5.8308Calcined 5.2025Sintered 5.726 (6.853)
LSGL2 As-prepared 5.2629Calcined 4.8370Sintered 5.5085 (6.7436)
1485A.-M. Azad et al. / Solid State Ionics 178 (2007) 1476–1486

Author's personal copy
the cold isostatic press and the simultaneous thermal analyzer attheir facility.
References
[1] N.Q. Minh, T. Takahashi, Science and Technology of Ceramic Fuel Cells,Elsevier, Amsterdam, 1995.
[2] J.P.P. Huijsmans, F.P.F. Berkel, G.M. Christie, J. Power Sources 71 (1998)107.
[3] www.fetc/government/publications/proceedings.[4] www.epri.com/srd/sofc/index.html.[5] V.S. Bagotsky, N.V. Osetrova, A.M. Skundin, Russ. J. Electrochem. 39
(2003) 919.[6] S. Elangovan, S. Balagopal, J. Hartvigsen, M. Timper, D. Larsen, SECA
Core Technology Program Review Meeting, Tampa, FL, January 27 2005.[7] A.-M. Azad, R. Sudha, O.M. Sreedharan, Mater. Res. Bull. 29 (1991) 97.[8] T. Ishihara, H. Matsuda, Y. Takita, J. Am. Chem. Soc. 116 (1994) 3801.[9] T. Ishihara, H. Matsuda, Y. Takita, Solid State Ion. 79 (1995) 147.[10] T. Ishihara, H. Matsuda, M.A. Bustam, Y. Takita, Solid State Ion. 86–88
(1996) 197.[11] P.N. Huang, A. Petric, J. Electrochem. Soc. 143 (1996) 1644.[12] P.R. Slater, J.T.S. Irvine, T. Ishihara, Y. Takita, J. Solid State Chem. 139
(1998) 135.[13] K. Huang, R.S. Trichy, J.B. Goodenough, J. Am. Ceram. Soc. 81 (1998)
2568.[14] K. Huang, R.S. Trichy, J.B. Goodenough, J. Am. Ceram. Soc. 81 (1998)
2576.[15] K. Huang, M. Feng, J.B. Goodenough, J. Am. Ceram. Soc. 79 (1996)
1100.[16] M. Feng, J.B. Goodenough, K. Huang, C. Milliken, J. Power Sources 63
(1996) 47.[17] T.L. Nguyen, M. Dokiya, Solid State Ion. 132 (2000) 217.[18] K. Yamaji, T. Horita, M. Ishikawa, N. Sakai, H. Yokokawa, Solid State Ion.
108 (1998) 415.[19] K. Kuroda, I. Hashimoto, K. Adachi, J. Akikusa, Y. Tamou, N. Komada, T.
Ishihara, Y. Takita, Solid State Ion. 132 (2000) 199.[20] J. Kim, H. Yoo, Solid State Ion. 140 (2001) 105.[21] S. Geller, Acta Crystallogr. 10 (1957) 243.[22] M. Marezio, J.P. Remika, P.D. Dernier, Mater. Res. Bull. 1 (1966) 247.[23] P.D. Dernier, P.G. Maines, Inorg. Mater. 7 (1968) 1337.[24] P.D. Dernier, P.G. Maines, Mater. Res. Bull. 6 (1971) 433.[25] S. Geller, P.J. Curlander, G.F. Ruse, Mater. Res. Bull. 9 (1974) 637.[26] M. Sasaura, S. Miyazama, Defect Diffus. Forum 150–151 (1997) 35.[27] T. Ishihara, Y. Tsurata, Y. Chunying, T. Todaka, H. Nishiguchi, Y. Takita,
J. Electrochem. Soc. 150 (2003) E17.[28] A.A. Yaremachenko, A.L. Shaula, D.I. Logovinovich, V.V. Kharton, A.V.
Kovakusky, E.N. Naumovich, J.R. Frade, F.M.B. Marques, Mater. Chem.Phys. 82 (2003) 684.
[29] R.T. Baker, B. Gharbage, F.M.B. Marques, J. Eur. Ceram. Soc. 18 (1998)105.
[30] A. Chandrasekaran, A.-M. Azad, J. Mater. Sci. 36 (2001) 4745.[31] V.V. Kharton, A.P. Viskup, A.A. Yaremachenko, R.T. Baker, B. Gharbage,
G.C. Mather, F.M. Figueiredo, E.N. Naumovich, F.M.B. Marques, SolidState Ion. 132 (2000) 119.
[32] A.C. Tas, P.J. Majewski, F. Aldinger, J. Am. Ceram. Soc. 83 (2000) 2954.[33] X. Zhang, S. Ohara, H. Okawa, R. Maric, T. Fukui, Solid State Ion. 139
(2001) 145.[34] N.M. Sammes, G.A. Tompsett, R.J. Philips, A.M. Cartner, Solid State Ion.
111 (1998) 1.[35] W. Ryba-Romanoski, S. Golab, G. Dominiak-Dzik, I. Sokolska, M.
Berkowski, in: A. Majchrowski, J. Zielinski (Eds.), Proceedings of SPIE,International Conference on Solid State Crystals' 98 — Single CrystalGrowth, Characterization and Applications, vol. 3724, 1999, p. 43.
[36] K. Huang, J. Wan, J.B. Goodenough, J. Electrochem. Soc. 148 (2001)A788.
[37] K. Huang, M. Feng, J.B. Goodenough, M. Schemerling, J. Electrochem.Soc. 143 (1996) 3630.
[38] T.J. Armstrong, A.V. Virkar, J. Electrochem. Soc. 149 (2002) 1565.[39] X.Q. Ma, S. Hui, H. Zhang, J. Dai, J. Roth, T.D. Xiao, D.E. Reisner, in: C.
Moreau, B. Marpie (Eds.), Proceedings of Thermal Spray 2003 —Advancing the Science and Applying the Technology, ASM International,Materials Park, OH, USA, 2003, p. 163.
[40] A.-M. Azad, L.F. Er, J. Alloys Compd. 306 (2000) 103.[41] J.J. Kingsley, K. Suresh, K.C. Patil, J. Solid State Chem. 87 (1990) 435.[42] Y. Zhang, G.C. Stangle, J. Mater. Res. 9 (1994) 1997.[43] J. McKittrika, L.E. Sheab, C.F. Bacalskia, E.J. Boszea, Displays 19 (1999)
169.[44] A. Civera, M. Pavese, G. Saracco, V. Specchia, Catal. Today 83 (2003)
199.[45] B.D. Cullity, Elements of X-ray Diffraction, 2nd ed., Addison-Wesley,
Reading, MA, 1978.[46] International Center for Diffraction Data, JCPDS Card # 24-1102.[47] I.L. Bdikin, I.M. Shmyt'ko, A.M. Balbashov, A.V. Kazansky, J. Appl.
Crystallogr. 26 (1993) 71.[48] D. Savytskii, L. Vashylechko, A. Senyshyn, A. Matkovskii, C. Bähtz, M.L.
Sanjuan, U. Bismayer, M. Berkowski, Phys. Rev., B 68 (2003) 024101.[49] H. Jena, K.V.G. Kutty, T.R.N. Kutty, Mater. Sci. Eng., B 113 (2004) 30.[50] G. Burns, F.H. Dacol, Phys. Rev., B 41 (1990) 4747.[51] J.H. Denning, S.D. Ross, J. Phys. C. Solid State Phys. 5 (1972) 1123.[52] R. Beserman, S.A. Schwartz, D.M. Huang, C.Y. Chen, Phys. Rev., B 44
(1991) 3025.[53] T. Olorunyolemi, R.A. Kydd, Catal. Letters 65 (2000) 185.[54] A.C. Tas, P.J. Majeswski, F. Aldinger, J. Am. Ceram. Soc. 85 (2002) 1414.[55] P.J. Majewski, M. Rozumek, A.C. Tas, F. Aldinger, J. Electroceram.
8 (2002) 65.[56] M. Rozumek, P. Majewski, T. Maldener, F. Aldinger, Mater. Werkst. 33
(2002) 348.[57] M. Rozumek, P.J. Majewski, H. Schluckwerder, F. Aldinger, J. Am.
Ceram. Soc. 87 (2004) 1795.
1486 A.-M. Azad et al. / Solid State Ionics 178 (2007) 1476–1486